Narrative Review of New Methods for Assessing Food and Energy Intake


Abstract
:1. Introduction
2. Materials and Methods
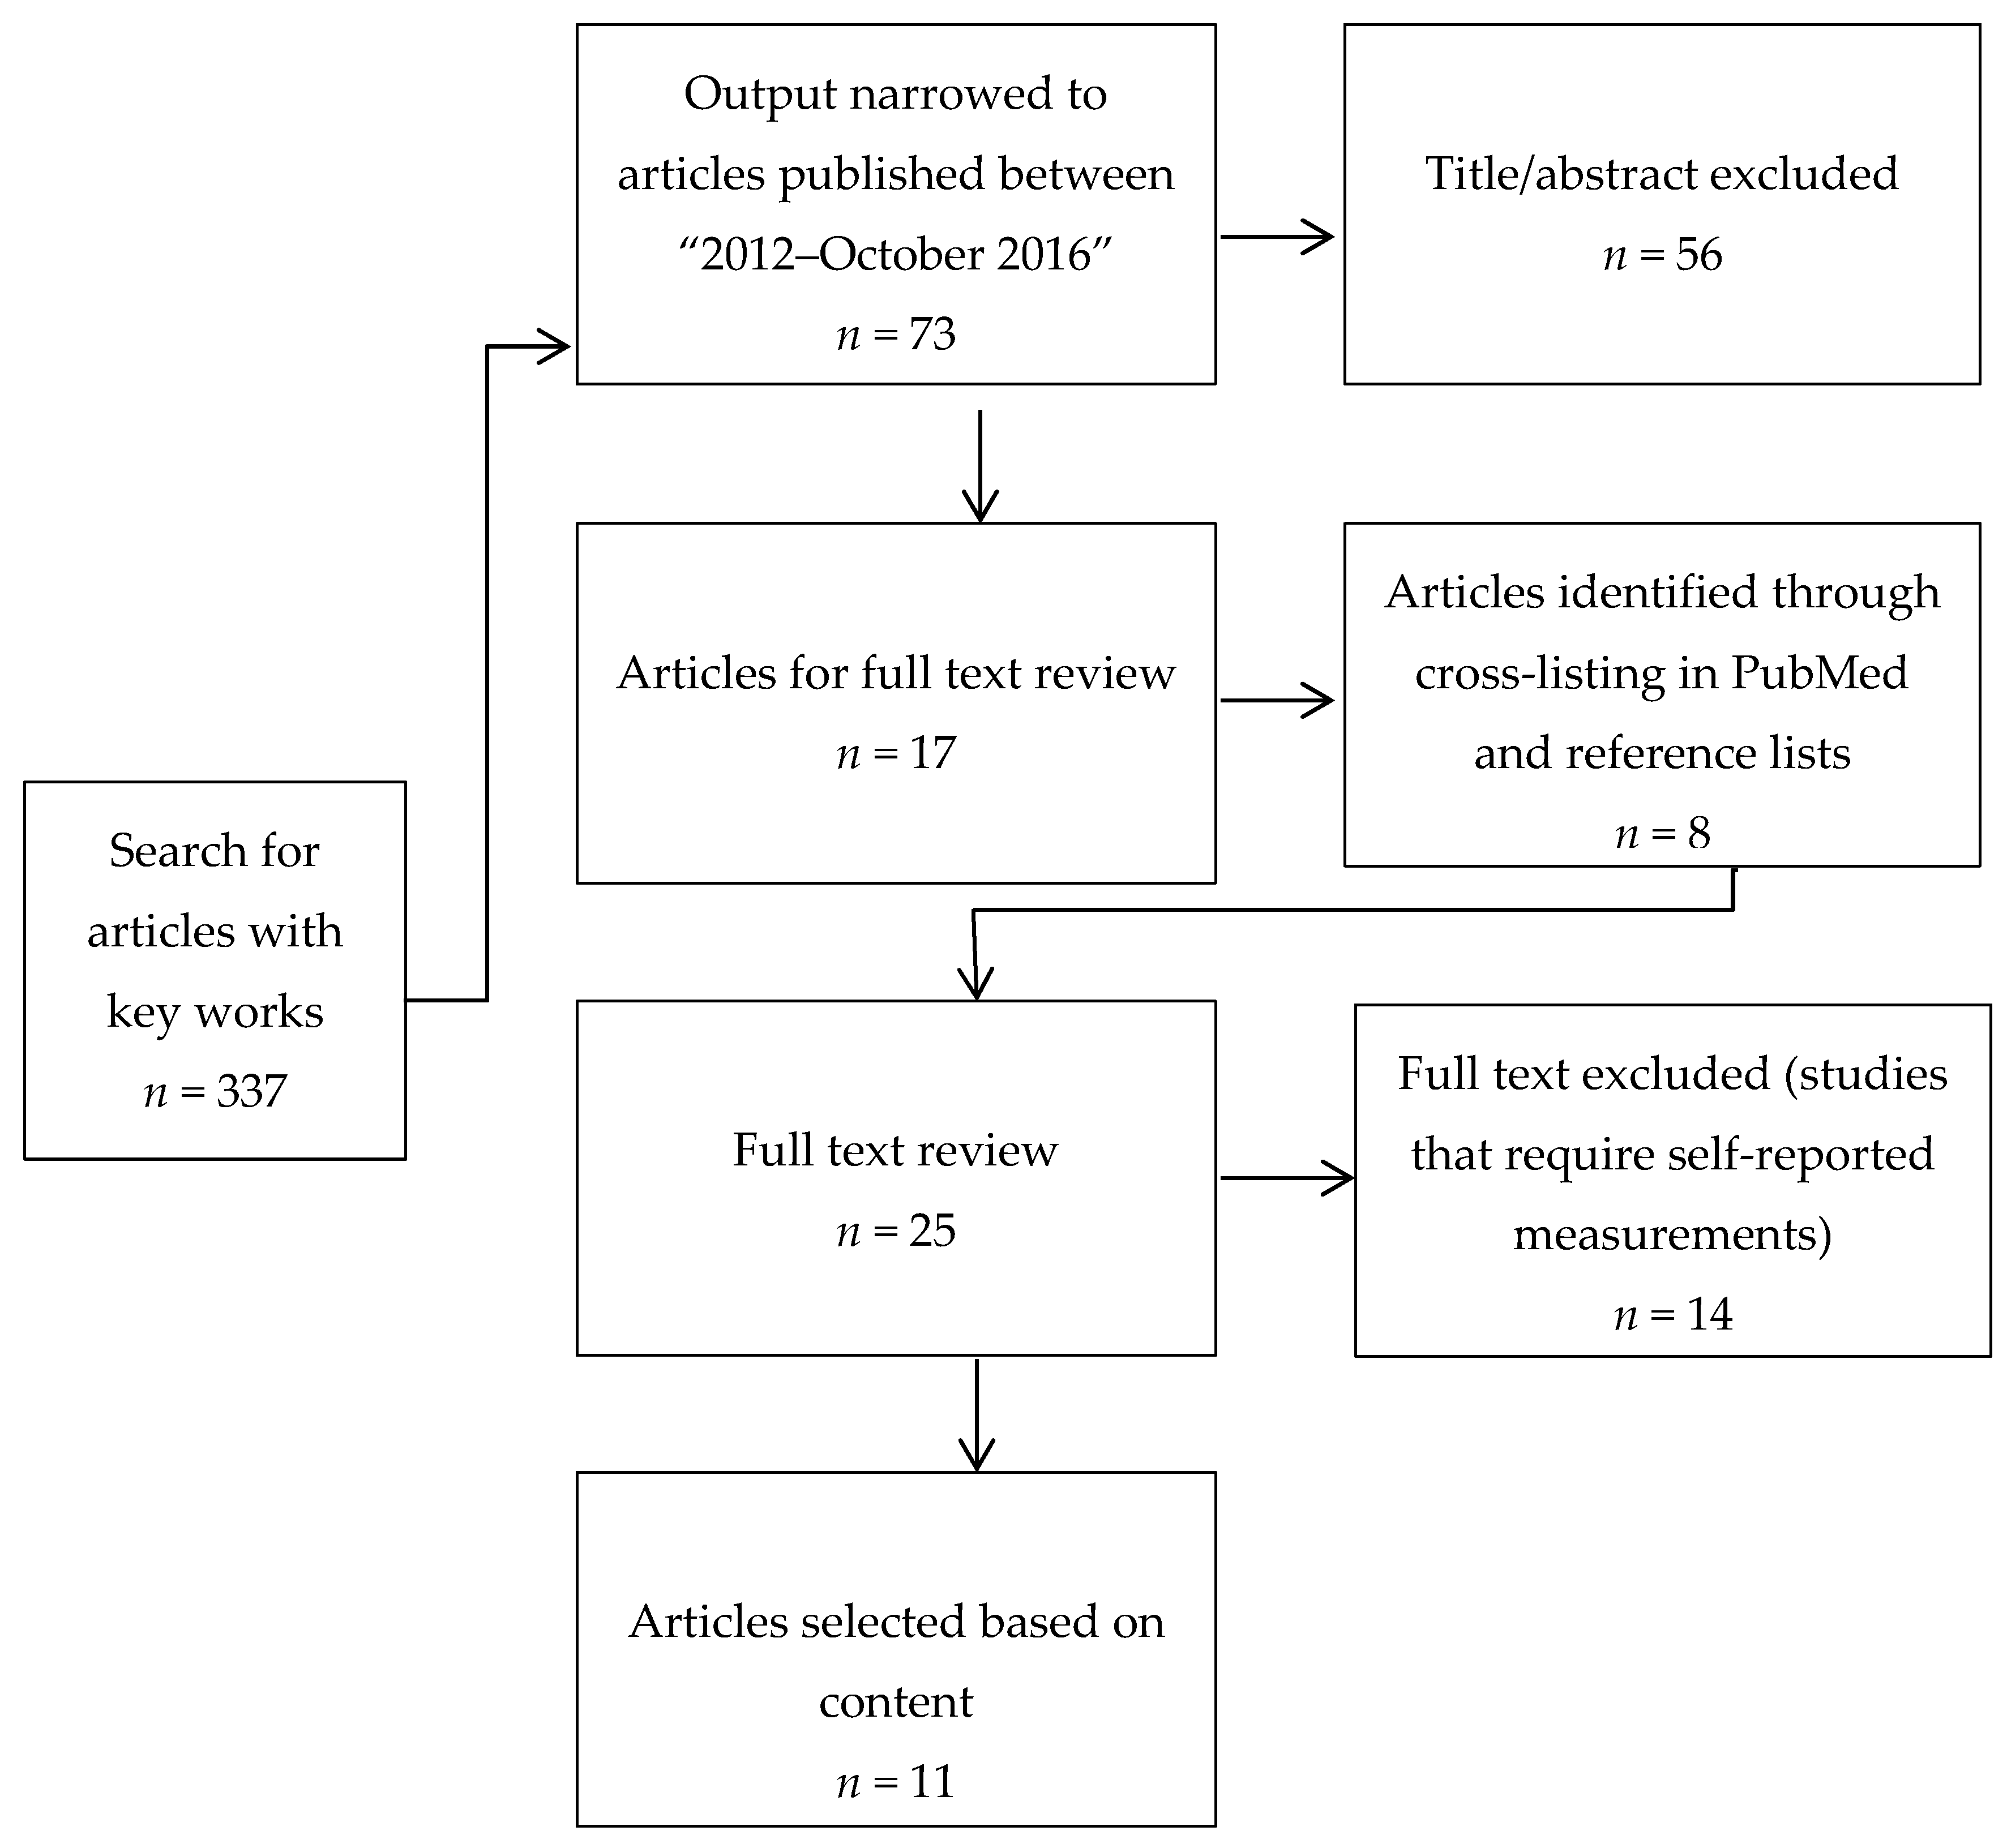
2.1. Search for Innovative Food and EI Assessment Tools and Methodologies
2.2. Evaluation
3. Results
3.1. Food/Energy Intake Monitoring Devices and Tools
3.1.1. Automated Wrist Motion Tracking
3.1.2. The Bite-Based Model of Kilocalorie Intake
3.1.3. The Automatic Ingestion Monitor (AIM)
3.1.4. Intelligent Food-Intake Monitor
3.2. Camera-Scan-Sensor Based Technologies or Food/Energy Intake Assessment Tools
3.2.1. DP + R
3.2.2. Remote Food Photography Method (RFPM)
3.2.3. Real-Time Food Recognition System
3.2.4. “Snap-n-Eat”
3.2.5. GoCARB
3.3. Mathematical Algorithm
Mathematical Method
4. Discussion
5. Conclusions
Author Contributions
Funding
Acknowledgments
Conflicts of Interest
References
- Wang, H.; Naghavi, M.; Allen, C.; Barber, R.M.; Bhutta, Z.A.; Carter, A.; Casey, D.C.; Charlson, F.J.; Chen, A.Z.; Coates, M.M.; et al. Global, regional, and national life expectancy, all-cause mortality, and cause-specific mortality for 249 causes of death, 1980–2015: A systematic analysis for the global burden of disease study 2015. Lancet 2016, 388, 1459–1544. [Google Scholar] [CrossRef] [Green Version]
- Williamson, D.A. Fifty years of behavioral/lifestyle interventions for overweight and obesity: Where have we been and where are we going? Obesity 2017, 25, 1867–1875. [Google Scholar] [CrossRef] [PubMed]
- Das, S.K.; Roberts, S.B.; Bhapkar, M.V.; Villareal, D.T.; Fontana, L.; Martin, C.K.; Racette, S.B.; Fuss, P.J.; Kraus, W.E.; Wong, W.W.; et al. Body-composition changes in the comprehensive assessment of long-term effects of reducing intake of energy (CALERIE)-2 study: A 2-y randomized controlled trial of calorie restriction in nonobese humans. Am. J. Clin. Nutr. 2017, 105, 913–927. [Google Scholar] [CrossRef] [PubMed]
- The Diabetes Prevention Program (DPP) Research Group. The Diabetes Prevention Program (DPP): Description of lifestyle intervention. Diabetes Care 2002, 25, 2165–2171. [Google Scholar] [Green Version]
- The Look AHEAD Research Group. Eight-year weight losses with an intensive lifestyle intervention: The Look AHEAD study. Obesity 2014, 22, 5–13. [Google Scholar]
- Ma, W.; Huang, T.; Zheng, Y.; Wang, M.; Bray, G.A.; Sacks, F.M.; Qi, L. Weight-loss diets, adiponectin, and changes in cardiometabolic risk in the 2-year pounds lost trial. Clin. Endocrinol. Metab. 2016, 101, 2415–2422. [Google Scholar] [CrossRef] [PubMed]
- Sharma, B.K.; Patil, M.; Satyanarayana, A. Negative regulators of brown adipose tissue (BAT)-mediated thermogenesis. J. Cell Physiol. 2014, 229, 1901–1907. [Google Scholar] [CrossRef] [PubMed]
- Ryan, D.H.; Jensen, M.D. What the new obesity guidelines will tell us. Curr. Opin. Endocrinol. Diabetes Obes. 2013, 20, 429–433. [Google Scholar] [CrossRef] [PubMed]
- Blair, S.N. Physical inactivity: The biggest public health problem of the 21st century. Br. J. Sports Med. 2009, 43, 1–2. [Google Scholar] [PubMed]
- Subar, A.F.; Freedman, L.S.; Tooze, J.A.; Kirkpatrick, S.I.; Boushey, C.; Neuhouser, M.L.; Thompson, F.E.; Potischman, N.; Guenther, P.M.; Tarasuk, V.; et al. Addressing current criticism regarding the value of self-report dietary data. J. Nutr. 2015, 145, 2639–2645. [Google Scholar] [CrossRef] [PubMed]
- Johnson, R.K. Dietary intake—How do we measure what people are really eating? Obes. Res. 2002, 10, 63S–68S. [Google Scholar] [CrossRef] [PubMed]
- Archer, E.; Pavela, G.; Lavie, C.J. The inadmissibility of what we eat in America and NHANES dietary data in nutrition and obesity research and the scientific formulation of national dietary guidelines. Mayo Clin. Proc. 2015, 90, 911–926. [Google Scholar] [CrossRef] [PubMed]
- Dhurandhar, N.V.; Schoeller, D.; Brown, A.W.; Heymsfield, S.B.; Thomas, D.; Sorensen, T.I.; Speakman, J.R.; Jeansonne, M.; Allison, D.B. Energy Balance Measurement Working Group. Energy balance measurement: When something is not better than nothing. Int. J. Obes. 2015, 39, 1109–1113. [Google Scholar] [CrossRef] [PubMed]
- Ioannidis, J.P. Implausible results in human nutrition research. BMJ 2013, 347, f6698. [Google Scholar] [CrossRef] [PubMed]
- Murakami, K.; Livingstone, M.B. Prevalence and characteristics of misreporting of energy intake in US adults: NHANES 2003–2012. J. Nutr. 2015, 114, 1294–1303. [Google Scholar] [CrossRef] [PubMed] [Green Version]
- Berta Vanrullen, I.; Volatier, J.L.; Bertaut, A.; Dufour, A.; Dallongeville, J. Characteristics of energy intake under-reporting in French adults. J. Nutr. 2014, 111, 1292–1302. [Google Scholar] [CrossRef] [PubMed]
- Gemming, L.; Jiang, Y.; Swinburn, B.; Utter, J.; Mhurchu, C.N. Under-reporting remains a key limitation of self-reported dietary intake: An analysis of the 2008/09 New Zealand adult nutrition survey. J. Clin. Nutr. 2014, 68, 259–264. [Google Scholar] [CrossRef] [PubMed]
- Murakami, K.; McCaffrey, T.A.; Livingstone, M.B. Associations of dietary glycaemic index and glycaemic load with food and nutrient intake and general and central obesity in British adults. J. Nutr. 2013, 110, 2047–2057. [Google Scholar] [CrossRef] [PubMed] [Green Version]
- Johansson, L.; Solvoll, K.; Bjorneboe, G.E.; Drevon, C.A. Under- and overreporting of energy intake related to weight status and lifestyle in a nationwide sample. Am. J. Clin. Nutr. 1998, 68, 266–274. [Google Scholar] [CrossRef] [PubMed] [Green Version]
- Basiotis, P.P.; Welsh, S.O.; Cronin, F.J.; Kelsay, J.L.; Mertz, W. Number of days of food intake records required to estimate individual and group nutrient intakes with defined confidence. J. Nutr. 1987, 117, 1638–1641. [Google Scholar] [CrossRef] [PubMed]
- Thompson, F.E.; Subar, A.F.; Loria, C.M.; Reedy, J.L.; Baranowski, T. Need for technological innovation in dietary assessment. J. Am. Diet. Assoc. 2010, 110, 48–51. [Google Scholar] [CrossRef] [PubMed]
- Bountziouka, V.; Panagiotakos, D.B. Statistical methods used for the evaluation of reliability and validity of nutrition assessment tools used in medical research. Curr. Pharm. Des. 2010, 16, 3770–3775. [Google Scholar] [CrossRef] [PubMed]
- Rebro, S.M.; Patterson, R.E.; Kristal, A.R.; Cheney, C.L. The effect of keeping food records on eating patterns. J. Am. Diet. Assoc. 1998, 98, 1163–1165. [Google Scholar] [CrossRef]
- Hise, M.E.; Sullivan, D.K.; Jacobsen, D.J.; Johnson, S.L.; Donnelly, J.E. Validation of energy intake measurements determined from observer-recorded food records and recall methods compared with the doubly labeled water method in overweight and obese individuals. Am. J. Clin. Nutr. 2002, 75, 263–267. [Google Scholar] [CrossRef] [PubMed]
- Schoeller, D.A. Measurement of energy expenditure in free-living humans by using doubly labeled water. J. Nutr. 1988, 118, 1278–1289. [Google Scholar] [CrossRef] [PubMed]
- Amft, O.; Troster, G. Recognition of dietary activity events using on-body sensors. Artif. Intell. Med. 2008, 42, 121–136. [Google Scholar] [CrossRef] [PubMed] [Green Version]
- Sazonov, E.; Schuckers, S.; Lopez-Meyer, P.; Makeyev, O.; Sazonova, N.; Melanson, E.L.; Neuman, M. Non-invasive monitoring of chewing and swallowing for objective quantification of ingestive behavior. Physiol. Meas. 2008, 29, 525–541. [Google Scholar] [CrossRef] [PubMed] [Green Version]
- Dong, Y.; Hoover, A.; Scisco, J.; Muth, E. A new method for measuring meal intake in humans via automated wrist motion tracking. Appl. Psychophysiol. Biofeedback 2012, 37, 205–215. [Google Scholar] [CrossRef] [PubMed]
- Subar, A.F.; Kipnis, V.; Troiano, R.P.; Midthune, D.; Schoeller, D.A.; Bingham, S.; Sharbaugh, C.O.; Trabulsi, J.; Runswick, S.; Ballard-Barbash, R.; et al. Using intake biomarkers to evaluate the extent of dietary misreporting in a large sample of adults: The open study. Am. J. Epidemiol. 2003, 158, 1–13. [Google Scholar] [CrossRef] [PubMed]
- Salley, J.N.; Hoover, A.W.; Wilson, M.L.; Muth, E.R. Comparison between human and bite-based methods of estimating caloric intake. J. Acad. Nutr. Diet. 2016, 116, 1568–1577. [Google Scholar] [CrossRef] [PubMed]
- Fontana, J.M.; Farooq, M.; Sazonov, E. Automatic ingestion monitor: A novel wearable device for monitoring of ingestive behavior. IEEE Trans. Biomed. Eng. 2014, 61, 1772–1779. [Google Scholar] [CrossRef] [PubMed]
- Fontana, J.M.; Higgins, J.A.; Schuckers, S.C.; Bellisle, F.; Pan, Z.; Melanson, E.L.; Neuman, M.R.; Sazonov, E. Energy intake estimation from counts of chews and swallows. Appetite 2015, 85, 14–21. [Google Scholar] [CrossRef] [PubMed] [Green Version]
- Liu, J.; Johns, E.; Atallah, L.; Pettitt, C.; Lo, B.; Frost, G.; Yang, G.-Z. An intelligent food-intake monitoring system using wearable sensors. In 2012 Ninth International Conference on Wearable and Implantable Body Sensor Networks; IEEE: London, UK, 2012; pp. 154–160. [Google Scholar]
- Ptomey, L.T.; Willis, E.A.; Honas, J.J.; Mayo, M.S.; Washburn, R.A.; Herrmann, S.D.; Sullivan, D.K.; Donnelly, J.E. Validity of energy intake estimated by digital photography plus recall in overweight and obese young adults. J. Acad. Nutr. Diet. 2015, 115, 1392–1399. [Google Scholar] [CrossRef] [PubMed]
- Martin, C.K.; Correa, J.B.; Han, H.; Allen, H.R.; Rood, J.C.; Champagne, C.M.; Gunturk, B.K.; Bray, G.A. Validity of the remote food photography method (RFPM) for estimating energy and nutrient intake in near real-time. Obesity 2012, 20, 891–899. [Google Scholar] [CrossRef] [PubMed]
- Kawano, Y.; Yanai, K. Foodcam: A real-time food recognition system on a smartphone. Multimed. Tools Appl. 2015, 74, 5263–5287. [Google Scholar] [CrossRef]
- Zhang, W.; Yu, Q.; Siddiquie, B.; Divakaran, A.; Sawhney, H. “Snap-n-eat”: Food recognition and nutrition estimation on a smartphone. J. Diabetes Sci. Technol. 2015, 9, 525–533. [Google Scholar] [CrossRef] [PubMed]
- Rhyner, D.; Loher, H.; Dehais, J.; Anthimopoulos, M.; Shevchik, S.; Botwey, R.H.; Duke, D.; Stettler, C.; Diem, P.; Mougiakakou, S. Carbohydrate estimation by a mobile phone-based system versus self-estimations of individuals with type 1 diabetes mellitus: A comparative study. J. Med. Int. Res. 2016, 18, e101. [Google Scholar] [CrossRef] [PubMed] [Green Version]
- Sanghvi, A.; Redman, L.M.; Martin, C.K.; Ravussin, E.; Hall, K.D. Validation of an inexpensive and accurate mathematical method to measure long-term changes in free-living energy intake. Am. J. Clin. Nutr. 2015, 102, 353–358. [Google Scholar] [CrossRef] [PubMed] [Green Version]
- Sazonov, E.S.; Schuckers, S.A.C.; Lopez-Meyer, P.; Makeyev, O.; Melanson, E.L.; Neuman, M.R.; Hill, J.O. Toward Objective Monitoring of Ingestive Behavior in Free-living Population. Obesity 2009, 17, 1971–1975. [Google Scholar] [CrossRef] [PubMed]
- Pew Research Center. The Smartphone Difference. Available online: http://www.pewinternet.org/2015/04/_1/us-smartphone-use-in-2015/ (accessed on 1 April 2015).
- Martin, C.K.; Nicklas, T.; Gunturk, B.; Correa, J.B.; Allen, H.R.; Champagne, C. Measuring food intake with digital photography. J. Hum. Nutr. Diet. 2014, 27, 72–81. [Google Scholar] [CrossRef] [PubMed]
- USDA Food and Nutrient Database for Dietary Studies, version 3.0 [internet], Beltsville (MD): USDA, Agricultural Research Service, Food Surveys Research Group. 2008. Available online: http://www.ars.usda.gov/Services/docs.htm?docid=17031 (accessed on 1 April 2015).
- Martin, C.K.; Han, H.; Coulon, S.M.; Allen, H.R.; Champagne, C.M.; Anton, S.D. A novel method to remotely measure food intake of free-living individuals in real time: The remote food photography method. J. Nutr. 2009, 101, 446–456. [Google Scholar] [CrossRef] [PubMed]
- Hall, K.D.; Chow, C.C. Estimating changes in free-living energy intake and its confidence interval. Am. J. Clin. Nutr. 2011, 94, 66–74. [Google Scholar] [CrossRef] [PubMed] [Green Version]
- Rochon, J.; Bales, C.W.; Ravussin, E.; Redman, L.; Holloszy, J.O.; Racette, S.B.; Roberts, S.B.; Das, S.K.; Romashkan, S.; Galan, K.M.; et al. Design and conduct of the CALERIE Study: Comprehensive assessment of the long-term effects of reducing intake of energy. J. Gerontol. Ser. A 2010, 66A, 97–108. [Google Scholar] [CrossRef] [PubMed]
- Sharma, A.M.M. A mnemonic for assessing obesity. Obesity reviews. Off. J. Int. Assoc. Study Obes. 2010, 11, 808–809. [Google Scholar] [CrossRef] [PubMed]
- Van Remoortel, H.; Giavedoni, S.; Raste, Y.; Burtin, C.; Louvaris, Z.; Gimeno-Santos, E.; Langer, D.; Glendenning, A.; Hopkinson, N.S.; Vogiatzis, I.; et al. Validity of activity monitors in health and chronic disease: A systematic review. Int. J. Behav. Nutr. Phys. Act. 2012, 9, 84. [Google Scholar] [CrossRef] [PubMed] [Green Version]
- Bandura, A. Social Foundations of Thought and Action: A Social Cognitive Theory; Prentice-Hall, Inc.: Englewood Cliffs, NJ, USA, 1986; p. 617. [Google Scholar]
- Monteiro, C.A.; Cannon, G.; Moubarac, J.C.; Martins, A.P.; Martins, C.A.; Garzillo, J.; Canella, D.S.; Baraldi, L.G.; Barciotte, M.; Louzada, M.L.; et al. Dietary guidelines to nourish humanity and the planet in the twenty-first century. A blueprint from brazil. Public Health Nutr. 2015, 18, 2311–2322. [Google Scholar] [CrossRef] [PubMed]
- Millen, B.E.; Abrams, S.; Adams-Campbell, L.; Anderson, C.A.M.; Brenna, J.T.; Campbell, W.W.; Clinton, S.; Hu, F.; Nelson, M.; Neuhouser, M.L.; et al. The 2015 dietary guidelines advisory committee scientific report: Development and major conclusions. Adv. Nutr. 2016, 7, 438–444. [Google Scholar] [CrossRef] [PubMed]
- Lloyd-Jones, D.M.; Hong, Y.; Labarthe, D.; Mozaffarian, D.; Appel, L.J.; Van Horn, L.; Greenlund, K.; Daniels, S.; Nichol, G.; Tomaselli, G.F.; et al. Defining and setting national goals for cardiovascular health promotion and disease reduction: The american heart association’s strategic impact goal through 2020 and beyond. Circulation 2010, 121, 586–613. [Google Scholar] [CrossRef] [PubMed]


| Reference | Objective | Brief Description | Key Findings |
|---|---|---|---|
| [28] | Evaluate a new method of automated dietary intake monitoring. | The “Bite Counter” device was worn like a watch. Before eating, the user pressed a button to turn it on (and off afterwards). While operating, the device used a micro-electro-mechanical gyroscope to track wrist motion, automatically detecting when the user had taken a bite. | The method worked across a reasonably large number of subjects, and variety of foods, and there was modest correlation with EI on a per-meal level. |
| [30] | Evaluate accuracy of an individualized bite-based equation of kilocalorie intake compared to participant estimates of kilocalorie intake. | Subjects’ real kilocalorie intake was compared to predicted kilocalories estimated by: (a) the bite-based equation of kilocalorie intake, (b) participants’ kilocalorie estimate when provided with kilocalorie information of the foods eaten, (c) participants’ kilocalorie estimate without kilocalorie information. | The bite-based equation measure of kilocalorie intake outperformed human estimates with and without menu kilocalorie information. |
| [31] | Evaluate the: Automatic Ingestion Monitor (AIM) for objective detection of food intake in free-living individuals. | The AIM integrated three sensor modalities and a pattern recognition method for subject-independent food intake recognition. | The AIM can detected food intake with an average accuracy of 89.8% suggesting that it can be used to monitor eating behavior in free-living individuals. AIM could be used as a behavioral modification tool. |
| [32] | Estimate EI using individualized models based on Counts of Chews and Swallows (CCS). | EI was estimated by the CCS mathematical model and compared to the weighed food records, diet diaries and photographic food records methods. | Mathematical models based on the CCS could be potentially used to estimate EI. |
| [33] | Present an intelligent food-intake monitoring system that can automatically detect eating activities | The multi-sensor monitor detected chewing activity via its integrated ear-microphone, consequently the camera was activated, snapshots for food detection were taken. | The high correlation rates reported (r not shown) suggested the usefulness of the proposed method to provide with an overall understanding of eating behavior characteristics (speed, type and amount of food consumed). |
| [34] | To compare mean EI of overweight and obese young adults assessed by a Digital Photography + Recall method (DP + R), to the mean total daily energy expenditure assessed by TDEEDLW. | Two digital still photographs (90° and 45° angle) were taken by a digital camera approximately 30 inches above the tray. Notes were placed on the tray to identify types of beverages and standard measures were included to guide the assessment of portion size. The type and amounts of food and beverages consumed and results from recalls were entered into the Nutrition Data System for Research to quantification for EI. TDEEDLW was assessed in all participants to compare mean daily EI. | The mean EI estimated by DP + R and TDEEDLW was not significantly different (p = 0.42). On average, DP + R overestimated EI compared to TDEEDLW by 6.8 ± 28%. |
| [35] | To validate the Remote Food Photography Method (RFPM) | Developed for automating dietary assessment. Participants include a reference card placed next to the food plate as well as labels of not easily recognizable foods for the portion size estimation to take place. A barcode reader phone app and a voice message option are innovations included to facilitate identification of foods. Participant received feedback about their food intake behavior and recommendations to achieve weight goals. To maximize and promote usage of RFPM in free-living conditions, ecological momentary assessment (EMA) methods were adopted, which involves sending small reminders or prompts to the user via email or text message. EMA was tested by comparing two groups; the standard prompts (2 or 3 prompts a day send to their smartphones around meal time) versus customized prompts (3 to 4 personalized prompts, send at participants’ specific meal time). | The RFPM and DLW did not differ significantly at estimating free-living EI (−152 ± 694 kcal/day, p = 0.16) nor did it differ when estimating energy and macronutrient intake. |
| [36] | To evaluate a mobile food recognition system which estimates calorie and nutritional components of food intake. | (1) User pointed the smartphone camera to the food (2) Drew bounding boxes to delimit food regions (3) Food item recognition started within the indicated bounding boxes. To recognize them more accurately each food item region is segmented by GrubCut. The recognition process results in a display of the top 5 food item candidates. The user selects the most accurate candidate and indicates the relative approximate volume of the food. | A 79.2% classification rate was achieved. The recognition processing time was only 0.065 s. |
| [37] | To present Snap-n-Eat, a mobile food recognition system. | The user took a photo of the plate. The system detects the salient regions corresponding to the food items. Hierarchical segmentation was performed to segment the images into regions. The system estimated the portion size of the food and uses it to determine the EI and nutritional content. | The Snap-n-Eat application achieved a 85% accuracy when detecting 15 different categories of food items. Snap-n-eat recognized foods presented on a plate and estimated their caloric EI and nutrition content automatically without any user intervention. |
| [38] | To assess the accuracy of the GoCARB prototype when used by individuals with type 1 diabetes and to compare it to their own performance in carbohydrate counting. | The user placed a reference card next to the dish and took two images using a mobile phone. A series of computer vision modules detected the plate and automatically segmented and recognized the different food items, while their 3D shape was reconstructed. The carbohydrate content was calculated by combining the volume of each food item with the nutritional information provided by the USDA Food and Nutrient Database. | GoCARB was more accurate at estimating carbohydrates content than individuals with type 1 diabetes. The mean absolute estimation error while using GoCARB was reduced by more than 50% than without using GoCARB. |
| [39] | To validate a mathematical method to measure long-term changes in free-living EI | DLW was used to assess Energy Expenditure (EE) at months 6, 12, 18, and 24. DXA and body weight measurements were taken twice at baseline, twice at month 6, and once at months 12, 18, and 24. Body weight measurements were taken at months 1, 3, 6, 9, 12, 18, and 24 in the CALERIE study. Then, they compared the ΔEI values calculated by using DLW/DXA with those obtained by using the mathematical model | The mean (95% CI) ΔEI values calculated by the model were within 40 kcal/day of the DLW/DXA method and were not significantly different throughout the 4 times segment (p = 0.14, p = 0.34, p = 0.32, p = 0.11). Most of the model-calculated ΔEI values were within 132 kcal/day of the DLW/DXA method. |
| Reference | Name of Tool | What Is Measured | Reliability | Validity | ||
|---|---|---|---|---|---|---|
| Statistical Method Used | Result | Statistical Method Used | Result | |||
| [28] | Automated Wrist Motion Tracking | EI | Sensitivity (true detection rate) = (total true detection)/(total true detection + total undetected bites); Positive Predicted Value (PPV) = (total true detection)/(total true detection + total false detection); compared recorded bites with direct observation. | Control setting: Sensitivity = 94% PPV = 80% Semi-controlled setting: Sensitivity = 86% PPV = 81% | Pearson correlation of EI estimated by device vs. direct observation (r) | R = 0.6 |
| [30] | The bite-based model of kilocalorie intake | EI | Pearson’s correlation of device compared with direct observation; shrinkage value | R = 0.374 Shrinkage value (difference in R2) = 0.014 | Independent t test Paired sample t test | Mean estimation error kilocalorie information group: −185 ± 501 kcal; Mean estimation error no kilocalorie information group: −349 ± 748 kcal (p < 0.05); Best human-based estimation (kilocalorie information group) mean estimation error: −257 ± 790 kcal; Bite-based method (predicted formula) mean estimation error: 71 ± 562 kcal; (p < 0.001). |
| [31] | Automatic Ingestion Monitor (AIM) | EI | N/A | N/A | Accuracy = average between precision (P) and recall (R). | Accuracy of food ingestion = 89.9%, range from 75.82–97.7%. |
| [32] | Counts of Chews and Swallows Model | EI | A 3-fold cross validation technique, one sided Wilcoxon-Mann-Witney, Bland-Altman analysis and t-Test analysis. | Reporting error for the CCS model was lower than that of the diet diary (p < 0.01). The model underestimated EI. Energy intake estimation had the lowest bias. | A 3-fold cross validation technique, one-sided Wilcoxon-Mann-Witney, Bland-Altman analysis and t-Test analysis. | No statistical differences were found between the CCS model and either diet diary or photographic records. |
| [33] | Intelligent food-intake monitor | Food intake | Correlation: Proportion of food consumed from sound (auditory based) and image sequence (vision based) compared to the ground truth: proportion of food consumed. | Data not shown | N/A | N/A |
| [34] | DP + R | EI | Inter-rater reliability coefficients | Error rate ≤5%, Recall assessments ≥0.95 | Dependent t-test comparing device to DLW method; Bland-Altman plots; Limits of agreement | Differences between methods in the total sample was not significantly different (DP + R = 2912 ± 661 kcal/day; TDEEDLW = 2849 ± 748 kcal/day, p = 0.42); DP + R was found to overestimate EI compared to TDEEDLW by 63 ± 750 kcal/day (6.8 ± 28%; limits of agreement: −1437, 1564 kcal/day). The Bland-Altman plot indicated no proportional bias variation as a function of the level of EI in the total sample (R = −0.13, p = 0.21). |
| [35] | RFPM | EI | Bland & Altman analysis | Significant difference: p < 0.0001 between the RFPM and DLW in the standard prompt group. No significant difference in the customized group: p = 0.22. The level of bias in both groups was not influenced by the amount of EI (Adj. R2= −0.03, p = 0.55; Adj. R2 = −0.08, p = 0.78) | Independent sample t-test for error between methods = EI estimated with the RFPM-EI measured with DLW | Significant smaller underestimation in the customized group (270 ± 748 kcal/day or 8.8 ± 29.8%) when compared to the standard prompt group (895 ± 770 kcal/day or 34.3 ± 28.2%), t (33) = −2.35, p < 0.05 with RFPM. |
| [36] | Real-time Food Recognition System | EI | Test-retest reliability | 79.2% classification rate | N/A | N/A |
| [37] | Snap-n-Eat | Energy/dietary intake | Test-retest reliability | Classification accuracy (% of correctly classified images categories) = 85% | N/A | N/A |
| [38] | GoCARB | Carb EI | Comparison to actual foods/database | Automatic segmentation (portion size) = 75.4% (86/114); Food item recognition = 85.1% (291/342) | Mean absolute error; Relative error | Mean absolute error = 27.89 (SD 38.20) and 12.28 (SD 9.56) grams of carbohydrates; Mean relative error = 54.8% (SD 72.3%) and 26.2% (SD 18.7%). A significant error between estimations was found (p = 0.001). In general, 60.5% (69/114) of the participants underestimated carbohydrate content. |
| [39] | Mathematical method | Change in EI | Test-retest reliability; Mean difference | 40 kcal/day of mean difference between the gold standard and the mathematical model; No significant difference between the methods for any of the time segments was found (weeks 0–26: p = 0.14; weeks 26–52: p = 0.34; weeks 52–78: p = 0.32; weeks 78–104: p = 0.11). | Paired, 2-sided t test; Pearson correlation (r) Spearman’s corrected (rs) | Change in EI values calculated by the mathematical method or the gold standard DLW/DXA weren’t significantly different; The mathematical model had an accuracy within 132kcal/day for predicting changes in EI; The magnitude of correlation of the change in EI values between models were correlated (weeks 0–26: r = 0.57 (95% confidence interval 0.45, 0.68); p =≤ 0.0001; weeks 78–104: r = 0.19 (0, 0.36); p = 0.05). |
© 2018 by the authors. Licensee MDPI, Basel, Switzerland. This article is an open access article distributed under the terms and conditions of the Creative Commons Attribution (CC BY) license (http://creativecommons.org/licenses/by/4.0/).
Share and Cite
Archundia Herrera, M.C.; Chan, C.B. Narrative Review of New Methods for Assessing Food and Energy Intake. Nutrients 2018, 10, 1064. https://doi.org/10.3390/nu10081064
Archundia Herrera MC, Chan CB. Narrative Review of New Methods for Assessing Food and Energy Intake. Nutrients. 2018; 10(8):1064. https://doi.org/10.3390/nu10081064
Chicago/Turabian StyleArchundia Herrera, M. Carolina, and Catherine B. Chan. 2018. "Narrative Review of New Methods for Assessing Food and Energy Intake" Nutrients 10, no. 8: 1064. https://doi.org/10.3390/nu10081064
APA StyleArchundia Herrera, M. C., & Chan, C. B. (2018). Narrative Review of New Methods for Assessing Food and Energy Intake. Nutrients, 10(8), 1064. https://doi.org/10.3390/nu10081064