Nutritional Contingency Reduces Alcohol Drinking by Altering Central Neurotransmitter Receptor Gene Expression in Rats


Abstract
:1. Introduction
2. Material and Methods
2.1. Animals
2.2. Diets
2.3. General Procedure
2.4. Ethanol Testing
2.5. Feeding Peptide Analysis
2.6. Central Neurotransmitter Receptors Gene Expression
2.7. Statistical Analysis
3. Results
3.1. Intermittent HFD Exposure and Body Weight
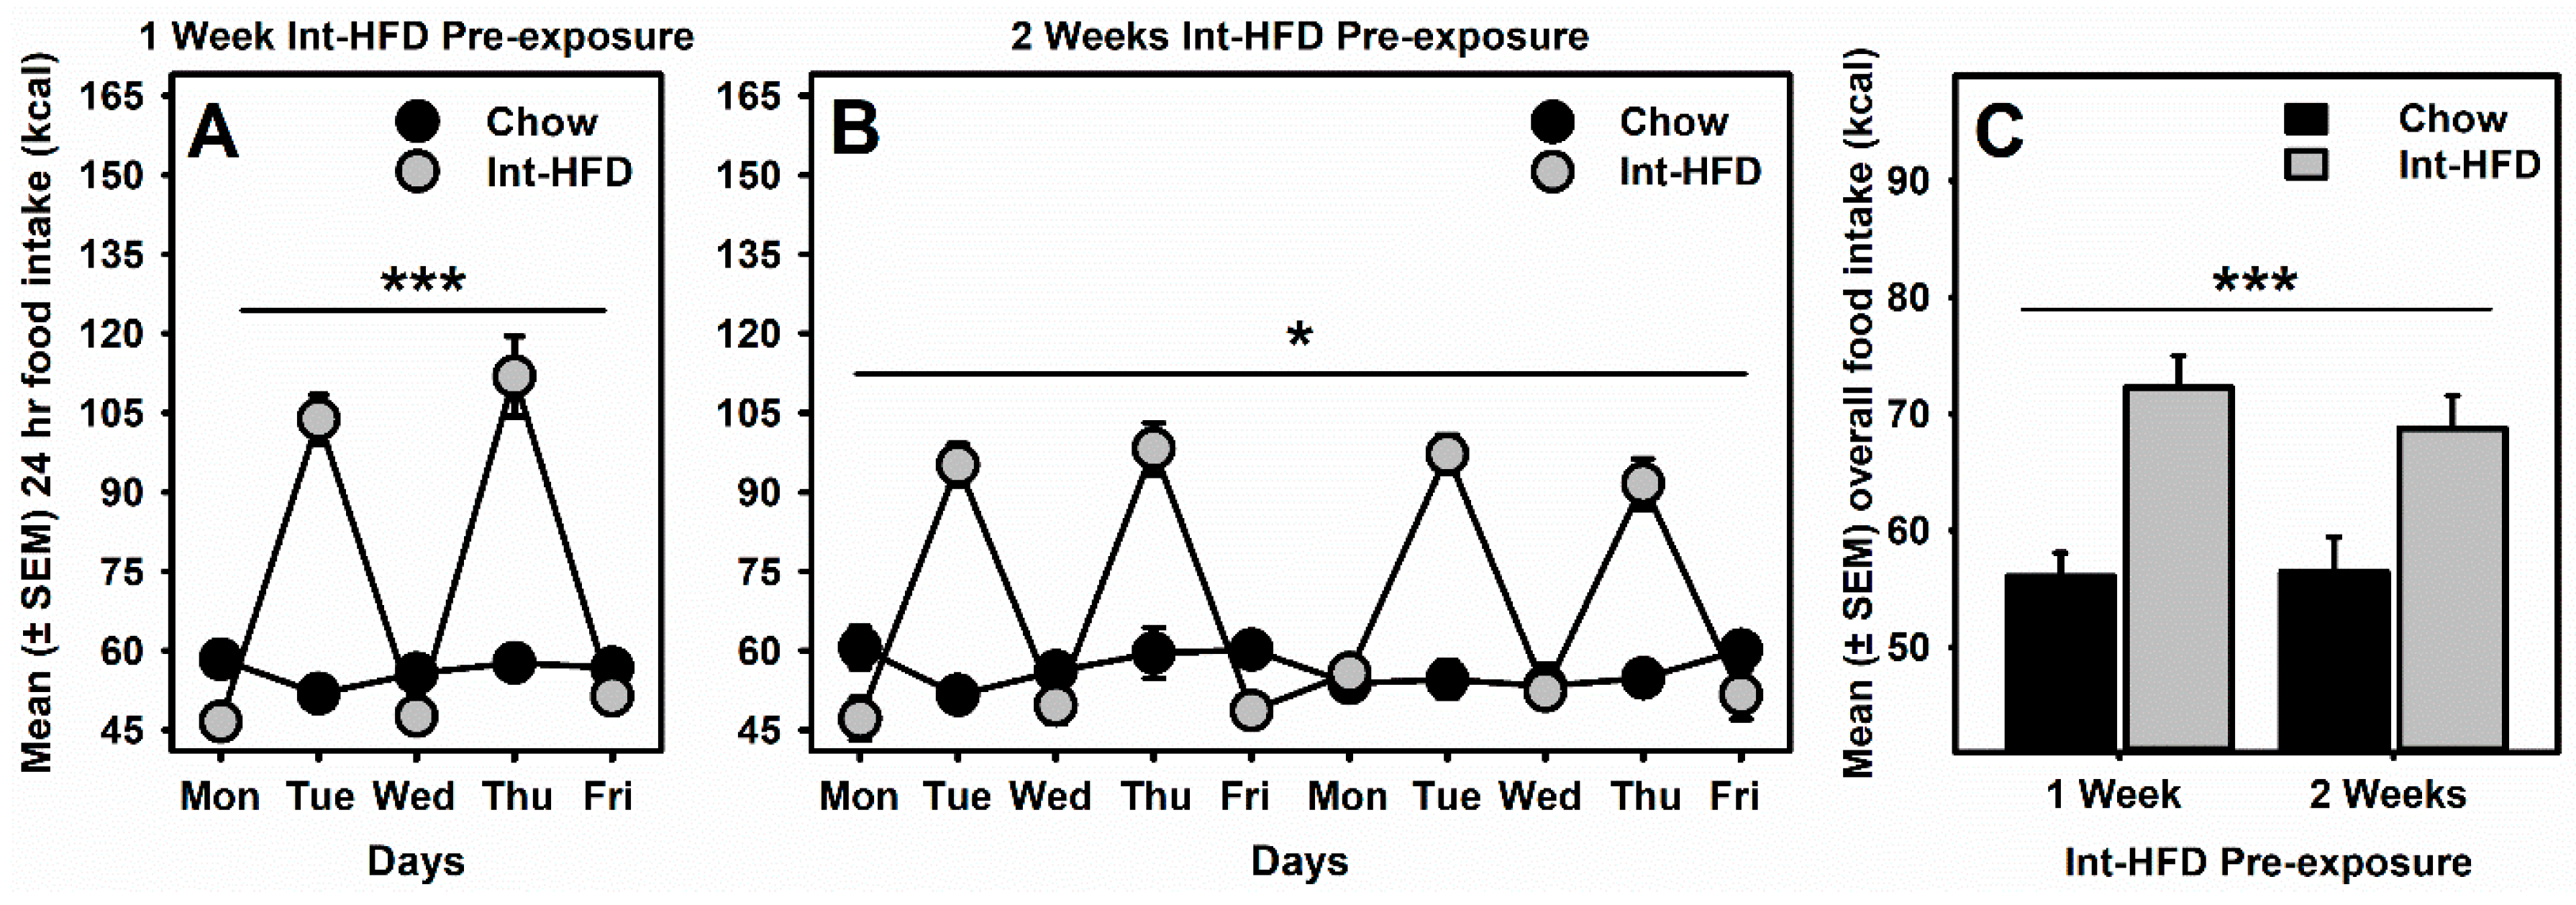
3.2. Intermittent HFD Exposure and Feeding
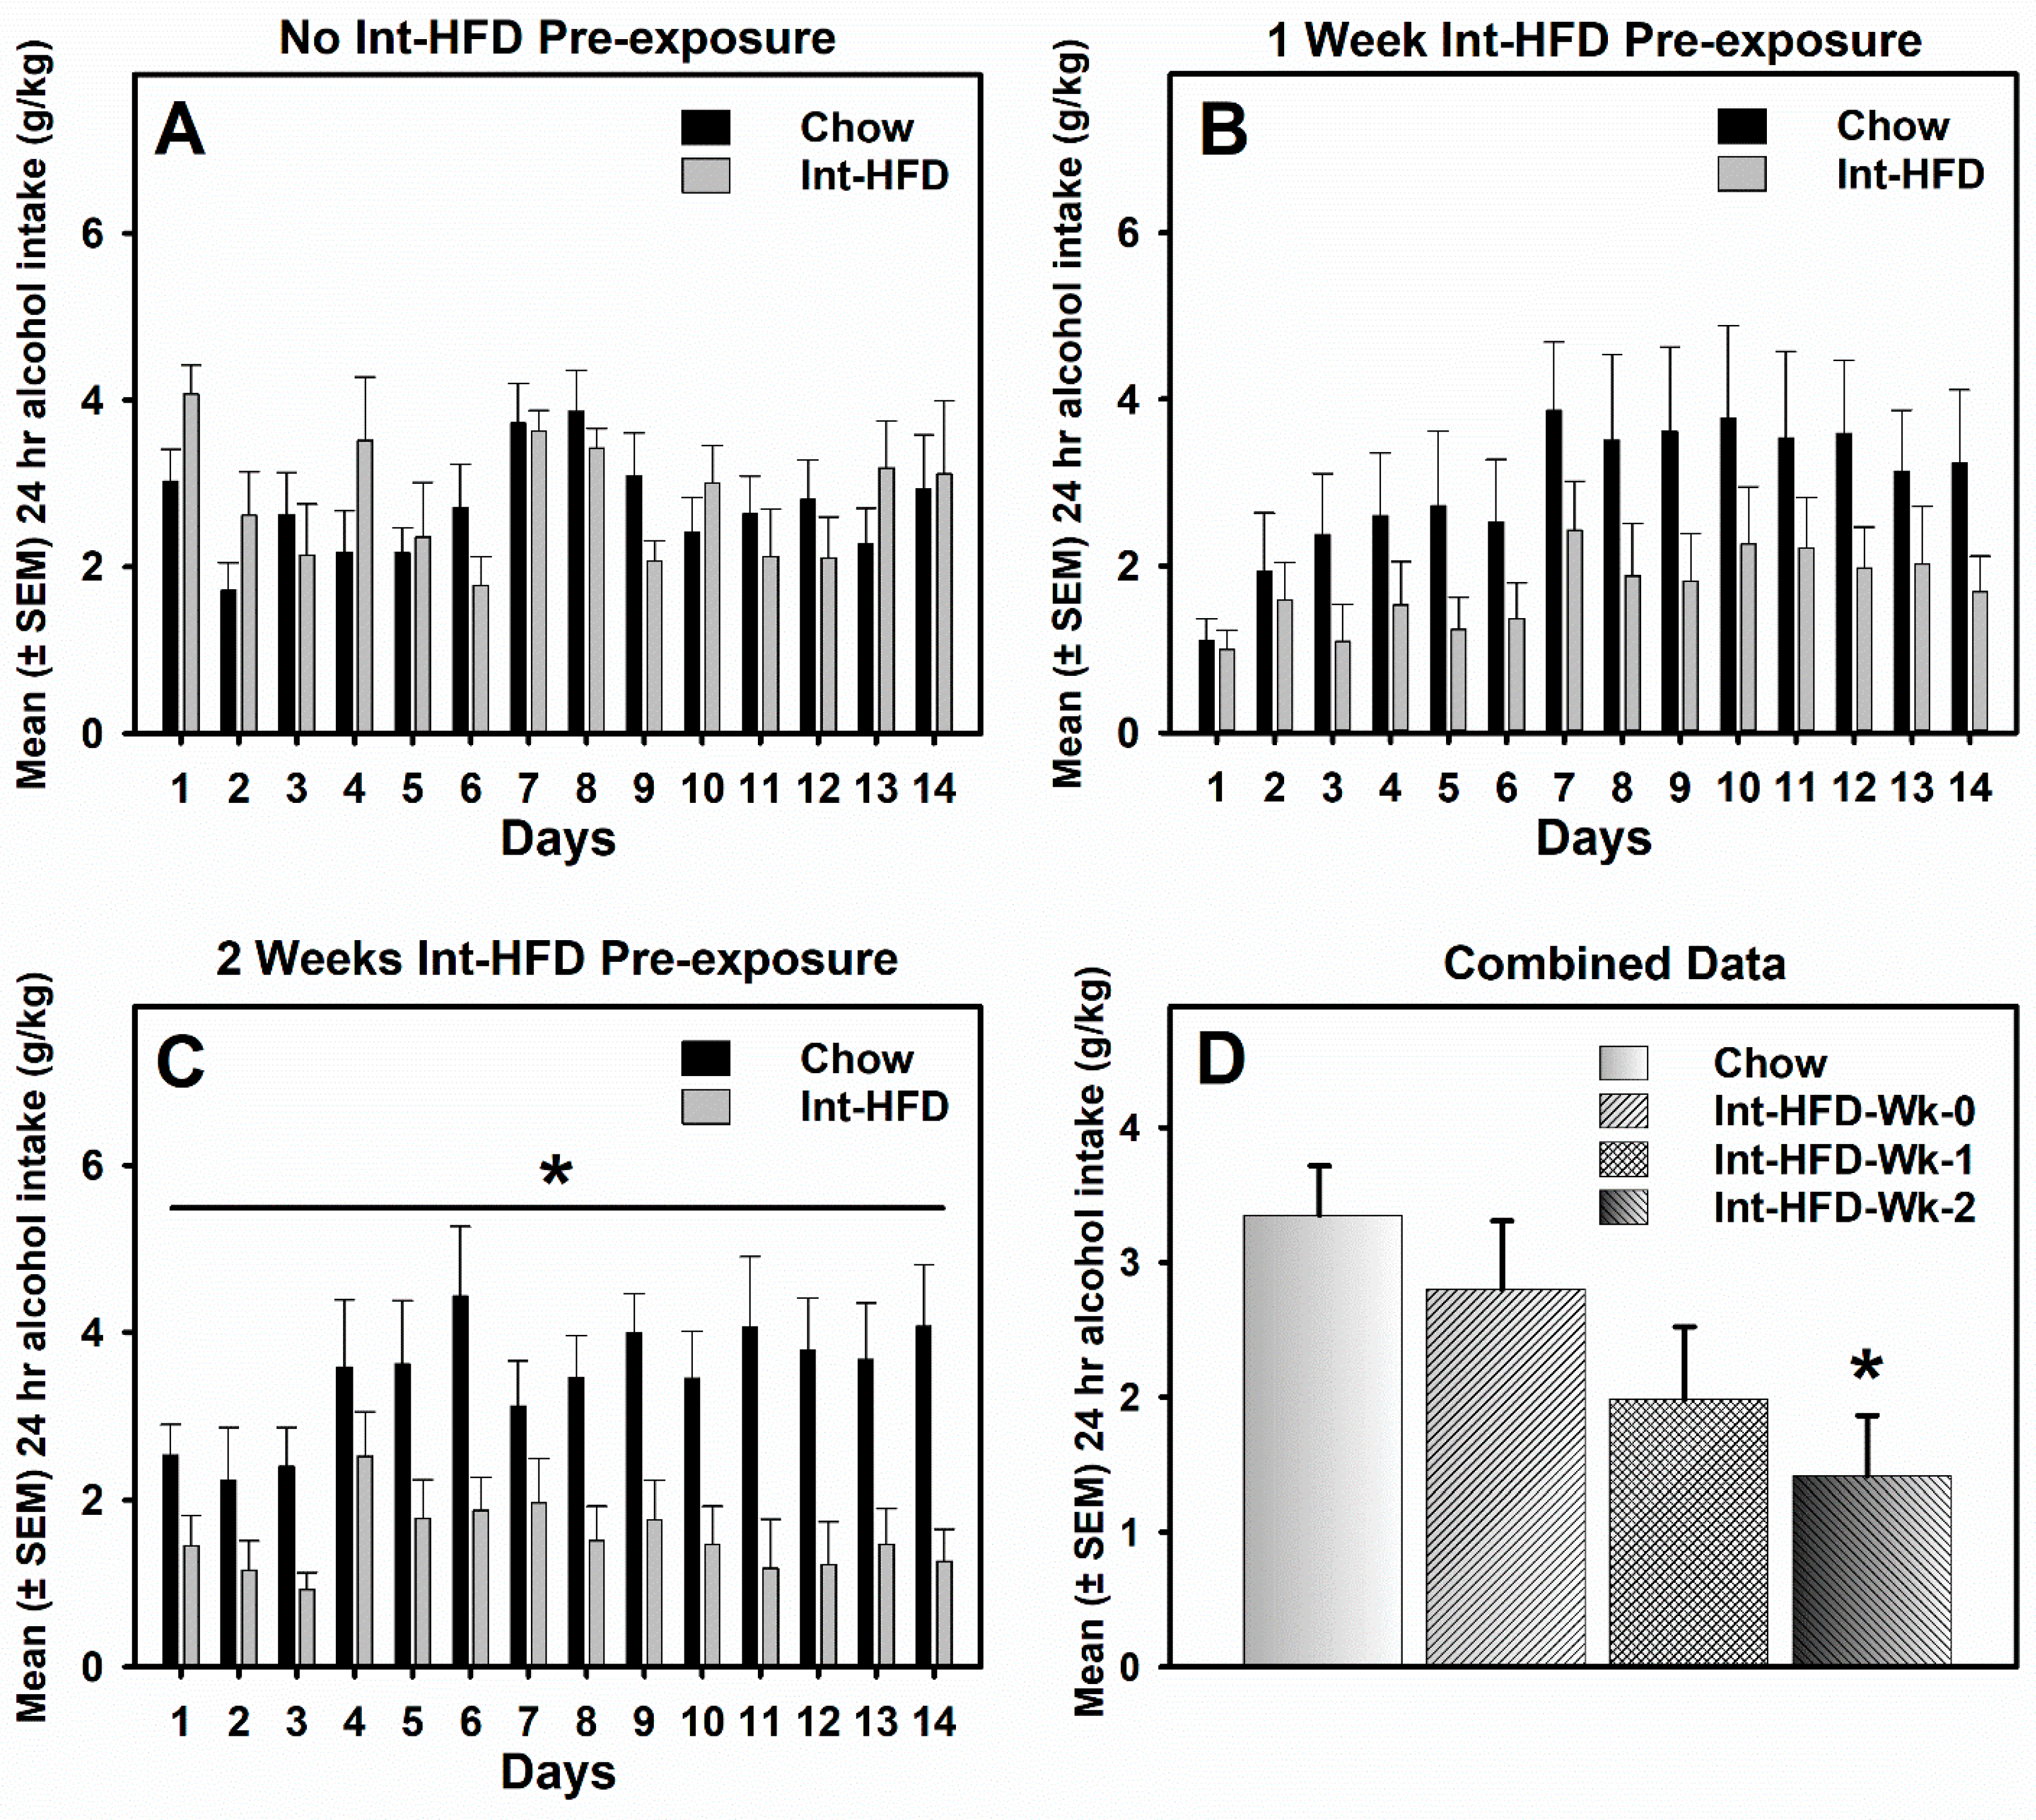
3.3. Intermittent HFD Exposure and Alcohol Drinking
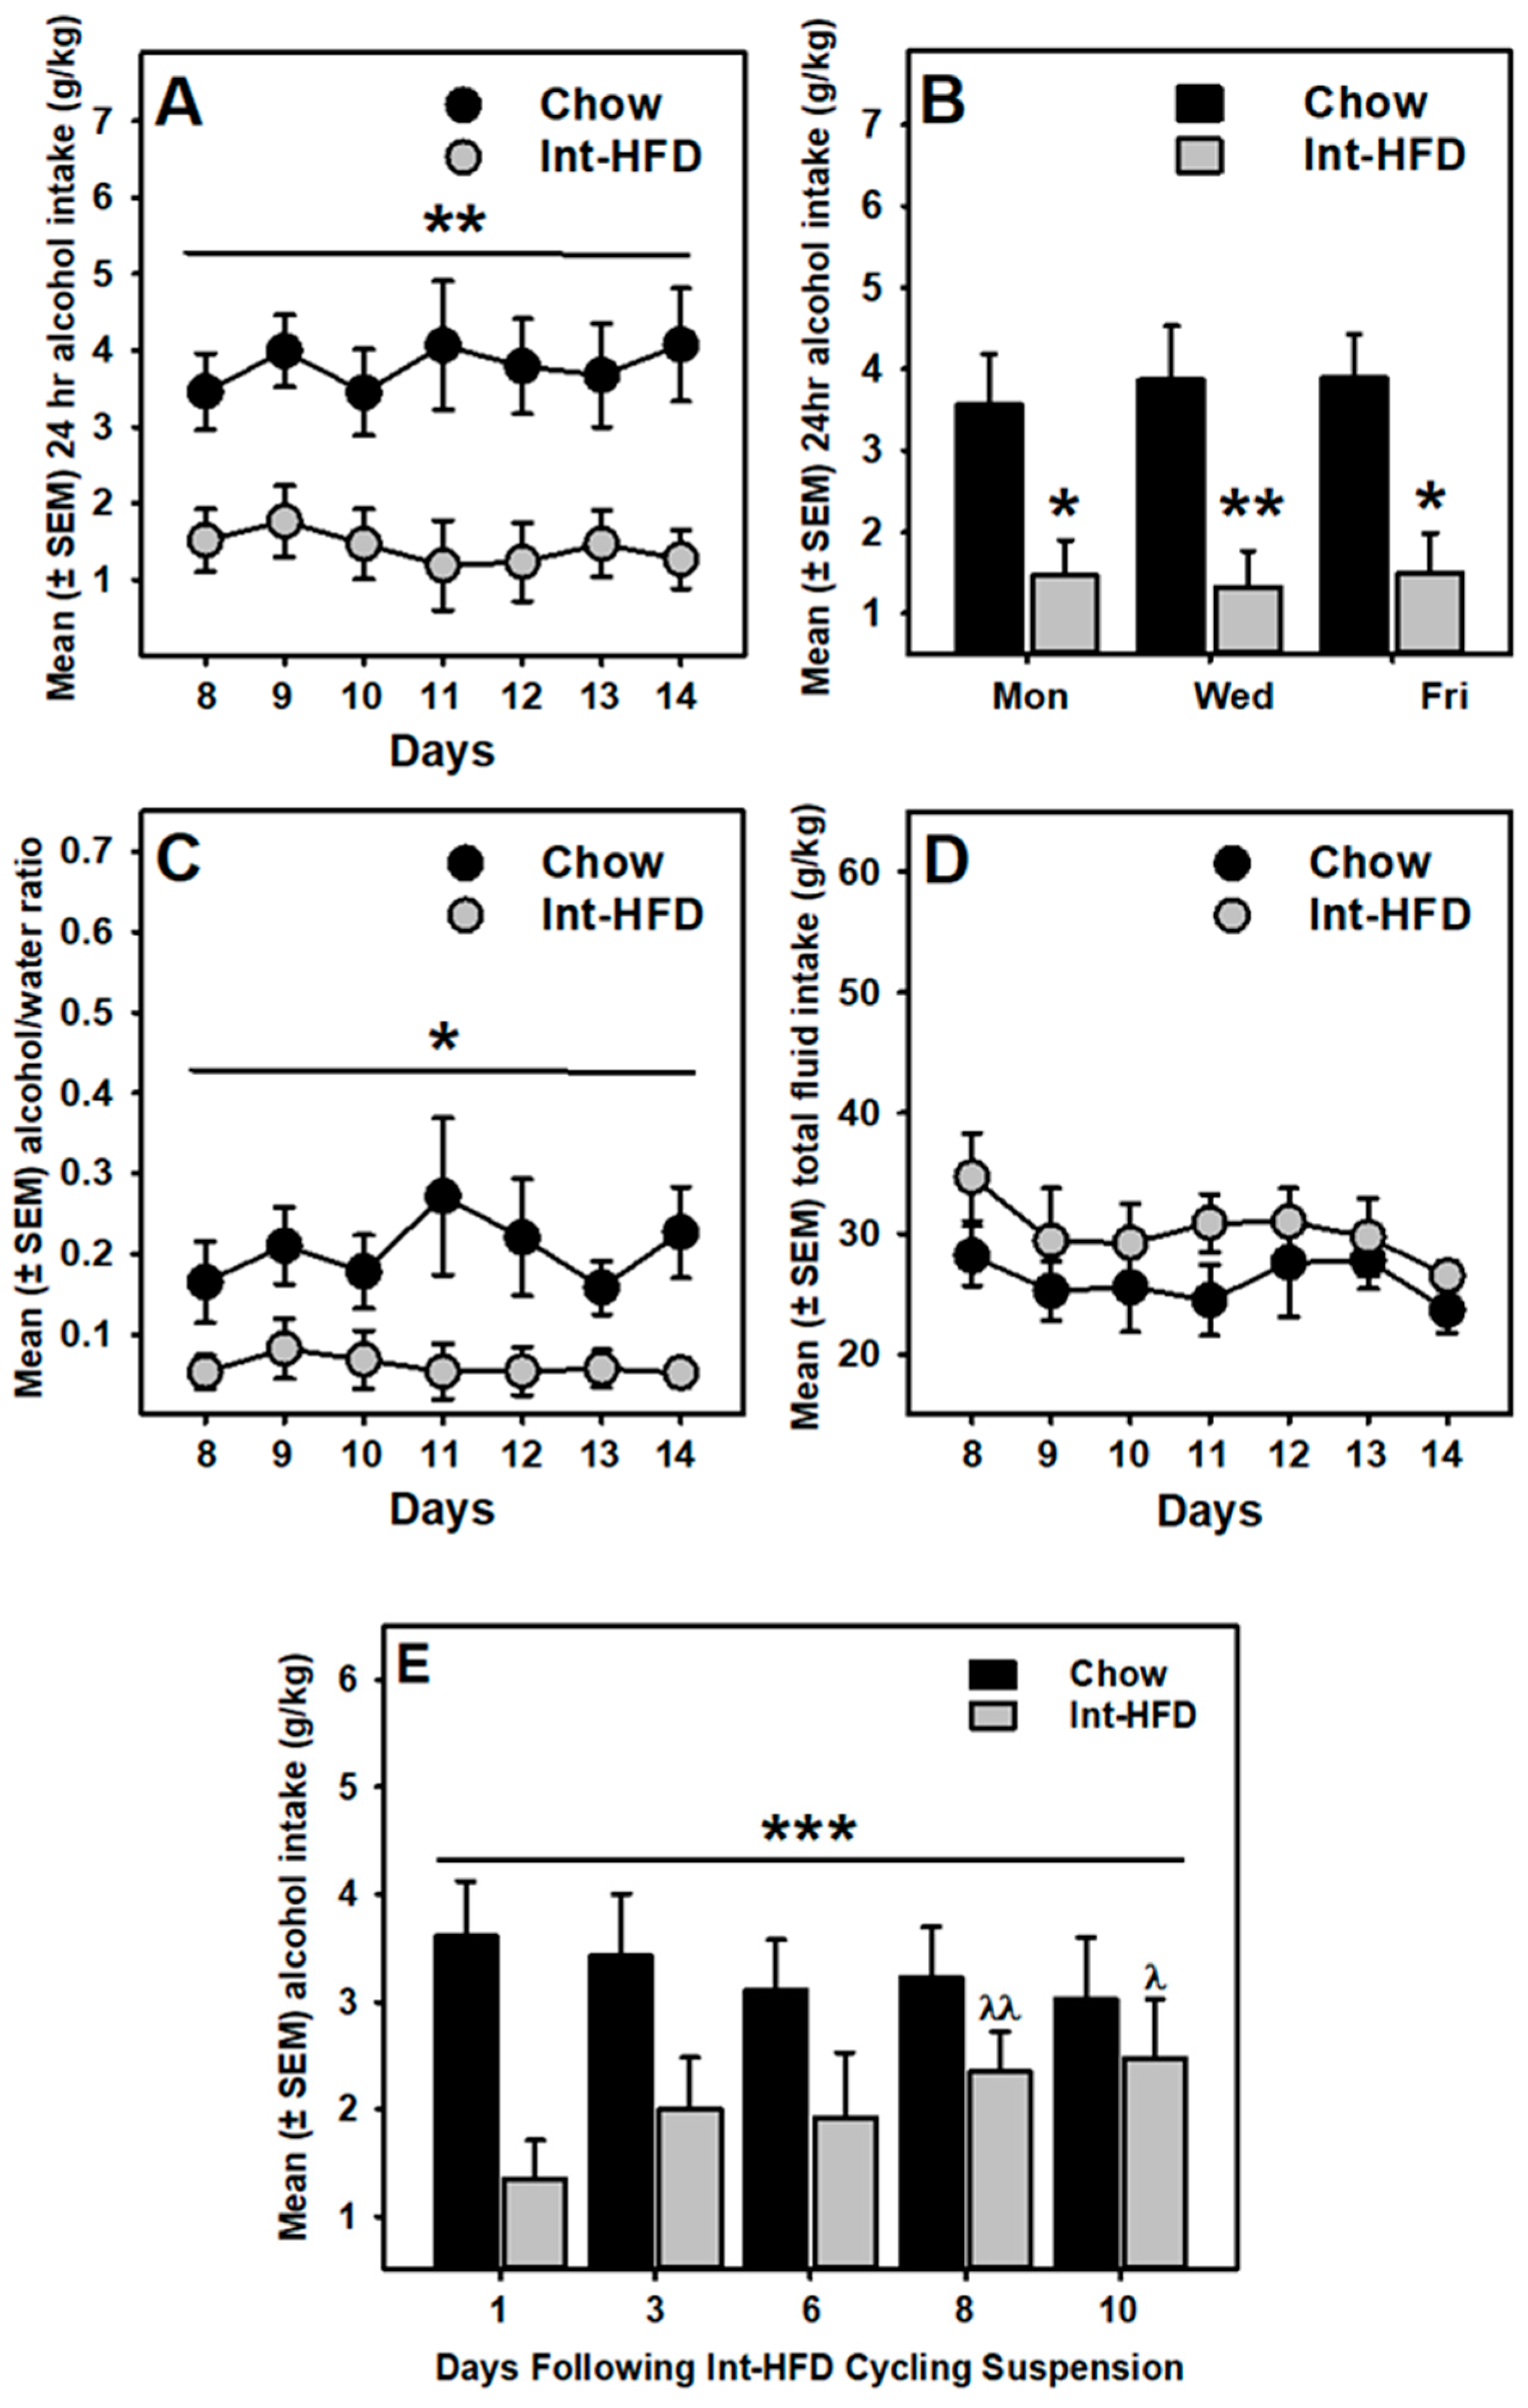
3.4. Food Intake and Alcohol Drinking Sessions
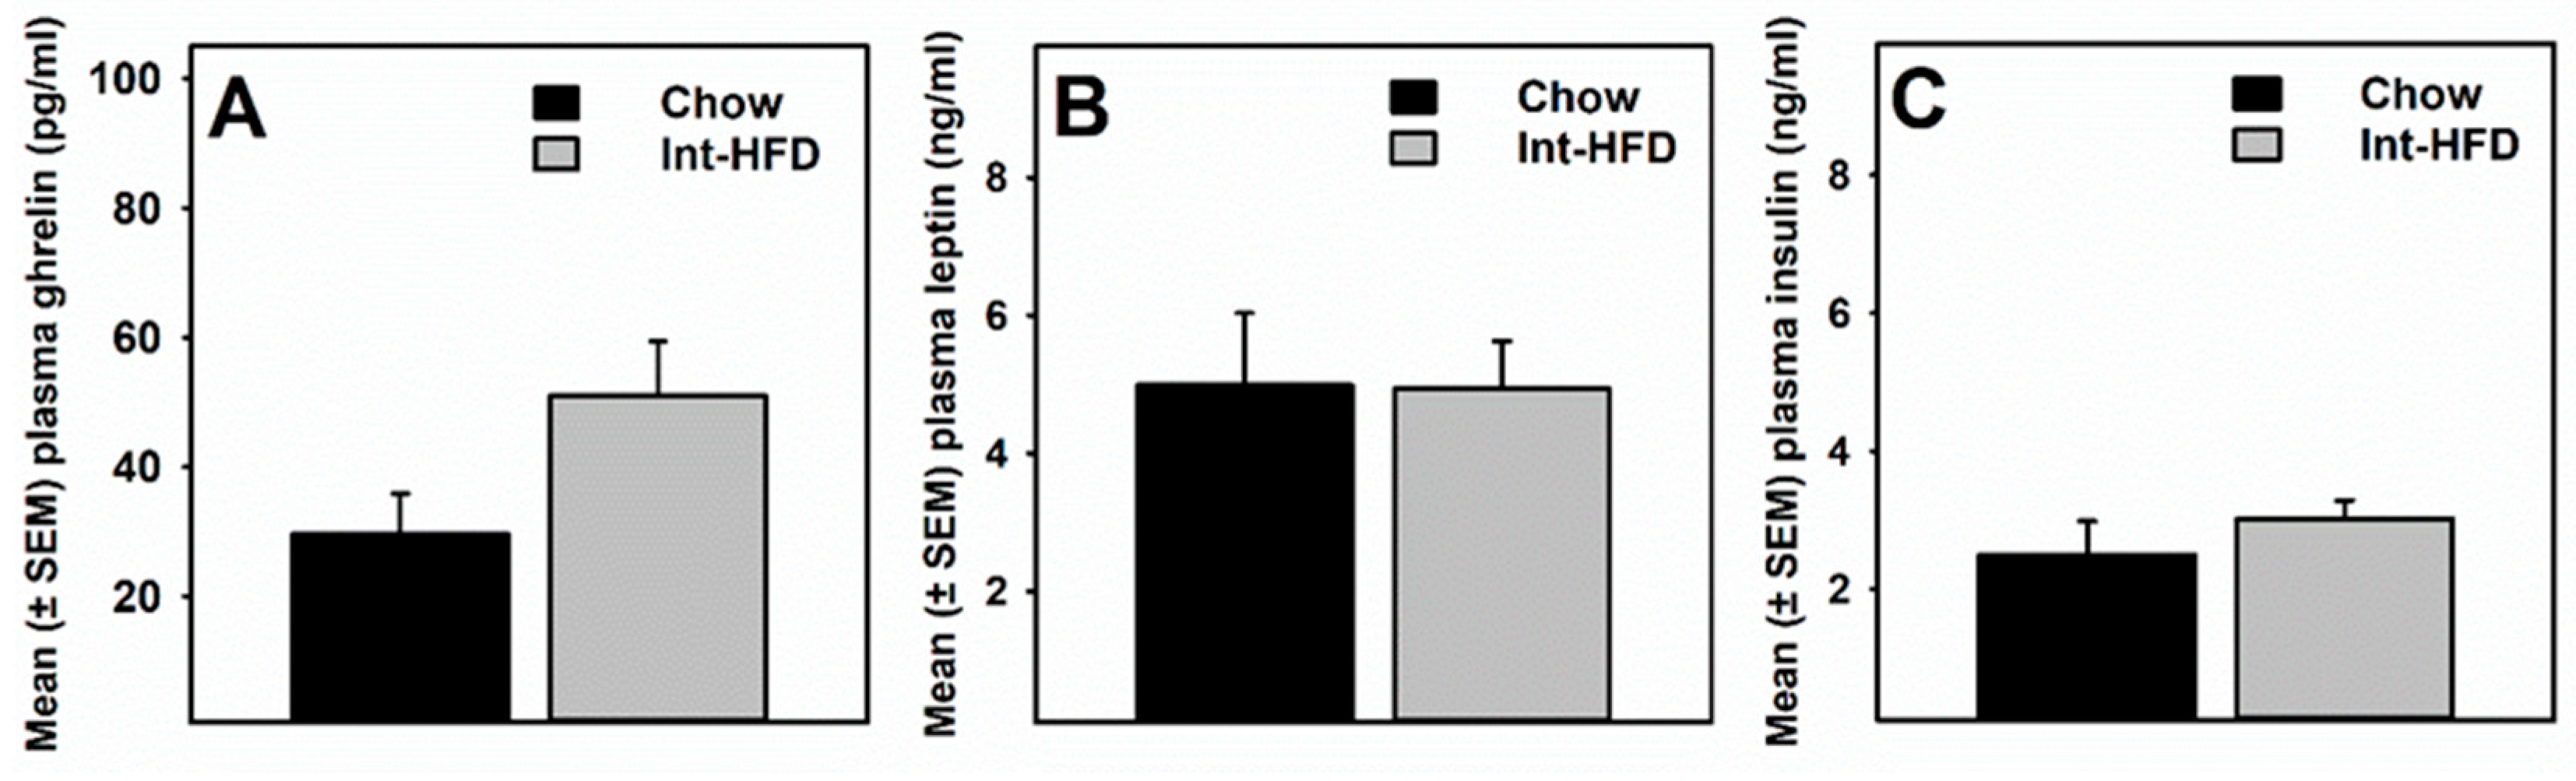
3.5. Intermittent HFD Exposure and Feeding Peptides
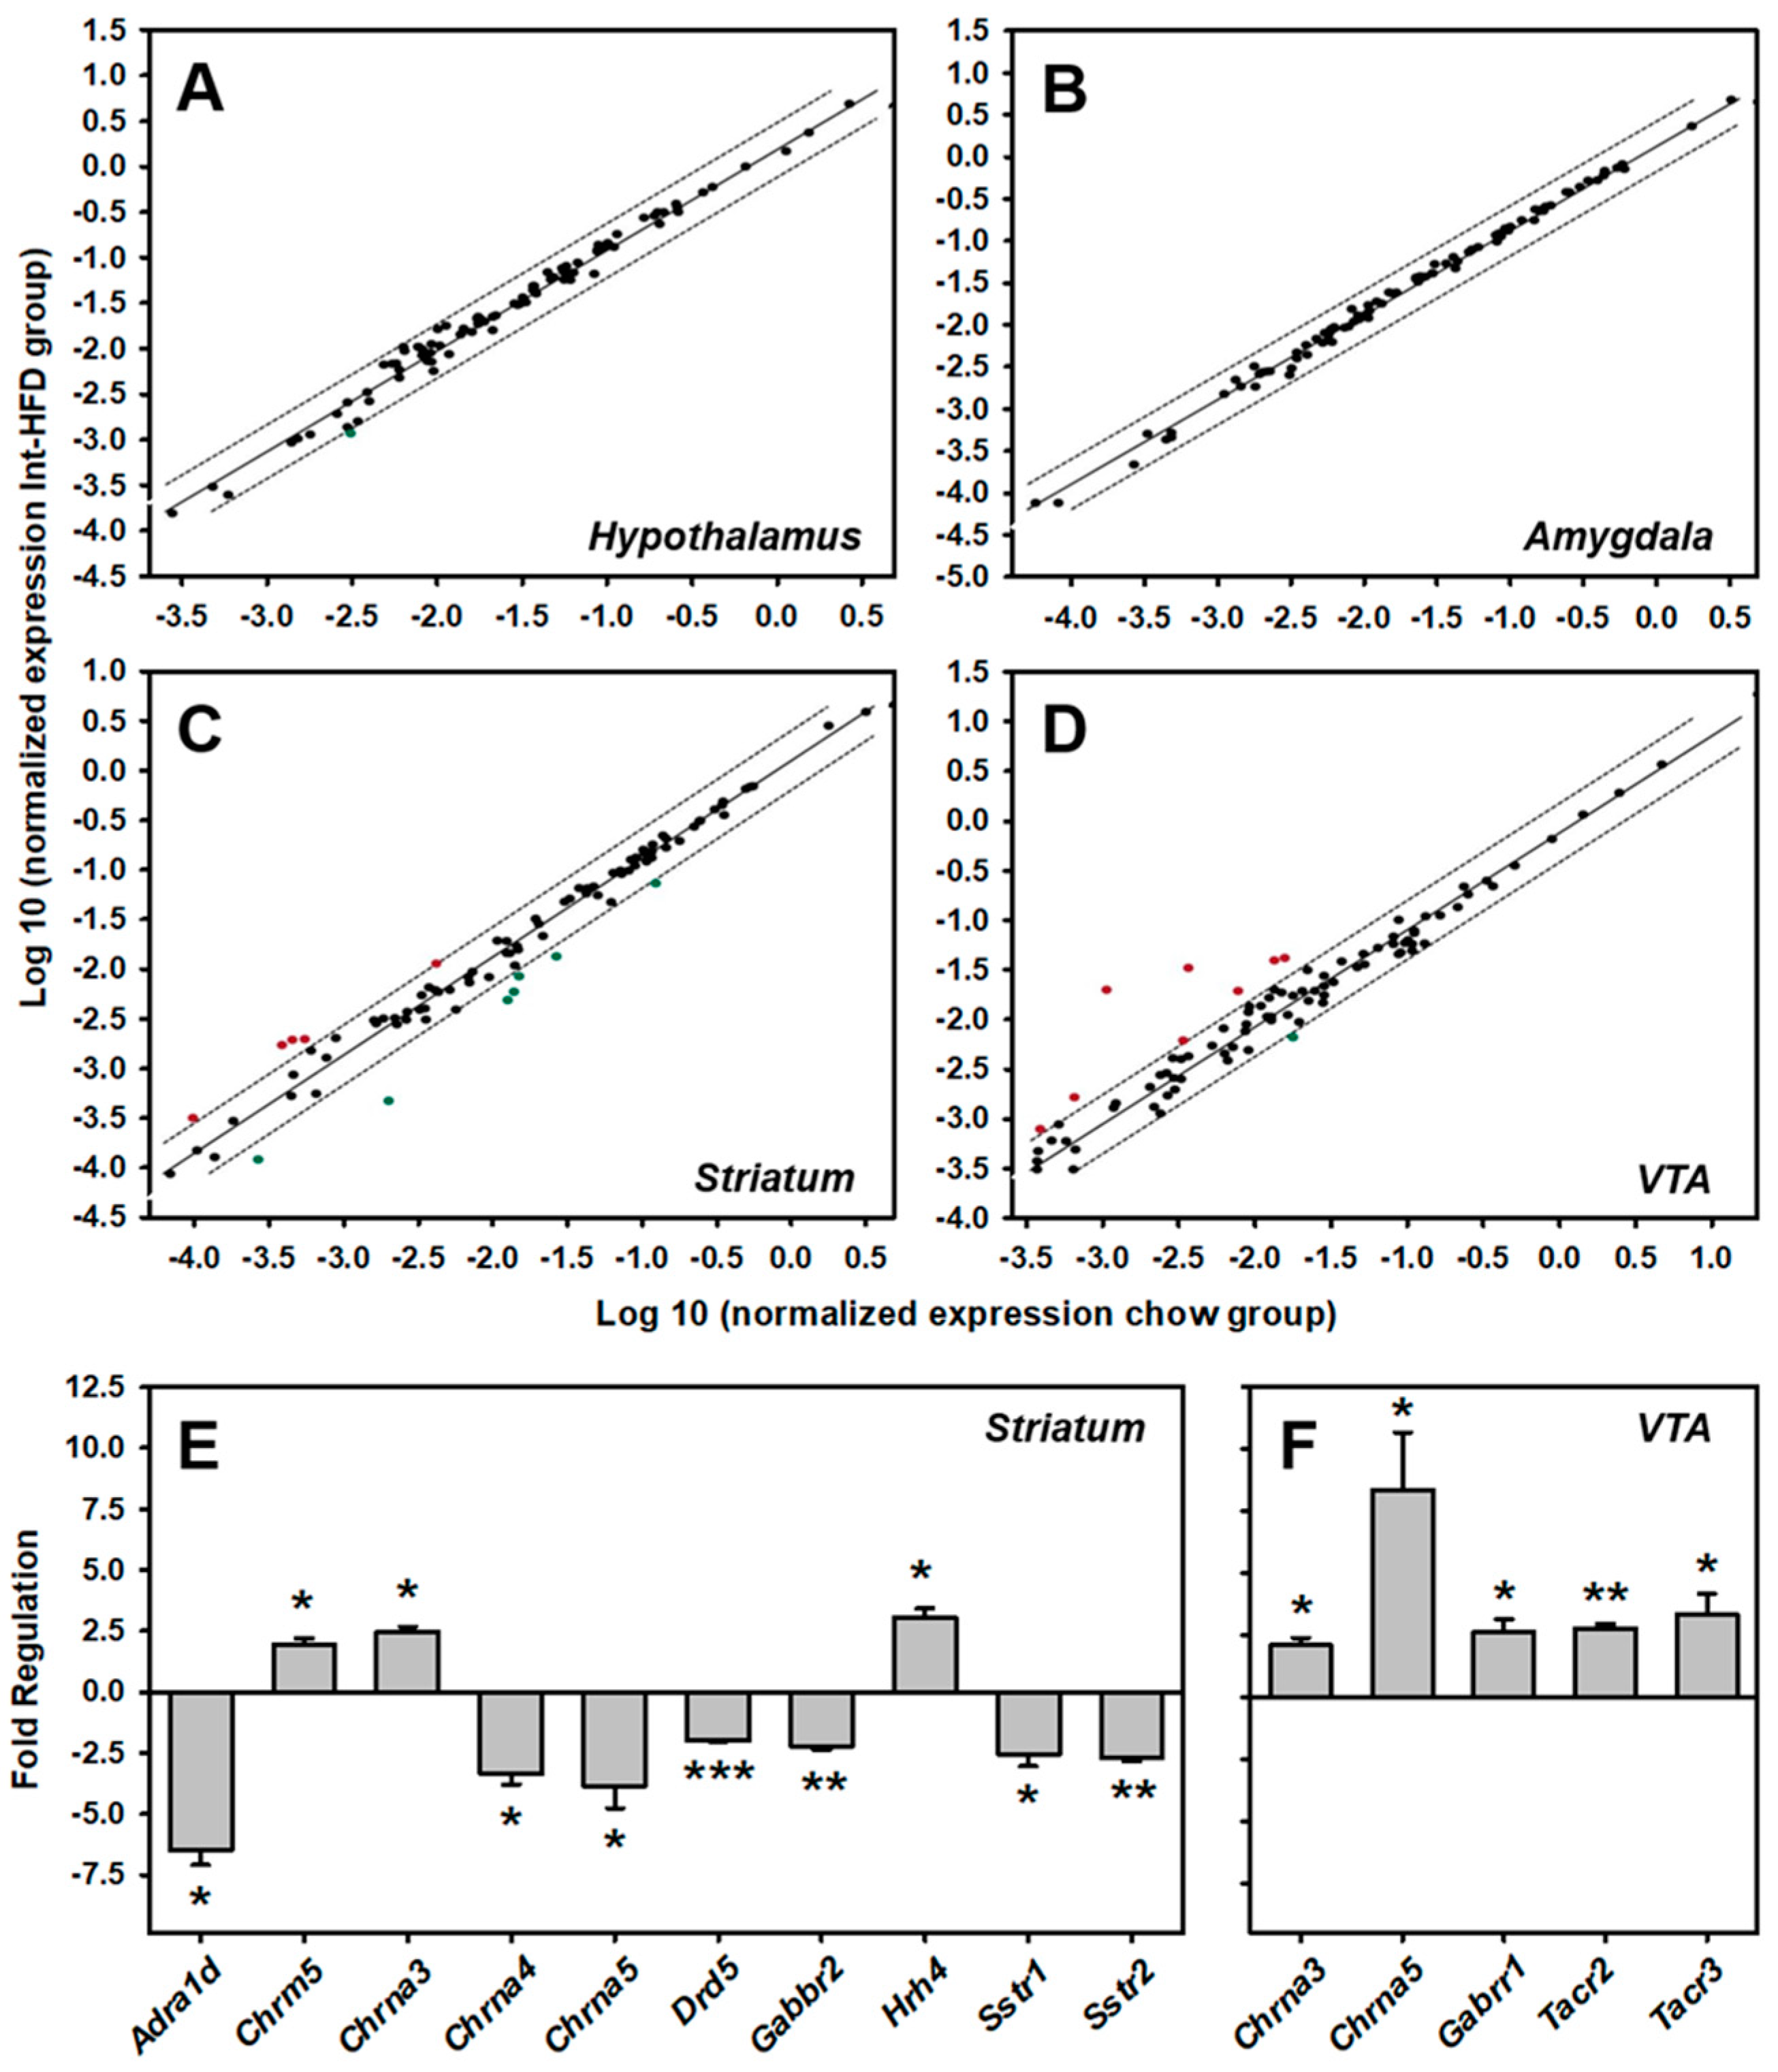
3.6. Intermittent HFD Exposure and Central Neurotransmitter Receptors Gene Expression
4. Discussion
5. Conclusions
Author Contributions
Funding
Acknowledgments
Conflicts of Interest
References
- Substance Abuse and Mental Health Services Administration (SAMHSA). Results from the 2016 National Survey on Drug Use and Health: Detailed Tables; Substance Abuse and Mental Health Services Administration Center for Behavioral Health Statistics and Quality: Rockville, MD, USA, 2017. [Google Scholar]
- World Health Organization Global Status Report on Alcohol and Health 2018; World Health Organization: Geneva, Switzerland, 2018.
- Sirohi, S.; Bakalkin, G.; Walker, B.M. Alcohol-induced plasticity in the dynorphin/kappa-opioid receptor system. Front. Mol. Neurosci 2012, 5, 95. [Google Scholar] [CrossRef] [PubMed]
- Bajaj, J.S. Alcohol, liver disease and the gut microbiota. Nat. Rev. Gastroenterol. Hepatol. 2019, 16, 235–246. [Google Scholar] [CrossRef] [PubMed]
- Menon, J.; Kandasamy, A. Relapse prevention. Indian J. Psychiatry 2018, 60, S473–S478. [Google Scholar] [PubMed]
- Lieber, C.S. Alcohol: Its Metabolism and Interaction with Nutrients. Annu. Rev. Nutr. 2000, 20, 395–430. [Google Scholar] [CrossRef] [PubMed]
- Addolorato, G.; Capristo, E.; Greco, A.V.; Stefanini, G.F.; Gasbarrini, G. Influence of chronic alcohol abuse on body weight and energy metabolism: Is excess ethanol consumption a risk factor for obesity or malnutrition? J. Intern. Med. 1998, 244, 387–395. [Google Scholar] [CrossRef] [PubMed]
- Sarin, S.K.; Dhingra, N.; Bansal, A.; Malhotra, S.; Guptan, R.C. Dietary and nutritional abnormalities in alcoholic liver disease: A comparison with chronic alcoholics without liver disease. Am. J. Gastroenterol. 1997, 92, 777–783. [Google Scholar] [PubMed]
- Glória, L.; Cravo, M.; Camilo, M.E.; Resende, M.; Cardoso, J.N.; Oliveira, A.G.; Leitão, C.N.; Mira, F.C. Nutritional deficiencies in chronic alcoholics: Relation to dietary intake and alcohol consumption. Am. J. Gastroenterol. 1997, 92, 485–489. [Google Scholar] [PubMed]
- Yung, L.; Gordis, E.; Holt, J. Dietary choices and likelihood of abstinence among alcoholic patients in an outpatient clinic. Drug Alcohol Depend. 1983, 12, 355–362. [Google Scholar] [CrossRef]
- Stickel, A.; Rohdemann, M.; Landes, T.; Engel, K.; Banas, R.; Heinz, A.; Müller, C.A. Changes in Nutrition-Related Behaviors in Alcohol-Dependent Patients After Outpatient Detoxification: The Role of Chocolate. Subst. Use Misuse 2016, 51, 545–552. [Google Scholar] [CrossRef] [PubMed]
- Avena, N.M.; Rada, P.; Hoebel, B.G. Sugar and fat bingeing have notable differences in addictive-like behavior. J. Nutr. 2009, 139, 623–628. [Google Scholar] [CrossRef] [PubMed]
- Bocarsly, M.E.; Berner, L.A.; Hoebel, B.G.; Avena, N.M. Rats that binge eat fat-rich food do not show somatic signs or anxiety associated with opiate-like withdrawal: Implications for nutrient-specific food addiction behaviors. Physiol. Behav. 2011, 104, 865–872. [Google Scholar] [CrossRef] [PubMed]
- Sirohi, S.; Van Cleef, A.; Davis, J.F. Binge-like intake of HFD attenuates alcohol intake in rats. Physiol. Behav. 2017, 178, 187–195. [Google Scholar] [CrossRef] [PubMed]
- Sirohi, S.; Van Cleef, A.; Davis, J.F. Intermittent access to a nutritionally complete high-fat diet attenuates alcohol drinking in rats. Pharmacol. Biochem. Behav. 2017, 153, 105–115. [Google Scholar] [CrossRef] [PubMed]
- Davis, J.F.; Melhorn, S.J.; Shurdak, J.D.; Heiman, J.U.; Tschöp, M.H.; Clegg, D.J.; Benoit, S.C. Comparison of hydrogenated vegetable shortening and nutritionally complete high-fat diet on limited access-binge behavior in rats. Physiol. Behav. 2007, 92, 924–930. [Google Scholar] [CrossRef] [PubMed]
- Sirohi, S.; Skripnikova, E.; Davis, J.F. Vertical Sleeve Gastrectomy Attenuates Hedonic Feeding Without Impacting Alcohol Drinking in Rats. Obesity 2019, 27, 603–611. [Google Scholar] [CrossRef] [PubMed]
- Blanco-Gandía, M.C.; Ledesma, J.C.; Aracil-Fernández, A.; Navarrete, F.; Montagud-Romero, S.; Aguilar, M.A.; Manzanares, J.; Miñarro, J.; Rodríguez-Arias, M. The rewarding effects of ethanol are modulated by binge eating of a high-fat diet during adolescence. Neuropharmacology 2017, 121, 219–230. [Google Scholar] [CrossRef] [PubMed]
- Vadnie, C.A.; Park, J.H.; Abdel Gawad, N.; Ho, A.M.C.; Hinton, D.J.; Choi, D.-S. Gut-brain peptides in corticostriatal-limbic circuitry and alcohol use disorders. Front. Neurosci. 2014, 8, 288. [Google Scholar] [CrossRef] [PubMed]
- Jerlhag, E.; Egecioglu, E.; Landgren, S.; Salomé, N.; Heilig, M.; Moechars, D.; Datta, R.; Perrissoud, D.; Dickson, S.L.; Engel, J.A. Requirement of central ghrelin signaling for alcohol reward. Proc. Natl. Acad. Sci. USA 2009, 106, 11318–11323. [Google Scholar] [CrossRef] [PubMed]
- Leggio, L.; Ferrulli, A.; Cardone, S.; Nesci, A.; Miceli, A.; Malandrino, N.; Capristo, E.; Canestrelli, B.; Monteleone, P.; Kenna, G.A.; et al. Ghrelin system in alcohol-dependent subjects: Role of plasma ghrelin levels in alcohol drinking and craving. Addict. Biol. 2012, 17, 452–464. [Google Scholar] [CrossRef] [PubMed]
- Jerlhag, E.; Ivanoff, L.; Vater, A.; Engel, J.A. Peripherally circulating ghrelin does not mediate alcohol-induced reward and alcohol intake in rodents. Alcohol. Clin. Exp. Res. 2014, 38, 959–968. [Google Scholar] [CrossRef] [PubMed]
- Rommelfanger, K.S.; Mitrano, D.A.; Smith, Y.; Weinshenker, D. Light and Electron Microscopic Localization of Alpha-1 Adrenergic Receptor Immunoreactivity in the Rat Striatum and Ventral Midbrain. Neuroscience 2009, 158, 1530–1540. [Google Scholar] [CrossRef] [PubMed]
- Rainbow, T.C.; Biegon, A. Quantitative autoradiography of [3H] prazosin binding sites in rat forebrain. Neurosci. Lett. 1983, 40, 221–226. [Google Scholar] [CrossRef]
- Mitrano, D.A.; Schroeder, J.P.; Smith, Y.; Cortright, J.J.; Bubula, N.; Vezina, P.; Weinshenker, D. Alpha-1 Adrenergic Receptors are Localized on Presynaptic Elements in the Nucleus Accumbens and Regulate Mesolimbic Dopamine Transmission. Neuropsychopharmacology 2012, 37, 2161–2172. [Google Scholar] [CrossRef] [PubMed]
- Sommermeyer, H.; Frielingsdorf, J.; Knorr, A. Effects of prazosin on the dopaminergic neurotransmission in rat brain. Eur. J. Pharmacol. 1995, 276, 267–270. [Google Scholar] [CrossRef]
- Rasmussen, D.D.; Alexander, L.L.; Raskind, M.A.; Froehlich, J.C. The alpha1-adrenergic receptor antagonist, prazosin, reduces alcohol drinking in alcohol-preferring (P) rats. Alcohol. Clin. Exp. Res. 2009, 33, 264–272. [Google Scholar] [CrossRef] [PubMed]
- Simpson, T.L.; Saxon, A.J.; Meredith, C.W.; Malte, C.A.; McBride, B.; Ferguson, L.C.; Gross, C.A.; Hart, K.L.; Raskind, M. A pilot trial of the alpha-1 adrenergic antagonist, prazosin, for alcohol dependence. Alcohol. Clin. Exp. Res. 2009, 33, 255–263. [Google Scholar] [CrossRef] [PubMed]
- Davis, J.F.; Tracy, A.L.; Schurdak, J.D.; Tschöp, M.H.; Lipton, J.W.; Clegg, D.J.; Benoit, S.C. Exposure to elevated levels of dietary fat attenuates psychostimulant reward and mesolimbic dopamine turnover in the rat. Behav. Neurosci. 2008, 122, 1257–1263. [Google Scholar] [CrossRef] [PubMed]
- Baik, J.-H. Dopamine Signaling in reward-related behaviors. Front. Neural Circuits 2013, 7, 152. [Google Scholar] [CrossRef] [PubMed]
- Young, E.A.; Dreumont, S.E.; Cunningham, C.L. Role of nucleus accumbens dopamine receptor subtypes in the learning and expression of alcohol-seeking behavior. Neurobiol. Learn. Mem. 2014, 108, 28–37. [Google Scholar] [CrossRef] [PubMed]
- Fanelli, R.R.; Robinson, D.L. Dopamine D1 receptor blockade impairs alcohol seeking without reducing dorsal striatal activation to cues of alcohol availability. Brain Behav. 2015, 5, e00305. [Google Scholar] [CrossRef] [PubMed]
- Centonze, D.; Grande, C.; Usiello, A.; Gubellini, P.; Erbs, E.; Martin, A.B.; Pisani, A.; Tognazzi, N.; Bernardi, G.; Moratalla, R.; et al. Receptor subtypes involved in the presynaptic and postsynaptic actions of dopamine on striatal interneurons. J. Neurosci. 2003, 23, 6245–6254. [Google Scholar] [CrossRef] [PubMed] [Green Version]
- Blomeley, C.P.; Cains, S.; Smith, R.; Bracci, E. Ethanol Affects Striatal Interneurons Directly and Projection Neurons Through a Reduction in Cholinergic Tone. Neuropsychopharmacology 2011, 36, 1033–1046. [Google Scholar] [CrossRef] [PubMed]
- Bolam, J.P.; Ellender, T.J. Histamine and the striatum. Neuropsychopharmacology 2016, 106, 74–84. [Google Scholar] [CrossRef] [PubMed] [Green Version]
- Strakhova, M.I.; Nikkel, A.L.; Manelli, A.M.; Hsieh, G.C.; Esbenshade, T.A.; Brioni, J.D.; Bitner, R.S. Localization of histamine H4 receptors in the central nervous system of human and rat. Brain Res. 2009, 1250, 41–48. [Google Scholar] [CrossRef] [PubMed]
- Ellender, T.J.; Huerta-Ocampo, I.; Deisseroth, K.; Capogna, M.; Bolam, J.P. Differential Modulation of Excitatory and Inhibitory Striatal Synaptic Transmission by Histamine. J. Neurosci. 2011, 31, 15340–15351. [Google Scholar] [CrossRef] [PubMed]
- Srikant, C.B.; Patel, Y.C. Somatostatin receptors: Identification and characterization in rat brain membranes. Proc. Natl. Acad. Sci. USA 1981, 78, 3930–3934. [Google Scholar] [CrossRef] [PubMed] [Green Version]
- Rodríguez-Sánchez, M.N.; Puebla, L.; López-Sañudo, S.; Rodríguez-Martín, E.; Martín-Espinosa, A.; Rodríguez-Pena, M.S.; Juarranz, M.G.; Arilla, E. Dopamine enhances somatostatin receptor-mediated inhibition of adenylate cyclase in rat striatum and hippocampus. J. Neurosci. Res. 1997, 48, 238–248. [Google Scholar] [CrossRef]
- Hathway, G.J.; Humphrey, P.P.A.; Kendrick, K.M. Evidence that somatostatin sst2 receptors mediate striatal dopamine release. Br. J. Pharm. 1999, 128, 1346–1352. [Google Scholar] [CrossRef] [PubMed] [Green Version]
- Lim, S.A.O.; Kang, U.J.; McGehee, D.S. Striatal cholinergic interneuron regulation and circuit effects. Front. Synaptic Neurosci. 2014, 6, 22. [Google Scholar] [CrossRef] [PubMed] [Green Version]
- Lester, D.B.; Rogers, T.D.; Blaha, C.D. Acetylcholine–Dopamine Interactions in the Pathophysiology and Treatment of CNS Disorders. CNS Neurosci. Ther. 2010, 16, 137–162. [Google Scholar] [CrossRef] [PubMed]
- Shin, J.H.; Adrover, M.F.; Alvarez, V.A. Distinctive Modulation of Dopamine Release in the Nucleus Accumbens Shell Mediated by Dopamine and Acetylcholine Receptors. J. Neurosci. 2017, 37, 11166–11180. [Google Scholar] [CrossRef] [PubMed]
- Tarren, J.R.; Lester, H.A.; Belmer, A.; Bartlett, S.E. Acute Ethanol Administration Upregulates Synaptic α4-Subunit of Neuronal Nicotinic Acetylcholine Receptors within the Nucleus Accumbens and Amygdala. Front. Mol. Neurosci. 2017, 10, 338. [Google Scholar] [CrossRef] [PubMed]
- Tizabi, Y.; Getachew, B.; Davila-Garcia, M.; Taylor, R.E. Alcohol preference: Association with reduced striatal nicotinic receptors. Alcohol Alcohol. 2001, 36, 318–322. [Google Scholar] [CrossRef] [PubMed] [Green Version]
- Pietzak, E.R.; Wilce, P.A.; Shanley, B.C. The effect of chronic ethanol consumption on muscarinic receptors in rat brain. Neurochem. Int. 1988, 12, 447–452. [Google Scholar] [CrossRef]
- Berizzi, A.E.; Perry, C.J.; Shackleford, D.M.; Lindsley, C.W.; Jones, C.K.; Chen, N.A.; Sexton, P.M.; Christopoulos, A.; Langmead, C.J.; Lawrence, A.J. Muscarinic M5 receptors modulate ethanol seeking in rats. Neuropsychopharmacology 2018, 43, 1510–1517. [Google Scholar] [CrossRef] [PubMed] [Green Version]
- Shin, J.H.; Adrover, M.F.; Wess, J.; Alvarez, V.A. Muscarinic regulation of dopamine and glutamate transmission in the nucleus accumbens. Proc. Natl. Acad. Sci. USA 2015, 112, 8124–8129. [Google Scholar] [CrossRef] [PubMed] [Green Version]
- Blomqvist, O.; Engel, J.A.; Nissbrandt, H.; Söderpalm, B. The mesolimbic dopamine-activating properties of ethanol are antagonized by mecamylamine. Eur. J. Pharmacol. 1993, 249, 207–213. [Google Scholar] [CrossRef]
- Klink, R.; de Kerchove d’Exaerde, A.; Zoli, M.; Changeux, J.-P. Molecular and Physiological Diversity of Nicotinic Acetylcholine Receptors in the Midbrain Dopaminergic Nuclei. J. Neurosci. 2001, 21, 1452–1463. [Google Scholar] [CrossRef] [PubMed]
- Hendrickson, L.M.; Guildford, M.J.; Tapper, A.R. Neuronal Nicotinic Acetylcholine Receptors: Common Molecular Substrates of Nicotine and Alcohol Dependence. Front. Psychiatry 2013, 4, 29. [Google Scholar] [CrossRef] [PubMed] [Green Version]
- Chatterjee, S.; Steensland, P.; Simms, J.A.; Holgate, J.; Coe, J.W.; Hurst, R.S.; Shaffer, C.L.; Lowe, J.; Rollema, H.; Bartlett, S.E. Partial agonists of the α3β4* neuronal nicotinic acetylcholine receptor reduce ethanol consumption and seeking in rats. Neuropsychopharmacology 2011, 36, 603–615. [Google Scholar] [CrossRef] [PubMed] [Green Version]
- Howard, R.J.; Trudell, J.R.; Harris, R.A. Seeking Structural Specificity: Direct Modulation of Pentameric Ligand-Gated Ion Channels by Alcohols and General Anesthetics. Pharm. Rev. 2014, 66, 396–412. [Google Scholar] [CrossRef] [PubMed] [Green Version]
- Blednov, Y.A.; Benavidez, J.M.; Black, M.; Leiter, C.R.; Osterndorff-Kahanek, E.; Johnson, D.; Borghese, C.M.; Hanrahan, J.R.; Johnston, G.A.R.; Chebib, M.; et al. GABAA Receptors Containing ρ1 Subunits Contribute to In Vivo Effects of Ethanol in Mice. PLoS ONE 2014, 9, e85525. [Google Scholar] [CrossRef] [PubMed]
- Xuei, X.; Flury-Wetherill, L.; Dick, D.; Goate, A.; Tischfield, J.; Nurnberger, J.; Schuckit, M.; Kramer, J.; Kuperman, S.; Hesselbrock, V.; et al. GABRR1 and GABRR2, encoding the GABA-A receptor subunits ρ1 and ρ2, are associated with alcohol dependence. Am. J. Med. Genet. B Neuropsychiatr Genet. 2010, 153, 418–427. [Google Scholar] [CrossRef] [PubMed] [Green Version]
- Ciccocioppo, R.; Panocka, I.; Pompei, P.; de Caro, G.; Massi, M. Selective agonists at NK3 tachykinin receptors inhibit alcohol intake in Sardinian alcohol-preferring rats. Brain Res. Bull. 1994, 33, 71–77. [Google Scholar] [CrossRef]
- Foroud, T.; Wetherill, L.F.; Kramer, J.; Tischfield, J.A.; Nurnberger, J.I.; Schuckit, M.A.; Xuei, X.; Edenberg, H.J. The Tachykinin Receptor 3 Is Associated with Alcohol and Cocaine Dependence. Alcohol Clin. Exp. Res. 2008, 32, 1023–1030. [Google Scholar] [CrossRef] [PubMed]
- Sirohi, S.; Van Cleef, A.; Davis, J.F. Patterned feeding induces neuroendocrine, behavioral and genetic changes that promote palatable food intake. Int. J. Obes. 2017, 41, 412–419. [Google Scholar] [CrossRef] [PubMed]
- Volkow, N.D.; Wang, G.J.; Fowler, J.S.; Tomasi, D.; Baler, R. Food and drug reward: Overlapping circuits in human obesity and addiction. Curr. Top. Behav. Neurosci. 2012, 11, 1–24. [Google Scholar] [PubMed] [Green Version]
- Blum, K.; Thanos, P.K.; Wang, G.-J.; Febo, M.; Demetrovics, Z.; Modestino, E.J.; Braverman, E.R.; Baron, D.; Badgaiyan, R.D.; Gold, M.S. The Food and Drug Addiction Epidemic: Targeting Dopamine Homeostasis. Curr. Pharm. Des. 2018, 23, 6050–6061. [Google Scholar] [CrossRef] [PubMed]
- Avena, N.M.; Rada, P.; Hoebel, B.G. Evidence for sugar addiction: Behavioral and neurochemical effects of intermittent, excessive sugar intake. Neurosci. Biobehav. Rev. 2008, 32, 20–39. [Google Scholar] [CrossRef] [PubMed] [Green Version]
- Dencker, D.; Molander, A.; Thomsen, M.; Schlumberger, C.; Wortwein, G.; Weikop, P.; Benveniste, H.; Volkow, N.D.; Fink-Jensen, A. Ketogenic Diet Suppresses Alcohol Withdrawal Syndrome in Rats. Alcohol. Clin. Exp. Res. 2017, 42, 270–277. [Google Scholar] [CrossRef] [PubMed]
- Alcoholics Anonymous World Services. Living Sober; Alcoholics Anonymous World Services, Inc.: New York, NY, USA, 2007. [Google Scholar]
- Markowitz, J.S.; McRae, A.L.; Sonne, S.C. Oral nutritional supplementation for the alcoholic patient: A brief overview. Ann. Clin. Psychiatry 2000, 12, 153–158. [Google Scholar] [CrossRef] [PubMed]
- Koehn, V.; Burnand, B.; Niquille, M.; Paccaud, F.; Magnenat, P.; Yersin, B. Prevalence of malnutrition in alcoholic and nonalcoholic medical inpatients: A comparative anthropometric study. J. Parenter. Enter. Nutr. 1993, 17, 35–40. [Google Scholar] [CrossRef] [PubMed]
- Lieber, C.S. Relationships between nutrition, alcohol use, and liver disease. Alcohol research & health: The J. Natl. Inst. Alcohol Abus. Alcohol. 2003, 27, 220–231. [Google Scholar]
- Rash, C.J.; Petry, N.M. Contingency management treatments are equally efficacious for both sexes in intensive outpatient settings. Exp. Clin. Neuropsychopharmacology 2015, 23, 369–376. [Google Scholar] [CrossRef] [PubMed]
- Venniro, M.; Caprioli, D.; Zhang, M.; Whitaker, L.R.; Zhang, S.; Warren, B.L.; Cifani, C.; Marchant, N.J.; Yizhar, O.; Bossert, J.M.; et al. The Anterior Insular Cortex→Central Amygdala Glutamatergic Pathway Is Critical to Relapse after Contingency Management. Neuron 2017, 96, 414–427. [Google Scholar] [CrossRef] [PubMed] [Green Version]


| Adrenergic Receptors | Genes |
| Alpha Adrenergic Receptors | Adra1a, Adra1d, Adra2a |
| Beta Adrenergic Receptors | Adrb2, Adrb3 |
| Cholinergic Receptors | |
| Muscarinic Receptors | Chrm1, Chrm4, Chrm5 |
| Nicotinic Receptors | Chrna3, Chrna4, Chrna5, Chrna6, Chrna7, Chrne |
| Dopaminergic Receptors | Drd1, Drd2, Drd5 |
| GABAergic Receptors | |
| GABAC Receptors | Gabrr1, Gabrr2 |
| GABAB Receptors | Gabbr1, Gabbr2 |
| GABAA Receptors | Gabra1, Gabra2, Gabra4, Gabra5, Gabra6, Gabrb1, Gabrb3, Gabrd, Gabre, Gabrg1, Gabrg2, Gabrg3, Gabrq |
| Glutamate Receptors | |
| AMPA Receptors | Gria1, Gria2, Gria3 |
| Kainate Receptors | Grik1, Grik2, Grik4, Grik5 |
| NMDA Receptors | Grin1, Grin2a, Grin2b, Grin2c |
| Metabotropic Receptors | Grm1, Grm3, Grm4, Grm5, Grm6, Grm7, Grm8 |
| Serotonin Receptors | Htr1a, Htr1b, Htr1d, Htr1f, Htr2a, Htr2c, Htr3a, Htr4, Htr7 |
| Other Neurotransmitter Receptors | |
| Vasopressin Receptor | Avpr1a, Avpr1b |
| Histamine Receptors | Hrh1, Hrh4 |
| Neuropeptide Y Receptors | Npy2r, Npy5r |
| Somatostatin Receptors | Sstr1, Sstr2, Sstr4 |
| Substance P (Neurokinin) Receptors | Tacr1, Tacr2, Tacr3 |
| Other Neurotransmitter Receptors | Brs3, Cckbr, Cnr1, Gcgr, Grpr, Hcrtr2, Ntsr2, Oxtr, Prokr2 (Gpr73l1), Sctr, Tspo (Bzrp) |
| # | Unigene | Refseq | Symbol | Description | Fold Regulation | p Value |
|---|---|---|---|---|---|---|
| 1 | Rn.9991 | NM_017191 | Adra1a | Adrenergic, alpha-1A-, receptor | −1.0 | 0.877 |
| 2 | Rn.11314 | NM_024483 | Adra1d | Adrenergic, alpha-1D-, receptor | −1.8 | 0.236 |
| 3 | Rn.170171 | NM_012739 | Adra2a | Adrenergic, alpha-2A-, receptor | −1.0 | 0.887 |
| 4 | Rn.10206 | NM_012492 | Adrb2 | Adrenergic, beta-2-, receptor, surface | −1.1 | 0.649 |
| 5 | Rn.32282 | NM_053019 | Avpr1a | Arginine vasopressin receptor 1A | 1.1 | 0.403 |
| 6 | Rn.10096 | NM_017205 | Avpr1b | Arginine vasopressin receptor 1B | −1.3 | 0.455 |
| 7 | Rn.86415 | NM_152845 | Brs3 | Bombesin-like receptor 3 | 1.4 | 0.230 |
| 8 | Rn.90997 | NM_013165 | Cckbr | Cholecystokinin B receptor | 1.5 | 0.341 |
| 9 | Rn.119395 | NM_080773 | Chrm1 | Cholinergic receptor, muscarinic 1 | 1.9 | 0.050 |
| 10 | Rn.10676 | NM_031547 | Chrm4 | Cholinergic receptor, muscarinic 4 | 1.7 | 0.005 |
| 11 | Rn.44293 | NM_017362 | Chrm5 | Cholinergic receptor, muscarinic 5 | 1.2 | 0.296 |
| 12 | Rn.10996 | NM_052805 | Chrna3 | Cholinergic receptor, nicotinic, alpha 3 | −1.1 | 0.548 |
| 13 | Rn.9697 | NM_024354 | Chrna4 | Cholinergic receptor, nicotinic, alpha 4 | −1.2 | 0.618 |
| 14 | Rn.40125 | NM_017078 | Chrna5 | Cholinergic receptor, nicotinic, alpha 5 | −1.6 | 0.588 |
| 15 | Rn.9696 | NM_057184 | Chrna6 | Cholinergic receptor, nicotinic, alpha 6 | −1.4 | 0.573 |
| 16 | Rn.9698 | NM_012832 | Chrna7 | Cholinergic receptor, nicotinic, alpha 7 | 1.3 | 0.283 |
| 17 | Rn.10301 | NM_017194 | Chrne | Cholinergic receptor, nicotinic, epsilon | 1.1 | 0.405 |
| 18 | Rn.89774 | NM_012784 | Cnr1 | Cannabinoid receptor 1 (brain) | 1.1 | 0.358 |
| 19 | Rn.24039 | NM_012546 | Drd1 | Dopamine receptor D1A | 1.6 | 0.066 |
| 20 | Rn.87299 | NM_012547 | Drd2 | Dopamine receptor D2 | −1.1 | 0.672 |
| 21 | Rn.138110 | NM_012768 | Drd5 | Dopamine receptor D5 | 1.1 | 0.413 |
| 22 | Rn.30059 | NM_031028 | Gabbr1 | Gamma-aminobutyric acid (GABA) B receptor 1 | 1.1 | 0.498 |
| 23 | Rn.162814 | NM_031802 | Gabbr2 | Gamma-aminobutyric acid (GABA) B receptor 2 | −1.1 | 0.525 |
| 24 | Rn.28463 | NM_183326 | Gabra1 | Gamma-aminobutyric acid (GABA) A receptor, alpha 1 | −1.1 | 0.443 |
| 25 | Rn.48180 | NM_001135779 | Gabra2 | Gamma-aminobutyric acid (GABA-A) receptor, subunit alpha 2 | 1.3 | 0.020 |
| 26 | Rn.81205 | NM_080587 | Gabra4 | Gamma-aminobutyric acid (GABA) A receptor, alpha 4 | 1.1 | 0.759 |
| 27 | Rn.10368 | NM_017295 | Gabra5 | Gamma-aminobutyric acid (GABA) A receptor, alpha 5 | 1.2 | 0.254 |
| 28 | Rn.29890 | NM_021841 | Gabra6 | Gamma-aminobutyric acid (GABA) A receptor, alpha 6 | −2.2 | 0.359 |
| 29 | Rn.207157 | NM_012956 | Gabrb1 | Gamma-aminobutyric acid (GABA) A receptor, beta 1 | 1.3 | 0.010 |
| 30 | Rn.233948 | NM_017065 | Gabrb3 | Gamma-aminobutyric acid (GABA) A receptor, beta 3 | 1.3 | 0.045 |
| 31 | Rn.10927 | NM_017289 | Gabrd | Gamma-aminobutyric acid (GABA) A receptor, delta | −1.3 | 0.676 |
| 32 | Rn.54455 | NM_023091 | Gabre | Gamma-aminobutyric acid (GABA) A receptor, epsilon | 1.3 | 0.357 |
| 33 | Rn.10366 | NM_080586 | Gabrg1 | Gamma-aminobutyric acid (GABA) A receptor, gamma 1 | 1.1 | 0.140 |
| 34 | Rn.230132 | NM_183327 | Gabrg2 | Gamma-aminobutyric acid (GABA) A receptor, gamma 2 | 1.2 | 0.040 |
| 35 | Rn.10369 | NM_024370 | Gabrg3 | Gamma-aminobutyric acid (GABA) A receptor, gamma 3 | 1.1 | 0.554 |
| 36 | Rn.81067 | NM_031733 | Gabrq | Gamma-aminobutyric acid (GABA) receptor, theta | 1.4 | 0.098 |
| 37 | Rn.33552 | NM_017291 | Gabrr1 | Gamma-aminobutyric acid (GABA) receptor, rho 1 | −1.1 | 0.617 |
| 38 | Rn.48659 | NM_017292 | Gabrr2 | Gamma-aminobutyric acid (GABA) receptor, rho 2 | −1.2 | 0.325 |
| 39 | Rn.11225 | NM_172092 | Gcgr | Glucagon receptor | −1.1 | 0.666 |
| 40 | Rn.29971 | NM_031608 | Gria1 | Glutamate receptor, ionotropic, AMPA 1 | 1.2 | 0.106 |
| 41 | Rn.91361 | NM_017261 | Gria2 | Glutamate receptor, ionotropic, AMPA 2 | 1.1 | 0.015 |
| 42 | Rn.74049 | NM_032990 | Gria3 | Glutamate receptor, ionotrophic, AMPA 3 | −1.1 | 0.721 |
| 43 | Rn.10449 | NM_017241 | Grik1 | Glutamate receptor, ionotropic, kainate 1 | 1.0 | 0.702 |
| 44 | Rn.87696 | NM_019309 | Grik2 | Glutamate receptor, ionotropic, kainate 2 | 1.1 | 0.082 |
| 45 | Rn.10049 | NM_012572 | Grik4 | Glutamate receptor, ionotropic, kainate 4 | −1.0 | 0.670 |
| 46 | Rn.74042 | NM_031508 | Grik5 | Glutamate receptor, ionotropic, kainate 5 | 1.2 | 0.059 |
| 47 | Rn.9840 | NM_017010 | Grin1 | Glutamate receptor, ionotropic, N-methyl D-aspartate 1 | 1.1 | 0.254 |
| 48 | Rn.9710 | NM_012573 | Grin2a | Glutamate receptor, ionotropic, N-methyl D-aspartate 2A | −1.0 | 0.888 |
| 49 | Rn.9711 | NM_012574 | Grin2b | Glutamate receptor, ionotropic, N-methyl D-aspartate 2B | 1.1 | 0.342 |
| 50 | Rn.9709 | NM_012575 | Grin2c | Glutamate receptor, ionotropic, N-methyl D-aspartate 2C | 1.0 | 0.971 |
| 51 | Rn.87787 | NM_017011 | Grm1 | Glutamate receptor, metabotropic 1 | 1.1 | 0.073 |
| 52 | Rn.41715 | NM_001105712 | Grm3 | Glutamate receptor, metabotropic 3 | −1.5 | 0.147 |
| 53 | Rn.89046 | NM_022666 | Grm4 | Glutamate receptor, metabotropic 4 | −1.1 | 0.724 |
| 54 | Rn.29972 | NM_017012 | Grm5 | Glutamate receptor, metabotropic 5 | 1.1 | 0.356 |
| 55 | Rn.44615 | NM_022920 | Grm6 | Glutamate receptor, metabotropic 6 | −1.1 | 0.753 |
| 56 | Rn.10409 | NM_031040 | Grm7 | Glutamate receptor, metabotropic 7 | 1.2 | 0.055 |
| 57 | Rn.44420 | NM_022202 | Grm8 | Glutamate receptor, metabotropic 8 | −1.1 | 0.312 |
| 58 | Rn.10316 | NM_012706 | Grpr | Gastrin releasing peptide receptor | 1.6 | 0.136 |
| 59 | Rn.9893 | NM_013074 | Hcrtr2 | Hypocretin (orexin) receptor 2 | 1.3 | 0.159 |
| 60 | Rn.81032 | NM_017018 | Hrh1 | Histamine receptor H 1 | 1.3 | 0.272 |
| 61 | Rn.162272 | NM_131909 | Hrh4 | Histamine receptor H4 | −1.7 | 0.428 |
| 62 | Rn.44486 | NM_012585 | Htr1a | 5-hydroxytryptamine (serotonin) receptor 1A | −1.1 | 0.723 |
| 63 | Rn.138109 | NM_022225 | Htr1b | 5-hydroxytryptamine (serotonin) receptor 1B | 1.0 | 0.796 |
| 64 | Rn.34834 | NM_012852 | Htr1d | 5-Hydroxytryptamine (serotonin) receptor 1D | 1.0 | 0.893 |
| 65 | Rn.44301 | NM_021857 | Htr1f | 5-hydroxytryptamine (serotonin) receptor 1F | −1.1 | 0.630 |
| 66 | Rn.10294 | NM_017254 | Htr2a | 5-hydroxytryptamine (serotonin) receptor 2A | 1.2 | 0.682 |
| 67 | Rn.9935 | NM_012765 | Htr2c | 5-hydroxytryptamine (serotonin) receptor 2C | −1.0 | 0.949 |
| 68 | Rn.55109 | NM_024394 | Htr3a | 5-hydroxytryptamine (serotonin) receptor 3a | −1.2 | 0.444 |
| 69 | Rn.10094 | NM_012853 | Htr4 | 5-hydroxytryptamine (serotonin) receptor 4 | 1.1 | 0.051 |
| 70 | Rn.87132 | NM_022938 | Htr7 | 5-hydroxytryptamine (serotonin) receptor 7 | 1.0 | 0.409 |
| 71 | Rn.64505 | NM_023968 | Npy2r | Neuropeptide Y receptor Y2 | 1.7 | 0.108 |
| 72 | Rn.10532 | NM_012869 | Npy5r | Neuropeptide Y receptor Y5 | 1.1 | 0.691 |
| 73 | Rn.127792 | NM_022695 | Ntsr2 | Neurotensin receptor 2 | 1.0 | 0.849 |
| 74 | Rn.6841 | NM_012871 | Oxtr | Oxytocin receptor | 1.4 | 0.118 |
| 75 | Rn.82760 | NM_138978 | Prokr2 | Prokineticin receptor 2 | 1.4 | 0.234 |
| 76 | Rn.32256 | NM_031115 | Sctr | Secretin receptor | −1.2 | 0.630 |
| 77 | Rn.42915 | NM_012719 | Sstr1 | Somatostatin receptor 1 | 1.2 | 0.258 |
| 78 | Rn.9929 | NM_019348 | Sstr2 | Somatostatin receptor 2 | 1.0 | 0.762 |
| 79 | Rn.9936 | NM_013036 | Sstr4 | Somatostatin receptor 4 | 1.1 | 0.417 |
| 80 | Rn.89609 | NM_012667 | Tacr1 | Tachykinin receptor 1 | 1.1 | 0.215 |
| 81 | Rn.202846 | NM_080768 | Tacr2 | Tachykinin receptor 2 | −1.8 | 0.333 |
| 82 | Rn.9702 | NM_017053 | Tacr3 | Tachykinin receptor 3 | 1.2 | 0.286 |
| 83 | Rn.1820 | NM_012515 | Tspo | Translocator protein | 1.1 | 0.489 |
| # | Unigene | Refseq | Symbol | Description | Fold Regulation | p Value |
|---|---|---|---|---|---|---|
| 1 | Rn.9991 | NM_017191 | Adra1a | Adrenergic, alpha-1A-, receptor | 1.2 | 0.228 |
| 2 | Rn.11314 | NM_024483 | Adra1d | Adrenergic, alpha-1D-, receptor | 1.2 | 0.889 |
| 3 | Rn.170171 | NM_012739 | Adra2a | Adrenergic, alpha-2A-, receptor | 1.1 | 0.931 |
| 4 | Rn.10206 | NM_012492 | Adrb2 | Adrenergic, beta-2-, receptor, surface | −1.2 | 0.208 |
| 5 | Rn.10100 | NM_013108 | Adrb3 | Adrenergic, beta-3-, receptor | −1.4 | 0.182 |
| 6 | Rn.32282 | NM_053019 | Avpr1a | Arginine vasopressin receptor 1A | −1.1 | 0.613 |
| 7 | Rn.10096 | NM_017205 | Avpr1b | Arginine vasopressin receptor 1B | 1.0 | 0.865 |
| 8 | Rn.86415 | NM_152845 | Brs3 | Bombesin-like receptor 3 | −1.4 | 0.597 |
| 9 | Rn.90997 | NM_013165 | Cckbr | Cholecystokinin B receptor | 1.1 | 0.427 |
| 10 | Rn.119395 | NM_080773 | Chrm1 | Cholinergic receptor, muscarinic 1 | 1.1 | 0.041 |
| 11 | Rn.10676 | NM_031547 | Chrm4 | Cholinergic receptor, muscarinic 4 | −1.0 | 0.857 |
| 12 | Rn.44293 | NM_017362 | Chrm5 | Cholinergic receptor, muscarinic 5 | −1.2 | 0.746 |
| 13 | Rn.10996 | NM_052805 | Chrna3 | Cholinergic receptor, nicotinic, alpha 3 | 1.0 | 0.755 |
| 14 | Rn.9697 | NM_024354 | Chrna4 | Cholinergic receptor, nicotinic, alpha 4 | 1.1 | 0.287 |
| 15 | Rn.40125 | NM_017078 | Chrna5 | Cholinergic receptor, nicotinic, alpha 5 | 1.2 | 0.746 |
| 16 | Rn.9696 | NM_057184 | Chrna6 | Cholinergic receptor, nicotinic, alpha 6 | 1.1 | 0.347 |
| 17 | Rn.9698 | NM_012832 | Chrna7 | Cholinergic receptor, nicotinic, alpha 7 | 1.1 | 0.482 |
| 18 | Rn.10301 | NM_017194 | Chrne | Cholinergic receptor, nicotinic, epsilon | 1.1 | 0.172 |
| 19 | Rn.89774 | NM_012784 | Cnr1 | Cannabinoid receptor 1 (brain) | 1.2 | 0.286 |
| 20 | Rn.24039 | NM_012546 | Drd1 | Dopamine receptor D1A | 1.1 | 0.953 |
| 21 | Rn.87299 | NM_012547 | Drd2 | Dopamine receptor D2 | −1.0 | 0.852 |
| 22 | Rn.138110 | NM_012768 | Drd5 | Dopamine receptor D5 | 1.1 | 0.797 |
| 23 | Rn.30059 | NM_031028 | Gabbr1 | Gamma-aminobutyric acid (GABA) B receptor 1 | 1.0 | 0.662 |
| 24 | Rn.162814 | NM_031802 | Gabbr2 | Gamma-aminobutyric acid (GABA) B receptor 2 | 1.2 | 0.210 |
| 25 | Rn.28463 | NM_183326 | Gabra1 | Gamma-aminobutyric acid (GABA) A receptor, alpha 1 | 1.1 | 0.646 |
| 26 | Rn.48180 | NM_001135779 | Gabra2 | Gamma-aminobutyric acid (GABA-A) receptor, subunit alpha 2 | 1.1 | 0.741 |
| 27 | Rn.81205 | NM_080587 | Gabra4 | Gamma-aminobutyric acid (GABA) A receptor, alpha 4 | −1.0 | 0.961 |
| 28 | Rn.10368 | NM_017295 | Gabra5 | Gamma-aminobutyric acid (GABA) A receptor, alpha 5 | 1.1 | 0.460 |
| 29 | Rn.29890 | NM_021841 | Gabra6 | Gamma-aminobutyric acid (GABA) A receptor, alpha 6 | −1.6 | 0.377 |
| 30 | Rn.207157 | NM_012956 | Gabrb1 | Gamma-aminobutyric acid (GABA) A receptor, beta 1 | 1.2 | 0.417 |
| 31 | Rn.233948 | NM_017065 | Gabrb3 | Gamma-aminobutyric acid (GABA) A receptor, beta 3 | 1.1 | 0.090 |
| 32 | Rn.10927 | NM_017289 | Gabrd | Gamma-aminobutyric acid (GABA) A receptor, delta | −1.2 | 0.440 |
| 33 | Rn.54455 | NM_023091 | Gabre | Gamma-aminobutyric acid (GABA) A receptor, epsilon | 1.2 | 0.619 |
| 34 | Rn.10366 | NM_080586 | Gabrg1 | Gamma-aminobutyric acid (GABA) A receptor, gamma 1 | 1.0 | 0.952 |
| 35 | Rn.230132 | NM_183327 | Gabrg2 | Gamma-aminobutyric acid (GABA) A receptor, gamma 2 | 1.0 | 0.631 |
| 36 | Rn.10369 | NM_024370 | Gabrg3 | Gamma-aminobutyric acid (GABA) A receptor, gamma 3 | 1.2 | 0.165 |
| 37 | Rn.81067 | NM_031733 | Gabrq | Gamma-aminobutyric acid (GABA) receptor, theta | 1.0 | 0.920 |
| 38 | Rn.33552 | NM_017291 | Gabrr1 | Gamma-aminobutyric acid (GABA) receptor, rho 1 | 1.1 | 0.728 |
| 39 | Rn.48659 | NM_017292 | Gabrr2 | Gamma-aminobutyric acid (GABA) receptor, rho 2 | −1.3 | 0.280 |
| 40 | Rn.11225 | NM_172092 | Gcgr | Glucagon receptor | −1.6 | 0.581 |
| 41 | Rn.29971 | NM_031608 | Gria1 | Glutamate receptor, ionotropic, AMPA 1 | 1.1 | 0.426 |
| 42 | Rn.91361 | NM_017261 | Gria2 | Glutamate receptor, ionotropic, AMPA 2 | 1.0 | 0.587 |
| 43 | Rn.74049 | NM_032990 | Gria3 | Glutamate receptor, ionotrophic, AMPA 3 | 1.1 | 0.475 |
| 44 | Rn.10449 | NM_017241 | Grik1 | Glutamate receptor, ionotropic, kainate 1 | −1.0 | 0.677 |
| 45 | Rn.87696 | NM_019309 | Grik2 | Glutamate receptor, ionotropic, kainate 2 | 1.2 | 0.118 |
| 46 | Rn.10049 | NM_012572 | Grik4 | Glutamate receptor, ionotropic, kainate 4 | −1.0 | 0.882 |
| 47 | Rn.74042 | NM_031508 | Grik5 | Glutamate receptor, ionotropic, kainate 5 | 1.0 | 0.886 |
| 48 | Rn.9840 | NM_017010 | Grin1 | Glutamate receptor, ionotropic, N-methyl D-aspartate 1 | 1.1 | 0.468 |
| 49 | Rn.9710 | NM_012573 | Grin2a | Glutamate receptor, ionotropic, N-methyl D-aspartate 2A | 1.1 | 0.372 |
| 50 | Rn.9711 | NM_012574 | Grin2b | Glutamate receptor, ionotropic, N-methyl D-aspartate 2B | 1.2 | 0.014 |
| 51 | Rn.9709 | NM_012575 | Grin2c | Glutamate receptor, ionotropic, N-methyl D-aspartate 2C | −1.0 | 0.888 |
| 52 | Rn.87787 | NM_017011 | Grm1 | Glutamate receptor, metabotropic 1 | 1.1 | 0.280 |
| 53 | Rn.41715 | NM_001105712 | Grm3 | Glutamate receptor, metabotropic 3 | 1.1 | 0.485 |
| 54 | Rn.89046 | NM_022666 | Grm4 | Glutamate receptor, metabotropic 4 | 1.1 | 0.301 |
| 55 | Rn.29972 | NM_017012 | Grm5 | Glutamate receptor, metabotropic 5 | 1.1 | 0.164 |
| 56 | Rn.44615 | NM_022920 | Grm6 | Glutamate receptor, metabotropic 6 | 1.3 | 0.248 |
| 57 | Rn.10409 | NM_031040 | Grm7 | Glutamate receptor, metabotropic 7 | 1.2 | 0.079 |
| 58 | Rn.44420 | NM_022202 | Grm8 | Glutamate receptor, metabotropic 8 | 1.3 | 0.494 |
| 59 | Rn.10316 | NM_012706 | Grpr | Gastrin releasing peptide receptor | 1.4 | 0.356 |
| 60 | Rn.9893 | NM_013074 | Hcrtr2 | Hypocretin (orexin) receptor 2 | −1.1 | 0.733 |
| 61 | Rn.81032 | NM_017018 | Hrh1 | Histamine receptor H 1 | −1.3 | 0.137 |
| 62 | Rn.162272 | NM_131909 | Hrh4 | Histamine receptor H4 | −1.2 | 0.654 |
| 63 | Rn.44486 | NM_012585 | Htr1a | 5-hydroxytryptamine (serotonin) receptor 1A | 1.1 | 0.575 |
| 64 | Rn.138109 | NM_022225 | Htr1b | 5-hydroxytryptamine (serotonin) receptor 1B | 1.2 | 0.360 |
| 65 | Rn.34834 | NM_012852 | Htr1d | 5-Hydroxytryptamine (serotonin) receptor 1D | −1.0 | 0.842 |
| 66 | Rn.44301 | NM_021857 | Htr1f | 5-hydroxytryptamine (serotonin) receptor 1F | 1.1 | 0.848 |
| 67 | Rn.10294 | NM_017254 | Htr2a | 5-hydroxytryptamine (serotonin) receptor 2A | 1.2 | 0.599 |
| 68 | Rn.9935 | NM_012765 | Htr2c | 5-hydroxytryptamine (serotonin) receptor 2C | −1.1 | 0.706 |
| 69 | Rn.55109 | NM_024394 | Htr3a | 5-hydroxytryptamine (serotonin) receptor 3a | −1.2 | 0.519 |
| 70 | Rn.10094 | NM_012853 | Htr4 | 5-hydroxytryptamine (serotonin) receptor 4 | 1.0 | 0.903 |
| 71 | Rn.87132 | NM_022938 | Htr7 | 5-hydroxytryptamine (serotonin) receptor 7 | −1.1 | 0.736 |
| 72 | Rn.64505 | NM_023968 | Npy2r | Neuropeptide Y receptor Y2 | −1.0 | 0.842 |
| 73 | Rn.10532 | NM_012869 | Npy5r | Neuropeptide Y receptor Y5 | −1.0 | 0.740 |
| 74 | Rn.127792 | NM_022695 | Ntsr2 | Neurotensin receptor 2 | −1.1 | 0.505 |
| 75 | Rn.6841 | NM_012871 | Oxtr | Oxytocin receptor | 1.0 | 0.874 |
| 76 | Rn.82760 | NM_138978 | Prokr2 | Prokineticin receptor 2 | 1.0 | 0.828 |
| 77 | Rn.32256 | NM_031115 | Sctr | Secretin receptor | −1.3 | 0.655 |
| 78 | Rn.42915 | NM_012719 | Sstr1 | Somatostatin receptor 1 | 1.1 | 0.761 |
| 79 | Rn.9929 | NM_019348 | Sstr2 | Somatostatin receptor 2 | 1.3 | 0.084 |
| 80 | Rn.9936 | NM_013036 | Sstr4 | Somatostatin receptor 4 | 1.2 | 0.436 |
| 81 | Rn.89609 | NM_012667 | Tacr1 | Tachykinin receptor 1 | 1.1 | 0.531 |
| 82 | Rn.202846 | NM_080768 | Tacr2 | Tachykinin receptor 2 | −1.4 | 0.297 |
| 83 | Rn.9702 | NM_017053 | Tacr3 | Tachykinin receptor 3 | 1.4 | 0.265 |
| 84 | Rn.1820 | NM_012515 | Tspo | Translocator protein | −1.1 | 0.666 |
| # | Unigene | Refseq | Symbol | Description | Fold Regulation | p Value |
|---|---|---|---|---|---|---|
| 1 | Rn.9991 | NM_017191 | Adra1a | Adrenergic, alpha-1A-, receptor | −1.3 | 0.037 |
| 2 | Rn.11314 | NM_024483 | Adra1d | Adrenergic, alpha-1D-, receptor | −5.9 | 0.037 |
| 3 | Rn.170171 | NM_012739 | Adra2a | Adrenergic, alpha-2A-, receptor | −1.7 | 0.038 |
| 4 | Rn.10206 | NM_012492 | Adrb2 | Adrenergic, beta-2-, receptor, surface | 1.0 | 0.842 |
| 5 | Rn.10100 | NM_013108 | Adrb3 | Adrenergic, beta-3-, receptor | −1.1 | 0.455 |
| 6 | Rn.32282 | NM_053019 | Avpr1a | Arginine vasopressin receptor 1A | −1.2 | 0.467 |
| 7 | Rn.10096 | NM_017205 | Avpr1b | Arginine vasopressin receptor 1B | 1.8 | 0.208 |
| 8 | Rn.86415 | NM_152845 | Brs3 | Bombesin-like receptor 3 | 1.2 | 0.615 |
| 9 | Rn.90997 | NM_013165 | Cckbr | Cholecystokinin B receptor | −1.3 | 0.321 |
| 10 | Rn.119395 | NM_080773 | Chrm1 | Cholinergic receptor, muscarinic 1 | −1.2 | 0.409 |
| 11 | Rn.10676 | NM_031547 | Chrm4 | Cholinergic receptor, muscarinic 4 | −1.1 | 0.926 |
| 12 | Rn.44293 | NM_017362 | Chrm5 | Cholinergic receptor, muscarinic 5 | 2.0 | 0.042 |
| 13 | Rn.10996 | NM_052805 | Chrna3 | Cholinergic receptor, nicotinic, alpha 3 | 3.1 | 0.040 |
| 14 | Rn.9697 | NM_024354 | Chrna4 | Cholinergic receptor, nicotinic, alpha 4 | −3.2 | 0.027 |
| 15 | Rn.40125 | NM_017078 | Chrna5 | Cholinergic receptor, nicotinic, alpha 5 | −3.5 | 0.027 |
| 16 | Rn.9696 | NM_057184 | Chrna6 | Cholinergic receptor, nicotinic, alpha 6 | −1.5 | 0.101 |
| 17 | Rn.9698 | NM_012832 | Chrna7 | Cholinergic receptor, nicotinic, alpha 7 | −1.2 | 0.220 |
| 18 | Rn.10301 | NM_017194 | Chrne | Cholinergic receptor, nicotinic, epsilon | 1.7 | 0.077 |
| 19 | Rn.89774 | NM_012784 | Cnr1 | Cannabinoid receptor 1 (brain) | 1.1 | 0.778 |
| 20 | Rn.24039 | NM_012546 | Drd1 | Dopamine receptor D1A | 1.0 | 0.755 |
| 21 | Rn.87299 | NM_012547 | Drd2 | Dopamine receptor D2 | 1.1 | 0.611 |
| 22 | Rn.138110 | NM_012768 | Drd5 | Dopamine receptor D5 | −2.0 | 0.000 |
| 23 | Rn.30059 | NM_031028 | Gabbr1 | Gamma-aminobutyric acid (GABA) B receptor 1 | −1.0 | 0.902 |
| 24 | Rn.162814 | NM_031802 | Gabbr2 | Gamma-aminobutyric acid (GABA) B receptor 2 | −2.2 | 0.002 |
| 25 | Rn.28463 | NM_183326 | Gabra1 | Gamma-aminobutyric acid (GABA) A receptor, alpha 1 | −1.1 | 0.872 |
| 26 | Rn.48180 | NM_001135779 | Gabra2 | Gamma-aminobutyric acid (GABA-A) receptor, subunit alpha 2 | 1.1 | 0.340 |
| 27 | Rn.81205 | NM_080587 | Gabra4 | Gamma-aminobutyric acid (GABA) A receptor, alpha 4 | 1.2 | 0.155 |
| 28 | Rn.10368 | NM_017295 | Gabra5 | Gamma-aminobutyric acid (GABA) A receptor, alpha 5 | −1.7 | 0.009 |
| 29 | Rn.29890 | NM_021841 | Gabra6 | Gamma-aminobutyric acid (GABA) A receptor, alpha 6 | 3.3 | 0.434 |
| 30 | Rn.207157 | NM_012956 | Gabrb1 | Gamma-aminobutyric acid (GABA) A receptor, beta 1 | 1.1 | 0.629 |
| 31 | Rn.233948 | NM_017065 | Gabrb3 | Gamma-aminobutyric acid (GABA) A receptor, beta 3 | −1.0 | 0.998 |
| 32 | Rn.10927 | NM_017289 | Gabrd | Gamma-aminobutyric acid (GABA) A receptor, delta | 1.0 | 0.652 |
| 33 | Rn.54455 | NM_023091 | Gabre | Gamma-aminobutyric acid (GABA) A receptor, epsilon | 1.4 | 0.593 |
| 34 | Rn.10366 | NM_080586 | Gabrg1 | Gamma-aminobutyric acid (GABA) A receptor, gamma 1 | 1.2 | 0.123 |
| 35 | Rn.230132 | NM_183327 | Gabrg2 | Gamma-aminobutyric acid (GABA) A receptor, gamma 2 | 1.0 | 0.941 |
| 36 | Rn.10369 | NM_024370 | Gabrg3 | Gamma-aminobutyric acid (GABA) A receptor, gamma 3 | 1.2 | 0.377 |
| 37 | Rn.81067 | NM_031733 | Gabrq | Gamma-aminobutyric acid (GABA) receptor, theta | 1.0 | 0.887 |
| 38 | Rn.33552 | NM_017291 | Gabrr1 | Gamma-aminobutyric acid (GABA) receptor, rho 1 | −1.2 | 0.250 |
| 39 | Rn.48659 | NM_017292 | Gabrr2 | Gamma-aminobutyric acid (GABA) receptor, rho 2 | −1.6 | 0.278 |
| 40 | Rn.11225 | NM_172092 | Gcgr | Glucagon receptor | 1.0 | 0.838 |
| 41 | Rn.29971 | NM_031608 | Gria1 | Glutamate receptor, ionotropic, AMPA 1 | 1.0 | 0.799 |
| 42 | Rn.91361 | NM_017261 | Gria2 | Glutamate receptor, ionotropic, AMPA 2 | 1.0 | 0.789 |
| 43 | Rn.74049 | NM_032990 | Gria3 | Glutamate receptor, ionotrophic, AMPA 3 | −1.2 | 0.241 |
| 44 | Rn.10449 | NM_017241 | Grik1 | Glutamate receptor, ionotropic, kainate 1 | −1.1 | 0.394 |
| 45 | Rn.87696 | NM_019309 | Grik2 | Glutamate receptor, ionotropic, kainate 2 | 1.2 | 0.054 |
| 46 | Rn.10049 | NM_012572 | Grik4 | Glutamate receptor, ionotropic, kainate 4 | −1.1 | 0.307 |
| 47 | Rn.74042 | NM_031508 | Grik5 | Glutamate receptor, ionotropic, kainate 5 | −1.1 | 0.345 |
| 48 | Rn.9840 | NM_017010 | Grin1 | Glutamate receptor, ionotropic, N-methyl D-aspartate 1 | −1.1 | 0.731 |
| 49 | Rn.9710 | NM_012573 | Grin2a | Glutamate receptor, ionotropic, N-methyl D-aspartate 2A | −1.2 | 0.290 |
| 50 | Rn.9711 | NM_012574 | Grin2b | Glutamate receptor, ionotropic, N-methyl D-aspartate 2B | −1.1 | 0.769 |
| 51 | Rn.9709 | NM_012575 | Grin2c | Glutamate receptor, ionotropic, N-methyl D-aspartate 2C | 1.4 | 0.314 |
| 52 | Rn.87787 | NM_017011 | Grm1 | Glutamate receptor, metabotropic 1 | 1.2 | 0.317 |
| 53 | Rn.41715 | NM_001105712 | Grm3 | Glutamate receptor, metabotropic 3 | 1.2 | 0.252 |
| 54 | Rn.89046 | NM_022666 | Grm4 | Glutamate receptor, metabotropic 4 | 1.1 | 0.290 |
| 55 | Rn.29972 | NM_017012 | Grm5 | Glutamate receptor, metabotropic 5 | 1.2 | 0.382 |
| 56 | Rn.44615 | NM_022920 | Grm6 | Glutamate receptor, metabotropic 6 | 1.1 | 0.796 |
| 57 | Rn.10409 | NM_031040 | Grm7 | Glutamate receptor, metabotropic 7 | 1.0 | 0.717 |
| 58 | Rn.44420 | NM_022202 | Grm8 | Glutamate receptor, metabotropic 8 | −1.5 | 0.093 |
| 59 | Rn.10316 | NM_012706 | Grpr | Gastrin releasing peptide receptor | 1.3 | 0.359 |
| 60 | Rn.9893 | NM_013074 | Hcrtr2 | Hypocretin (orexin) receptor 2 | 1.1 | 0.650 |
| 61 | Rn.81032 | NM_017018 | Hrh1 | Histamine receptor H 1 | −1.2 | 0.250 |
| 62 | Rn.162272 | NM_131909 | Hrh4 | Histamine receptor H4 | 2.3 | 0.044 |
| 63 | Rn.44486 | NM_012585 | Htr1a | 5-hydroxytryptamine (serotonin) receptor 1A | −1.1 | 0.674 |
| 64 | Rn.138109 | NM_022225 | Htr1b | 5-hydroxytryptamine (serotonin) receptor 1B | 1.3 | 0.122 |
| 65 | Rn.34834 | NM_012852 | Htr1d | 5-Hydroxytryptamine (serotonin) receptor 1D | 1.4 | 0.102 |
| 66 | Rn.44301 | NM_021857 | Htr1f | 5-hydroxytryptamine (serotonin) receptor 1F | 1.2 | 0.076 |
| 67 | Rn.10294 | NM_017254 | Htr2a | 5-hydroxytryptamine (serotonin) receptor 2A | −1.2 | 0.702 |
| 68 | Rn.9935 | NM_012765 | Htr2c | 5-hydroxytryptamine (serotonin) receptor 2C | −1.1 | 0.672 |
| 69 | Rn.55109 | NM_024394 | Htr3a | 5-hydroxytryptamine (serotonin) receptor 3a | −1.0 | 0.561 |
| 70 | Rn.10094 | NM_012853 | Htr4 | 5-hydroxytryptamine (serotonin) receptor 4 | 1.3 | 0.196 |
| 71 | Rn.87132 | NM_022938 | Htr7 | 5-hydroxytryptamine (serotonin) receptor 7 | 1.3 | 0.530 |
| 72 | Rn.64505 | NM_023968 | Npy2r | Neuropeptide Y receptor Y2 | 1.3 | 0.438 |
| 73 | Rn.10532 | NM_012869 | Npy5r | Neuropeptide Y receptor Y5 | −1.1 | 0.397 |
| 74 | Rn.127792 | NM_022695 | Ntsr2 | Neurotensin receptor 2 | 1.1 | 0.073 |
| 75 | Rn.6841 | NM_012871 | Oxtr | Oxytocin receptor | −1.1 | 0.563 |
| 76 | Rn.82760 | NM_138978 | Prokr2 | Prokineticin receptor 2 | −1.6 | 0.096 |
| 77 | Rn.32256 | NM_031115 | Sctr | Secretin receptor | −3.1 | 0.073 |
| 78 | Rn.42915 | NM_012719 | Sstr1 | Somatostatin receptor 1 | −2.4 | 0.023 |
| 79 | Rn.9929 | NM_019348 | Sstr2 | Somatostatin receptor 2 | −2.7 | 0.002 |
| 80 | Rn.9936 | NM_013036 | Sstr4 | Somatostatin receptor 4 | −1.1 | 0.448 |
| 81 | Rn.89609 | NM_012667 | Tacr1 | Tachykinin receptor 1 | 1.1 | 0.727 |
| 82 | Rn.202846 | NM_080768 | Tacr2 | Tachykinin receptor 2 | 2.6 | 0.316 |
| 83 | Rn.9702 | NM_017053 | Tacr3 | Tachykinin receptor 3 | 1.1 | 0.757 |
| 84 | Rn.1820 | NM_012515 | Tspo | Translocator protein | 1.2 | 0.336 |
| # | Unigene | Refseq | Symbol | Description | Fold Regulation | p Value |
|---|---|---|---|---|---|---|
| 1 | Rn.9991 | NM_017191 | Adra1a | Adrenergic, alpha-1A-, receptor | −1.0 | 0.955 |
| 2 | Rn.11314 | NM_024483 | Adra1d | Adrenergic, alpha-1D-, receptor | −1.9 | 0.436 |
| 3 | Rn.170171 | NM_012739 | Adra2a | Adrenergic, alpha-2A-, receptor | −1.5 | 0.170 |
| 4 | Rn.10206 | NM_012492 | Adrb2 | Adrenergic, beta-2-, receptor, surface | −1.2 | 0.478 |
| 5 | Rn.32282 | NM_053019 | Avpr1a | Arginine vasopressin receptor 1A | 1.0 | 0.745 |
| 6 | Rn.10096 | NM_017205 | Avpr1b | Arginine vasopressin receptor 1B | 1.2 | 0.681 |
| 7 | Rn.86415 | NM_152845 | Brs3 | Bombesin-like receptor 3 | 1.1 | 0.598 |
| 8 | Rn.90997 | NM_013165 | Cckbr | Cholecystokinin B receptor | −1.2 | 0.882 |
| 9 | Rn.119395 | NM_080773 | Chrm1 | Cholinergic receptor, muscarinic 1 | 1.2 | 0.858 |
| 10 | Rn.10676 | NM_031547 | Chrm4 | Cholinergic receptor, muscarinic 4 | 1.4 | 0.434 |
| 11 | Rn.44293 | NM_017362 | Chrm5 | Cholinergic receptor, muscarinic 5 | 3.0 | 0.082 |
| 12 | Rn.10996 | NM_052805 | Chrna3 | Cholinergic receptor, nicotinic, alpha 3 | 2.1 | 0.027 |
| 13 | Rn.9697 | NM_024354 | Chrna4 | Cholinergic receptor, nicotinic, alpha 4 | −1.2 | 0.021 |
| 14 | Rn.40125 | NM_017078 | Chrna5 | Cholinergic receptor, nicotinic, alpha 5 | 10.8 | 0.037 |
| 15 | Rn.9696 | NM_057184 | Chrna6 | Cholinergic receptor, nicotinic, alpha 6 | 22.2 | 0.302 |
| 16 | Rn.9698 | NM_012832 | Chrna7 | Cholinergic receptor, nicotinic, alpha 7 | 1.2 | 0.627 |
| 17 | Rn.10301 | NM_017194 | Chrne | Cholinergic receptor, nicotinic, epsilon | −1.4 | 0.054 |
| 18 | Rn.89774 | NM_012784 | Cnr1 | Cannabinoid receptor 1 (brain) | −1.6 | 0.289 |
| 19 | Rn.24039 | NM_012546 | Drd1 | Dopamine receptor D1A | 1.6 | 0.228 |
| 20 | Rn.87299 | NM_012547 | Drd2 | Dopamine receptor D2 | 3.5 | 0.248 |
| 21 | Rn.138110 | NM_012768 | Drd5 | Dopamine receptor D5 | −1.2 | 0.410 |
| 22 | Rn.30059 | NM_031028 | Gabbr1 | Gamma-aminobutyric acid (GABA) B receptor 1 | −1.0 | 0.272 |
| 23 | Rn.162814 | NM_031802 | Gabbr2 | Gamma-aminobutyric acid (GABA) B receptor 2 | −1.3 | 0.191 |
| 24 | Rn.28463 | NM_183326 | Gabra1 | Gamma-aminobutyric acid (GABA) A receptor, alpha 1 | −1.2 | 0.097 |
| 25 | Rn.48180 | NM_001135779 | Gabra2 | Gamma-aminobutyric acid (GABA-A) receptor, subunit alpha 2 | 1.0 | 0.729 |
| 26 | Rn.81205 | NM_080587 | Gabra4 | Gamma-aminobutyric acid (GABA) A receptor, alpha 4 | 1.8 | 0.154 |
| 27 | Rn.10368 | NM_017295 | Gabra5 | Gamma-aminobutyric acid (GABA) A receptor, alpha 5 | −1.6 | 0.080 |
| 28 | Rn.29890 | NM_021841 | Gabra6 | Gamma-aminobutyric acid (GABA) A receptor, alpha 6 | 1.3 | 0.499 |
| 29 | Rn.207157 | NM_012956 | Gabrb1 | Gamma-aminobutyric acid (GABA) A receptor, beta 1 | 1.3 | 0.031 |
| 30 | Rn.233948 | NM_017065 | Gabrb3 | Gamma-aminobutyric acid (GABA) A receptor, beta 3 | −1.1 | 0.118 |
| 31 | Rn.10927 | NM_017289 | Gabrd | Gamma-aminobutyric acid (GABA) A receptor, delta | 1.2 | 0.464 |
| 32 | Rn.54455 | NM_023091 | Gabre | Gamma-aminobutyric acid (GABA) A receptor, epsilon | 1.2 | 0.424 |
| 33 | Rn.10366 | NM_080586 | Gabrg1 | Gamma-aminobutyric acid (GABA) A receptor, gamma 1 | −1.1 | 0.210 |
| 34 | Rn.230132 | NM_183327 | Gabrg2 | Gamma-aminobutyric acid (GABA) A receptor, gamma 2 | −1.3 | 0.158 |
| 35 | Rn.10369 | NM_024370 | Gabrg3 | Gamma-aminobutyric acid (GABA) A receptor, gamma 3 | 1.6 | 0.096 |
| 36 | Rn.81067 | NM_031733 | Gabrq | Gamma-aminobutyric acid (GABA) receptor, theta | −1.1 | 0.938 |
| 37 | Rn.33552 | NM_017291 | Gabrr1 | Gamma-aminobutyric acid (GABA) receptor, rho 1 | 2.2 | 0.044 |
| 38 | Rn.48659 | NM_017292 | Gabrr2 | Gamma-aminobutyric acid (GABA) receptor, rho 2 | −1.2 | 0.978 |
| 39 | Rn.11225 | NM_172092 | Gcgr | Glucagon receptor | 1.4 | 0.359 |
| 40 | Rn.29971 | NM_031608 | Gria1 | Glutamate receptor, ionotropic, AMPA 1 | 1.4 | 0.071 |
| 41 | Rn.91361 | NM_017261 | Gria2 | Glutamate receptor, ionotropic, AMPA 2 | 1.0 | 0.786 |
| 42 | Rn.74049 | NM_032990 | Gria3 | Glutamate receptor, ionotrophic, AMPA 3 | −1.8 | 0.025 |
| 43 | Rn.10449 | NM_017241 | Grik1 | Glutamate receptor, ionotropic, kainate 1 | −1.3 | 0.280 |
| 44 | Rn.87696 | NM_019309 | Grik2 | Glutamate receptor, ionotropic, kainate 2 | 1.1 | 0.477 |
| 45 | Rn.10049 | NM_012572 | Grik4 | Glutamate receptor, ionotropic, kainate 4 | −1.2 | 0.410 |
| 46 | Rn.74042 | NM_031508 | Grik5 | Glutamate receptor, ionotropic, kainate 5 | 1.0 | 0.976 |
| 47 | Rn.9840 | NM_017010 | Grin1 | Glutamate receptor, ionotropic, N-methyl D-aspartate 1 | −1.3 | 0.095 |
| 48 | Rn.9710 | NM_012573 | Grin2a | Glutamate receptor, ionotropic, N-methyl D-aspartate 2A | −1.1 | 0.359 |
| 49 | Rn.9711 | NM_012574 | Grin2b | Glutamate receptor, ionotropic, N-methyl D-aspartate 2B | 1.1 | 0.476 |
| 50 | Rn.9709 | NM_012575 | Grin2c | Glutamate receptor, ionotropic, N-methyl D-aspartate 2C | −1.1 | 0.193 |
| 51 | Rn.87787 | NM_017011 | Grm1 | Glutamate receptor, metabotropic 1 | 1.5 | 0.426 |
| 52 | Rn.41715 | NM_001105712 | Grm3 | Glutamate receptor, metabotropic 3 | −1.3 | 0.157 |
| 53 | Rn.89046 | NM_022666 | Grm4 | Glutamate receptor, metabotropic 4 | −1.1 | 0.186 |
| 54 | Rn.29972 | NM_017012 | Grm5 | Glutamate receptor, metabotropic 5 | −1.1 | 0.696 |
| 55 | Rn.44615 | NM_022920 | Grm6 | Glutamate receptor, metabotropic 6 | 1.5 | 0.240 |
| 56 | Rn.10409 | NM_031040 | Grm7 | Glutamate receptor, metabotropic 7 | −1.1 | 0.569 |
| 57 | Rn.44420 | NM_022202 | Grm8 | Glutamate receptor, metabotropic 8 | −1.8 | 0.231 |
| 58 | Rn.10316 | NM_012706 | Grpr | Gastrin releasing peptide receptor | 1.9 | 0.326 |
| 59 | Rn.9893 | NM_013074 | Hcrtr2 | Hypocretin (orexin) receptor 2 | −1.6 | 0.151 |
| 60 | Rn.81032 | NM_017018 | Hrh1 | Histamine receptor H 1 | −1.8 | 0.113 |
| 61 | Rn.162272 | NM_131909 | Hrh4 | Histamine receptor H4 | 1.1 | 0.616 |
| 62 | Rn.44486 | NM_012585 | Htr1a | 5-hydroxytryptamine (serotonin) receptor 1A | 1.7 | 0.004 |
| 63 | Rn.138109 | NM_022225 | Htr1b | 5-hydroxytryptamine (serotonin) receptor 1B | 1.6 | 0.032 |
| 64 | Rn.34834 | NM_012852 | Htr1d | 5-Hydroxytryptamine (serotonin) receptor 1D | 1.3 | 0.452 |
| 65 | Rn.44301 | NM_021857 | Htr1f | 5-hydroxytryptamine (serotonin) receptor 1F | −1.5 | 0.073 |
| 66 | Rn.10294 | NM_017254 | Htr2a | 5-hydroxytryptamine (serotonin) receptor 2A | 1.0 | 0.761 |
| 67 | Rn.9935 | NM_012765 | Htr2c | 5-hydroxytryptamine (serotonin) receptor 2C | −1.1 | 0.561 |
| 68 | Rn.55109 | NM_024394 | Htr3a | 5-hydroxytryptamine (serotonin) receptor 3a | −1.6 | 0.112 |
| 69 | Rn.10094 | NM_012853 | Htr4 | 5-hydroxytryptamine (serotonin) receptor 4 | 1.8 | 0.059 |
| 70 | Rn.87132 | NM_022938 | Htr7 | 5-hydroxytryptamine (serotonin) receptor 7 | −1.2 | 0.450 |
| 71 | Rn.64505 | NM_023968 | Npy2r | Neuropeptide Y receptor Y2 | −2.3 | 0.153 |
| 72 | Rn.10532 | NM_012869 | Npy5r | Neuropeptide Y receptor Y5 | 1.0 | 0.963 |
| 73 | Rn.127792 | NM_022695 | Ntsr2 | Neurotensin receptor 2 | 1.2 | 0.069 |
| 74 | Rn.6841 | NM_012871 | Oxtr | Oxytocin receptor | 1.4 | 0.265 |
| 75 | Rn.82760 | NM_138978 | Prokr2 | Prokineticin receptor 2 | −1.3 | 0.083 |
| 76 | Rn.32256 | NM_031115 | Sctr | Secretin receptor | −1.9 | 0.080 |
| 77 | Rn.42915 | NM_012719 | Sstr1 | Somatostatin receptor 1 | 1.2 | 0.498 |
| 78 | Rn.9929 | NM_019348 | Sstr2 | Somatostatin receptor 2 | 1.5 | 0.046 |
| 79 | Rn.9936 | NM_013036 | Sstr4 | Somatostatin receptor 4 | 1.3 | 0.342 |
| 80 | Rn.89609 | NM_012667 | Tacr1 | Tachykinin receptor 1 | −1.5 | 0.325 |
| 81 | Rn.202846 | NM_080768 | Tacr2 | Tachykinin receptor 2 | 2.8 | 0.003 |
| 82 | Rn.9702 | NM_017053 | Tacr3 | Tachykinin receptor 3 | 3.2 | 0.049 |
| 83 | Rn.1820 | NM_012515 | Tspo | Translocator protein | 1.5 | 0.177 |
© 2019 by the authors. Licensee MDPI, Basel, Switzerland. This article is an open access article distributed under the terms and conditions of the Creative Commons Attribution (CC BY) license (http://creativecommons.org/licenses/by/4.0/).
Share and Cite
Villavasso, S.; Shaw, C.; Skripnikova, E.; Shah, K.; Davis, J.F.; Sirohi, S. Nutritional Contingency Reduces Alcohol Drinking by Altering Central Neurotransmitter Receptor Gene Expression in Rats. Nutrients 2019, 11, 2731. https://doi.org/10.3390/nu11112731
Villavasso S, Shaw C, Skripnikova E, Shah K, Davis JF, Sirohi S. Nutritional Contingency Reduces Alcohol Drinking by Altering Central Neurotransmitter Receptor Gene Expression in Rats. Nutrients. 2019; 11(11):2731. https://doi.org/10.3390/nu11112731
Chicago/Turabian StyleVillavasso, Starr, Cemilia Shaw, Elena Skripnikova, Krishna Shah, Jon F. Davis, and Sunil Sirohi. 2019. "Nutritional Contingency Reduces Alcohol Drinking by Altering Central Neurotransmitter Receptor Gene Expression in Rats" Nutrients 11, no. 11: 2731. https://doi.org/10.3390/nu11112731
APA StyleVillavasso, S., Shaw, C., Skripnikova, E., Shah, K., Davis, J. F., & Sirohi, S. (2019). Nutritional Contingency Reduces Alcohol Drinking by Altering Central Neurotransmitter Receptor Gene Expression in Rats. Nutrients, 11(11), 2731. https://doi.org/10.3390/nu11112731