Consumption of Animal-Source Protein is Associated with Improved Height-for-Age z Scores in Rural Malawian Children Aged 12–36 Months

 , ,
, ,
Abstract
:1. Introduction
2. Materials and Methods
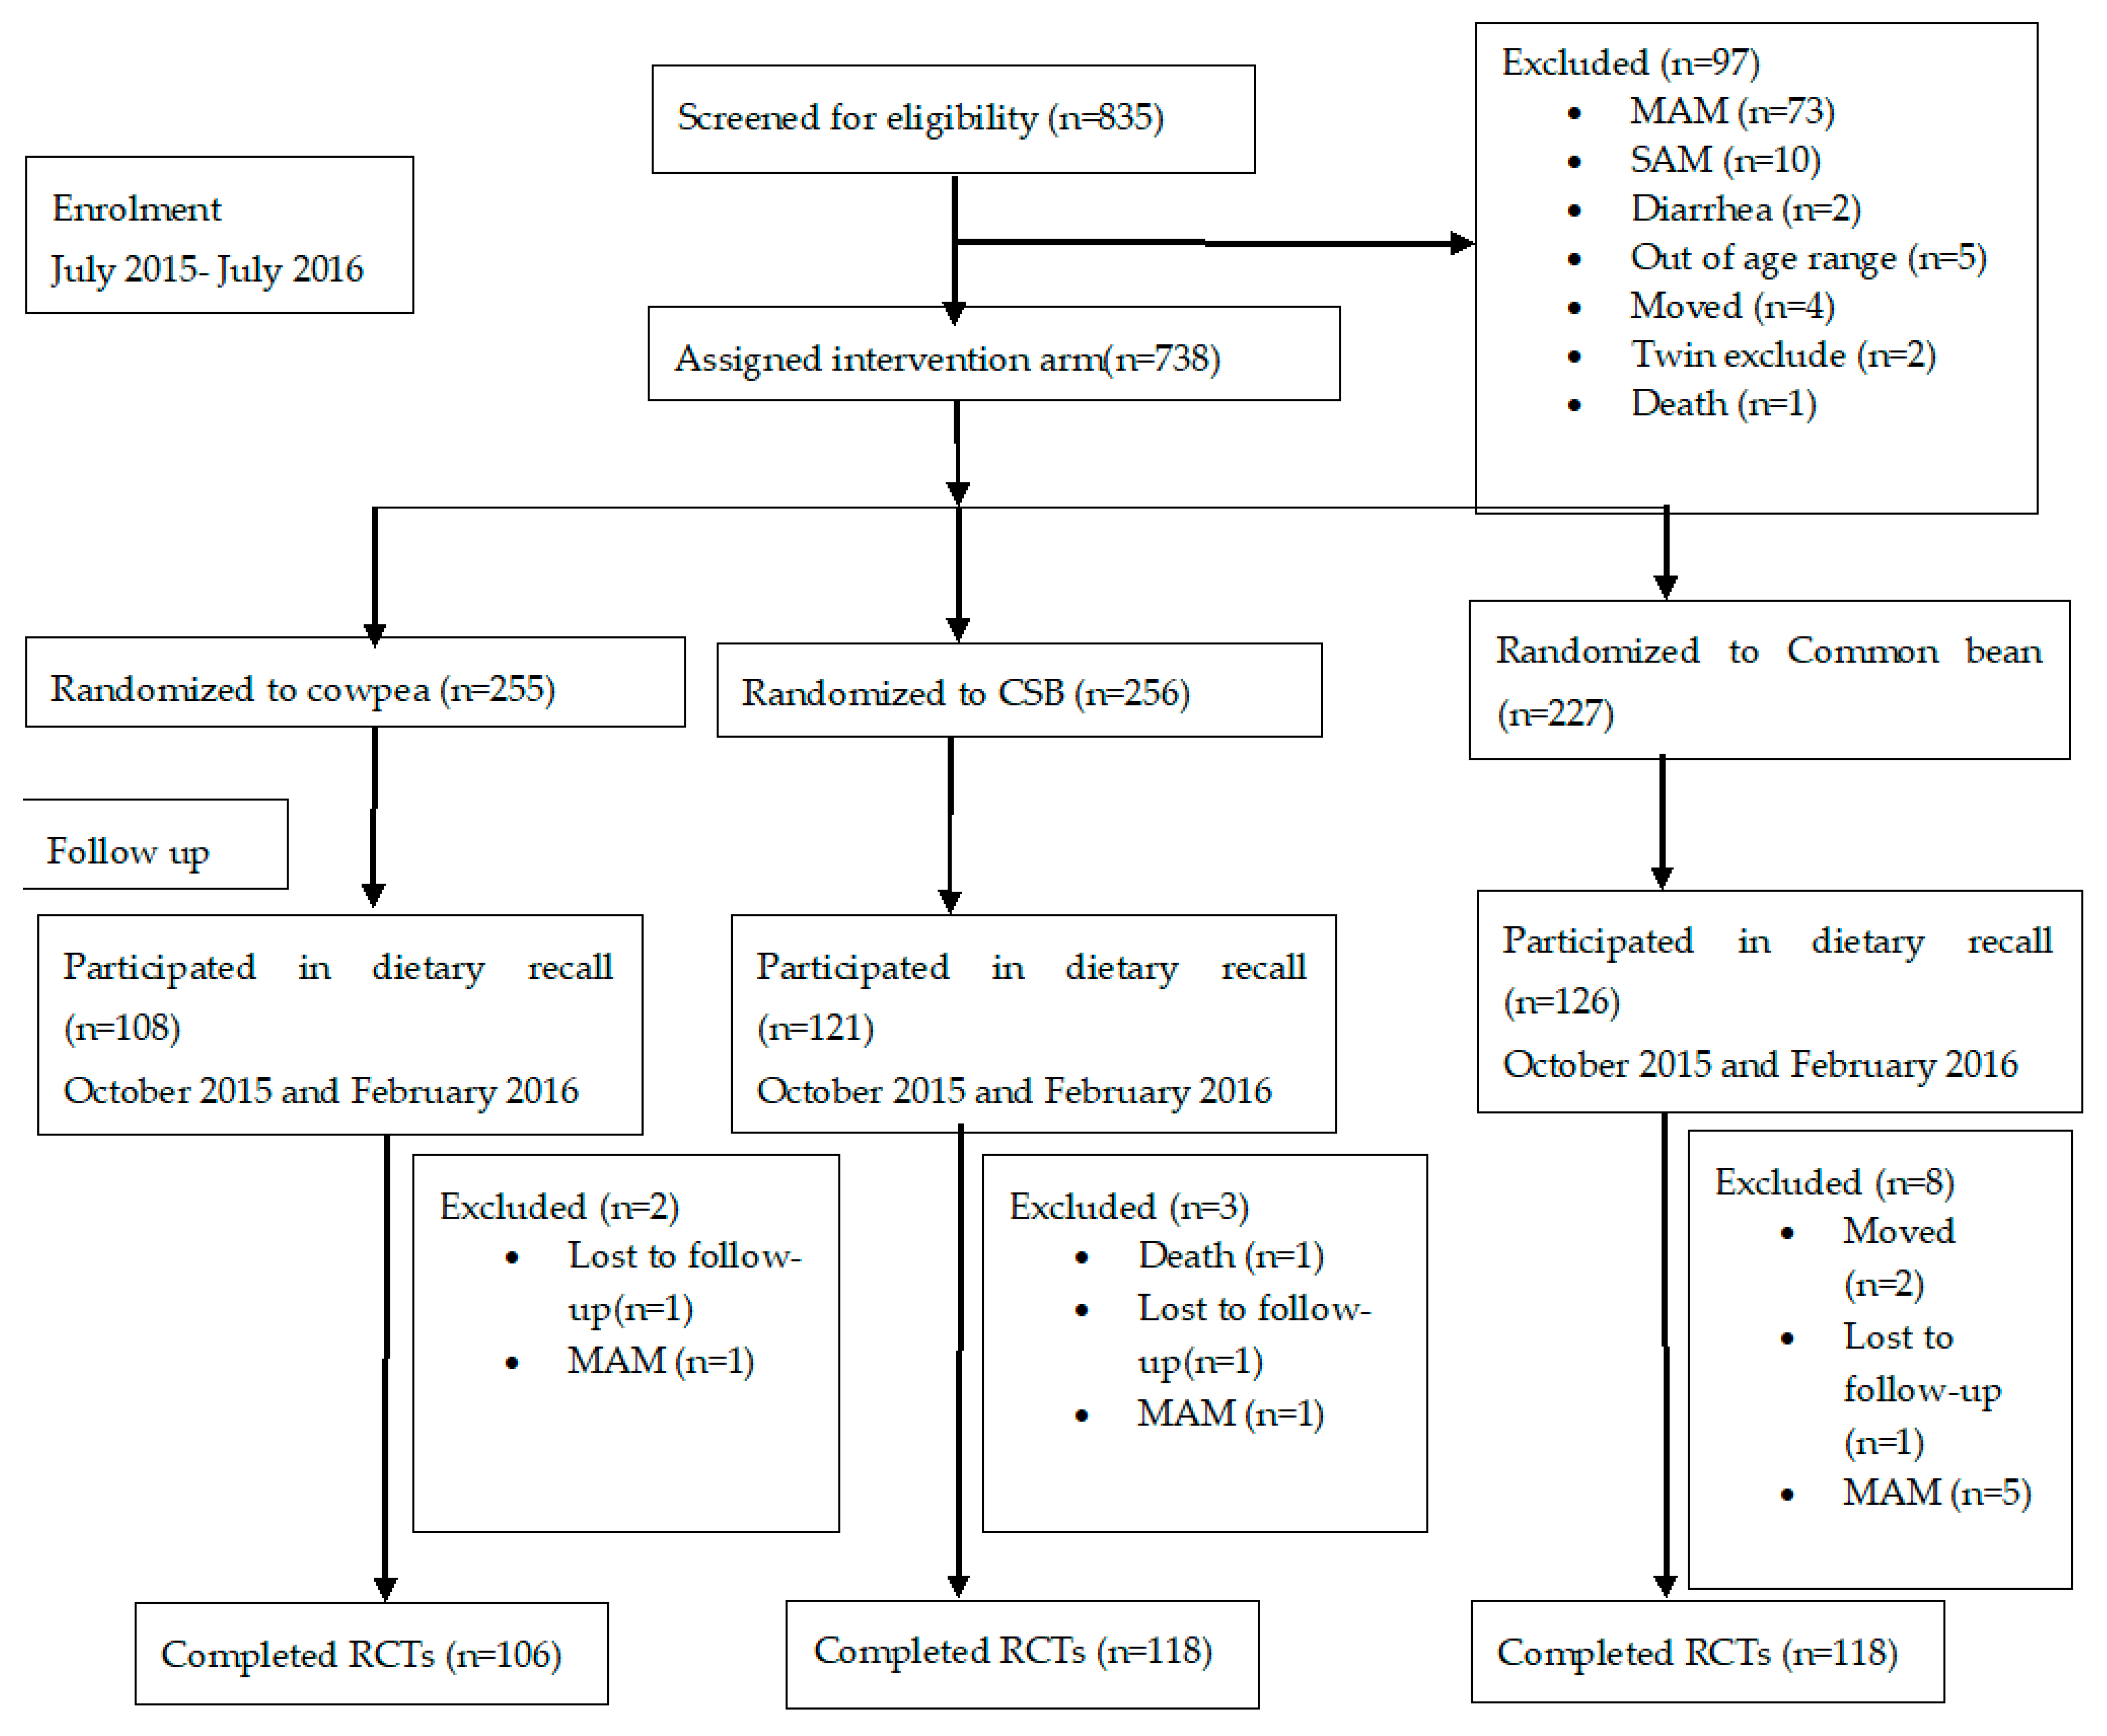
2.1. Primary Study Background
2.2. Intervention Flours
2.3. Sample Calculation
2.4. Interactive 24-h Dietary Recall
2.4.1. Training the Primary Caregivers
2.4.2. Recording Day
2.4.3. Recording and Verification of Food Consumed
2.4.4. Food Quantity and Nutrient Calculations
2.5. Dietary Diversity Assessment
2.6. Protein Quality Assessment
2.7. EED Categorization
2.8. Statistical Analyses
2.9. Ethics Approval
3. Results
3.1. Baseline Characteristics of the Population
3.2. Type of Food Consumed
3.3. Comparison of Dietary Diversity of the Children
3.4. Comparison of Protein Quality in the Diets of Children
3.5. The Association of Food Type and Food Quality with Stunting, Acute Malnutrition and EED
4. Discussion
5. Conclusions
Author Contributions
Funding
Acknowledgments
Conflicts of Interest
Appendix A

| Food consumed | 6–12 Months | 12–36 Months | ||||||||||
|---|---|---|---|---|---|---|---|---|---|---|---|---|
| a Energy, Kcal/day ± SD | b Protein g/day ± SD | a Energy, Kcal/day ± SD | b Protein g/d ± SD | |||||||||
| Masenjer (n = 87) | Limera (n = 85) | p value | Masenjere (n = 87) | Limera (n = 85) | p value | Masenjere (n = 91) | Limera (n = 92) | p value | Masenjere (n = 91) | Limera (n = 92) | p value | |
| Grains, roots and tubers | ||||||||||||
| Maize on the cob, roasted | 14.6 ± 45.1 | 11.7 ± 12.5 | 0.779 | 0.5 ± 0.5 | 0.4 ± 0.4 | 0.779 | 40.7 ± 27.2 | 45.7 ± 28.7 | 0.556 | 1.4 ± 0.9 | 1.6 ± 1.0 | 0.556 |
| Maize porridge (watery), refined flour | 61.8 ± 34.6 | 61.0 ± 35.5 | 0.888 | 2.3 ± 2.4 | 1.4 ± 0.8 | 0.001 | 91.7 ± 50.8 | 98.7 ± 48.5 | 0.374 | 2.9 ± 3.0 | 2.2 ± 1.1 | 0.042 |
| Maize porridge (stiff, nsima), refined flour | 55.7 ± 33.2 | 66.0 ± 35.6 | 0.015 | 1.3 ± 0.7 | 1.5 ± 0.8 | 0.023 | 118.5 ± 66.2 | 121.9 ± 64.4 | 0.641 | 2.7 ± 1.5 | 2.7 ± 1.5 | 0.764 |
| Rice, boiled | 44.7 ± 0 | 0 | na 1 | 0.8 ± 0 | 0 | na 1 | 114.6 ± 77.6 | 252.4 ± 120.9 | 0.082 | 2.7 ± 1.4 | 4.7 ± 2.2 | 0.082 |
| Rice porridge, homemade | 0 | 34.2 ± 24.5 | na 1 | 0 | 0.6 ± 0.5 | na 1 | 161.7 ± 53.7 | 166.3 ± 81.9 | 0.928 | 2.7 ± 1.0 | 2.8 ± 1.3 | 0.966 |
| Cassava, boiled | 0 | 0 | na 1 | 0 | 0 | na 1 | 13.6 ± 0 | 55.7 ± 38.6 | na 1 | 0.1 ± 0 | 0.5 ± 0.3 | na 1 |
| Sweet potatoes, boiled | 38.0 ± 30.2 | 32.0 ± 7.2 | 0.746 | 0.7 ± 0.6 | 0.5 ± 0.1 | 0.587 | 67.8 ± 41.3 | 56.2 ± 26.4 | 0.411 | 1.1 ± 0.7 | 1.1 ± 0.6 | 0.416 |
| Fermented cereal drink (thobwa), homemade | 58.6 ± 42.9 | 32.7 ± 10.5 | 0.248 | 1.4 ± 1.1 | 0.7 ± 0.2 | 0.248 | 134.2 ± 104.8 | 99.8 ± 74.1 | 0.444 | 3.0 ± 2.3 | 2.2 ± 1.6 | 0.444 |
| Flesh foods (meat, poultry, fish) | ||||||||||||
| Fish, boiled | 42.8 ± 31.1 | 41.9 ± 45.3 | 0.928 | 3.9 ± 4.2 | 5.5 ± 6.8 | 0.312 | 44.5 ± 40.4 | 57.7 ± 50.5 | 0.171 | 4.2 ± 5.1 | 5.4 ± 6.4 | 0.307 |
| Soup, fish broth, homemade | 12.5 ± 4.5 | 13.7 ± 7.9 | 0.575 | 1.0 ± 0.4 | 1.1 ± 0.8 | 0.665 | 15.5 ± 8.4 | 11.8 ± 6.4 | 0.298 | 1.2 ± 0.6 | 1.1 ± 0.4 | 0.731 |
| Soup. Meat broth, homemade | 6.4 ± 3.1 | 9.4 ± 0 | na 1 | 0.3 ± 0.1 | 0.4 ± 0 | na 1 | 4.1 ± 0 | 0 | na 1 | 0.2 ± 0 | 0 | na 1 |
| Chicken, boiled | 15.4 ± 0 | 0 | na 1 | 1.5 ± 0 | 0 | na 1 | 54.0 ± 0 | 0 | na 1 | 5.1 ± 0 | 0 | na 1 |
| Dairy products | ||||||||||||
| Milk, powdered | 4.9 ± 0 | 9.8 ± 0 | na 1 | 0.2 ± 0 | 0.5 ± 0 | na 1 | 21.1 ± 1.4 | 0 | na 1 | 1.02 ± 0.1 | 0 | na 1 |
| Eggs | ||||||||||||
| Chicken egg, boiled/fried | 38.9 ± 23.7 | 49.1 ± 16.7 | 0.515 | 1.9 ± 0.8 | 2.8 ± 0.7 | 0.132 | 80.6 ± 56.5 | 73.7 ± 23.8 | 0.795 | 4.4 ± 2.3 | 4.3 ± 1.0 | 0.956 |
| Soup, egg broth, homemade | 7.0 ± 0 | 0 | na 1 | 0.02 ± 0 | 2.8 ± 0.7 | na 1 | 0 | 0 | na 1 | 0 | 0 | na 1 |
| Legumes and nuts | ||||||||||||
| White beans, stewed | 43.0 ± 5.7 | 0 | na 1 | 0 | 1.7 ± 0.2 | na 1 | 0 | 83.3 ± 0 | na 1 | 0 | 3.4 ± 0 | na 1 |
| Cowpea, stewed | 19.8 ± 11.9 | 0 | na 1 | 0.9 ± 0.5 | 0 | na 1 | 72.5 ± 49.1 | 49.5 | 0.570 | 3.3 ± 2.2 | 2.2 ± 1.4 | 0.551 |
| Red kidney bean, stewed | 26.1 ± 9.7 | 45.6 ± 29.8 | 0.040 | 1.4 ± 0.6 | 2.4 ± 1.5 | 0.040 | 62.3 ± 38.4 | 64.0 ± 29.6 | 0.909 | 3.3 ± 2.0 | 3.5 ± 1.6 | 0.825 |
| Pigeon pea, stewed | 0 | 40.9 ± 0 | na 1 | 0 | 1.8 ± 0 | na 1 | 70.6 ± 78.1 | 0 | na 1 | 3.3 ± 3.2 | 0 | na 1 |
| Peas, boiled | 0 | 0 | na 1 | 0 | 0 | na 1 | 0 | 39.2 ± 21.9 | na 1 | 0 | 0.9 ± 0.5 | na 1 |
| Soup, bean broth, homemade | 9.5 ± 0.5 | 5.6 ± 3.3 | 0.240 | 0.2 ± 0.01 | 0.3 ± 0.3 | 0.864 | 5.6 ± 0 | 0 | na 1 | 0.3 ± 0 | 0 | na 1 |
| Vitamin A-rich fruits and vegetables | ||||||||||||
| Mangoes, ripe | 63.6 ± 41.2 | 40.9 ± 14.4 | 0.159 | 0.5 ± 0.3 | 0.3 ± 0.1 | 0.146 | 127.3 ± 72.6 | 75.3 ± 42.4 | 0.003 | 1.0 ± 0.6 | 0.5 ± 0.3 | 0.002 |
| Oranges, ripe | 9.7 ± 0 | 0 | na 1 | 0.2 ± 0 | 0 | na 1 | 22.5 ± 0.9 | 0 | na 1 | 0.4 ± 0.01 | 0 | na 1 |
| Pawpaw, ripe | 0 | 0 | na 1 | 0 | 0 | na 1 | 0 | 19.5 ± 0 | na 1 | 0 | 0.3 ± 0 | na 1 |
| Green leafy vegetables, boiled | 12.0 ± 8.1 | 12.1 ± 12.0 | 0.968 | 0.3 ± 0.3 | 0.4 ± 0.5 | 0.275 | 26.7 ± 23.2 | 25.0 ± 21.8 | 0.662 | 0.8 ± 0.8 | 0.6 ± 0.6 | 0.105 |
| Guava, pink | 0 | 0 | na 1 | 0 | 0 | na 1 | 0 | 28.1 ± 27.0 | na 1 | 0 | 0.4 ± 0.4 | na 1 |
| Avocado, ripe, mashed | 74.6 ± 24.5 | 0 | na 1 | 0.9 ± 0.3 | 0 | na 1 | 91.2 ± 39.5 | 0 | na 1 | 1.1 ± 0.5 | 0 | na 1 |
| Okra, boiled | 74.6 ± 24.5 | 0 | na 1 | 0.01 ± 0 | 0 | na 1 | 2.2 ± 0 | 0 | na 1 | 0.1 ± 0 | 0 | na 1 |
| Cabbage, boiled | 7.6 ± 0 | 0 | na 1 | 0.1 ± 0 | 0 | na 1 | 63.4 ± 0 | 0 | na 1 | 1.7 ± 0 | 0 | na 1 |
| Banana, ripe | 26.7 ± 18.4 | 35.1 ± 3.8 | 0.342 | 0.3 ± 0.2 | 0.4 ± 0.04 | 0.342 | 40.6 ± 23.4 | 44.5±26.2 | 0.789 | 0.4 ± 0.3 | 0.5 ± 0.3 | 0.789 |
| Sugar plum, ripe | 0 | 2.3 ± 0 | na 1 | 0 | 0.01 ± 0 | na 1 | 0 | 2.4 ± 1.0 | na 1 | 0 | 0.02 ± 0.01 | na 1 |
| Sugarcane, peeled | 1.3 ± 0 | 0 | na 1 | 0 | 0 | na 1 | 6.2 ± 0.6 | 4.7 ± 0 | na 1 | 0 | 0 | na 1 |
| Snacks | ||||||||||||
| Concentrate Juice, diluted | 32.1 ± 25.3 | 33.1 ± 17.2 | 0.901 | 0.1 ± 0.1 | 0.1 ± 0.1 | 0.891 | 49.6 ± 50.7 | 75.3 ± 50.9 | 0.282 | 0.1 ± 0.1 | 0.2 ± 0.2 | 0.338 |
| Kids maize snack, processed and colored (kamba puffs) | 74.9 ± 100.6 | 53.7 ± 49.4 | 0.566 | 0.8 ± 1.0 | 0.6 ± 0.5 | 0.566 | 50.3 ± 44.3 | 66.7 ± 73.3 | 0.517 | 0.5 ± 0.5 | 0.7 ± 0.8 | 0.517 |
| Lollipop | 36.4 ± 31.1 | 35.8 ± 0 | 0.958 | 0 | 0 | na 1 | 39.6 ± 13.9 | 40.3 ± 12.2 | 0.861 | 0 | 0 | na 1 |
| Cake, baked with banana, refined maize flour (chikondamoyo) | 0 | 50.5 ± 0 | na 1 | 0 | 1.4 ± 0 | na 1 | 148.7 ± 0 | 131.7 ± 43.6 | na 1 | 4.3 ± 0 | 3.8 ± 1.2 | na 1 |
| Fritters, fried with banana, refined maize flour (chitumbuwa) | 0 | 531.1 ± 0 | na 1 | 0 | 15.2 ± 0 | na 1 | 213.3 ± 110.2 | 186.4 ± 130.8 | 0.703 | 6.1 ± 3.2 | 5.3 ± 3.7 | 0.703 |
| Fritters, fried, refined wheat flour (mandasi) | 168.4 ± 129.4 | 365.1 ± 104.7 | <0.001 | 1.8 ± 1.4 | 3.9 ± 1.1 | <0.001 | 380.1 ± 142.4 | 446.5 ± 255.3 | 0.285 | 4.1 ± 1.5 | 4.8 ± 2.7 | 0.285 |
| Coca-Cola | 0 | 0 | na 1 | 0 | 0 | na 1 | 71.3 ± 0.5 | 0 | na 1 | 0 | 0 | na 1 |
| Icicle, sweetened and colored | 0 | 95.5 ± 0 | na 1 | 0 | 0.2 ± 0 | na 1 | 0 | 33.0 ± 0 | na 1 | 0 | 0.1 ± 0 | 0.379 |
| Tea, unsweetened, brewed | 11.8 ± 20.5 | 0 | na 1 | 0.4 ± 0.7 | 0 | na 1 | 13.7 ± 12.6 | 0 | na 1 | 0 | 0 | na 1 |
| Sugar | 40.3 ± 21.4 | 48.1 ± 20.3 | 0.073 | 0 | 0 | na 1 | 55.6 ± 25.1 | 60.5 ± 22.9 | na 1 | 0 | 0 | na 1 |
References
- UNICEF; World Health Organisation; World Bank. Levels and Trends in Child Malnutrition; UNICEF: New York, NY, USA, 2018. [Google Scholar]
- National Statistical Office The 2015-16 Malawi Demographic and Health Survey (2015-16 MDHS). Available online: https://dhsprogram.com/pubs/pdf/FR319/FR319.pdf (accessed on 22 February 2017).
- Dewey, K.G.; Brown, K.H. Update on Technical Issues concerning Complementary Feeding of Young Children in Developing Countries and Implications for Intervention Programs. Food Nutr. Bull. 2003, 24, 5–28. [Google Scholar] [CrossRef] [PubMed]
- Maleta, K. Undernutrition in Malawi. Malawi Med. J. 2006, 18, 189–205. [Google Scholar] [CrossRef] [PubMed]
- Turner, K.G.; Nielsen, M.K.; Madsen, E.L. Causes of Undernutrition in Children Under Five in Sierra Leone. Available online: http://ps.au.dk/fileadmin/Statskundskab/Dokumenter/subsites/Uland/CausesOfUndernutritioninChildrenunderfive_SierraLeone.pdf (accessed on 26 June 2017).
- Stewart, C.P.; Iannotti, L.; Dewey, K.G.; Michaelsen, K.F.; Onyango, A.W. Contextualising complementary feeding in a broader framework for stunting prevention. Matern. Child Nutr. 2013, 9, 27–45. [Google Scholar] [CrossRef] [PubMed]
- Owino, V.; Ahmed, T.; Freemark, M.; Kelly, P.; Loy, A.; Manary, M.; Loechl, C. Environmental Enteric Dysfunction and Growth Failure/Stunting in Global Child Health. Pediatrics 2016, 138, e20160641. [Google Scholar] [CrossRef] [PubMed]
- Korpe, P.S.; Petri, W.A. Environmental enteropathy: Critical implications of a poorly understood condition. Trends Mol. Med. 2012, 18, 328–336. [Google Scholar] [CrossRef] [PubMed]
- Dewey, K.G.; Yang, Z.; Boy, E. Systematic review and meta-analysis of home fortification of complementary foods. Matern. Child Nutr. 2009, 5, 283–321. [Google Scholar] [CrossRef]
- USAID Corn Soy Blend/Plus Commodity Fact Sheet. Available online: https://www.usaid.gov/what-we-do/agriculture-and-food-security/food-assistance/resources/implementation-tools/corn-soy (accessed on 29 January 2019).
- Allen, L.; Gillespie, S. What Works? A Review of The Efficacy and Effectiveness of Nutrition Interventions; Nutrition Policy Paper; ACC/SCN: Geneva, Switzerland, 2001; ISBN 978-971-561-388-0. [Google Scholar]
- Suri, D.J.; Tano-Debrah, K.; Ghosh, S.A. Optimization of the Nutrient Content and Protein Quality of Cereal—Legume Blends for Use as Complementary Foods in Ghana. Food Nutr. Bull. 2014, 35, 372–381. [Google Scholar] [CrossRef] [PubMed]
- Stephenson, K.B.; Agapova, S.E.; Divala, O.; Kaimila, Y.; Maleta, K.M.; Thakwalakwa, C.; Ordiz, M.I.; Trehan, I.; Manary, M.J. Complementary feeding with cowpea reduces growth faltering in rural Malawian infants: A blind, randomized controlled clinical trial. Am. J. Clin. Nutr. 2017, 106, 1500–1507. [Google Scholar] [CrossRef] [PubMed]
- Agapova, S.E.; Stephenson, K.B.; Divala, O.; Kaimila, Y.; Maleta, K.M.; Thakwalakwa, C.; Ordiz, M.I.; Trehan, I.; Manary, M.J. Additional Common Bean in the Diet of Malawian Children Does Not Affect Linear Growth, but Reduces Intestinal Permeability. J. Nutr. 2018, 148, 267–274. [Google Scholar] [CrossRef] [PubMed]
- Kaimila, Y.; Pitman, R.; Divala, O.; Hendrixson, T.; Stephenson, K.B.; Agapova, S.; Trehan, I.; Maleta, K.; Manary, M. Development of acute malnutrition despite nutritional supplementation in Malawi. JPGN 2018. [Google Scholar] [CrossRef] [PubMed]
- Semba, R.D. The Rise and Fall of Protein Malnutrition in Global Health. Ann. Nutr. Metabol. 2016, 69, 79–88. [Google Scholar] [CrossRef] [PubMed]
- Schönfeldt, H.C.; Gibson Hall, N. Dietary protein quality and malnutrition in Africa. Br. J. Nutr. 2012, 108, S69–S76. [Google Scholar] [CrossRef] [PubMed]
- FAO. Protein Quality Evaluation: Report of the Joint FAO WHO Expert Consultation, Bethesda, MD, USA, 4–8 December 1989; FAO Food and Nutrition Paper; FAO, Weltgesundheitsorganisation, Joint Expert Consultation on Protein Quality Evaluation, Eds.; FAO: Rome, Italy, 1991; ISBN 978-92-5-103097-4. [Google Scholar]
- Dror, D.K.; Allen, L.H. The Importance of Milk and other Animal-Source Foods for Children in Low-Income Countries. Food Nutr. Bull. 2011, 32, 227–243. [Google Scholar] [CrossRef] [PubMed]
- Krebs, N.F.; Mazariegos, M.; Tshefu, A.; Bose, C.; Sami, N.; Chomba, E.; Carlo, W.; Goco, N.; Kindem, M.; Wright, L.L.; et al. Meat Consumption is Associated with Less Stunting among Toddlers in Four Diverse Low-Income Settings. Food Nutr. Bull. 2011, 32, 185–191. [Google Scholar] [CrossRef] [PubMed]
- Darapheak, C.; Takano, T.; Kizuki, M.; Nakamura, K.; Seino, K. Consumption of animal-source foods and dietary diversity reduce stunting in children in Cambodia. Int. Arch. Med. 2013, 6, 29. [Google Scholar] [CrossRef] [PubMed]
- Murphy, S.P.; Allen, L.H. Nutritional Importance of Animal-source foods. J. Nutr. 2003, 133, 3932S–3935S. [Google Scholar] [CrossRef] [PubMed]
- Allen, L.H. Interventions for Micronutrient Deficiency Control in Developing Countries: Past, Present and Future. J. Nutr. 2003, 133, 3875S–3878S. [Google Scholar] [CrossRef] [PubMed]
- Bwibo, N.O.; Neumann, C.G. The Need for Animal-source foods by Kenyan Children. J. Nutr. 2003, 133, 3936S–3940S. [Google Scholar] [CrossRef] [PubMed]
- Friedman, M. Nutritional Value of Proteins from Different Food Sources. A Review. J. Agric. Food Chem. 1996, 44, 6–29. [Google Scholar] [CrossRef]
- Neumann, C.G.; Bwibo, N.O.; Murphy, S.P.; Sigman, M.; Whaley, S.; Allen, L.H.; Guthrie, D.; Weiss, R.E.; Demment, M.W. Animal-source foods Improve Dietary Quality, Micronutrient Status, Growth and Cognitive Function in Kenyan School Children: Background, Study Design and Baseline Findings. J. Nutr. 2003, 133, 3941S–3949S. [Google Scholar] [CrossRef] [PubMed]
- Trehan, I.; Benzoni, N.S.; Wang, A.Z.; Bollinger, L.B.; Ngoma, T.N.; Chimimba, U.K.; Stephenson, K.B.; Agapova, S.E.; Maleta, K.M.; Manary, M.J. Common beans and cowpeas as complementary foods to reduce environmental enteric dysfunction and stunting in Malawian children: Study protocol for two randomized controlled trials. Trials 2015, 16, 520. [Google Scholar] [CrossRef] [PubMed]
- Borresen, E.C.; Zhang, L.; Trehan, I.; Nealon, N.J.; Maleta, K.M.; Manary, M.J.; Ryan, E.P. The Nutrient and Metabolite Profile of 3 Complementary Legume Foods with Potential to Improve Gut Health in Rural Malawian Children. Curr. Dev. Nutr. 2017, 1, e001610. [Google Scholar] [CrossRef] [PubMed]
- Ngoma, T.N.; Chimimba, U.K.; Mwangwela, A.M.; Thakwalakwa, C.; Maleta, K.M.; Manary, M.J.; Trehan, I. Effect of cowpea flour processing on the chemical properties and acceptability of a novel cowpea blended maize porridge. PLoS ONE 2018, 13, e0200418. [Google Scholar] [CrossRef] [PubMed]
- Gibson, R.S.; Ferguson, E.L. An Interactive 24-h Recall for Assessing the Adequacy of Iron and Zinc Intakes in Developing Countries; IFPRI, CIAT: Washington, DC, USA, 2008; Volume 160. [Google Scholar]
- Lazarte, C.E.; Encinas, M.E.; Alegre, C.; Granfeldt, Y. Validation of digital photographs, as a tool in 24-h recall, for the improvement of dietary assessment among rural populations in developing countries. Nutr. J. 2012, 11, 61. [Google Scholar] [CrossRef] [PubMed]
- Engle-Stone, R.; Ndjebayi, A.O.; Nankap, M.; Brown, K.H. Consumption of Potentially Fortifiable Foods by Women and Young Children Varies by Ecological Zone and Socio-Economic Status in Cameroon. J. Nutr. 2012, 142, 555–565. [Google Scholar] [CrossRef] [PubMed]
- Ferguson, E.L.; Gadowsky, S.L.; Huddle, J.M.; Cullinan, T.R.; Lehrfeld, J.; Gibson, R.S. An interactive 24-h recall technique for assessing the adequacy of trace mineral intakes of rural Malawian women; its advantages and limitations. Eur. J. Clin. Nutr. 1995, 49, 565–578. [Google Scholar] [PubMed]
- Alemayehu, A.A.; Abebe, Y.; Gibson, R.S. A 24-h recall does not provide a valid estimate of absolute nutrient intakes for rural women in southern Ethiopia. Nutrition 2011, 27, 919–924. [Google Scholar] [CrossRef] [PubMed]
- Thakwalakwa, C.M.; Kuusipalo, H.M.; Maleta, K.M.; Phuka, J.C.; Ashorn, P.; Cheung, Y.B. The validity of a structured interactive 24-h recall in estimating energy and nutrient intakes in 15-month-old rural Malawian children. Matern. Child Nutr. 2012, 8, 380–389. [Google Scholar] [CrossRef] [PubMed]
- Wang, A.Z.; Shulman, R.J.; Crocker, A.H.; Thakwalakwa, C.; Maleta, K.M.; Devaraj, S.; Manary, M.J.; Trehan, I. A Combined Intervention of Zinc, Multiple Micronutrients, and Albendazole Does Not Ameliorate Environmental Enteric Dysfunction or Stunting in Rural Malawian Children in a Double-Blind Randomized Controlled Trial. J. Nutr. 2017, 147, 97–103. [Google Scholar] [CrossRef] [PubMed]
- USDA. USDA USDA Table of Nutrient Retention Factors. Release 6. Available online: https://www.researchgate.net/profile/Godwin_Ndossi/publication/265627809_Tanzania_Food_ComposiTion_Tables_Compiled_by/links/5419a5080cf2218008bf990d/Tanzania-Food-ComposiTion-Tables-Compiled-by.pdf (accessed on 27 January 2019).
- Lukmanji, Z.; Hertzmark, E. Tanzania Food Composition Tables; FAO: Rome, Italy, 2011. [Google Scholar]
- Korkalo, L.; Hauta-alus, H.; Mutanen, M. Food Composition Tables for Mozambique; University of Helsinki: Helsinki, Finland, 2011. [Google Scholar]
- Stadlmayr, B.; Food and Agriculture Organization of the United Nations; International Network of Food Data Systems; Economic Community of West African States; Bioversity International. West African Food Composition Table = Table de Composition des Aliments d’Afrique de l’Ouest; FAO: Rome, Italy, 2012. [Google Scholar]
- USDA. USDA National Nutrient Database for Standard Reference: USDA ARS. Available online: https://www.ars.usda.gov/northeast-area/beltsville-md-bhnrc/beltsville-human-nutrition-research-center/nutrient-data-laboratory/docs/usda-national-nutrient-database-for-standard-reference/ (accessed on 27 January 2019).
- Hemsworth, J.; Kumwenda, C.; Arimond, M.; Maleta, K.; Phuka, J.; Rehman, A.M.; Vosti, S.A.; Ashorn, U.; Filteau, S.; Dewey, K.G.; et al. Lipid-Based Nutrient Supplements Increase Energy and Macronutrient Intakes from Complementary Food among Malawian Infants. J. Nutr. 2016, 146, 326–334. [Google Scholar] [CrossRef] [PubMed]
- WHO. Indicators for Assessing Infant and Young Child Feeding Practices. Available online: http://apps.who.int/iris/bitstream/handle/10665/44306/9789241599290_eng.pdf;jsessionid=4AEFA57E53C895553FD7C9D44CB387CE?sequence=1 (accessed on 7 December 2017).
- Arimond, M.; Ruel, M.T. Dietary Diversity Is Associated with Child Nutritional Status: Evidence from 11 Demographic and Health Surveys. J. Nutr. 2004, 134, 2579–2585. [Google Scholar] [CrossRef] [PubMed]
- Kennedy, G.; Ballard, T.; Dop, M.C.; European Union. Guidelines for Measuring Household and Individual Dietary Diversity; Food and Agriculture Organization of the United Nations: Rome, Italy, 2011; ISBN 978-92-5-106749-9. [Google Scholar]
- FAO. Dietary Protein Quality Evaluation in Human Nutrition: Report of an FAO Expert Consultation; FAO Food and Nutrition Paper; Food and Agriculture Organization of the United Nations: Rome, Italy, 2013; ISBN 978-92-5-107417-6. [Google Scholar]
- FAO. Food Policy and Food Science Services Amino-Acid Content of Foods and Biological Data on Proteins. Available online: http://www.fao.org/docrep/005/AC854T/AC854T00.htm#TOC (accessed on 20 November 2018).
- Filmer, D.; Pritchett, L.H. Estimating Wealth Effects Without Expenditure Data—Or Tears: An Application to Educational Enrollments In States Of India*. Demography 2001, 38, 115–132. [Google Scholar] [PubMed]
- WHO. Drinking Water; WHO: Geneva, Switzerland, 2012. [Google Scholar]
- Coates, J.; Swindale, A.; Bilinsky, P. Household Food Insecurity Access Scale (HFIAS) for Measurement of Food Access: Indicator Guide. Version 3; Food and Nutrition Technical Assistance Project, Academy for Educational Development: Washington, DC, USA, 2007. [Google Scholar]
- Marquis, G.S.; Habicht, J.P.; Lanata, C.F.; Black, R.E.; Rasmussen, K.M. Breast milk or animal-product foods improve linear growth of Peruvian toddlers consuming marginal diets. Am. J. Clin. Nutr. 1997, 66, 1102–1109. [Google Scholar] [CrossRef] [PubMed]
- Thilsted, S.H.; James, D.; Toppe, J.; Subasinghe, R.; Karunasagar, I. Maximizing the contribution of fish to human nutrition. In Proceedings of the ICN2 Second International Conference on Nutrition, Rome, Italy, 19–21 November 2014. [Google Scholar]
- Lartey, A.; Manu, A.; Brown, K.H.; Peerson, J.M.; Dewey, K.G. A randomized, community-based trial of the effects of improved, centrally processed complementary foods on growth and micronutrient status of Ghanaian infants from 6 to 12 mo of age. Am. J. Clin. Nutr. 1999, 70, 391–404. [Google Scholar] [CrossRef] [PubMed]
- Sigman, M.; Neumann, C.; Jansen, A.A.J.; Bwibo, N. Cognitive Abilities of Kenyan Children in Relation to Nutrition, Family Characteristics, and Education. Child Dev. 1989, 60, 1463–1474. [Google Scholar] [CrossRef] [PubMed]
- Lee, R.; Singh, L.; van Liefde, D.; Callaghan-Gillespie, M.; Steiner-Asiedu, M.; Saalia, K.; Edwards, C.; Serena, A.; Hershey, T.; Manary, M.J. Milk Powder Added to a School Meal Increases Cognitive Test Scores in Ghanaian Children. J. Nutr. 2018, 148, 1177–1184. [Google Scholar] [CrossRef] [PubMed]
- Rah, J.H.; Akhter, N.; Semba, R.D.; de Pee, S.; Bloem, M.W.; Campbell, A.A.; Moench-Pfanner, R.; Sun, K.; Badham, J.; Kraemer, K. Low dietary diversity is a predictor of child stunting in rural Bangladesh. Eur. J. Clin. Nutr. 2010, 64, 1393–1398. [Google Scholar] [CrossRef] [PubMed]
- Perkins, J.M.; Jayatissa, R.; Subramanian, S.V. Dietary diversity and anthropometric status and failure among infants and young children in Sri Lanka. Nutrition 2018, 55–56, 76–83. [Google Scholar] [CrossRef] [PubMed]
- Mallard, S.R.; Houghton, L.A.; Filteau, S.; Chisenga, M.; Siame, J.; Kasonka, L.; Mullen, A.; Gibson, R.S. Micronutrient Adequacy and Dietary Diversity Exert Positive and Distinct Effects on Linear Growth in Urban Zambian Infants. J. Nutr. 2016, 146, 2093–2101. [Google Scholar] [CrossRef] [PubMed]
- Corsi, D.J.; Mejía-Guevara, I.; Subramanian, S.V. Risk factors for chronic undernutrition among children in India: Estimating relative importance, population attributable risk and fractions. Soc. Sci. Med. 2016, 157, 165–185. [Google Scholar] [CrossRef] [PubMed]

| Characteristic at Enrolment | 6–12 Months (n = 172) | 12–36 Months (n = 183) | ||||
|---|---|---|---|---|---|---|
| Masenjere (n = 87) | Limera (n = 85) | p Value | Masenjere (n = 91) | Limera (n = 92) | p Value | |
| Girls, % | 44 | 52 | 0.288 | 40 | 39 | 0.953 |
| Age, months 1 | 5.8 ± 0.3 | 5.8 ± 0.3 | 0.537 | 17.6 ± 3.8 | 18.0 ± 3.7 | 0.582 |
| Weight, kg 1 | 7.1 ± 0.7 | 7.1 ± 0.8 | 0.904 | 9.6 ± 1.3 | 10.0 ± 1.3 | 0.041 |
| Length/height, cm 1 | 63.9 ± 2.6 | 63.6 ± 2.3 | 0.365 | 76.4 ± 5.4 | 77.9 ± 4.7 | 0.055 |
| Mid-Upper Arm circumference (MUAC), cm 1 | 14.0 ± 0.9 | 14.1 ± 0.9 | 0.316 | 14.5 ± 0.8 | 17.8 ± 1.0 | 0.101 |
| Weight-for-length/height z score (WLZ/H) 1 | 0.3 ± 0.9 | 0.4 ± 0.9 | 0.395 | −0.1 ± 0.9 | 0.02 ± 0.9 | 0.329 |
| Height/Length-for-age z score (H/LAZ) 1 | −1.2 ± 1.1 | −1.3 ± 0.9 | 0.536 | −1.7 ± 1.3 | −1.3 ± 0.1 | 0.023 |
| Weight-for-age z score (WAZ)1 | −0.6 ± 0.8 | −0.5 ± 0.9 | 0.792 | −0.9 ± 0.9 | −0.6 ± 0.9 | 0.027 |
| % Lactulose excreted | 0.29 ± 0.2 | 0.25 ± 0.22 | 0.48 ± 0.32 | 0.39 ± 0.21 | 0.034 | |
| Stunted, % | 25 | 20 | 0.408 | 37 | 30 | 0.322 |
| Wasted, % | 0 | 0 | na | 1 | 2 | 0.567 |
| Underweight, % | 1 | 5 | 0.165 | 12 | 4 | 0.056 |
| Number of siblings 1 | 2.4 ± 1.9 | 2.6 ± 2.0 | 0.419 | 2.4 ± 1.8 | 3.0 ± 2.0 | 0.026 |
| Asset score 2 | 1.2 ± 1.2 | 0.9 ± 0.9 | 0.062 | 1.1 ± 1.1 | 0.9 ± 0.9 | 0.129 |
| Improved water source (borehole), % | 100 | 34 | <0.001 | 98.9 | 45 | <0.001 |
| Sleep with animals in bedroom, % | 43 | 15 | <0.001 | 32 | 23 | 0.191 |
| Household severely food insecure, % 3 | 52 | 61 | 0.211 | 46 | 49 | 0.709 |
| Characteristic at end of study | ||||||
| Change in WLZ/H 1 | −0.4 ± 0.9 | 0.01 ± 0.6 | <0.001 | −0.4 ± 0.8 | −0.2 ± 0.7 | 0.080 |
| Change in H/LAZ 1 | −1.6 ± 0.9 | −1.3 ± 0.8 | 0.037 | −1.5 ± 0.8 | −1.3 ± 0.9 | 0.084 |
| Change in WAZ 1 | −1.1 ± 0.7 | −0.6 ± 0.7 | <0.001 | −1.1 ± 0.9 | −0.8 ± 0.8 | 0.024 |
| % Lactulose excreted | 0.24 ± 0.17 | 0.21 ± 0.16 | 0.183 | 0.48 ± 0.25 | 0.47 ± 0.33 | 0.701 |
| Stunted, % | 41 | 27 | 0.048 | 30 | 33 | 0.668 |
| Wasted, % | 2 | 0 | 0.160 | 2 | 0 | 0.153 |
| Underweight, % | 17 | 4 | 0.003 | 21 | 5 | 0.002 |
| Developed acute malnutrition, % | 4 | 1 | 0.335 | 5 | 1 | 0.150 |
| Food Consumed | 6–12 Months (n = 172) | 12–36 Months (n = 183) | ||||
|---|---|---|---|---|---|---|
| Masenjere (n = 87) | Limera (n = 85) | p Value | Masenjere (n = 91) | Limera (n = 92) | p Value | |
| Grains, roots and tubers | ||||||
| Maize on the cob, roasted | 2 | 12 | 0.015 | 19 | 33 | 0.031 |
| Maize porridge (watery), refined flour | 72 | 82 | 0.120 | 68 | 71 | 0.595 |
| Maize porridge (stiff, nsima), refined flour | 81 | 86 | 0.342 | 95 | 89 | 0.185 |
| Rice, boiled | 1 | 0 | 0.322 | 6 | 9 | 0.399 |
| Rice porridge, homemade | 0 | 6 | 0.022 | 4 | 4 | 0.987 |
| Cassava, boiled | 0 | 0 | na 1 | 1 | 8 | 0.031 |
| Sweet potatoes, boiled | 15 | 4 | 0.010 | 32 | 11 | 0.001 |
| Fermented cereal drink (thobwa), homemade | 26 | 5 | <0.000 | 40 | 7 | <0.001 |
| Flesh foods (meat, poultry, fish) | ||||||
| Fish, boiled | 21 | 31 | 0.137 | 35 | 54 | 0.009 |
| Soup, fish broth, homemade | 13 | 41 | <0.001 | 7 | 7 | 0.984 |
| Soup, meat broth, homemade | 9 | 1 | 0.018 | 1 | 0 | 0.313 |
| Chicken, boiled | 0 | 1 | 0.322 | 1 | 0 | 0.313 |
| Dairy products | ||||||
| Milk, powdered | 1 | 1 | 0.987 | 3 | 0 | 0.079 |
| Eggs | ||||||
| Chicken egg, boiled/fried | 10 | 4 | 0.079 | 17 | 5 | 0.017 |
| Soup, egg broth, homemade | 1 | 0 | 0.322 | 0 | 0 | na 1 |
| Legumes and nuts | ||||||
| White beans, stewed | 2 | 5 | 0.390 | 1 | 1 | 0.994 |
| Cowpea, stewed | 4 | 0 | 0.084 | 7 | 1 | 0.052 |
| Red kidney bean, stewed | 12 | 8 | 0.474 | 24 | 8 | 0.002 |
| Pigeon pea, stewed | 0 | 1 | 0.322 | 2 | 0 | 0.153 |
| Peas, boiled | 0 | 1 | 0.310 | 0 | 2 | 0.157 |
| Soup, bean broth, homemade | 2 | 2 | 0.981 | 1 | 0 | 0.313 |
| Vitamin A-rich fruits and vegetables | ||||||
| Mangoes, ripe | 37 | 8 | <0.001 | 43 | 22 | 0.002 |
| Oranges, ripe | 1 | 0 | 0.322 | 0 | 2 | 0.153 |
| Pawpaw, ripe | 0 | 0 | na 1 | 0 | 1 | 0.319 |
| Green leafy vegetables, boiled | 59 | 72 | 0.071 | 74 | 45 | <0.001 |
| Guava, pink | 0 | 0 | na 1 | 0 | 3 | 0.082 |
| Avocado, ripe, mashed | 8 | 0 | 0.008 | 10 | 0 | 0.002 |
| Okra, boiled | 1 | 0 | 0.322 | 1 | 0 | 0.313 |
| Soup from leafy vegetables | 13 | 20 | 0.191 | 0 | 2 | 0.157 |
| Other fruits and vegetables | ||||||
| Cabbage, boiled | 1 | 0 | 0.322 | 1 | 0 | 0.313 |
| Banana, ripe | 10 | 6 | 0.285 | 4 | 21 | 0.001 |
| Sugar plum, ripe | 0 | 2 | 0.150 | 0 | 3 | 0.082 |
| Sugarcane, peeled | 0 | 0 | na 1 | 4 | 1 | 0.170 |
| Snacks | ||||||
| Concentrate juice, diluted | 17 | 15 | 0.729 | 9 | 12 | 0.483 |
| Kids’ maize snack, processed and colored (Kamba puffs) | 33 | 9 | <0.001 | 24 | 5 | <0.001 |
| Lollipop | 14 | 9 | 0.190 | 41 | 17 | <0.001 |
| Cake, baked with banana, refined maize flour (chikondamoyo) | 0 | 1 | 0.310 | 1 | 5 | 0.100 |
| Fritters, fried with banana, refined maize flour (chitumbuwa) | 1 | 0 | 0.310 | 4 | 21 | 0.001 |
| Fritters, fried, refined wheat flour (mandasi) | 14 | 12 | 0.690 | 29 | 16 | 0.047 |
| Coca-cola | 0 | 0 | na 1 | 1 | 0 | 0.313 |
| Icicles, sweetened and colored | 0 | 1 | 0.310 | 0 | 1 | 0.319 |
| Tea, unsweetened, brewed | 2 | 0 | 0.160 | 3 | 0 | 0.079 |
| Sugar | 51 | 35 | 0.043 | 45 | 34 | 0.116 |
| Food Group | 6–12 Months (n = 172) | 12–36 Months (n = 183) | ||||
|---|---|---|---|---|---|---|
| Masenjere (n = 87) | Limera (n = 85) | p Value | Masenjere (n = 91) | Limera (n = 92) | p Value | |
| Grains, roots, and tubers, n (%) | 79(91) | 77(91) | 0.961 | 88(97) | 83(90) | 0.076 |
| Flesh foods (meat, poultry, fish), n (%) | 33(38) | 56(62) | 0.001 | 39(43) | 54(59) | 0.032 |
| Dairy products, n (%) | 1(1) | 1(1) | 0.987 | 3(3) | 0(0) | 0.079 |
| Eggs, n (%) | 10(12) | 3(4) | 0.048 | 15(17) | 5(5) | 0.017 |
| Legumes and nuts, n (%) | 15(17) | 12(14) | 0.573 | 29(32) | 11(12) | 0.001 |
| Vitamin A-rich fruits and vegetables, n (%) | 61(70) | 41(48) | 0.003 | 77(85) | 54(590 | <0.001 |
| Other fruits and vegetables, n (%) | 11(13) | 7(8) | 0.345 | 6(7) | 20(22) | 0.003 |
| Dietary diversity | ||||||
| Number not meeting minimum dietary diversity (MDD) score, n (%) | 32(37) | 35(42) | 0.555 | 71(78) | 76(83) | 0.435 |
| Mean (SD) dietary diversity score | 2.4 ± 1.2 | 2.3 ± 1.0 | 0.442 | 2.8 ± 1.0 | 2.5 ± 1.1 | 0.024 |
| Outcome | 6–12 Months (n = 172) | 12–36 Months (n = 183) | ||||
|---|---|---|---|---|---|---|
| Masenjere (n = 87) | Limera (n = 85) | p Value | Masenjere (n = 91) | Limera (n = 92) | p Value | |
| Total protein (g/day) | 21.9 ± 8.7 | 24.3 ± 8.2 | 0.034 | 34.6 ± 13.1 | 37.1 ± 12.4 | 0.065 |
| Bioavailable protein (g/day) 1 | 15.7 ± 5.8 | 16.7 ± 6.1 | 0.096 | 23.1 ± 8.1 | 26.0 ± 10.3 | 0.018 |
| Recommended levels of intake (g/day) 2 | 11 | 11 | na | 13 | 13 | na |
| % that met protein RDA | 80.5 | 89.4 | 0.051 | 94.5 | 96.7 | 0.231 |
| 6–12 Months (n = 172) | 12–36 Months (n = 183) | |||||||||||
|---|---|---|---|---|---|---|---|---|---|---|---|---|
| Change in HAZ | % Lactulose | Acute Malnutrition | Change in HAZ | Change in % Lactulose | Acute Malnutrition | |||||||
| Coef ± SE | p Value | Coef ± SE | p Value | Coef ± SE | p Value | Coef ± SE | p Value | Coef ± SE | p Value | Coef ± SE | p Value | |
| Region (Limera vs. Masenjere) | −0.4 ± 0.2 | 0.062 | 0.7 ± 0.04 | 0.067 | −0.01 ± 0.04 | 0.785 | −0.2 ± 0.2 | 0.258 | 0.1 ± 0.04 | 0.088 | −0.02 ± 0.03 | 0.469 |
| Animal protein | 0.01 ± 0.01 | 0.383 | 0.001 ± 0.002 | 0.437 | 0.00 ± 0.00 | 0.691 | 0.02 ± 0.01 | 0.047 | −0.00 ± 0.00 | 0.317 | 0.00 ± 0.00 | 0.341 |
| Improved water | 0.3 ± 0.2 | 0.110 | −0.02 ± 0.03 | 0.582 | −0.01 ± 0.04 | 0.590 | 0.2 ± 0.2 | 0.206 | −0.03 ± 0.04 | 0.389 | 0.02 ± 0.03 | 0.557 |
| Sex (female vs. male) | −0.3 ± 0.1 | 0.046 | 0.1 ± 0.02 | 0.026 | 0.02 ± 0.02 | 0.394 | −0.07 ± 0.1 | 0.638 | 0.1 ± 0.03 | 0.064 | 0.01 ± 0.02 | 0.657 |
| Age | −0.1 ± 0.04 | 0.108 | 0.01 ± 0.01 | 0.222 | 0.00 ± 0.01 | 0.599 | 0.1 ± 0.01 | <0.001 | 0.01 ± 0.00 | 0.003 | 0.00 ± 0.00 | 0.671 |
| Number of siblings | 0.02 ± 0.04 | 0.541 | 0.01 ± 0.01 | 0.053 | na 1 | na 1 | −0.02 ± 0.04 | 0.592 | −0.00 ± 0.01 | 0.722 | −0.00 ± 0.01 | 0.617 |
| Season (Feb vs. Oct) | −0.4 ± 0.2 | 0.027 | 0.05 ± 0.03 | 0.110 | 0.02 ± 0.03 | 0.576 | 0.04 ± 0.2 | 0.780 | −0.01 ± 0.03 | 0.795 | 0.03 ± 0.03 | 0.292 |
| Asset score (vs. 0) | 0.03 ± 0.06 | 0.548 | −0.01 ± 0.01 | 0.333 | −0.02 ± 0.01 | 0.114 | 0.1 ± 0.1 | 0.362 | 0.00 ± 0.01 | 0.856 | −0.01 ± 0.01 | 0.349 |
| Severe food insecurity (vs. not) | 0.1 ± 0.1 | 0.536 | −0.02 ± 0.03 | 0.403 | −0.04 ± 0.02 | 0.100 | 0.1 ± 0.2 | 0.641 | 0.04 ± 0.03 | 0.111 | −0.00 ± 0.02 | 0.883 |
| Stooling (pit latrine vs yard) | −0.1 ± 0.2 | 0.585 | −0.04 ± 0.04 | 0.911 | 0.01 ± 0.04 | 0.713 | 0.1 ± 0.2 | 0.728 | 0.03 ± 0.04 | 0.427 | 0.01 ± 0.04 | 0.709 |
| Sleep with animals | 0.2 ± 0.2 | 0.178 | −0.01 ± 0.03 | 0.631 | −0.02 ± 0.03 | 0.547 | 0.1 ± 0.2 | 0.609 | 0.04 ± 0.3 | 0.178 | 0.00 ± 0.03 | 0.979 |
© 2019 by the authors. Licensee MDPI, Basel, Switzerland. This article is an open access article distributed under the terms and conditions of the Creative Commons Attribution (CC BY) license (http://creativecommons.org/licenses/by/4.0/).
Share and Cite
Kaimila, Y.; Divala, O.; Agapova, S.E.; Stephenson, K.B.; Thakwalakwa, C.; Trehan, I.; Manary, M.J.; Maleta, K.M. Consumption of Animal-Source Protein is Associated with Improved Height-for-Age z Scores in Rural Malawian Children Aged 12–36 Months. Nutrients 2019, 11, 480. https://doi.org/10.3390/nu11020480
Kaimila Y, Divala O, Agapova SE, Stephenson KB, Thakwalakwa C, Trehan I, Manary MJ, Maleta KM. Consumption of Animal-Source Protein is Associated with Improved Height-for-Age z Scores in Rural Malawian Children Aged 12–36 Months. Nutrients. 2019; 11(2):480. https://doi.org/10.3390/nu11020480
Chicago/Turabian StyleKaimila, Yankho, Oscar Divala, Sophia E. Agapova, Kevin B. Stephenson, Chrissie Thakwalakwa, Indi Trehan, Mark J. Manary, and Kenneth M. Maleta. 2019. "Consumption of Animal-Source Protein is Associated with Improved Height-for-Age z Scores in Rural Malawian Children Aged 12–36 Months" Nutrients 11, no. 2: 480. https://doi.org/10.3390/nu11020480
APA StyleKaimila, Y., Divala, O., Agapova, S. E., Stephenson, K. B., Thakwalakwa, C., Trehan, I., Manary, M. J., & Maleta, K. M. (2019). Consumption of Animal-Source Protein is Associated with Improved Height-for-Age z Scores in Rural Malawian Children Aged 12–36 Months. Nutrients, 11(2), 480. https://doi.org/10.3390/nu11020480