Role of Resveratrol in Transmitochondrial AMD RPE Cells


Abstract
1. Introduction
2. Methods
2.1. Human Subjects
2.2. Cell Culture
2.3. Resveratrol Treatment
2.4. Cell Viability Assay
2.5. Reactive Oxygen Species (ROS) Assay
2.6. Statistical Analysis
3. Results
3.1. Effects of Resveratrol Brand 1 (B1)
3.1.1. Cell Viability
3.1.2. ROS Levels
3.2. Effects of Resveratrol Brand 2 (B2)
3.2.1. Cell Viability
3.2.2. ROS Levels
3.3. Effects of Resveratrol Brand 3 (B3)
3.3.1. Cell Viability
3.3.2. ROS Levels
3.4. Effects of Resveratrol Brand 4 (B4)
3.4.1. Cell Viability
3.4.2. ROS Levels
3.5. Effects of Resveratrol Brand 5 (B5)
3.5.1. Cell Viability
3.5.2. ROS Levels
3.6. Effects of Resveratrol Brand 6 (B6)
3.6.1. Cell Viability
3.6.2. ROS Levels
4. Discussion
Author Contributions
Funding
Conflicts of Interest
References
- Kuršvietienė, L.; Stanevičienė, I.; Mongirdienė, A.; Bernatonienė, J. Multiplicity of effects and health benefits of resveratrol. Medicina 2016, 52, 148–155. [Google Scholar] [CrossRef] [PubMed]
- Chang, X.; Heene, E.; Qiao, F.; Nick, P. The phytoalexin resveratrol regulates the initiation of hypersensitive cell death in Vitis cell. PLoS ONE 2011, 6, e26405. [Google Scholar] [CrossRef] [PubMed]
- Anisimova, N.Y.; Kiselevsky, M.V.; Sosnov, A.V.; Sadovnikov, S.V.; Stankov, I.N.; Gakh, A.A. Trans-, cis-, and dihydro-resveratrol: A comparative study. Chem. Cent. J. 2011, 5, 88. [Google Scholar] [CrossRef] [PubMed]
- Walle, T. Bioavailability of resveratrol. Ann. N. Y. Acad. Sci. 2011, 1215, 9–15. [Google Scholar] [CrossRef] [PubMed]
- Goldberg, D.M.; Yan, J.; Soleas, G.J. Absorption of three wine-related polyphenols in three different matrices by healthy subjects. Clin. Biochem. 2003, 36, 79–87. [Google Scholar] [CrossRef]
- Wykoff, C.C.; Clark, W.L.; Nielsen, J.S.; Brill, J.V.; Greene, L.S.; Heggen, C.L. Optimizing Anti-VEGF Treatment Outcomes for Patients with Neovascular Age-Related Macular Degeneration. J. Manag. Care Spec. Pharm. 2018, 24 (Suppl. S2-a), S3–S15. [Google Scholar] [CrossRef]
- Lançon, A.; Frazzi, R.; Latruffe, N. Anti-Oxidant, Anti-Inflammatory and Anti-Angiogenic Properties of Resveratrol in Ocular Diseases. Molecules 2016, 21, 304. [Google Scholar] [CrossRef]
- Nashine, S.; Cohen, P.; Chwa, M.; Lu, S.; Nesburn, A.B.; Kuppermann, B.D.; Kenney, M.C. Humanin G (HNG) protects age-related macular degeneration (AMD) transmitochondrial ARPE-19 cybrids from mitochondrial and cellular damage. Cell Death Dis. 2017, 8, e2951. [Google Scholar] [CrossRef]
- Nashine, S.; Cohen, P.; Nesburn, A.B.; Kuppermann, B.D.; Kenney, M.C. Characterizing the protective effects of SHLP2, a mitochondrial-derived peptide, in macular degeneration. Sci. Rep. 2018, 8, 15175. [Google Scholar] [CrossRef]
- Nashine, S.; Nesburn, A.B.; Kuppermann, B.D.; Kenney, M.C. Age-related macular degeneration (AMD) mitochondria modulate epigenetic mechanisms in retinal pigment epithelial cells. Exp. Eye Res. 2019, 189. [Google Scholar] [CrossRef]
- Nashine, S.; Chwa, M.; Kazemian, M.; Thaker, K.; Lu, S.; Nesburn, A.; Kuppermann, B.D.; Kenney, M.C. Differential Expression of Complement Markers in Normal and AMD Transmitochondrial Cybrids. PLoS ONE 2016, 11, e0159828. [Google Scholar] [CrossRef] [PubMed]
- Nashine, S.; Kanodia, R.; Nesburn, A.B.; Soman, G.; Kuppermann, B.D.; Kenney, M.C. Nutraceutical effects of Emblica officinalis in age-related macular degeneration. Aging 2019, 11, 1177–1188. [Google Scholar] [CrossRef] [PubMed]
- Nashine, S.; Subramaniam, S.R.; Chwa, M.; Nesburn, A.; Kuppermann, B.D.; Federoff, H.; Kenney, M.C. PU-91 drug rescues human age-related macular degeneration RPE cells; implications for AMD therapeutics. Aging 2019, 11, 6691–6713. [Google Scholar] [CrossRef] [PubMed]
- Orallo, F. Trans-resveratrol: A magical elixir of eternal youth? Curr. Med. Chem. 2008, 15, 1887–1898. [Google Scholar] [CrossRef]
- Andres, S.; Pevny, S.; Ziegenhagen, R.; Bakhiya, N.; Schäfer, B.; Hirsch-Ernst, K.I.; Lampen, A. Safety Aspects of the Use of Quercetin as a Dietary Supplement. Mol. Nutr. Food Res. 2018, 62. [Google Scholar] [CrossRef]
- Seong, H.; Ryu, J.; Yoo, W.S.; Kim, S.J.; Han, Y.S.; Park, J.M.; Kang, S.S.; Seo, S.W. Resveratrol Ameliorates Retinal Ischemia/Reperfusion Injury in C57BL/6J Mice via Downregulation of Caspase-3. Curr. Eye Res. 2017, 42, 1650–1658. [Google Scholar] [CrossRef]
- Luo, H.; Zhuang, J.; Hu, P.; Ye, W.; Chen, S.; Pang, Y.; Li, N.; Deng, C.; Zhang, X. Resveratrol Delays Retinal Ganglion Cell Loss and Attenuates Gliosis-Related Inflammation from Ischemia-Reperfusion Injury. Investig. Ophthalmol. Vis. Sci. 2018, 59, 3879–3888. [Google Scholar] [CrossRef]
- Lindsey, J.D.; Duong-Polk, K.X.; Hammond, D.; Leung, C.K.; Weinreb, R.N. Protection of injured retinal ganglion cell dendrites and unfolded protein response resolution after long-term dietary resveratrol. Neurobiol. Aging 2015, 36, 1969–1981. [Google Scholar] [CrossRef]
- Xin, X.; Dang, H.; Zhao, X.; Wang, H. Effects of Hypobaric Hypoxia on Rat Retina and Protective Response of Resveratrol to the Stress. Int. J. Med. Sci. 2017, 14, 943–950. [Google Scholar] [CrossRef]
- Means, J.C.; Gerdes, B.C.; Koulen, P. Distinct Mechanisms Underlying Resveratrol-Mediated Protection from Types of Cellular Stress in C6 Glioma Cells. Int. J. Mol. Sci. 2017, 18, 1521. [Google Scholar] [CrossRef]
- Bilski, P.; Belanger, A.G.; Chignell, C.F. Photosensitized oxidation of 2′,7′-dichlorofluorescin: Singlet oxygen does not contribute to the formation of fluorescent oxidation product 2′,7′-dichlorofluorescein. Free Radic. Biol. Med. 2002, 33, 938–946. [Google Scholar] [CrossRef]
- Zorov, D.B.; Juhaszova, M.; Sollott, S.J. Mitochondrial reactive oxygen species (ROS) and ROS-induced ROS release. Physiol. Rev. 2014, 94, 909–950. [Google Scholar] [CrossRef] [PubMed]
- Harman, D. The free radical theory of aging. Antioxid. Redox Signal. 2003, 5, 557–561. [Google Scholar] [CrossRef] [PubMed]
- Sanz, A.; Stefanatos, R.K. The mitochondrial free radical theory of aging: A critical view. Curr. Aging Sci. 2008, 1, 10–21. [Google Scholar] [CrossRef]
- Schieber, M.; Chandel, N.S. ROS function in redox signaling and oxidative stress. Curr. Biol. 2014, 24, R453–R462. [Google Scholar] [CrossRef]
- Kurutas, E.B. The importance of antioxidants which play the role in cellular response against oxidative/nitrosative stress: Current state. Nutr. J. 2016, 15, 71. [Google Scholar] [CrossRef]
- Shang, Y.J.; Qian, Y.P.; Liu, X.D.; Dai, F.; Shang, X.L.; Jia, W.Q.; Liu, Q.; Fang, J.G.; Zhou, B. Radical-scavenging activity and mechanism of resveratrol-oriented analogues: Influence of the solvent, radical, and substitution. J. Org. Chem. 2009, 74, 5025–5031. [Google Scholar] [CrossRef]
- Li, Y.; Cao, Z.; Zhu, H. Upregulation of endogenous antioxidants and phase 2 enzymes by the red wine polyphenol, resveratrol in cultured aortic smooth muscle cells leads to cytoprotection against oxidative and electrophilic stress. Pharmacol. Res. 2006, 53, 6–15. [Google Scholar] [CrossRef]
- Wang, X.; Meng, L.; Zhao, L.; Wang, Z.; Liu, H.; Liu, G.; Guan, G. Resveratrol ameliorates hyperglycemia-induced renal tubular oxidative stress damage via modulating the SIRT1/FOXO3a pathway. Diabetes Res. Clin. Pract. 2017, 126, 172–181. [Google Scholar] [CrossRef]
- Wang, N.; Luo, Z.; Jin, M.; Sheng, W.; Wang, H.T.; Long, X.; Wu, Y.; Hu, P.; Xu, H.; Zhang, X. Exploration of age-related mitochondrial dysfunction and the anti-aging effects of resveratrol in zebrafish retina. Aging 2019, 11, 3117–3137. [Google Scholar] [CrossRef]
- Brown, V.A.; Patel, K.R.; Viskaduraki, M.; Crowell, J.A.; Perloff, M.; Booth, T.D.; Vasilinin, G.; Sen, A.; Schinas, A.M.; Piccirilli, G.; et al. Repeat dose study of the cancer chemopreventive agent resveratrol in healthy volunteers: Safety, pharmacokinetics, and effect on the insulin-like growth factor axis. Cancer Res. 2010, 70, 9003–9011. [Google Scholar] [CrossRef] [PubMed]
- Howells, L.M.; Berry, D.P.; Elliott, P.J.; Jacobson, E.W.; Hoffmann, E.; Hegarty, B.; Brown, K.; Steward, W.P.; Gescher, A.J. Phase I randomized, double-blind pilot study of micronized resveratrol (SRT501) in patients with hepatic metastases—Safety, pharmacokinetics, and pharmacodynamics. Cancer Prev. Res. 2011, 4, 1419–1425. [Google Scholar] [CrossRef] [PubMed]


| AMD PATIENT # | GENDER | AGE | AMD TYPE |
|---|---|---|---|
| PATIENT #1 | MALE | 76 | WET |
| PATIENT #2 | FEMALE | 75 | WET |
| PATIENT #3 | MALE | 83 | WET |
| PATIENT #4 | MALE | 74 | WET |
| PATIENT #5 | MALE | 87 | DRY |
| PATIENT #6 | MALE | 83 | DRY |
| PATIENT #7 | MALE | 77 | DRY |
| PATIENT #8 | MALE | 76 | DRY |
| PATIENT #9 | MALE | 90 | WET |
| PATIENT #10 | FEMALE | 84 | WET |
| PATIENT #11 | FEMALE | 86 | WET |
| PATIENT #12 | MALE | 69 | DRY |
| PATIENT #13 | FEMALE | 76 | WET |
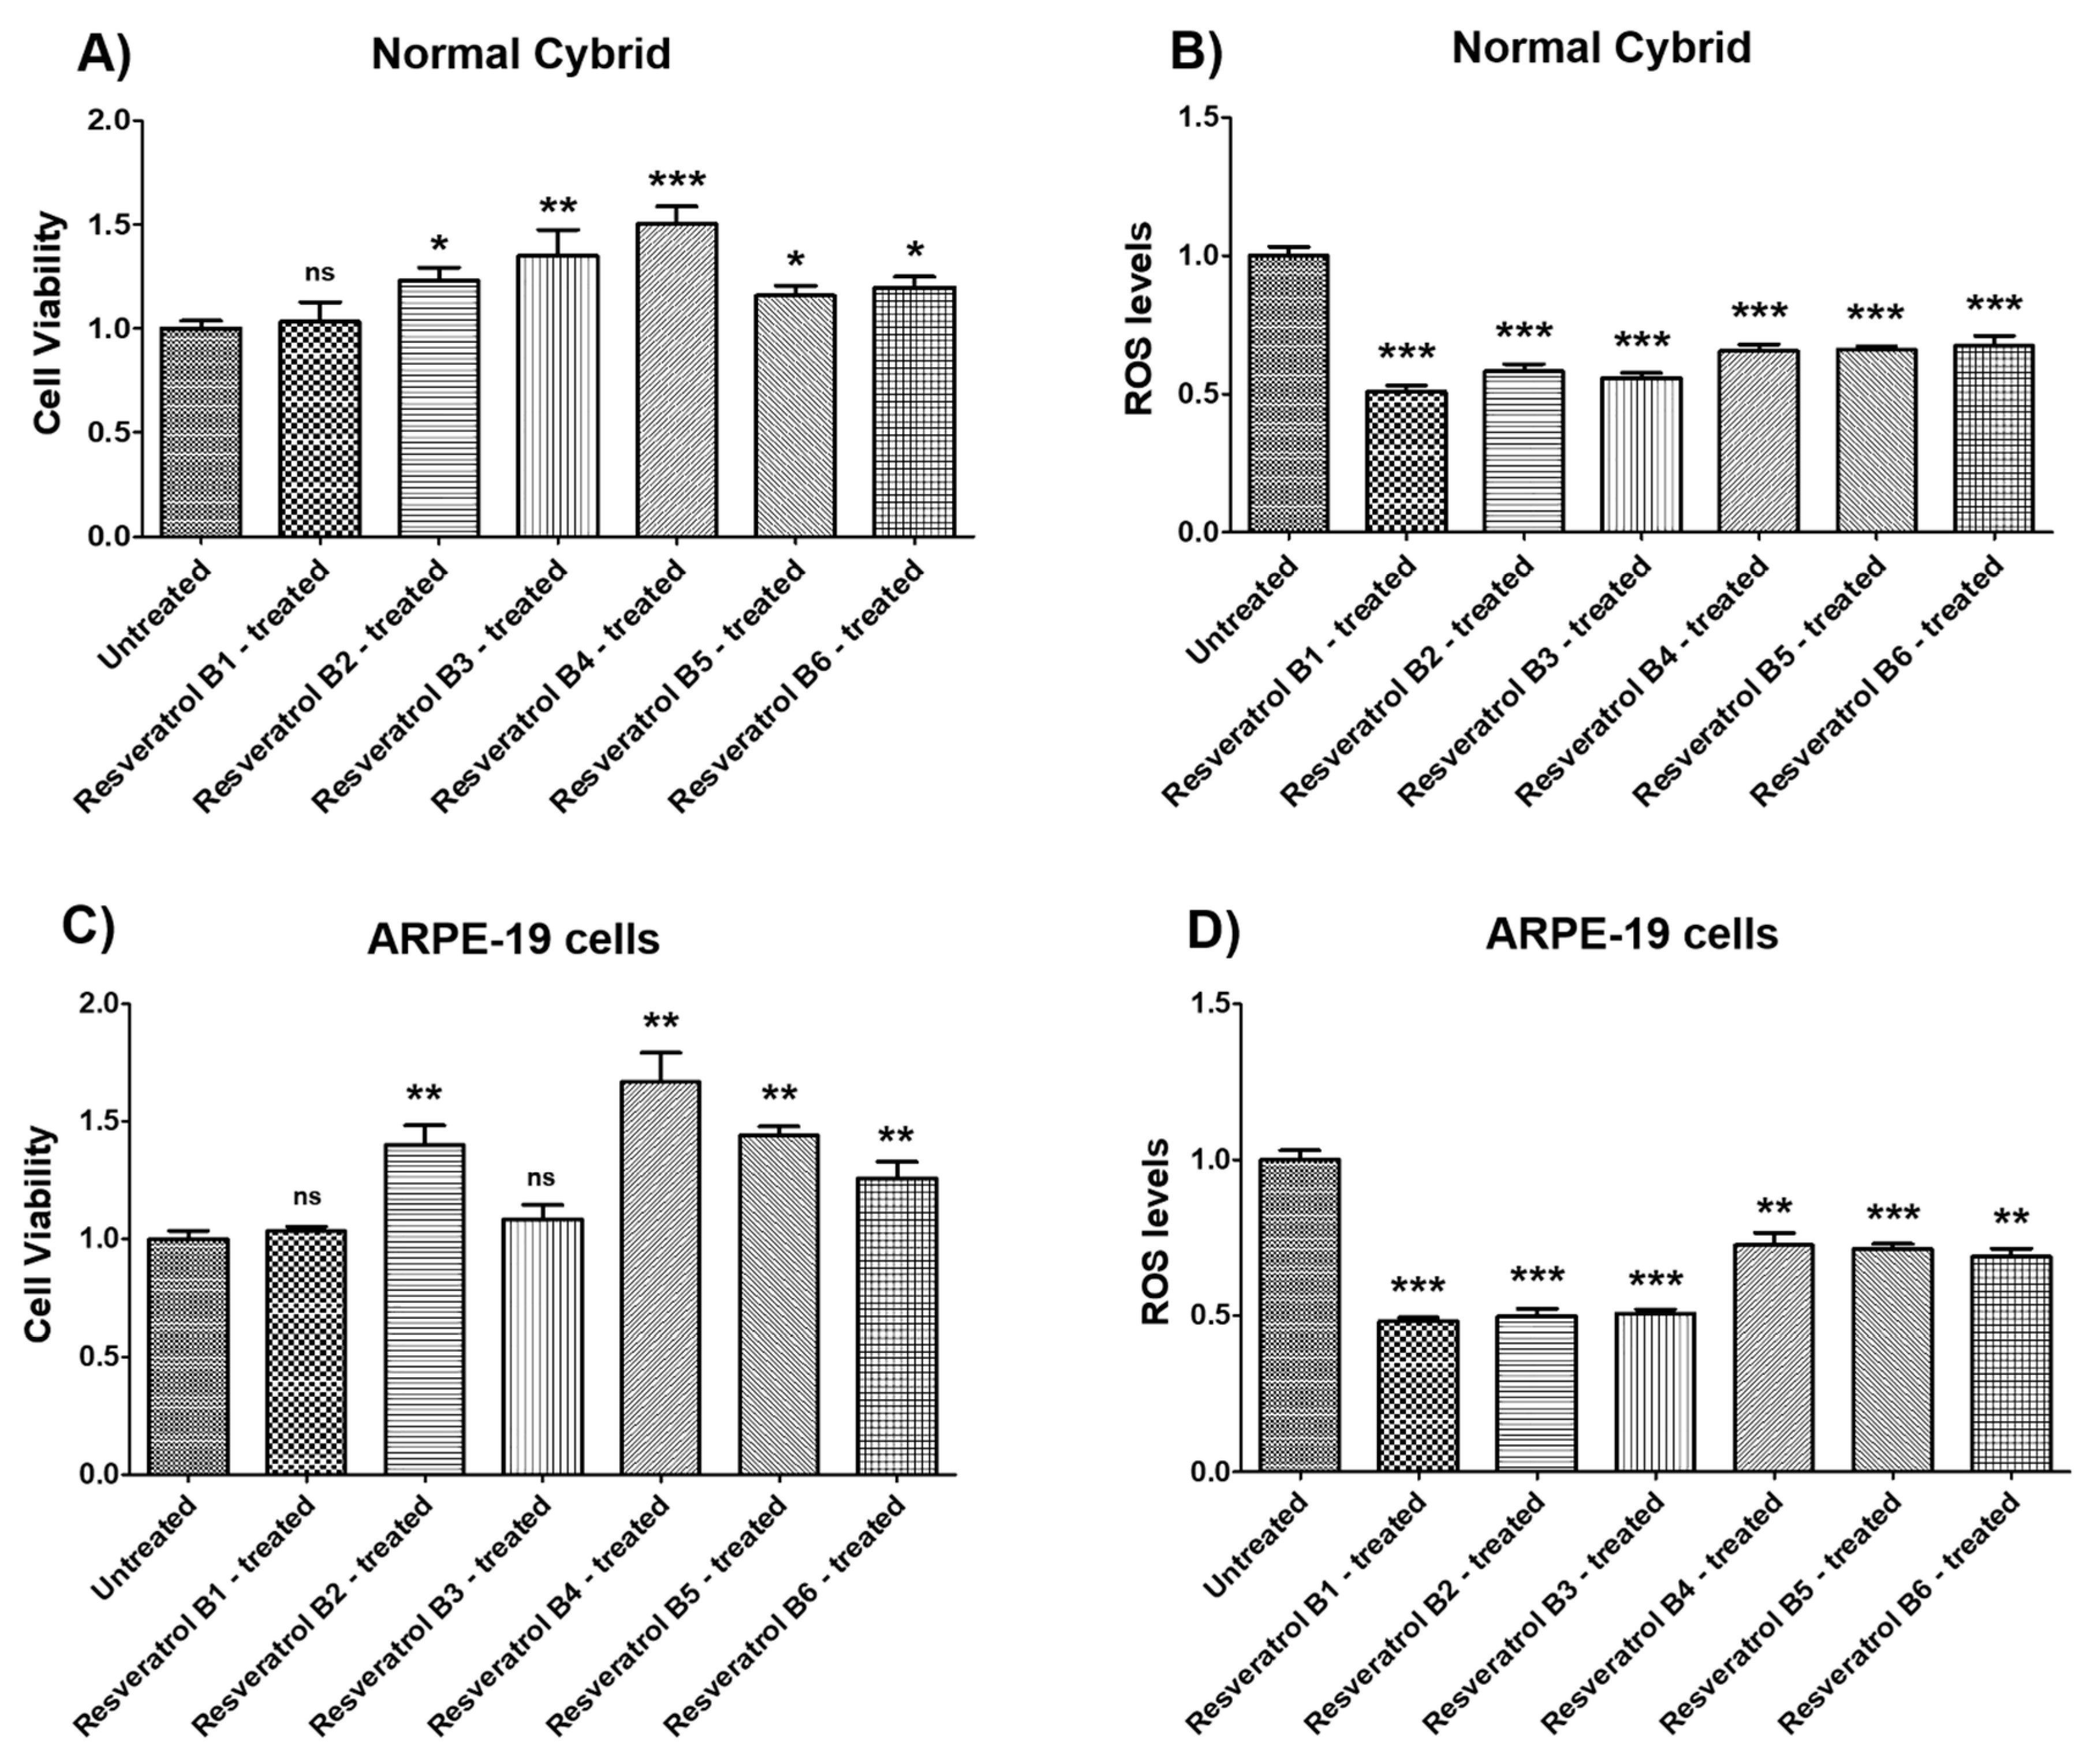
| (a) Normal Cybrid_Resveratrol Effects on Cell Viability. | |||
| Cell Viability | Percent Increase/p-Value | Untreated Mean ± SEM | Resveratrol Brands Mean ± SEM |
| NL UN vs. NL B1-treated | 3.3% 0.7748 (ns) | 1 ± 0.03821 | 1.033 ± 0.09471 |
| NL UN vs. NL B2-treated | 23.2% 0.0175 | 1 ± 0.03821 | 1.232 ± 0.06256 |
| NL UN vs. NL B3-treated | 35.1% 0.0041 | 1 ± 0.03821 | 1.351 ± 0.1249 |
| NL UN vs. NL B4-treated | 50.4% 0.0006 | 1 ± 0.03821 | 1.504 ± 0.08458 |
| NL UN vs. NL B5-treated | 15.9% 0.0350 | 1 ± 0.03821 | 1.159 ± 0.04787 |
| NL UN vs. NL B6-treated | 19.8% 0.0221 | 1 ± 0.03821 | 1.198 ± 0.05209 |
| (b) Normal Cybrid_Resveratrol Effects on ROS Levels. | |||
| Cell Viability | Percent Decrease/p-Value | Untreated Mean ± SEM | Resveratrol Brands Mean ± SEM |
| NL UN vs. NL B1-treated | 49.15% 0.0006 | 1 ± 0.03147 | 0.5085 ± 0.02217 |
| NL UN vs. NL B2-treated | 41.71% 0.0006 | 1 ± 0.03147 | 0.5829 ± 0.02555 |
| NL UN vs. NL B3-treated | 44.19% 0.0006 | 1 ± 0.03147 | 0.5581 ± 0.01816 |
| NL UN vs. NL B4-treated | 34.52% 0.0006 | 1 ± 0.03147 | 0.6548 ± 0.02463 |
| NL UN vs. NL B5-treated | 33.98% 0.0006 | 1 ± 0.03147 | 0.6602 ± 0.01098 |
| NL UN vs. NL B6-treated | 32.55% 0.0006 | 1 ± 0.03147 | 0.6745 ± 0.03597 |
| (c) ARPE-19 cells Resveratrol Effects on Cell Viability. | |||
| Cell Viability | Percent Increase/p-Value | Untreated Mean ± SEM | Resveratrol brands Mean ± SEM |
| ARPE-19 UN vs. ARPE-19 B1-treated | 3.5% 0.5476 (ns) | 1 ± 0.03600 | 1.035 ± 0.02017 |
| ARPE-19 UN vs. ARPE-19 B2-treated | 40% 0.0012 | 1 ± 0.03600 | 1.400 ± 0.08388 |
| ARPE-19 UN vs. ARPE-19 B3-treated | 8.4% 0.2619 (ns) | 1 ± 0.03600 | 1.084 ± 0.06225 |
| ARPE-19 UN vs. ARPE-19 B4-treated | 66.9% 0.0012 | 1 ± 0.03600 | 1.669 ± 0.1240 N = 7 |
| ARPE-19 UN vs. ARPE-19 B5-treated | 44.2% 0.0012 | 1 ± 0.03600 | 1.442 ± 0.03927 |
| ARPE-19 UN vs. ARPE-19 B6-treated | 25.9% 0.0023 | 1 ± 0.03600 | 1.259 ± 0.07003 |
| (d) ARPE-19 cells_Resveratrol Effects on ROS Levels. | |||
| Cell Viability | Percent Decrease/p-Value | Untreated Mean ± SEM | Resveratrol Brands Mean ± SEM |
| ARPE-19 UN vs. ARPE-19 B1-treated | 51.76% 0.0006 | 1 ± 0.02965 | 0.4824 ± 0.01264 |
| ARPE-19 UN vs. ARPE-19 B2-treated | 50.17% 0.0006 | 1 ± 0.02965 | 0.4983 ± 0.02390 |
| ARPE-19 UN vs. ARPE-19 B3-treated | 49.45% 0.0006 | 1 ± 0.02965 | 0.5055 ± 0.01476 |
| ARPE-19 UN vs. ARPE-19 B4-treated | 27.38% 0.0023 | 1 ± 0.02965 | 0.7262 ± 0.03931 |
| ARPE-19 UN vs. ARPE-19 B5-treated | 28.67% 0.0006 | 1 ± 0.02965 | 0.7133 ± 0.01624 |
| ARPE-19 UN vs. ARPE-19 B6-treated | 31.11% 0.0012 | 1 ± 0.02965 | 0.6889 ± 0.02664 |
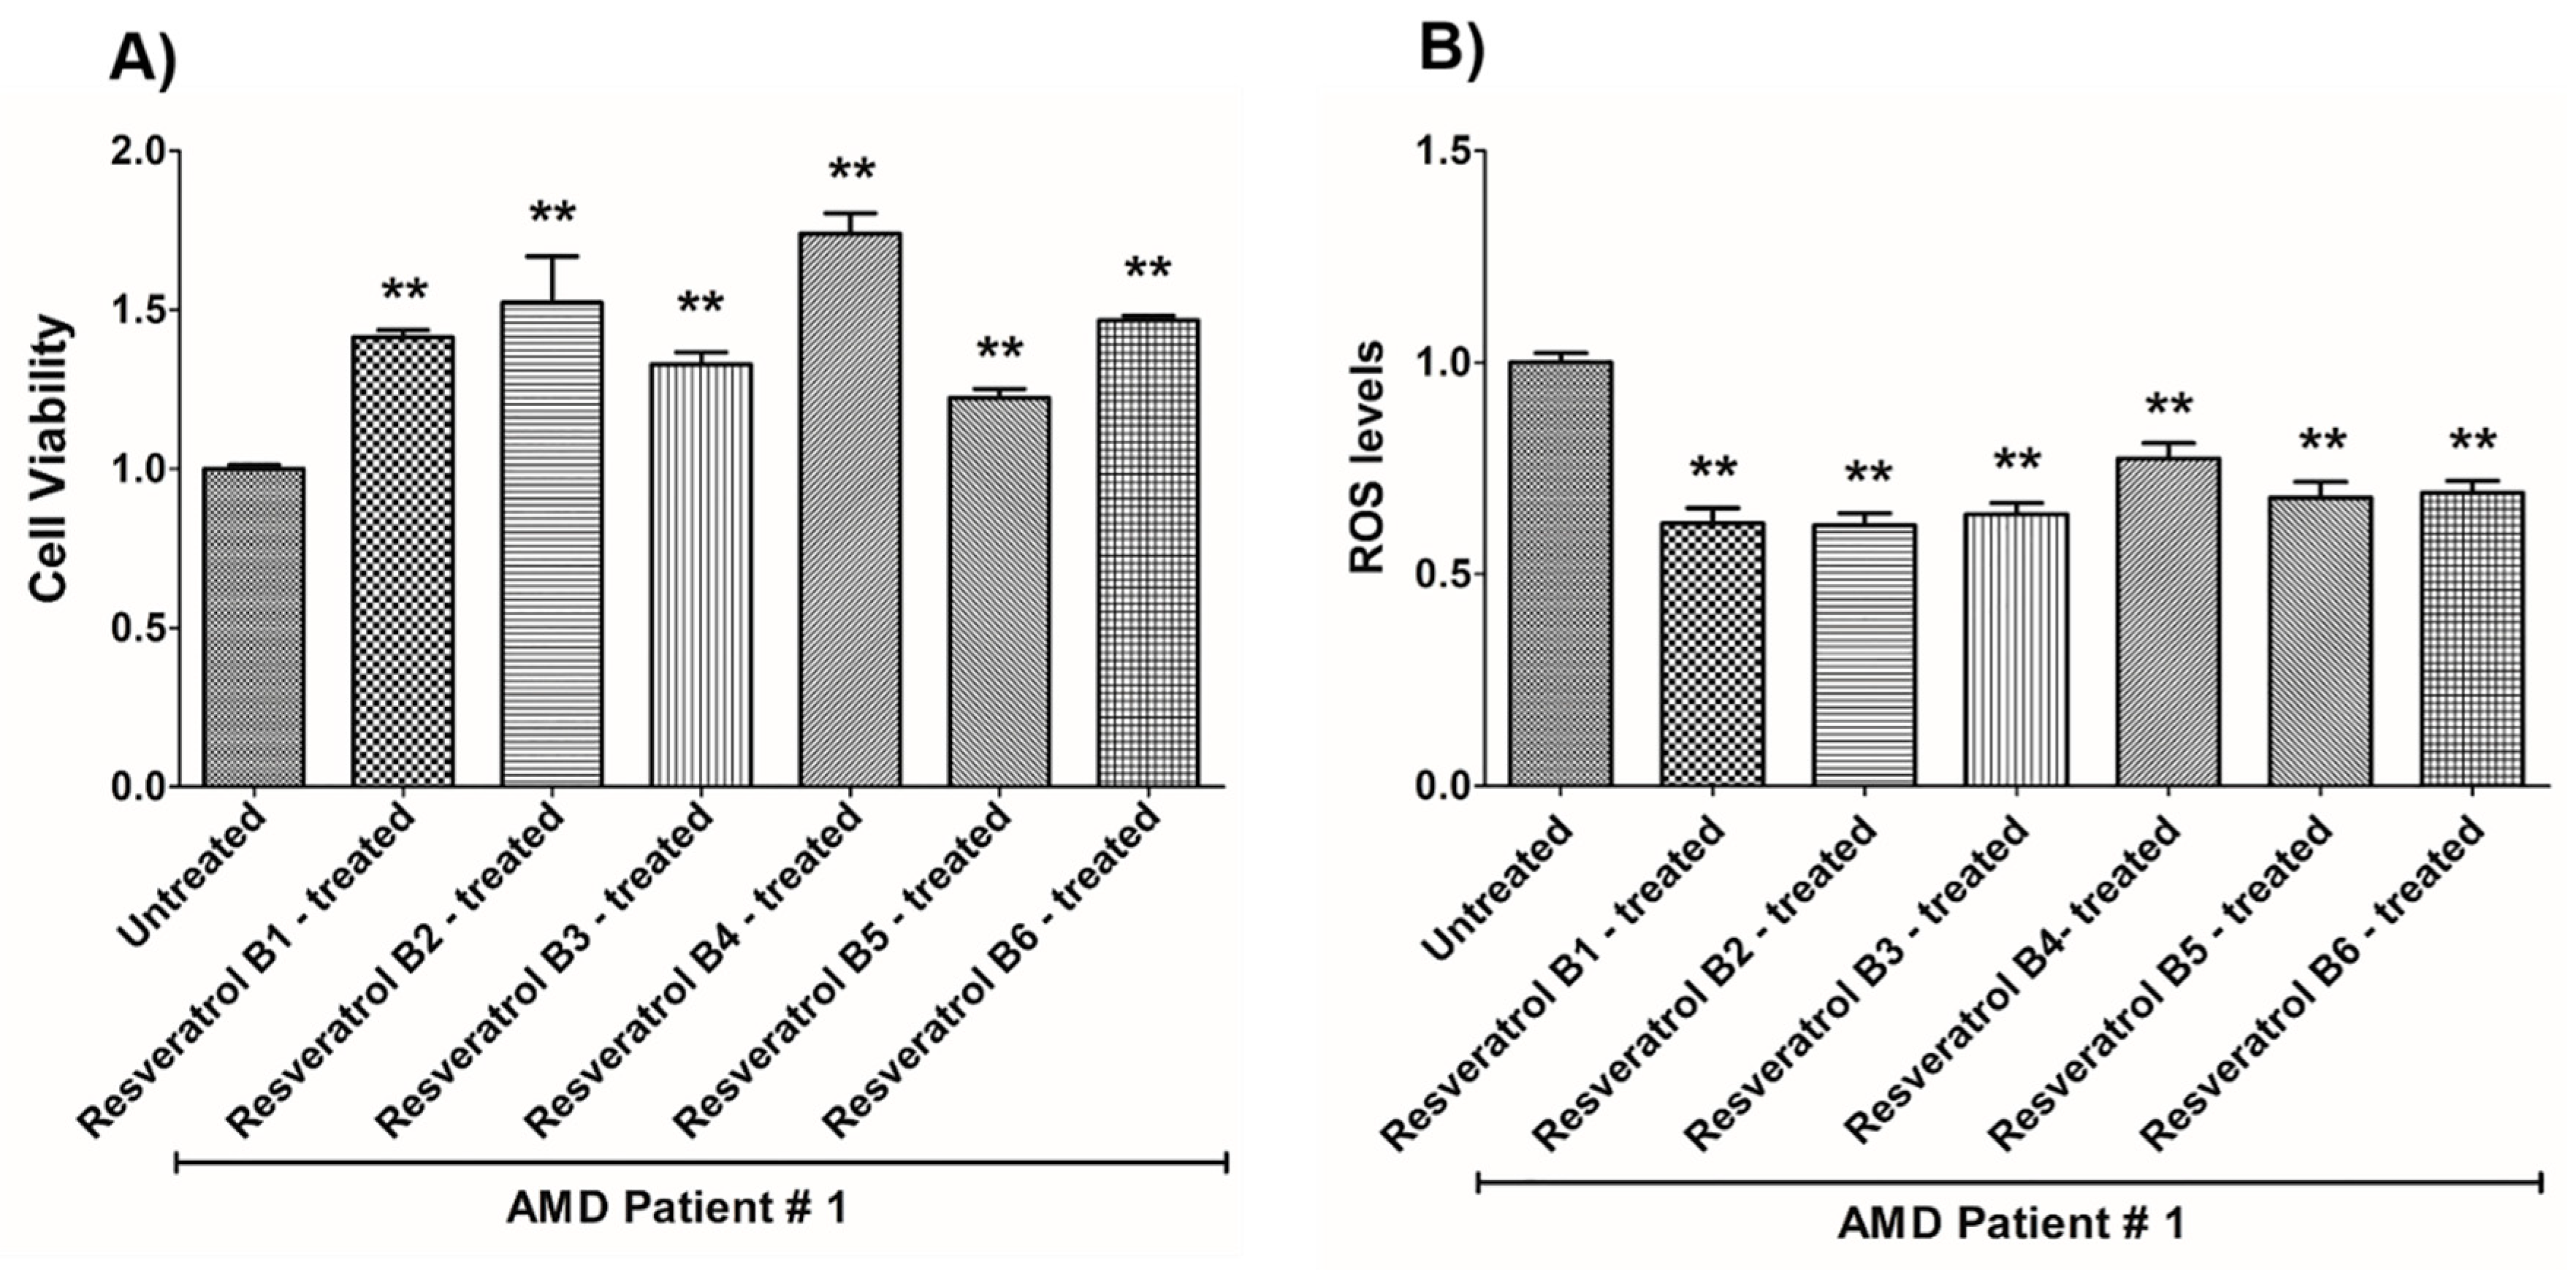
| (a) AMD PATIENT #1_Resveratrol Effects on Cell Viability. | |||
| Cell Viability | Percent Increase/p-Value | Untreated Mean ± SEM | Resveratrol Brands Mean ± SEM |
| AMD UN vs. AMD B1-treated | 41.5% 0.0025 | 1 ± 0.01234 | 1.415 ± 0.02189 |
| AMD UN vs. AMD B2-treated | 52.2% 0.0025 | 1 ± 0.01234 | 1.522 ± 0.1461 |
| AMD UN vs. AMD B3-treated | 32.8% 0.0025 | 1 ± 0.01234 | 1.328 ± 0.03817 |
| AMD UN vs. AMD B4-treated | 73.9% 0.0025 | 1 ± 0.01234 | 1.739 ± 0.06509 |
| AMD UN vs. AMD B5-treated | 22.3% 0.0079 | 1 ± 0.01234 | 1.223 ± 0.02813 |
| AMD UN vs. AMD B6-treated | 46.7% 0.0025 | 1 ± 0.01234 | 1.467 ± 0.01599 |
| (b) AMD PATIENT #1_Resveratrol Effects on ROS Levels. | |||
| Ros Levels | Percent Decrease/p-Value | Untreated Mean ± SEM | Resveratrol Brands Mean ± SEM |
| AMD UN vs. AMD B1-treated | 37.98% 0.0012 | 1 ± 0.02236 | 0.6202 ± 0.03585 |
| AMD UN vs. AMD B2-treated | 38.43% 0.0012 | 1 ± 0.02236 | 0.6157 ± 0.02837 |
| AMD UN vs. AMD B3-treated | 35.83% 0.0022 | 1 ± 0.02236 | 0.6417 ± 0.02666 |
| AMD UN vs. AMD B4-treated | 22.68% 0.0022 | 1 ± 0.02236 | 0.7732 ± 0.03661 |
| AMD UN vs. AMD B5-treated | 31.93% 0.0022 | 1 ± 0.02236 | 0.6807 ± 0.03729 |
| AMD UN vs. AMD B6-treated | 30.79% 0.0022 | 1 ± 0.02236 | 0.6921 ± 0.02871 |
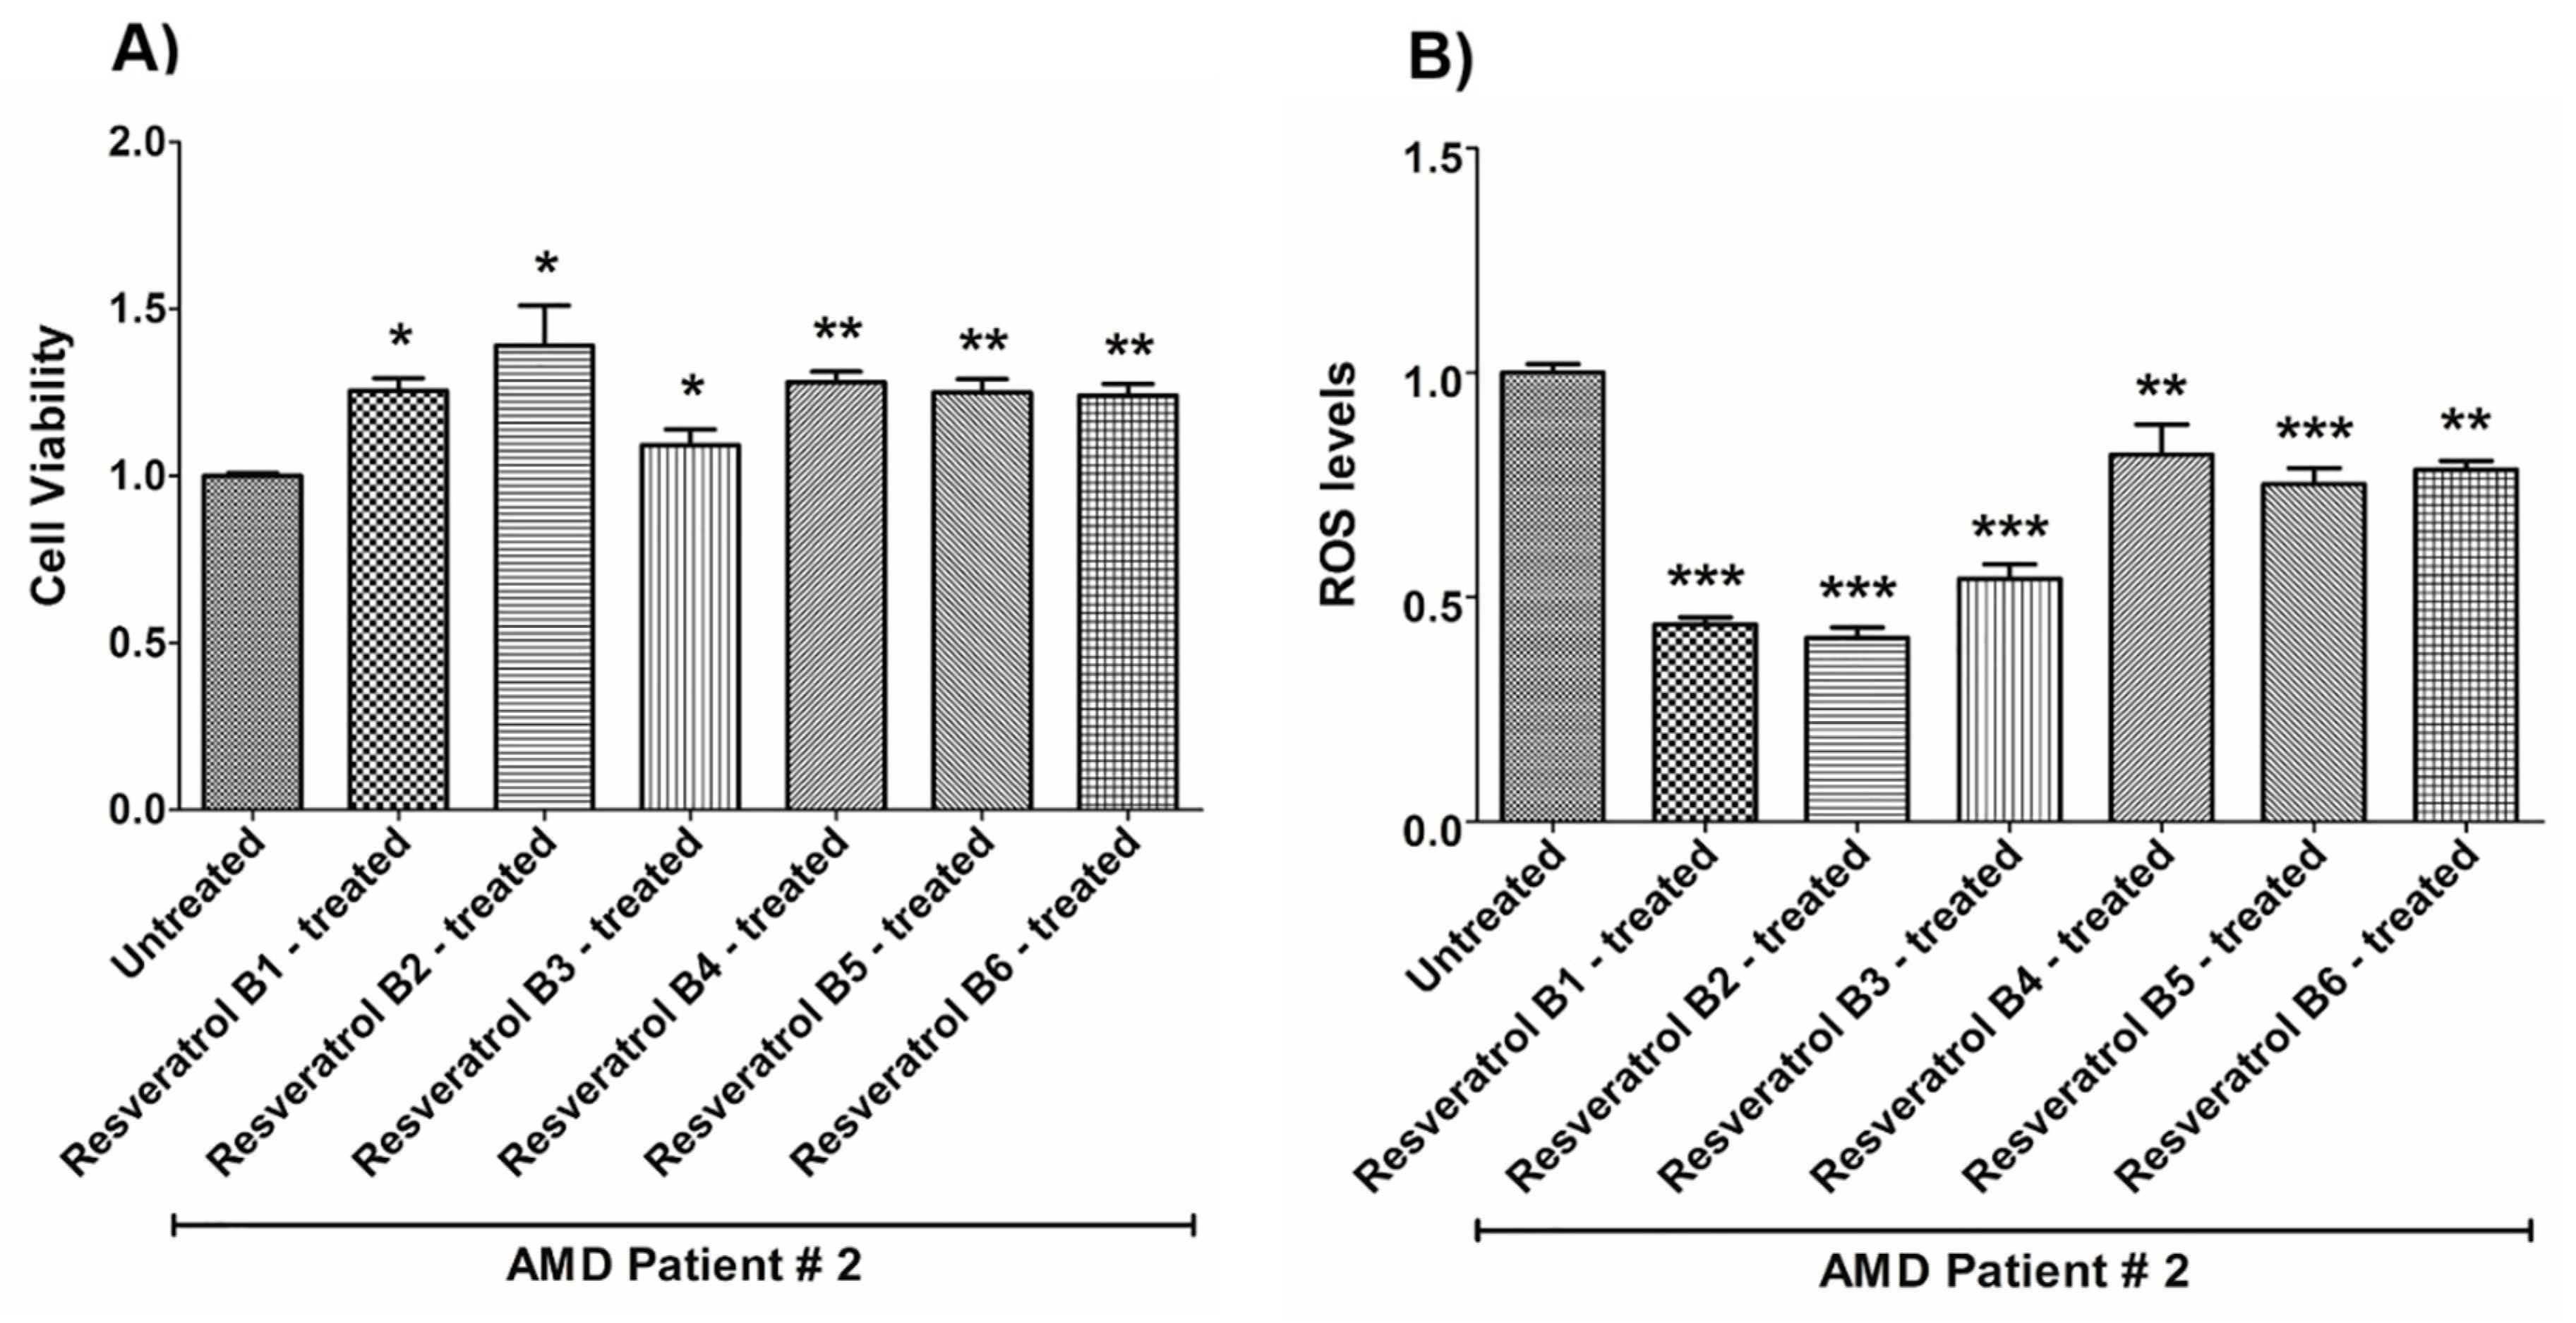
| (a) AMD PATIENT #2_Resveratrol Effects on Cell Viability. | |||
| Cell Viability | Percent Increase/p-Value | Untreated Mean ± SEM | Resveratrol Brands Mean ± SEM |
| AMD UN vs. AMD B1-treated | 25.5% 0.0159 | 1 ± 0.009554 | 1.255 ± 0.03819 |
| AMD UN vs. AMD B2-treated | 39% 0.0159 | 1 ± 0.009554 | 1.390 ± 0.1207 |
| AMD UN vs. AMD B3-treated | 9.2% 0.0357 | 1 ± 0.009554 | 1.092 ± 0.04765 |
| AMD UN vs. AMD B4-treated | 28% 0.0016 | 1 ± 0.009554 | 1.280 ± 0.03231 |
| AMD UN vs. AMD B5-treated | 25% 0.0025 | 1 ± 0.009554 | 1.250 ± 0.04042 |
| AMD UN vs. AMD B6-treated | 24.1% 0.0016 | 1 ± 0.009554 | 1.241 ± 0.03463 |
| (b) AMD PATIENT #2_Resveratrol Effects on ROS Levels. | |||
| Ros Levels | Percent Decrease/p-Value | Untreated Mean ± SEM | Resveratrol Brands Mean ± SEM |
| AMD UN vs. AMD B1-treated | 56.1% 0.0002 | 1 ± 0.01954 | 0.4390 ± 0.01638 |
| AMD UN vs. AMD B2-treated | 59.08% 0.0002 | 1 ± 0.01954 | 0.4092 ± 0.02385 |
| AMD UN vs. AMD B3-treated | 45.86% 0.0002 | 1± 0.01954 | 0.5414 ± 0.03204 |
| AMD UN vs. AMD B4-treated | 18.26% 0.0040 | 1 ± 0.01954 | 0.8174 ± 0.06757 |
| AMD UN vs. AMD B5-treated | 24.81% 0.0002 | 1 ± 0.01954 | 0.7519 ± 0.03579 |
| AMD UN vs. AMD B6-treated | 21.63% 0.0040 | 1 ± 0.01954 | 0.7837 ± 0.01963 |
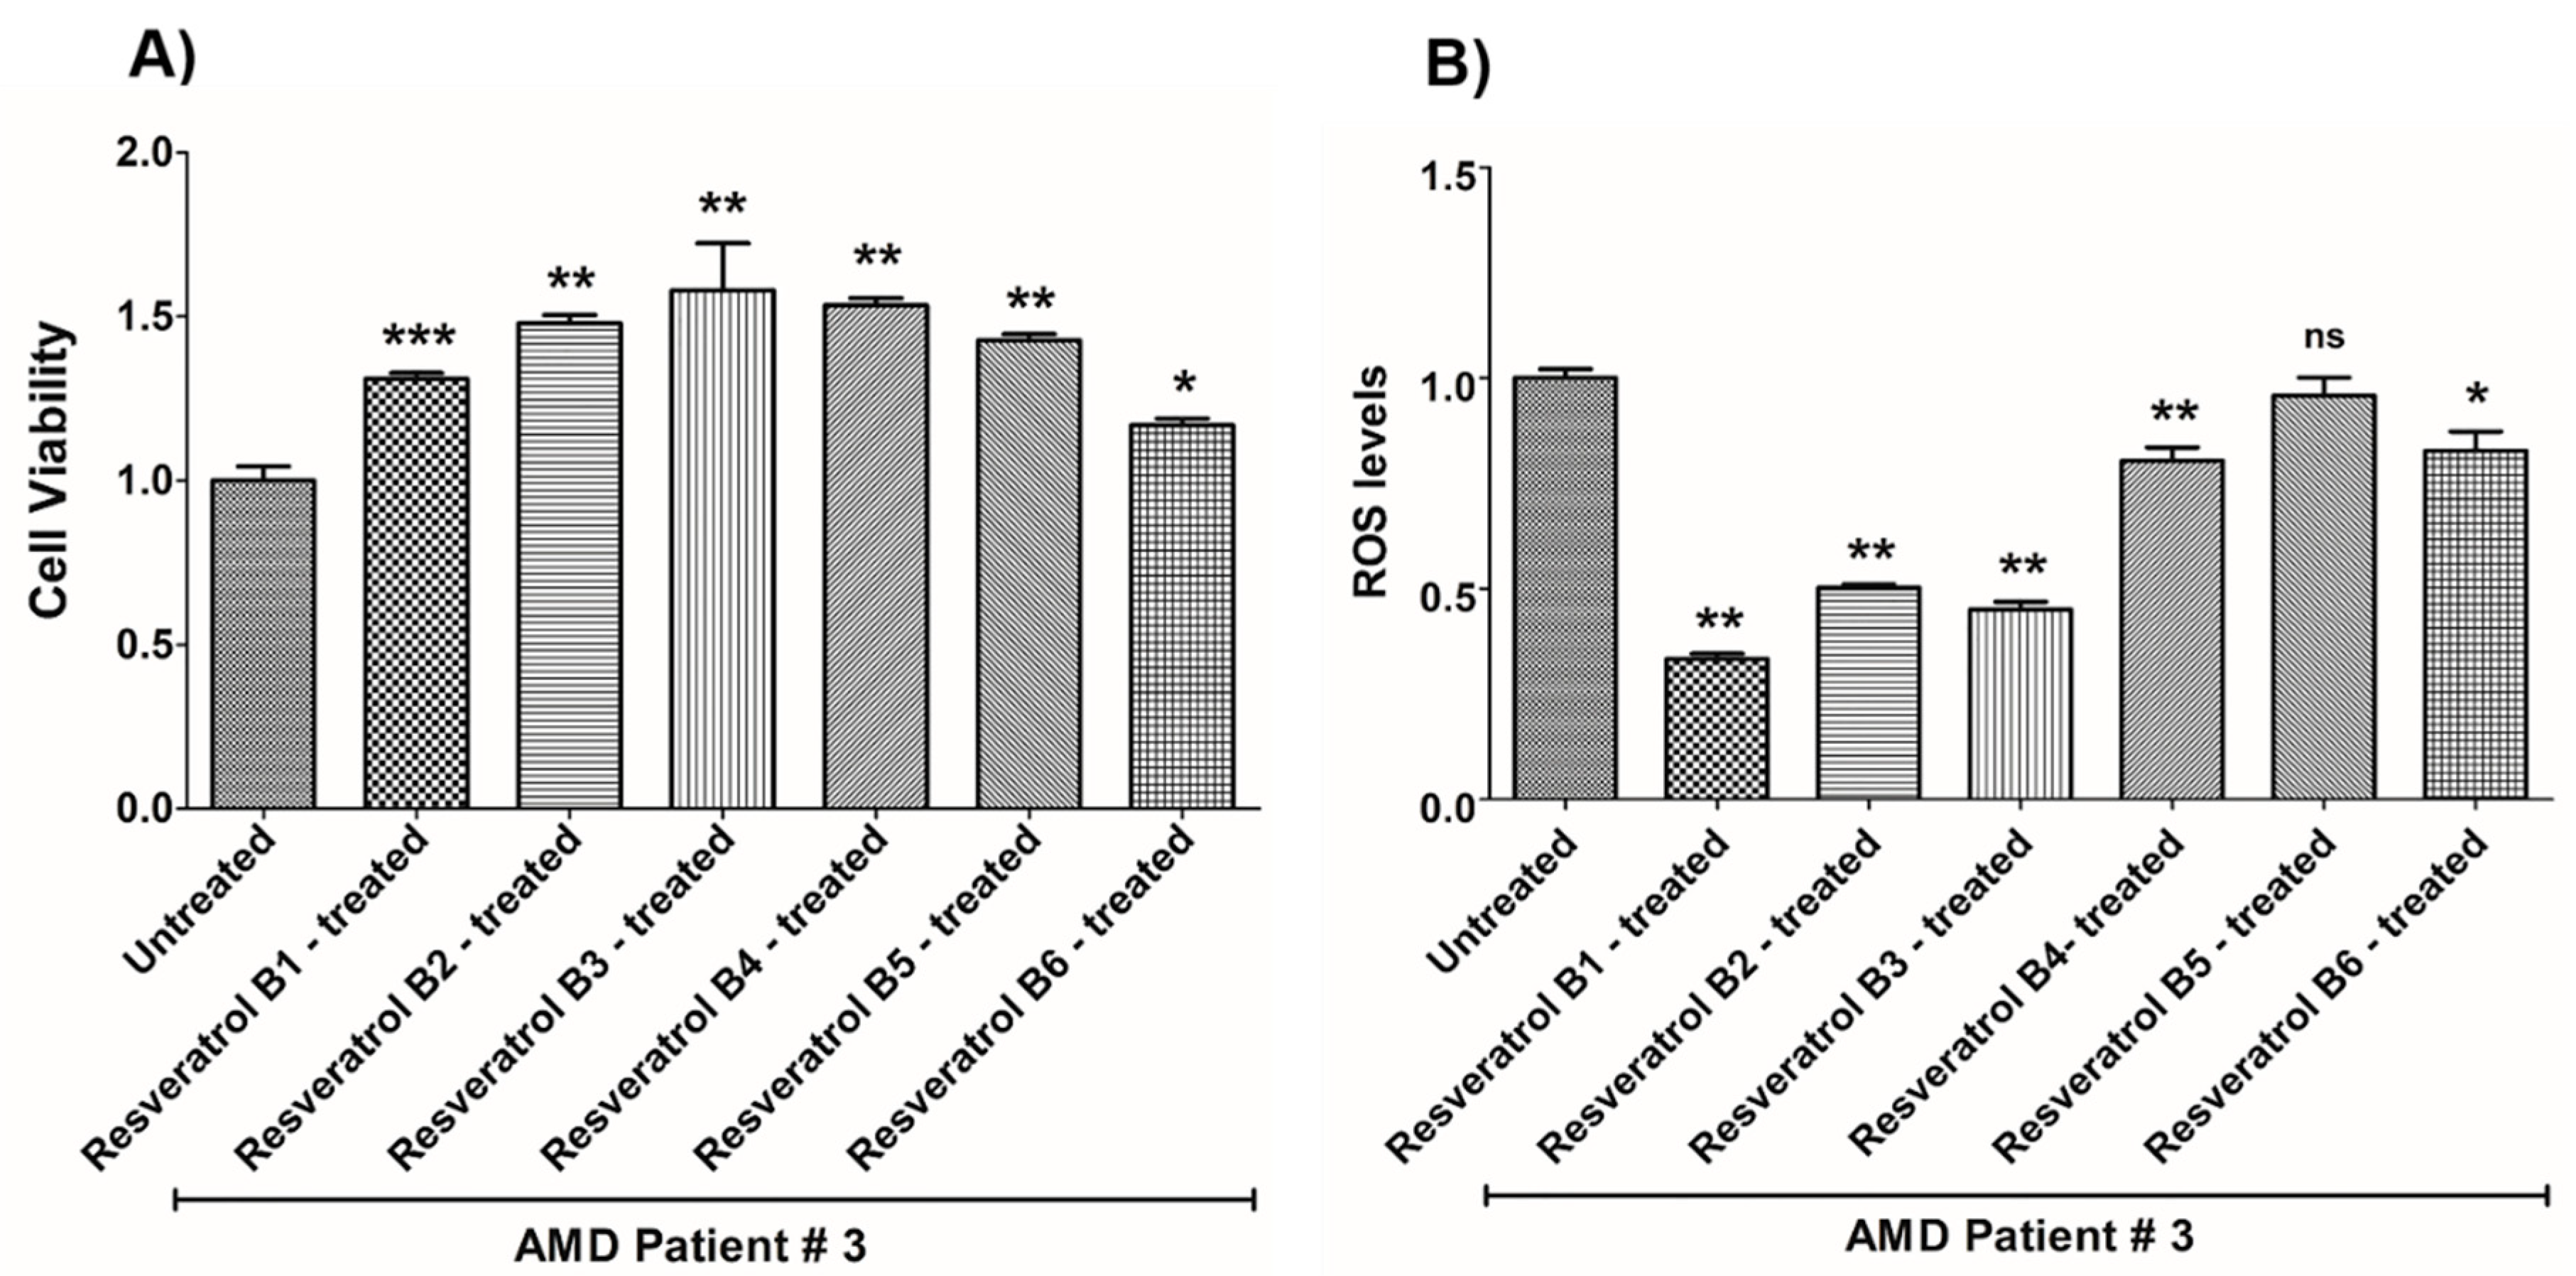
| (a) AMD PATIENT #3_Resveratrol Effects on Cell Viability. | |||
| Cell Viability | Percent Increase/p-Value | Untreated Mean ± SEM | Resveratrol Brands Mean ± SEM |
| AMD UN vs. AMD B1-treated | 31% 0.0003 | 1 ± 0.04315 | 1.310 ± 0.01742 |
| AMD UN vs. AMD B2-treated | 48% 0.0014 | 1 ± 0.04315 | 1.480 ± 0.02474 |
| AMD UN vs. AMD B3-treated | 57.9% 0.0014 | 1 ± 0.04315 | 1.579 ± 0.1443 |
| AMD UN vs. AMD B4-treated | 53.4% 0.0014 | 1 ± 0.04315 | 1.534 ± 0.02238 |
| AMD UN vs. AMD B5-treated | 42.7% 0.0014 | 1 ± 0.04315 | 1.427 ± 0.01969 |
| AMD UN vs. AMD B6-treated | 16.9% 0.0175 | 1 ± 0.04315 | 1.169 ± 0.01962 |
| (b) AMD PATIENT #3_Resveratrol Effects on ROS Levels. | |||
| Ros Levels | Percent Decrease/p-Value | Untreated Mean ± SEM | Resveratrol Brands Mean ± SEM |
| AMD UN vs. AMD B1-treated | 66.68% 0.0014 | 1 ± 0.02114 | 0.3332 ± 0.01312 |
| AMD UN vs. AMD B2-treated | 49.79% 0.0014 | 1 ± 0.02114 | 0.5021 ± 0.008318 |
| AMD UN vs. AMD B3-treated | 54.96% 0.0014 | 1 ± 0.02114 | 0.4504 ± 0.01886 |
| AMD UN vs. AMD B4-treated | 19.68% 0.0021 | 1 ± 0.02114 | 0.8032 ± 0.03226 |
| AMD UN vs. AMD B5-treated | 4.17% 0.5074 | 1 ± 0.02114 | 0.9583 ± 0.04245 |
| AMD UN vs. AMD B6-treated | 17.2% 0.0294 | 1 ± 0.02114 | 0.8280 ± 0.04493 |
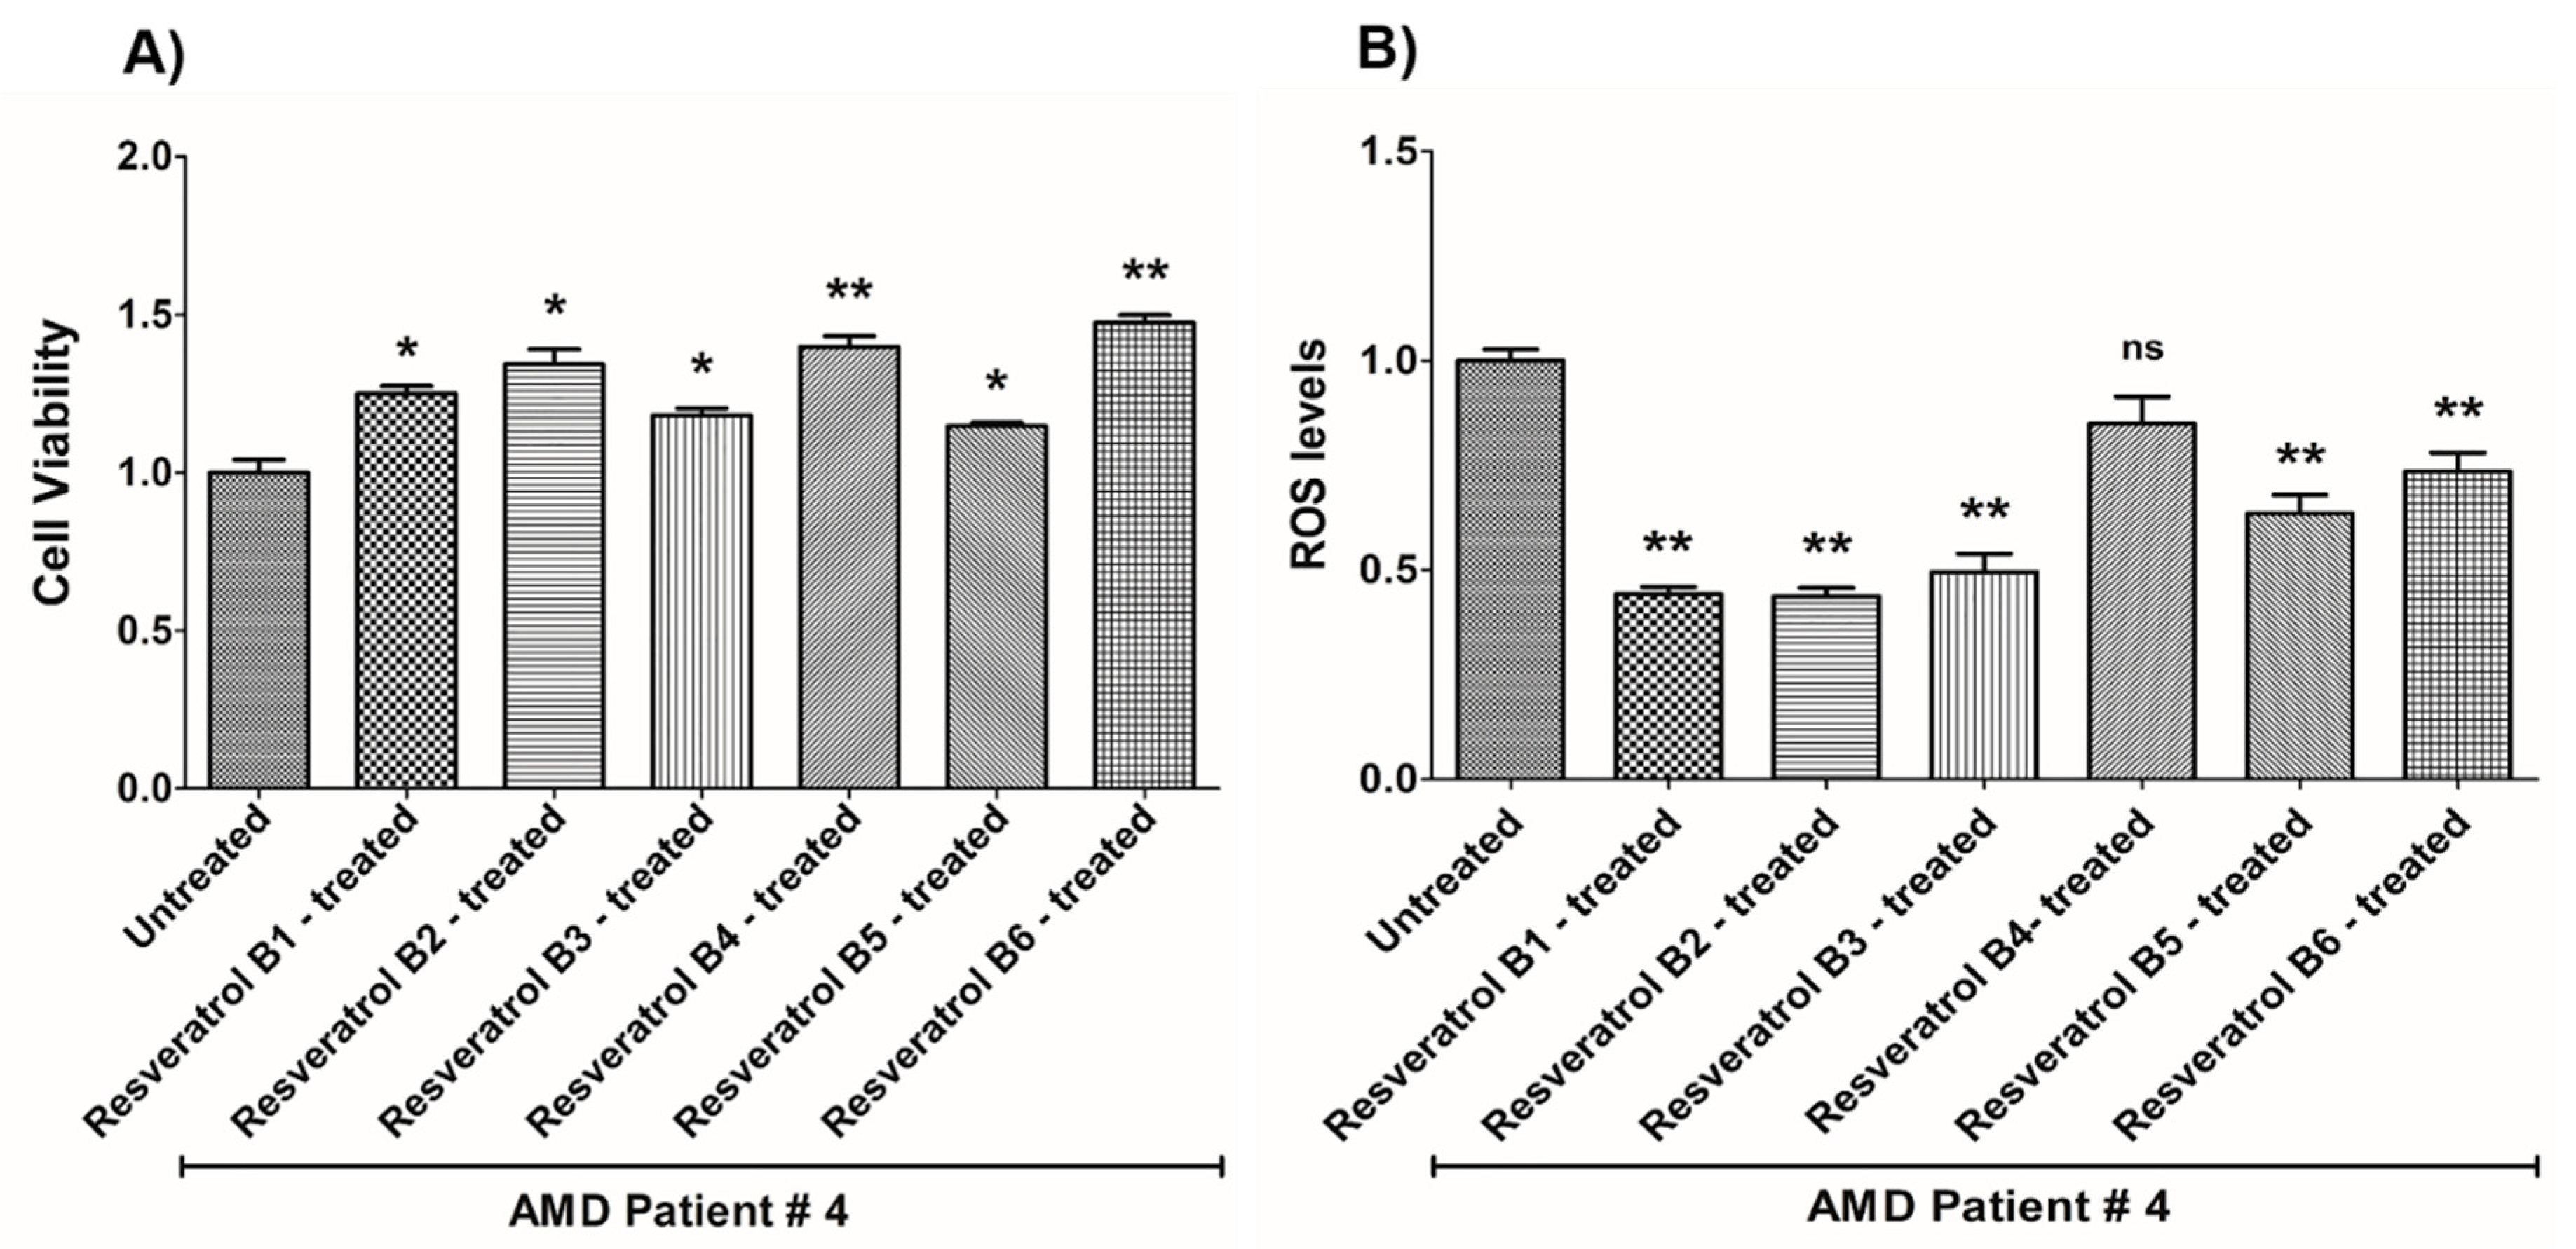
| (a) AMD PATIENT #4_Resveratrol Effects on Cell Viability. | |||
| Cell Viability | Percent Increase/p-Value | Untreated Mean ± SEM | Resveratrol Brands Mean ± SEM |
| AMD UN vs. AMD B1-treated | 25.1% 0.0294 | 1 ± 0.04158 | 1.251 ± 0.02404 |
| AMD UN vs. AMD B2-treated | 34.3% 0.0139 | 1 ± 0.04158 | 1.343 ± 0.04756 |
| AMD UN vs. AMD B3-treated | 18.1% 0.0498 | 1 ± 0.04158 | 1.181 ± 0.02298 |
| AMD UN vs. AMD B4-treated | 39.8% 0.0084 | 1 ± 0.04158 | 1.398 ± 0.03422 |
| AMD UN vs. AMD B5-treated | 14.8% 0.0195 | 1 ± 0.04158 | 1.148 ± 0.01154 |
| AMD UN vs. AMD B6-treated | 47.5% 0.0084 | 1 ± 0.04158 | 1.475 ± 0.02335 |
| (b) AMD PATIENT #4_Resveratrol Effects on ROS Levels. | |||
| Ros Levels | Percent Decrease/p-Value | Untreated Mean ± SEM | Resveratrol Brands Mean ± SEM |
| AMD UN vs. AMD B1-treated | 55.75% 0.0043 | 1 ± 0.02706 | 0.4425 ± 0.01686 |
| AMD UN vs. AMD B2-treated | 56.32% 0.0043 | 1 ± 0.02706 | 0.4368 ± 0.02059 |
| AMD UN vs. AMD B3-treated | 50.5% 0.0079 | 1 ± 0.02706 | 0.4950 ± 0.04428 |
| AMD UN vs. AMD B4-treated | 14.99% 0.0714 | 1 ± 0.02706 | 0.8501 ± 0.06433 |
| AMD UN vs. AMD B5-treated | 36.55% 0.0079 | 1 ± 0.02706 | 0.6345 ± 0.04495 |
| AMD UN vs. AMD B6-treated | 26.44% 0.0079 | 1 ± 0.02706 | 0.7356 ± 0.04426 |
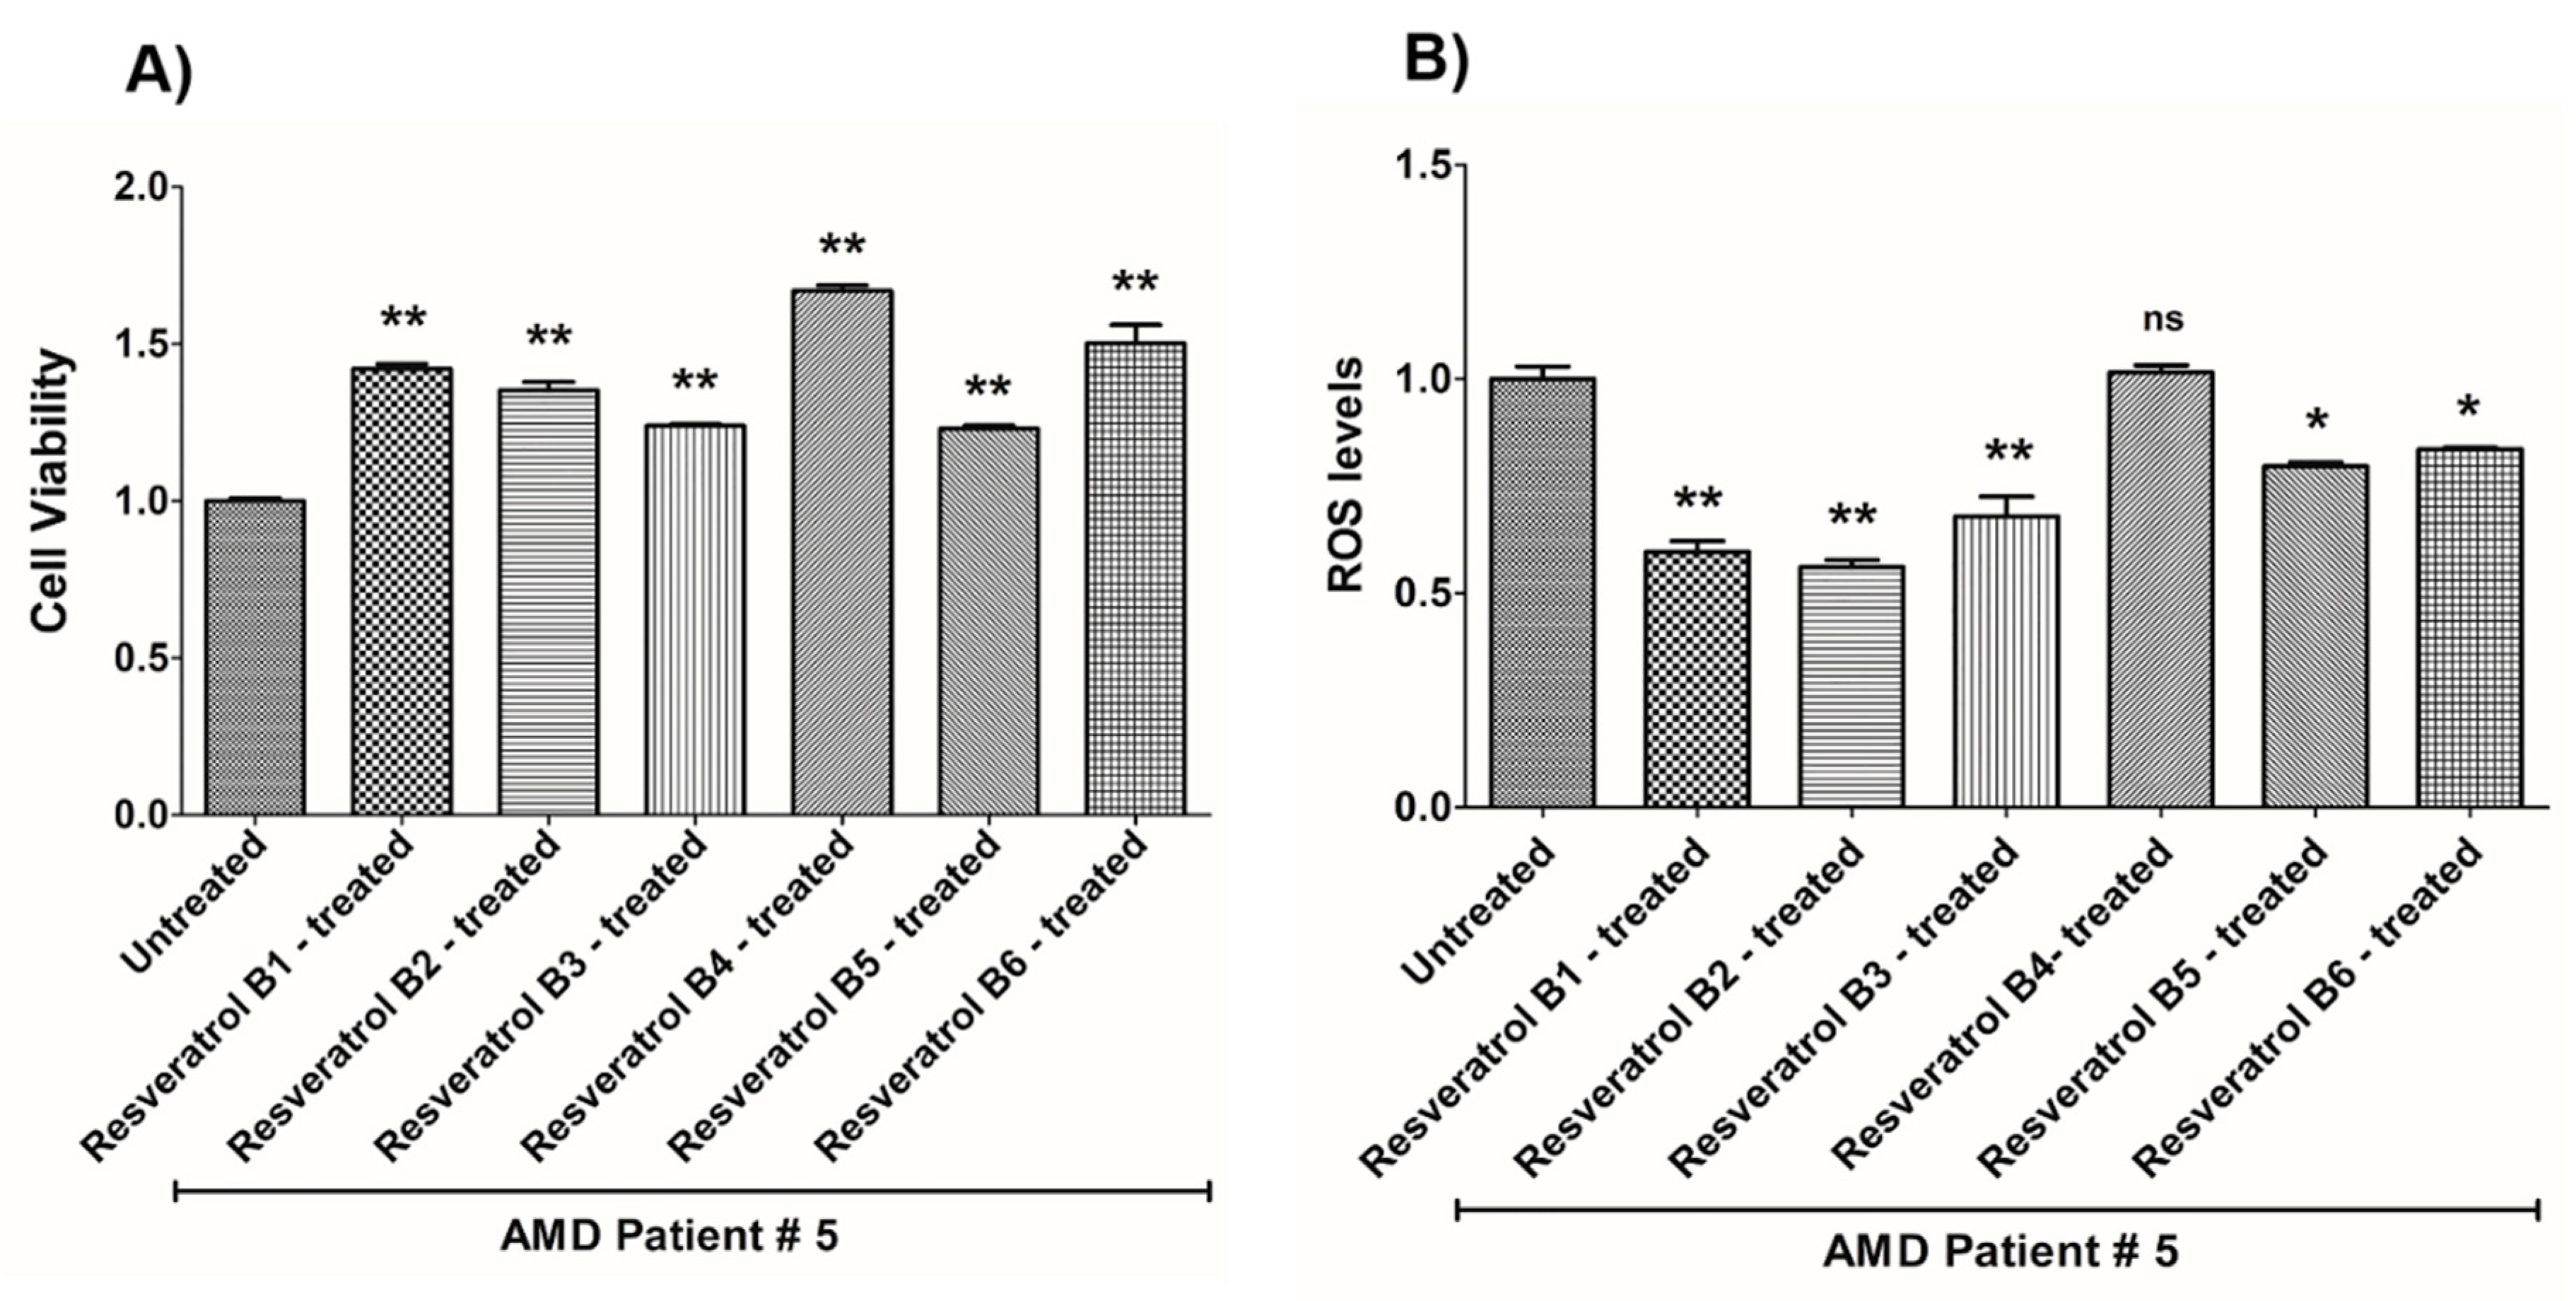
| (a) AMD PATIENT #5_Resveratrol Effects on Cell Viability. | |||
| Cell Viability | Percent Increase/p-Value | Untreated Mean ± SEM | Resveratrol Brands Mean ± SEM |
| AMD UN vs. AMD B1-treated | 42% 0.0021 | 1 ± 0.008937 | 1.420 ± 0.01545 |
| AMD UN vs. AMD B2-treated | 35.2% 0.0021 | 1 ± 0.008937 | 1.352 ± 0.02627 |
| AMD UN vs. AMD B3-treated | 23.9% 0.0021 | 1 ± 0.008937 | 1.239 ± 0.005641 |
| AMD UN vs. AMD B4-treated | 67% 0.0021 | 1 ± 0.008937 | 1.670 ± 0.01759 |
| AMD UN vs. AMD B5-treated | 23% 0.0021 | 1 ± 0.008937 | 1.230 ± 0.01031 |
| AMD UN vs. AMD B6-treated | 50.2% 0.0021 | 1 ± 0.008937 | 1.502 ± 0.05886 |
| (b) AMD PATIENT #5_Resveratrol Effects on ROS Levels. | |||
| Ros Levels | Percent Decrease/p-Value | Untreated Mean ± SEM | Resveratrol Brands Mean ± SEM |
| AMD UN vs. AMD B1-treated | 40.36% 0.0012 | 1 ± 0.02983 | 0.5964 ± 0.02554 |
| AMD UN vs. AMD B2-treated | 43.83% 0.0012 | 1 ± 0.02983 | 0.5617 ± 0.01594 |
| AMD UN vs. AMD B3-treated | 32.1% 0.0022 | 1 ± 0.02983 | 0.6790 ± 0.04663 |
| AMD UN vs. AMD B4-treated | 1.6% 1.0000 ns | 1 ± 0.02983 | 1.016 ± 0.01649 |
| AMD UN vs. AMD B5-treated | 20.35% 0.0238 | 1 ± 0.02983 | 0.7965 ± 0.008948 |
| AMD UN vs. AMD B6-treated | 16.39% 0.0238 | 1 ± 0.02983 | 0.8361 ± 0.003819 |
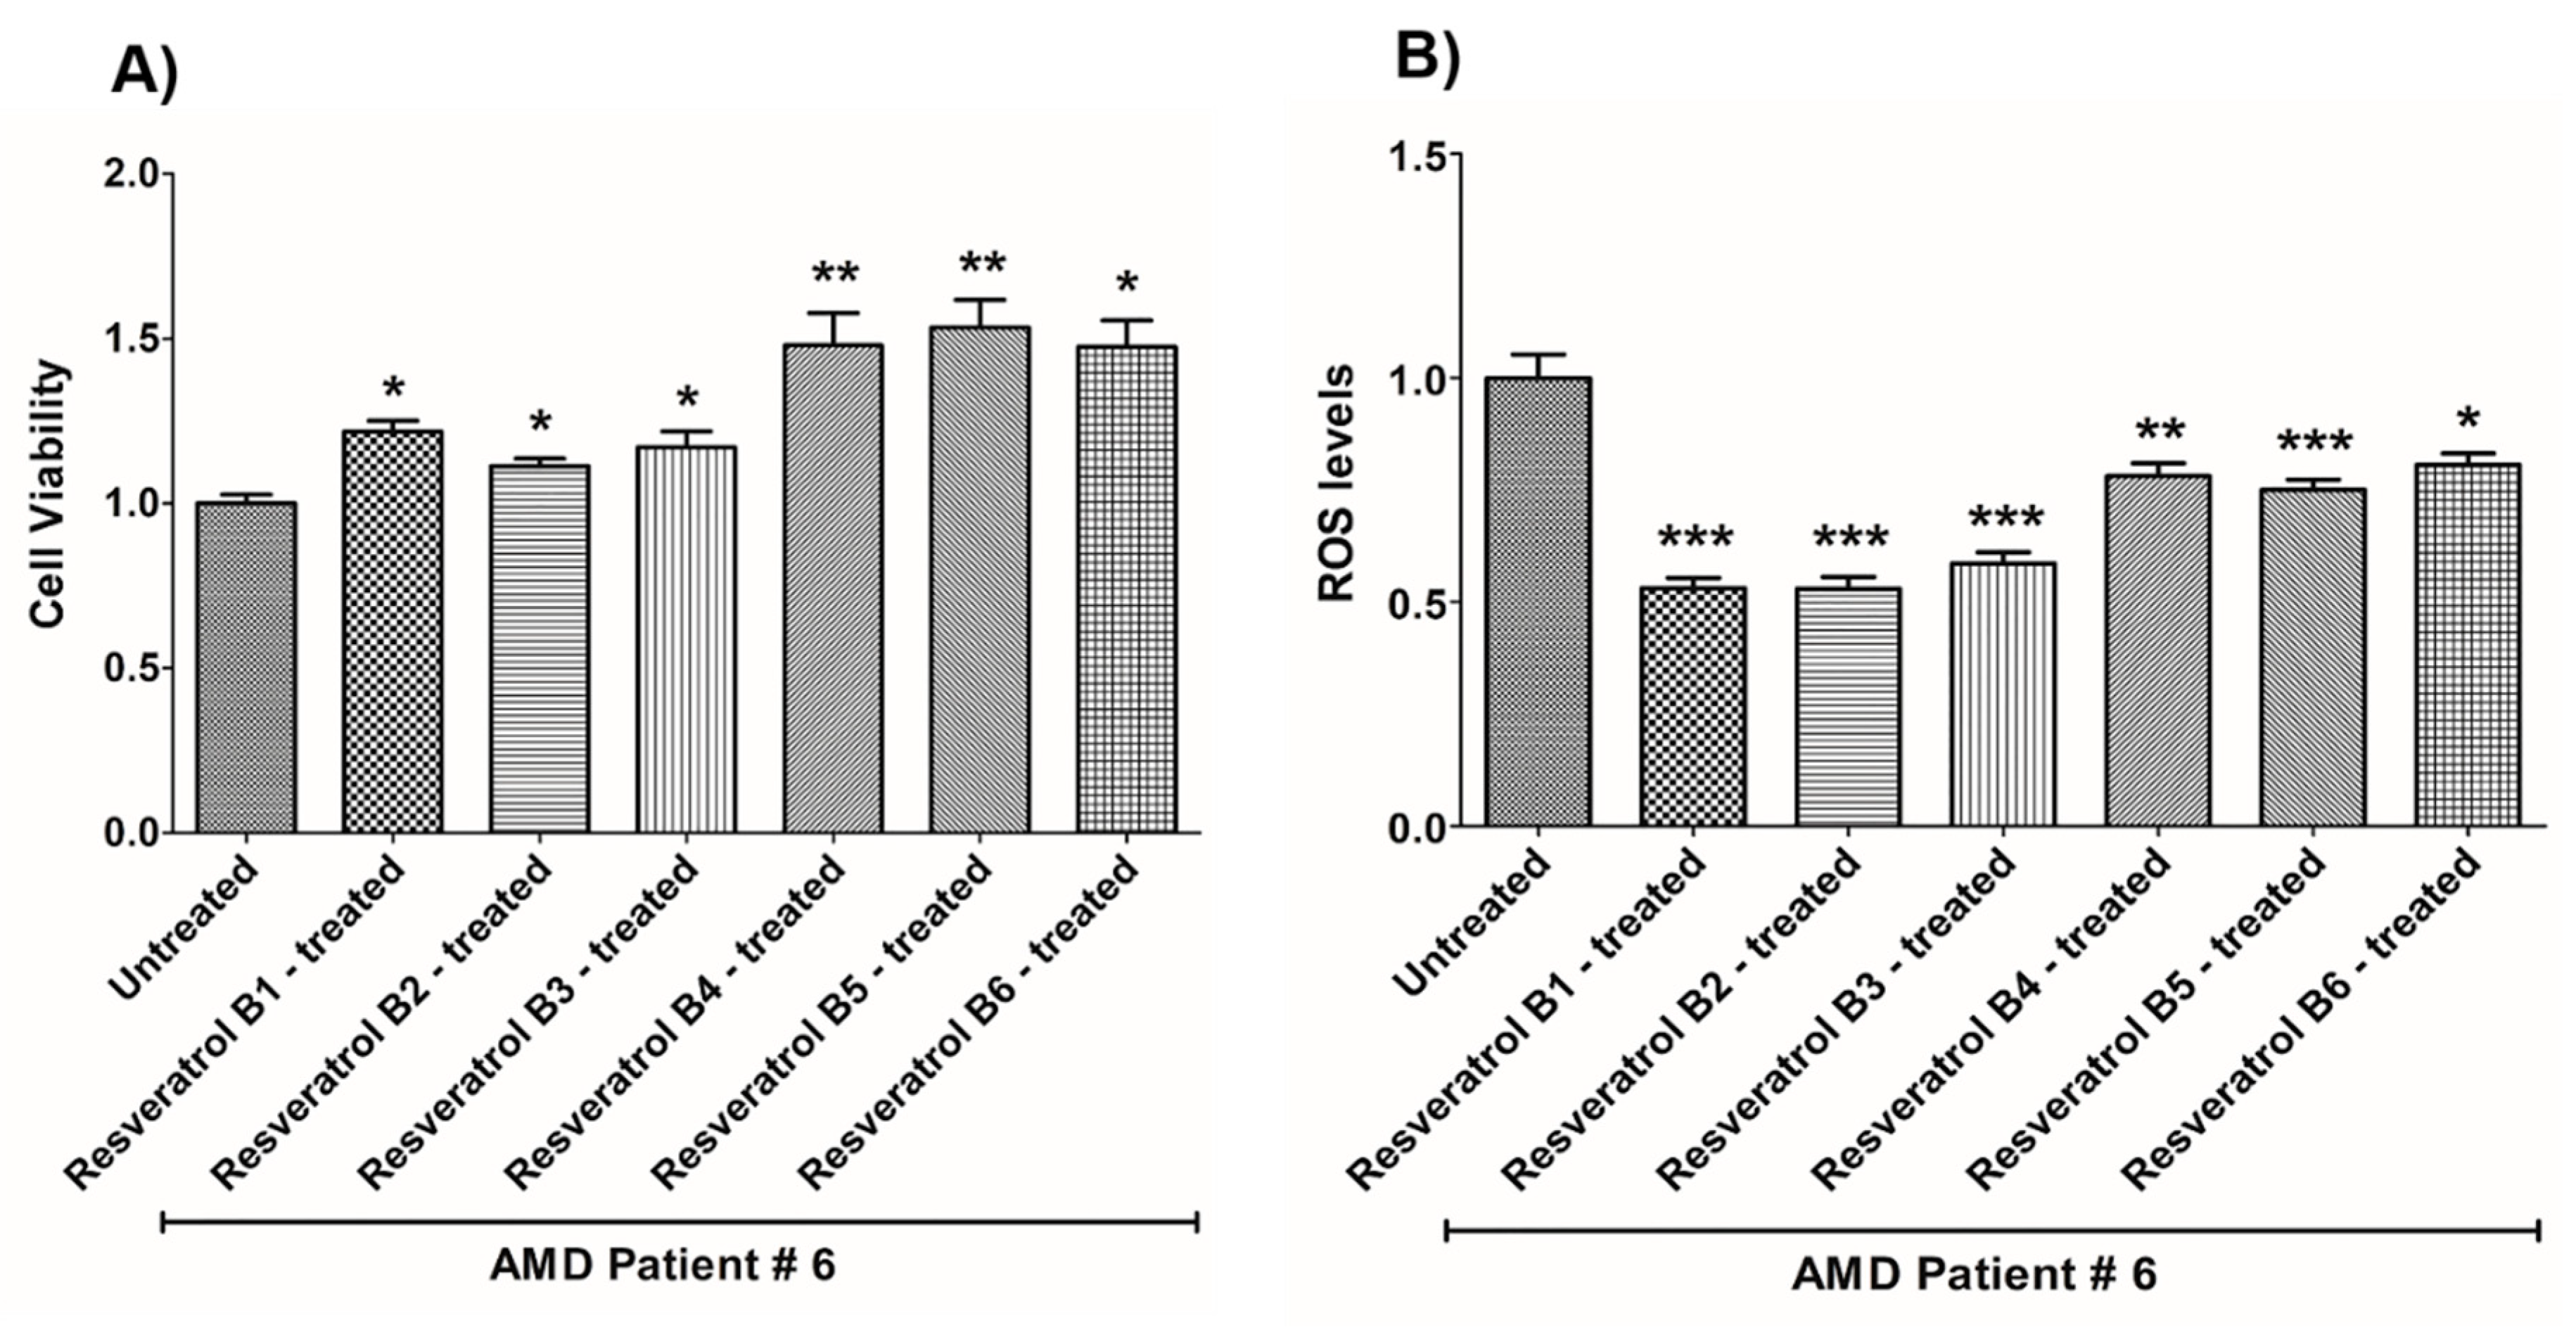
| (a) AMD PATIENT #6_Resveratrol Effects on Cell Viability. | |||
| Cell Viability | Percent Increase/p-Value | Untreated Mean ± SEM | Resveratrol brands Mean ± SEM |
| AMD UN vs. AMD B1-treated | 21.8% 0.0139 | 1 ± 0.02704 | 1.218 ± 0.03245 |
| AMD UN vs. AMD B2-treated | 11.3% 0.0498 | 1 ± 0.02704 | 1.113 ± 0.02333 |
| AMD UN vs. AMD B3-treated | 16.9% 0.0294 | 1 ± 0.02704 | 1.169 ± 0.04933 |
| AMD UN vs. AMD B4-treated | 47.9% 0.0084 | 1 ± 0.02704 | 1.479 ± 0.09846 |
| AMD UN vs. AMD B5-treated | 53.4% 0.0084 | 1 ± 0.02704 | 1.534 ± 0.08365 |
| AMD UN vs. AMD B6-treated | 47.4% 0.0106 | 1 ± 0.02704 | 1.474 ± 0.08017 |
| (b) AMD PATIENT #6_Resveratrol Effects on ROS Levels. | |||
| Ros Levels | Percent Decrease/p-Value | Untreated Mean ± SEM | Resveratrol Brands Mean ± SEM |
| AMD UN vs. AMD B1-treated | 46.93% 0.0002 | 1 ± 0.05254 | 0.5307 ± 0.02323 |
| AMD UN vs. AMD B2-treated | 47.11% 0.0002 | 1 ± 0.05254 | 0.5289 ± 0.02670 |
| AMD UN vs. AMD B3-treated | 41.44% 0.0002 | 1 ± 0.05254 | 0.5856 ± 0.02532 |
| AMD UN vs. AMD B4-treated | 21.94% 0.0062 | 1 ± 0.05254 | 0.7806 ± 0.02889 |
| AMD UN vs. AMD B5-treated | 24.91% 0.0007 | 1 ± 0.05254 | 0.7509 ± 0.02245 |
| AMD UN vs. AMD B6-treated | 19.4% 0.0109 | 1 ± 0.05254 | 0.8060 ± 0.02580 |
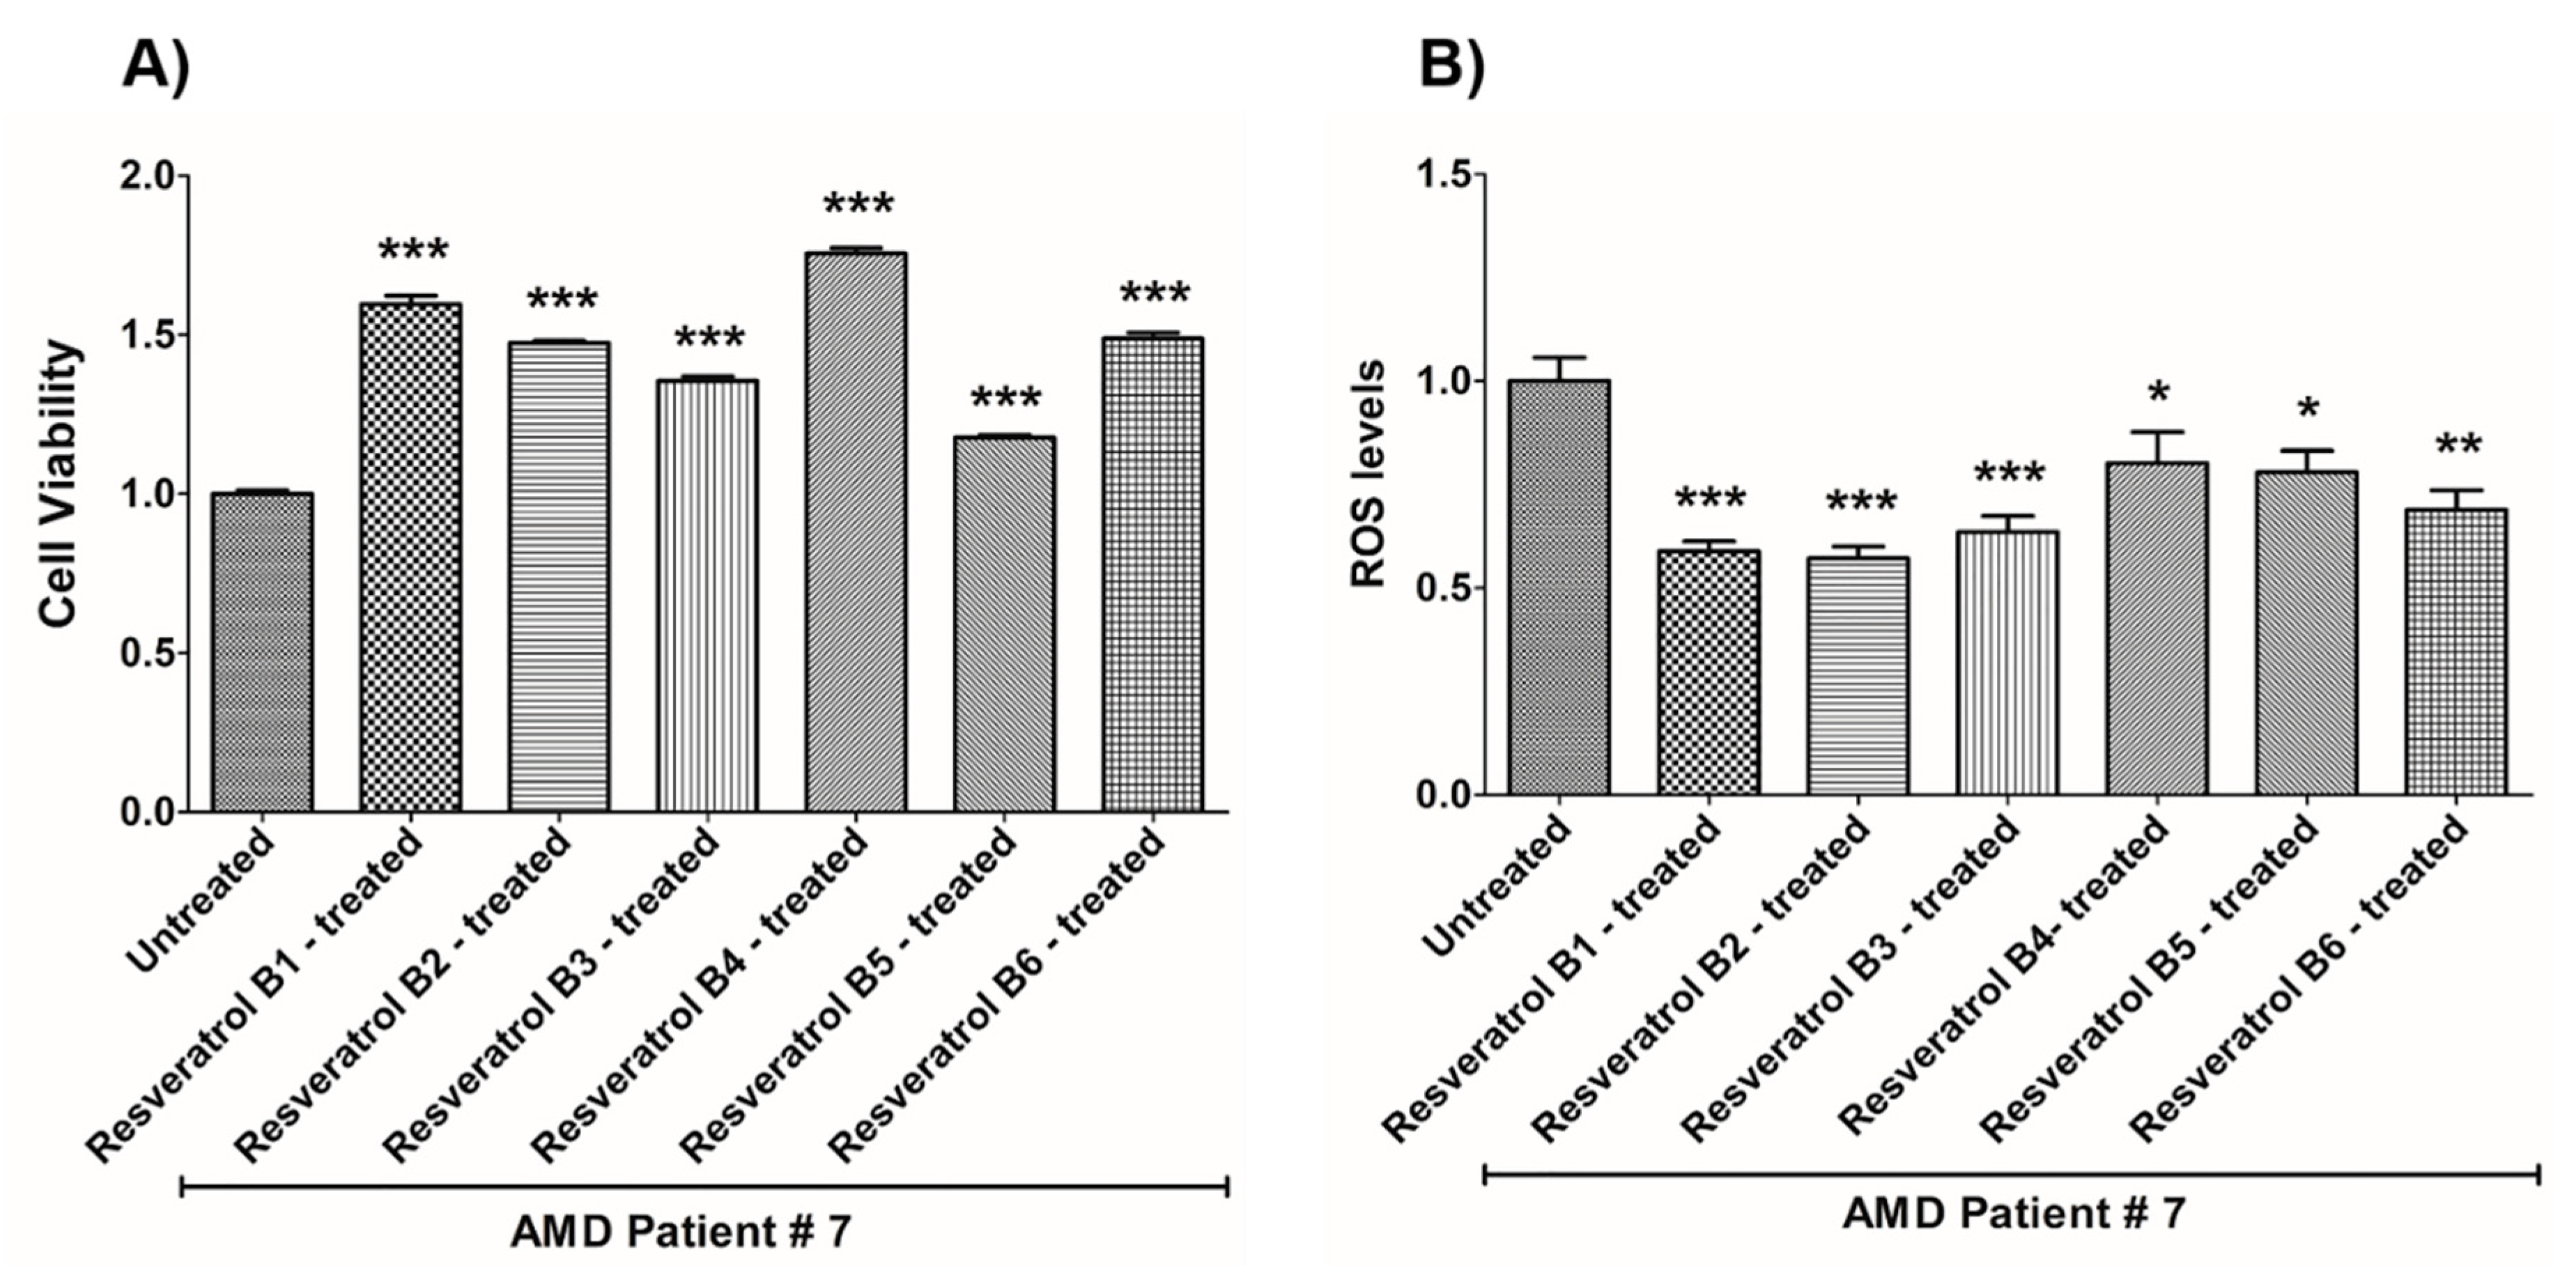
| (a) AMD PATIENT #7_Resveratrol Effects on Cell Viability. | |||
| Cell Viability | Percent Increase/p-Value | Untreated Mean ± SEM | Resveratrol Brands Mean ± SEM |
| AMD UN vs. AMD B1-treated | 59.6% 0.0002 | 1 ± 0.01091 | 1.596 ± 0.02707 |
| AMD UN vs. AMD B2-treated | 47.5% 0.0002 | 1 ± 0.01091 | 1.475 ± 0.007203 |
| AMD UN vs. AMD B3-treated | 35.5% 0.0003 | 1 ± 0.01091 | 1.355 ± 0.01410 |
| AMD UN vs. AMD B4-treated | 75.6% 0.0003 | 1 ± 0.01091 | 1.756 ± 0.01699 |
| AMD UN vs. AMD B5-treated | 17.7% 0.0003 | 1 ± 0.01091 | 1.177 ± 0.007944 |
| AMD UN vs. AMD B6-treated | 48.8% 0.0003 | 1 ± 0.01091 | 1.488 ± 0.01817 |
| (b) AMD PATIENT #7_Resveratrol Effects on ROS Levels. | |||
| Ros Levels | Percent Decrease/p-Value | Untreated Mean ± SEM | Resveratrol Brands Mean ± SEM |
| AMD UN vs. AMD B1-treated | 41.1% 0.0002 | 1 ± 0.05680 | 0.5890 ± 0.02433 |
| AMD UN vs. AMD B2-treated | 42.84% 0.0002 | 1 ± 0.05680 | 0.5716 ± 0.02857 |
| AMD UN vs. AMD B3-treated | 36.48% 0.0006 | 1 ± 0.05680 | 0.6352 ± 0.03928 |
| AMD UN vs. AMD B4-treated | 25.23% 0.0289 | 1 ± 0.05680 | 0.7477 ± 0.05962 |
| AMD UN vs. AMD B5-treated | 22.02% 0.0379 | 1 ± 0.05680 | 0.7798 ± 0.05155 |
| AMD UN vs. AMD B6-treated | 31.11% 0.0019 | 1 ± 0.05680 | 0.6889 ± 0.04688 |
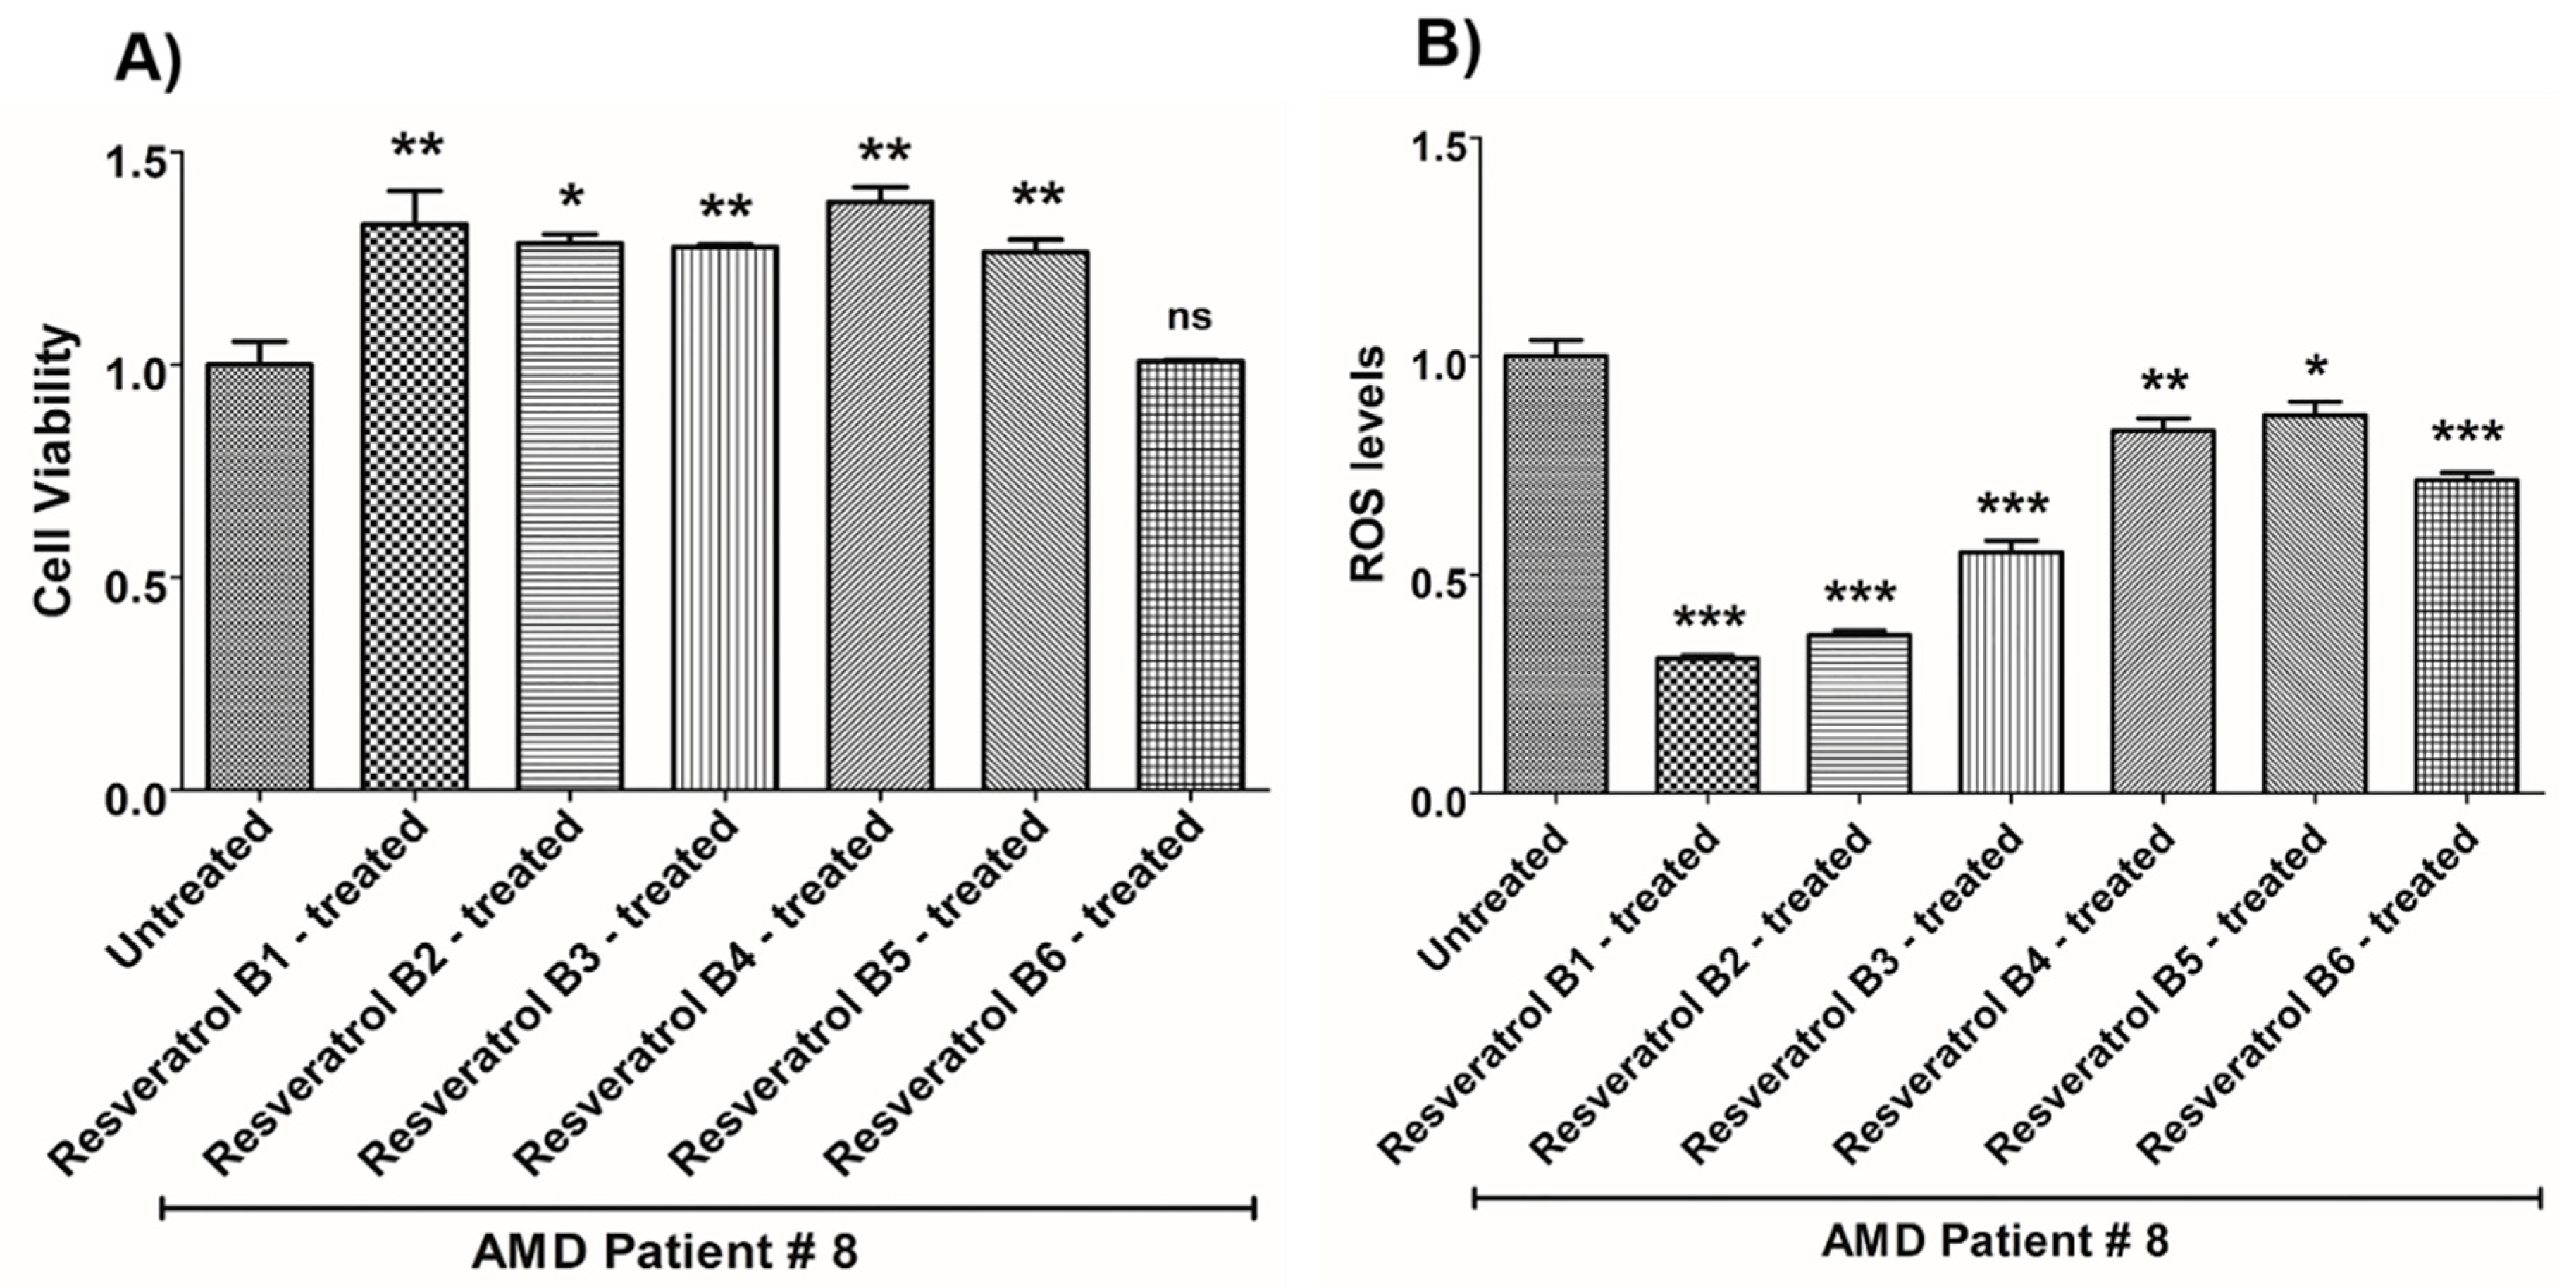
| (a) AMD PATIENT #8_Resveratrol Effects on Cell Viability. | |||
| Cell Viability | Percent Increase/p-Value | Untreated Mean ± SEM | Resveratrol Brands Mean ± SEM |
| AMD UN vs. AMD B1-treated | 33% 0.0050 | 1 ± 0.05466 | 1.330 ± 0.07913 |
| AMD UN vs. AMD B2-treated | 28.6% 0.0286 | 1 ± 0.05466 | 1.286 ± 0.02095 |
| AMD UN vs. AMD B3-treated | 27.7% 0.0095 | 1 ± 0.05466 | 1.277 ± 0.006427 |
| AMD UN vs. AMD B4-treated | 38.2% 0.0040 | 1 ± 0.05466 | 1.382 ± 0.03517 |
| AMD UN vs. AMD B5-treated | 26.5% 0.0095 | 1 ± 0.05466 | 1.265 ± 0.02911 |
| AMD UN vs. AMD B6-treated | 0.8% 0.8000 ns | 1 ± 0.05466 | 1.008 ± 0.002303 |
| (b) AMD PATIENT #8_Resveratrol Effects on ROS Levels. | |||
| Ros Levels | Percent Decrease/p-Value | Untreated Mean ± SEM | Resveratrol Brands Mean ± SEM |
| AMD UN vs. AMD B1-treated | 69.13% 0.0003 | 1 ± 0.03698 | 0.3087 ± 0.007325 |
| AMD UN vs. AMD B2-treated | 63.83% 0.0003 | 1 ± 0.03698 | 0.3617 ± 0.01029 |
| AMD UN vs. AMD B3-treated | 44.76% 0.0003 | 1 ± 0.03698 | 0.5524 ± 0.02613 |
| AMD UN vs. AMD B4-treated | 17.06% 0.0047 | 1 ± 0.03698 | 0.8294 ± 0.02891 |
| AMD UN vs. AMD B5-treated | 13.5% 0.0303 | 1 ± 0.03698 | 0.8650 ± 0.03150 |
| AMD UN vs. AMD B6-treated | 28.33% 0.0006 | 1 ± 0.03698 | 0.7167 ± 0.01718 |
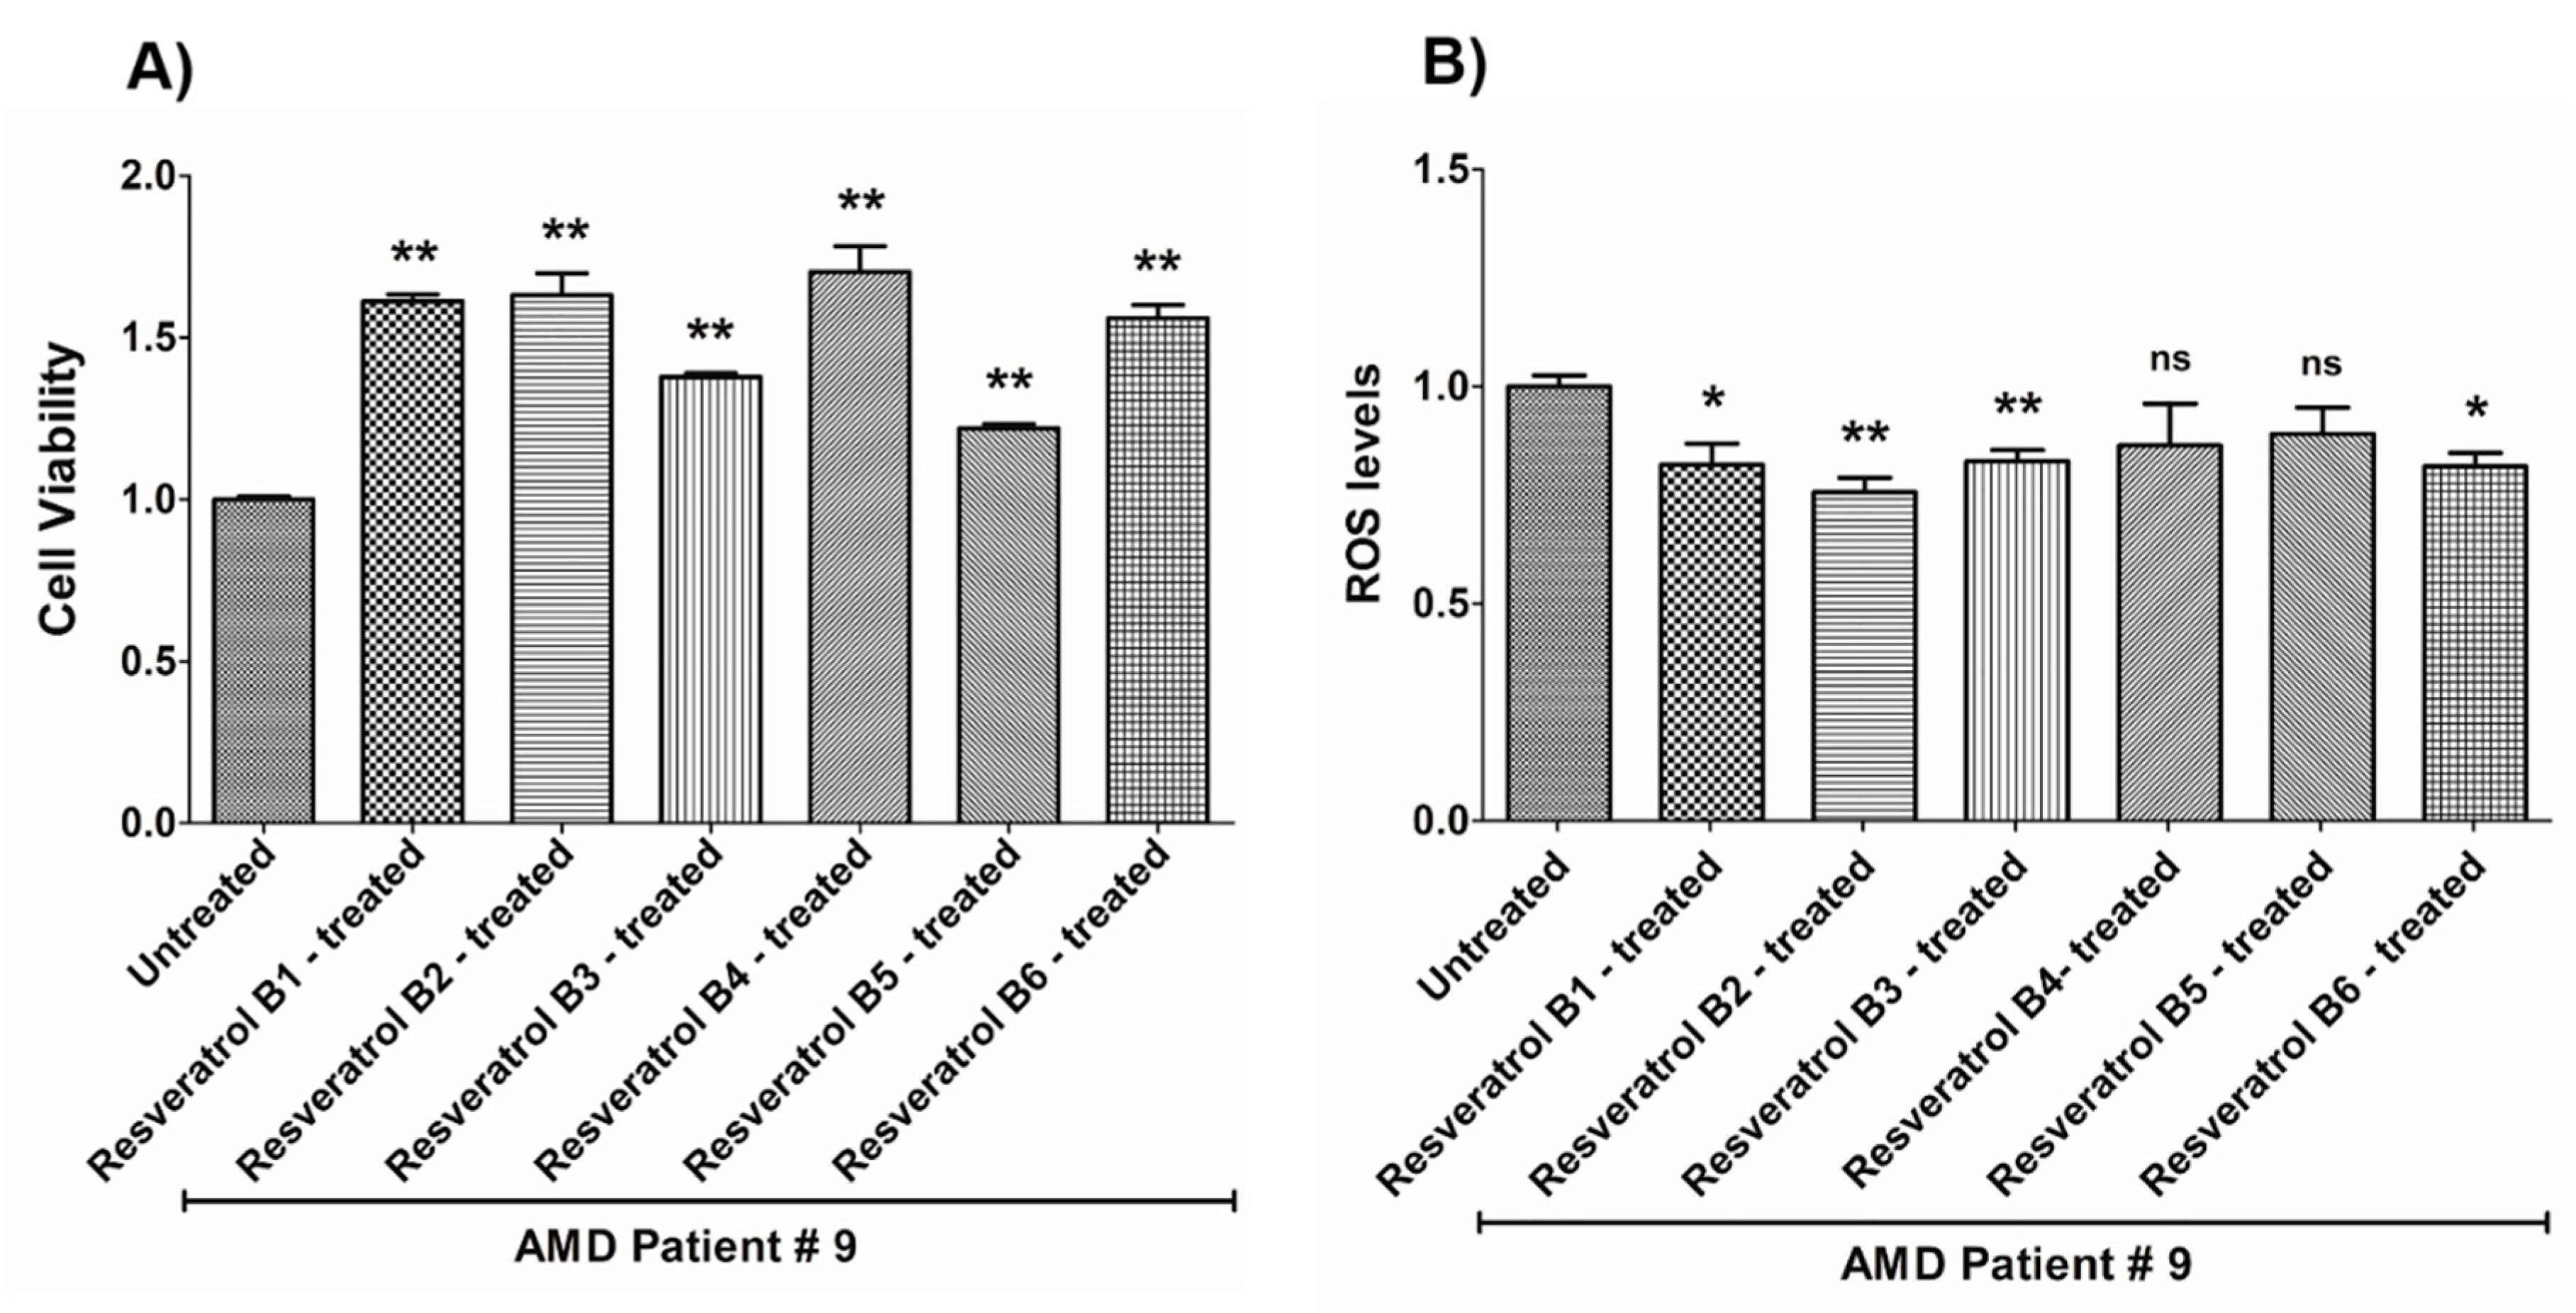
| (a) AMD PATIENT #9_Resveratrol Effects on Cell Viability. | |||
| Cell Viability | Percent Increase/p-Value | Untreated Mean ± SEM | Resveratrol Brands Mean ± SEM |
| AMD UN vs. AMD B1-treated | 61.1% 0.0025 | 1 ± 0.01018 | 1.611 ± 0.02128 |
| AMD UN vs. AMD B2-treated | 63% 0.0025 | 1 ± 0.01018 | 1.630 ± 0.06816 |
| AMD UN vs. AMD B3-treated | 37.8% 0.0025 | 1 ± 0.01018 | 1.378 ± 0.01167 |
| AMD UN vs. AMD B4-treated | 70.2% 0.0025 | 1 ± 0.01018 | 1.702 ± 0.07932 |
| AMD UN vs. AMD B5-treated | 21.9% 0.0025 | 1 ± 0.01018 | 1.219 ± 0.01320 |
| AMD UN vs. AMD B6-treated | 55.9% 0.0025 | 1 ± 0.01018 | 1.559 ± 0.04112 |
| (b) AMD PATIENT #9_Resveratrol Effects on ROS Levels. | |||
| Ros Levels | Percent Decrease/p-Value | Untreated Mean ± SEM | Resveratrol Brands Mean ± SEM |
| AMD UN vs. AMD B1-treated | 18.01% 0.0242 | 1 ± 0.02608 | 0.8199 ± 0.04955 |
| AMD UN vs. AMD B2-treated | 24.31% 0.0061 | 1 ± 0.02608 | 0.7569 ± 0.03313 |
| AMD UN vs. AMD B3-treated | 17.15% 0.0095 | 1 ± 0.02608 | 0.8285 ± 0.02548 |
| AMD UN vs. AMD B4-treated | 13.57% 0.4000 ns | 1 ± 0.02608 | 0.8643 ± 0.09676 |
| AMD UN vs. AMD B5-treated | 10.87% 0.4000 ns | 1 ± 0.02608 | 0.8913 ± 0.06032 |
| AMD UN vs. AMD B6-treated | 18.38% 0.0159 | 1 ± 0.02608 | 0.8162 ± 0.03120 |
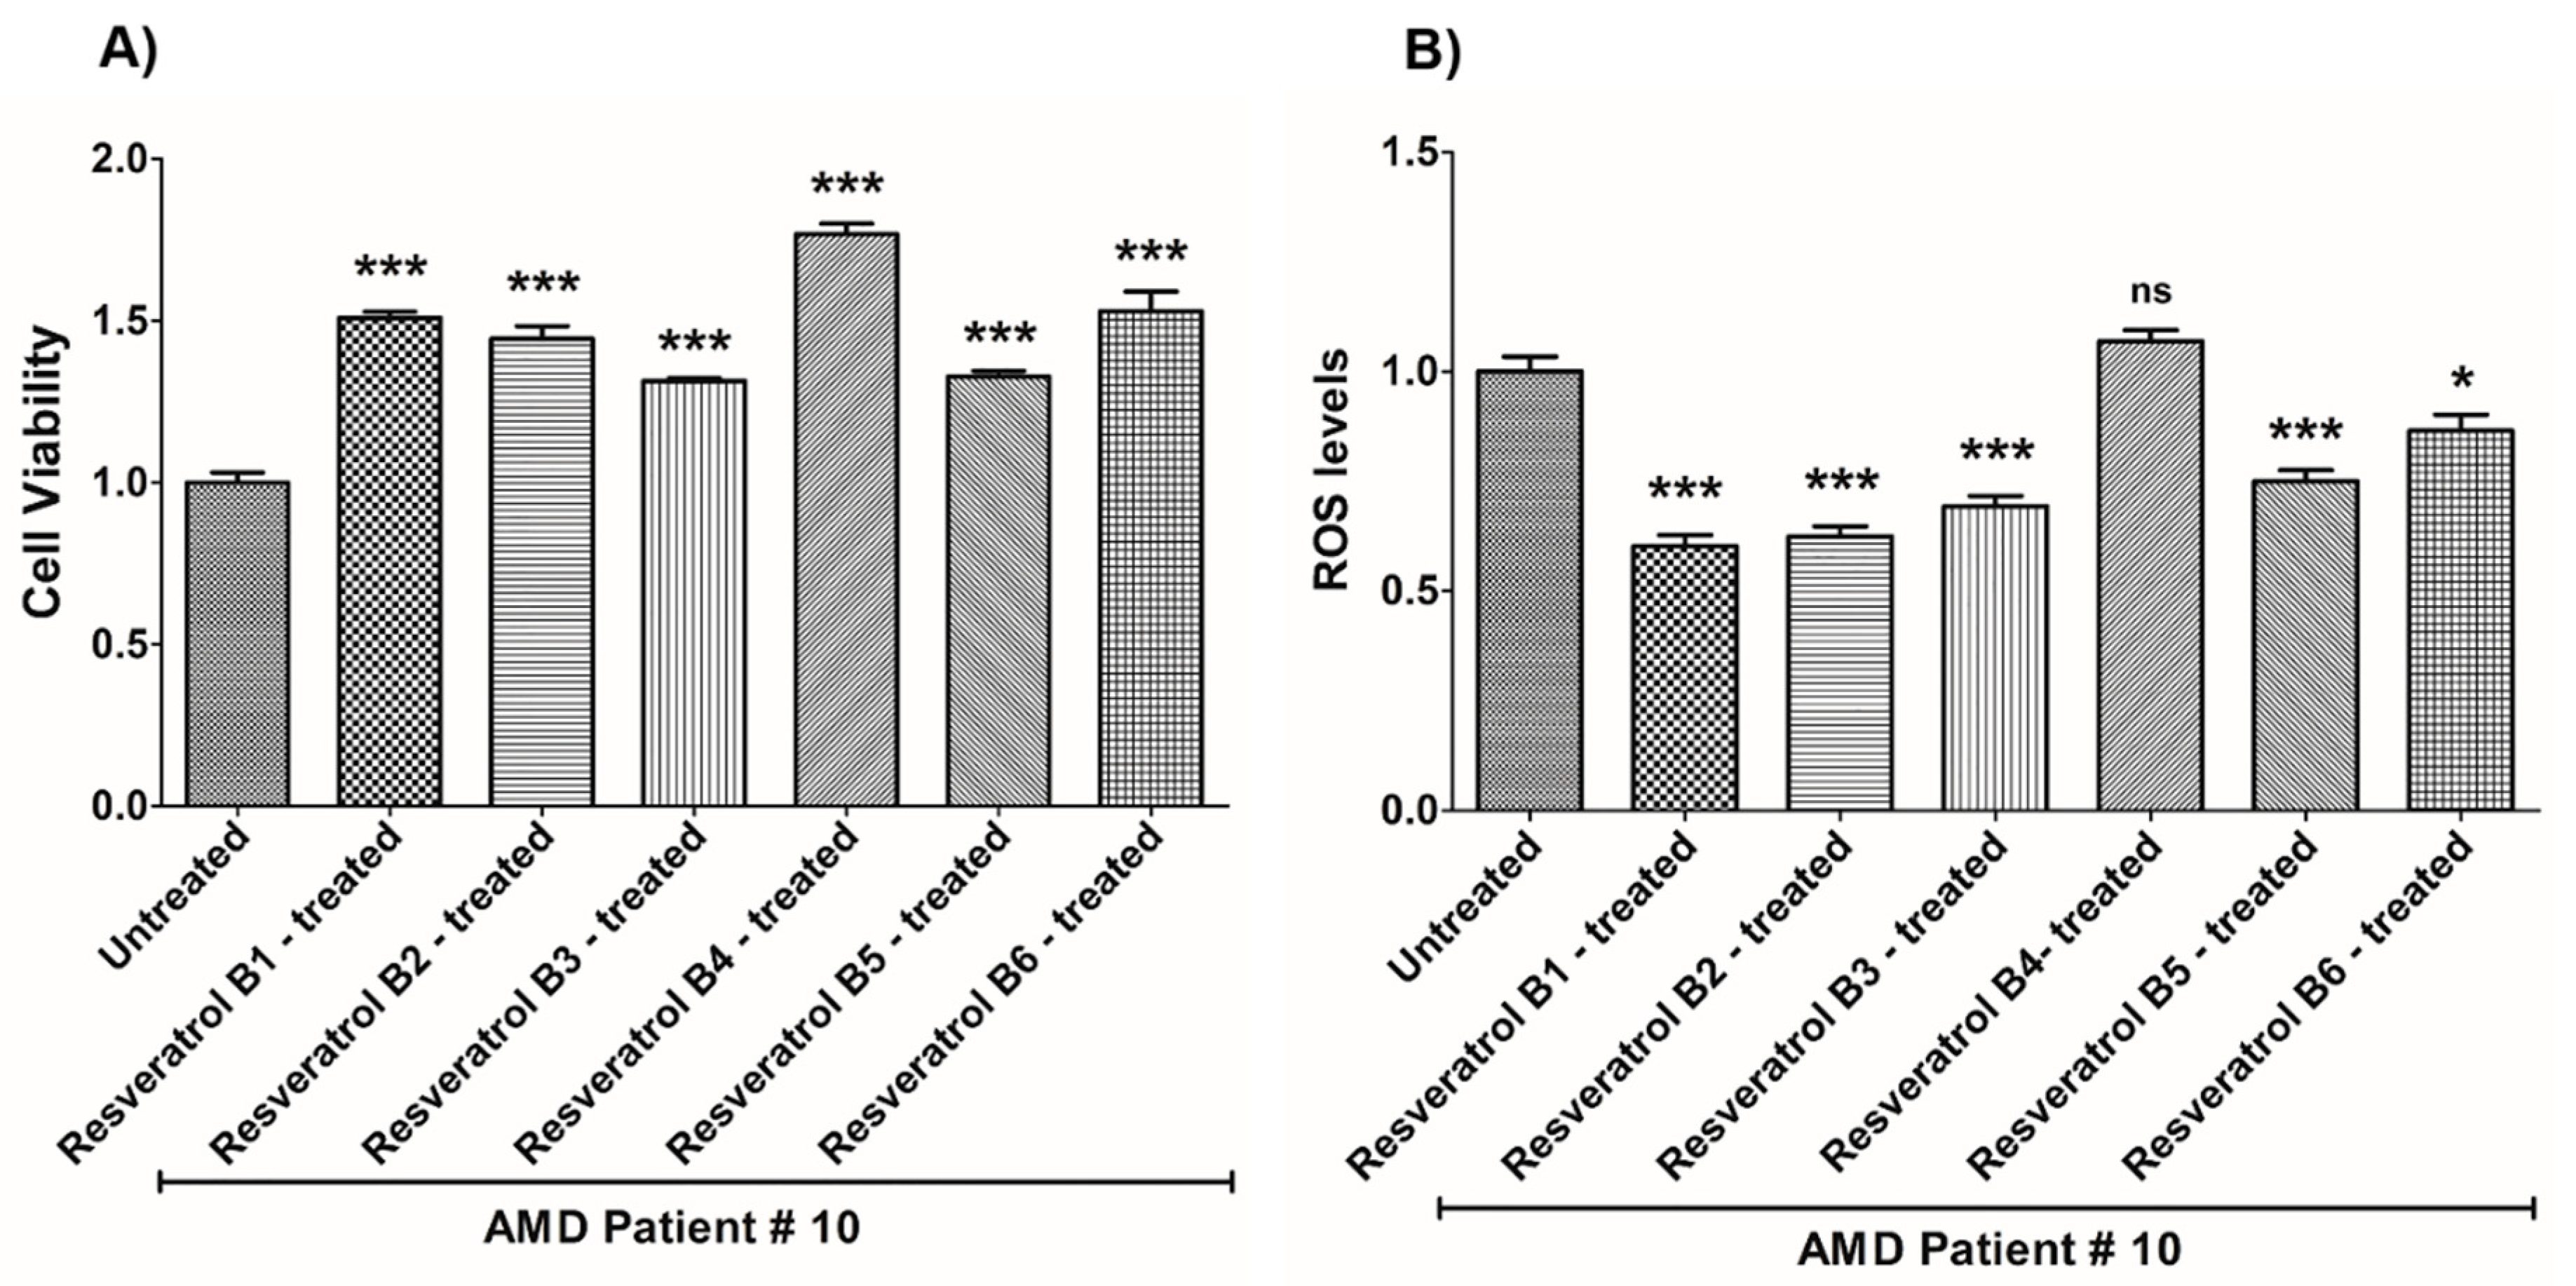
| (a) AMD PATIENT #10_Resveratrol Effects on Cell Viability. | |||
| Cell Viability | Percent Increase/p-Value | Untreated Mean ± SEM | Resveratrol Brands Mean ± SEM |
| AMD UN vs. AMD B1-treated | 50.9% 0.0002 | 1 ± 0.03038 | 1.509 ± 0.01864 |
| AMD UN vs. AMD B2-treated | 44.4% 0.0002 | 1 ± 0.03038 | 1.444 ± 0.03925 |
| AMD UN vs. AMD B3-treated | 31.4% 0.0002 | 1 ± 0.03038 | 1.314 ± 0.008565 |
| AMD UN vs. AMD B4-treated | 76.8% 0.0002 | 1 ± 0.03038 | 1.768 ± 0.03247 |
| AMD UN vs. AMD B5-treated | 32.7% 0.0002 | 1 ± 0.03038 | 1.327 ± 0.01818 |
| AMD UN vs. AMD B6-treated | 53% 0.0002 | 1 ± 0.03038 | 1.530 ± 0.06054 |
| (b) AMD PATIENT #10_Resveratrol Effects on ROS Levels. | |||
| Ros Levels | Percent Decrease/p-Value | Untreated Mean ± SEM | Resveratrol Brands Mean ± SEM |
| AMD UN vs. AMD B1-treated | 39.69% 0.0006 | 1 ± 0.03429 | 0.6031 ± 0.02462 |
| AMD UN vs. AMD B2-treated | 37.53% 0.0006 | 1 ± 0.03429 | 0.6247 ± 0.02274 |
| AMD UN vs. AMD B3-treated | 30.69% 0.0006 | 1 ± 0.03429 | 0.6931 ± 0.02408 |
| AMD UN vs. AMD B4-treated | 6.9% 0.2667 ns | 1 ± 0.03429 | 1.069 ± 0.02530 |
| AMD UN vs. AMD B5-treated | 24.92% 0.0006 | 1 ± 0.03429 | 0.7508 ± 0.02486 |
| AMD UN vs. AMD B6-treated | 13.47% 0.0262 | 1 ± 0.03429 | 0.8653 ± 0.03682 |
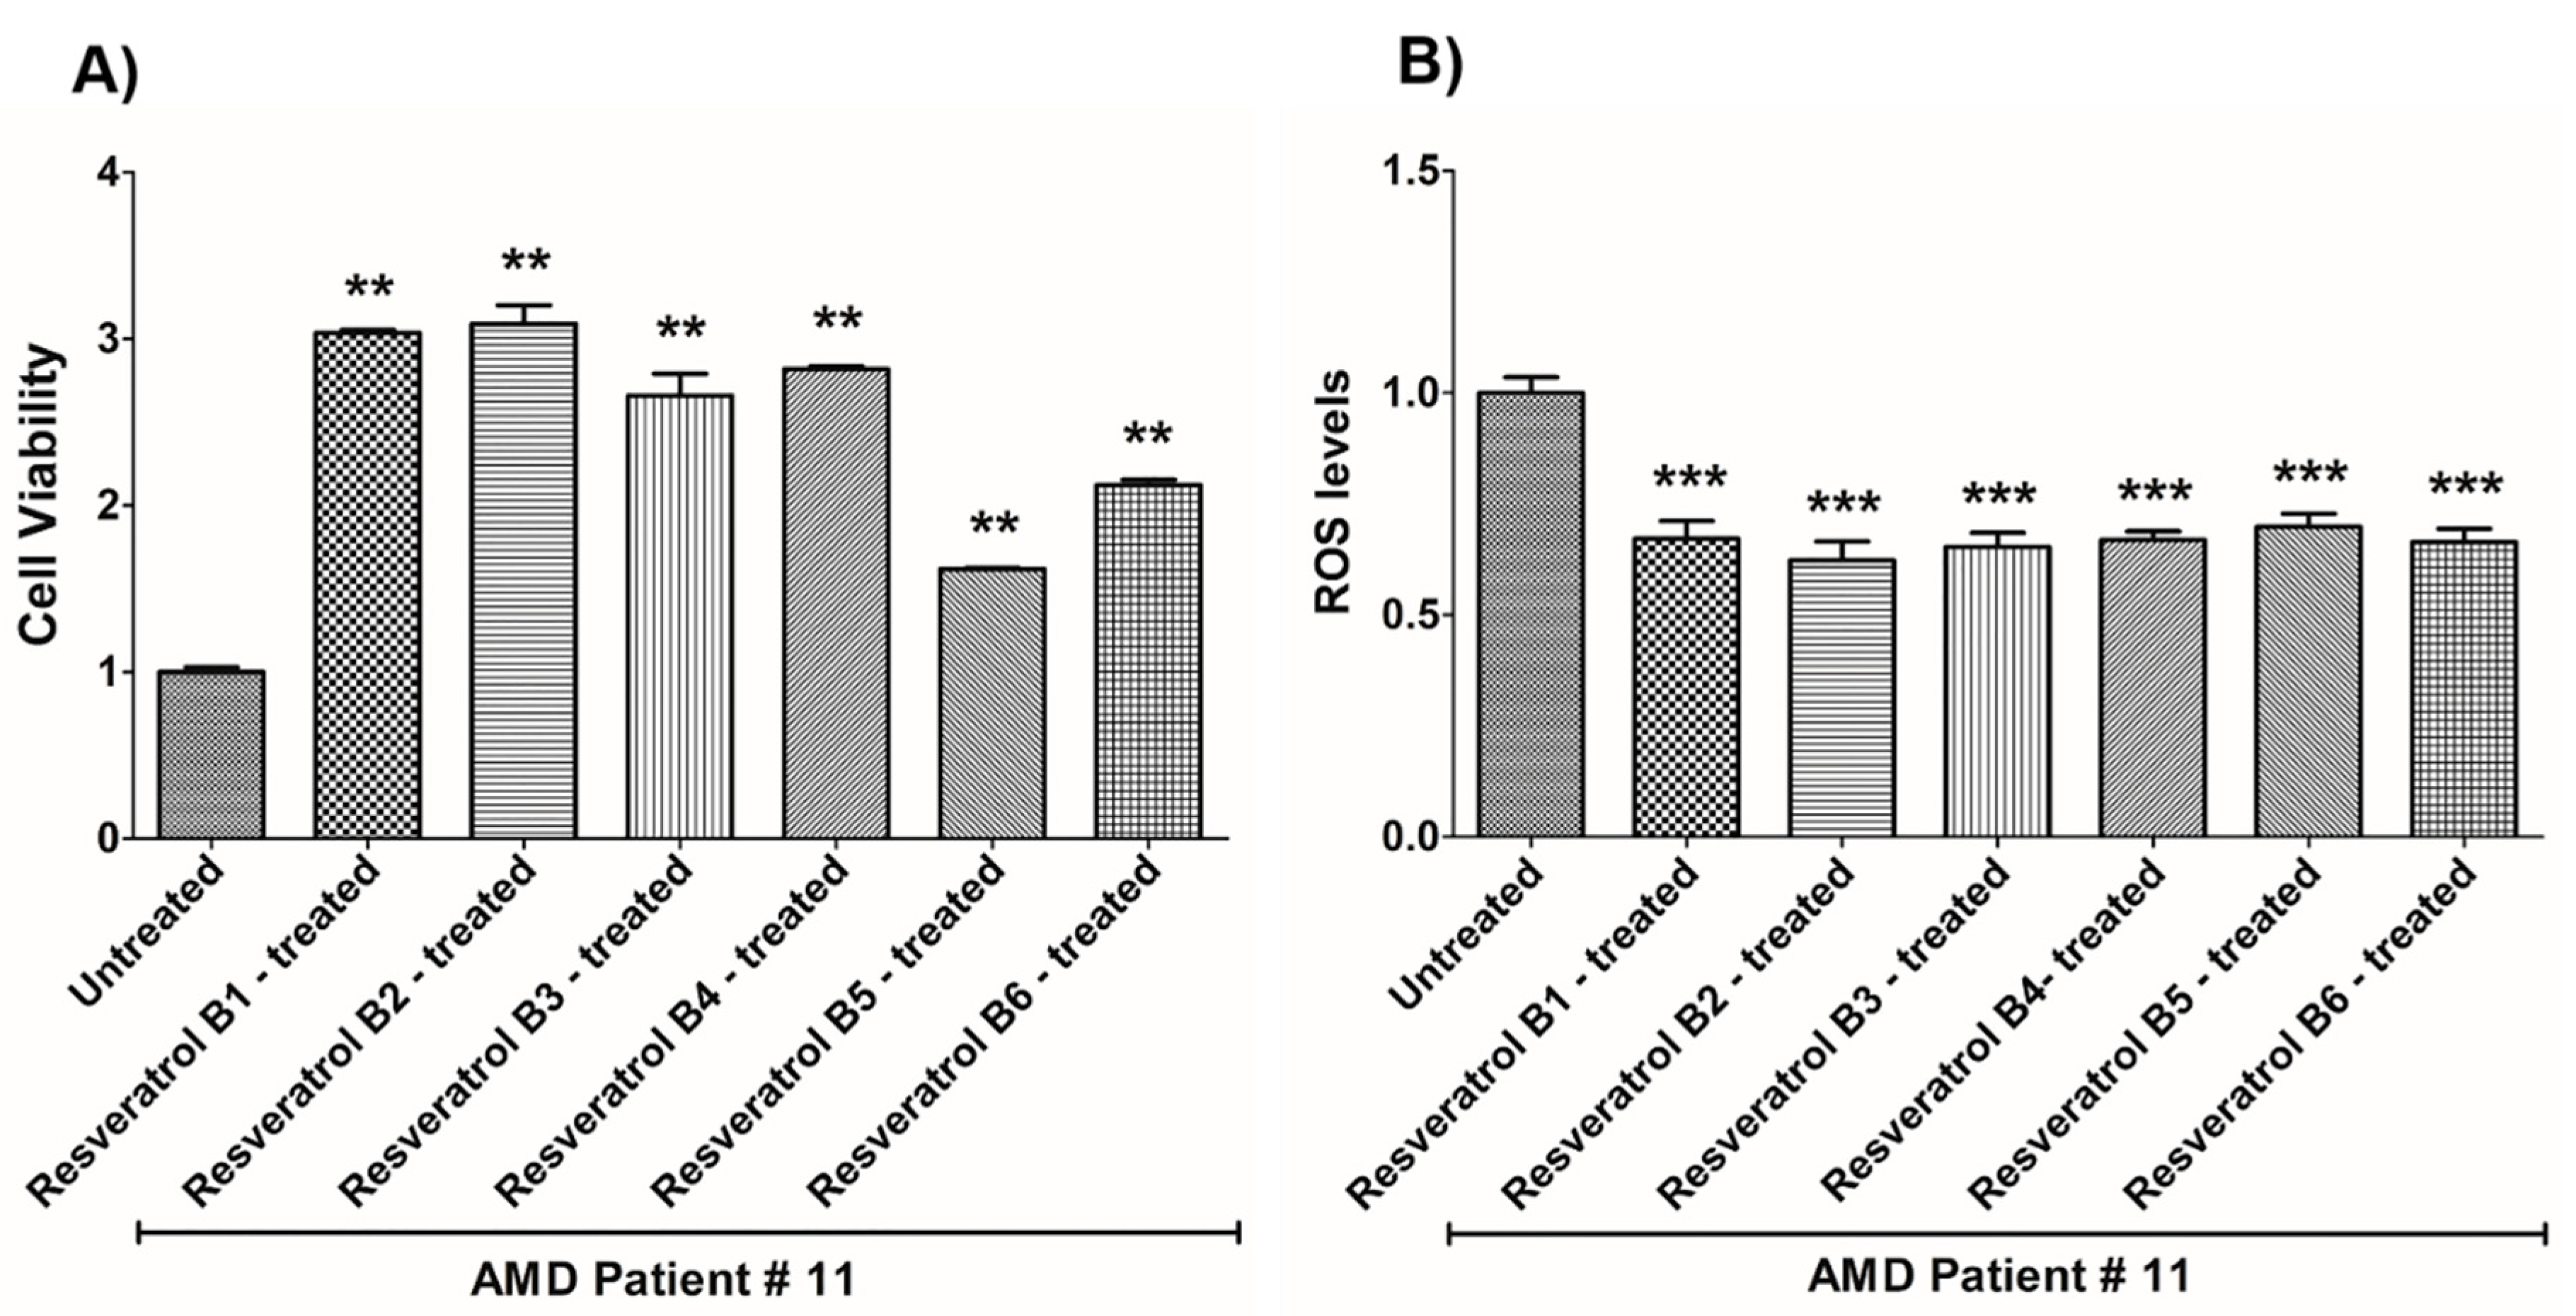
| (a) AMD PATIENT #11_Resveratrol Effects on Cell Viability. | |||
| Cell Viability | Percent Increase/p-Value | Untreated Mean ± SEM | Resveratrol Brands Mean ± SEM |
| AMD UN vs. AMD B1-treated | 203.4% 0.0034 | 1 ± 0.02849 | 3.034 ± 0.01950 |
| AMD UN vs. AMD B2-treated | 209% 0.0034 | 1 ± 0.02849 | 3.090 ± 0.1106 |
| AMD UN vs. AMD B3-treated | 165.9% 0.0034 | 1 ± 0.02849 | 2.659 ± 0.1311 |
| AMD UN vs. AMD B4-treated | 181.9% 0.0034 | 1 ± 0.02849 | 2.819 ± 0.01619 |
| AMD UN vs. AMD B5-treated | 61.8% 0.0034 | 1 ± 0.02849 | 1.618 ± 0.007562 |
| AMD UN vs. AMD B6-treated | 112.2% 0.0034 | 1 ± 0.02849 | 2.122 ± 0.03280 |
| (b) AMD PATIENT #11_Resveratrol Effects on ROS Levels. | |||
| Ros Levels | Percent Decrease/p-Value | Untreated Mean ± SEM | Resveratrol Brands Mean ± SEM |
| AMD UN vs. AMD B1-treated | 32.84% 0.0002 | 1 ± 0.03538 | 0.6716 ± 0.04014 |
| AMD UN vs. AMD B2-treated | 37.66% 0.0002 | 1 ± 0.03538 | 0.6234 ± 0.04212 |
| AMD UN vs. AMD B3-treated | 34.71% 0.0002 | 1 ± 0.03538 | 0.6529 ± 0.03225 |
| AMD UN vs. AMD B4-treated | 33.18% 0.0002 | 1 ± 0.03538 | 0.6682 ± 0.02027 |
| AMD UN vs. AMD B5-treated | 30.16% 0.0002 | 1 ± 0.03538 | 0.6984 ± 0.02910 |
| AMD UN vs. AMD B6-treated | 33.61% 0.0002 | 1 ± 0.03538 | 0.6639 ± 0.03013 |
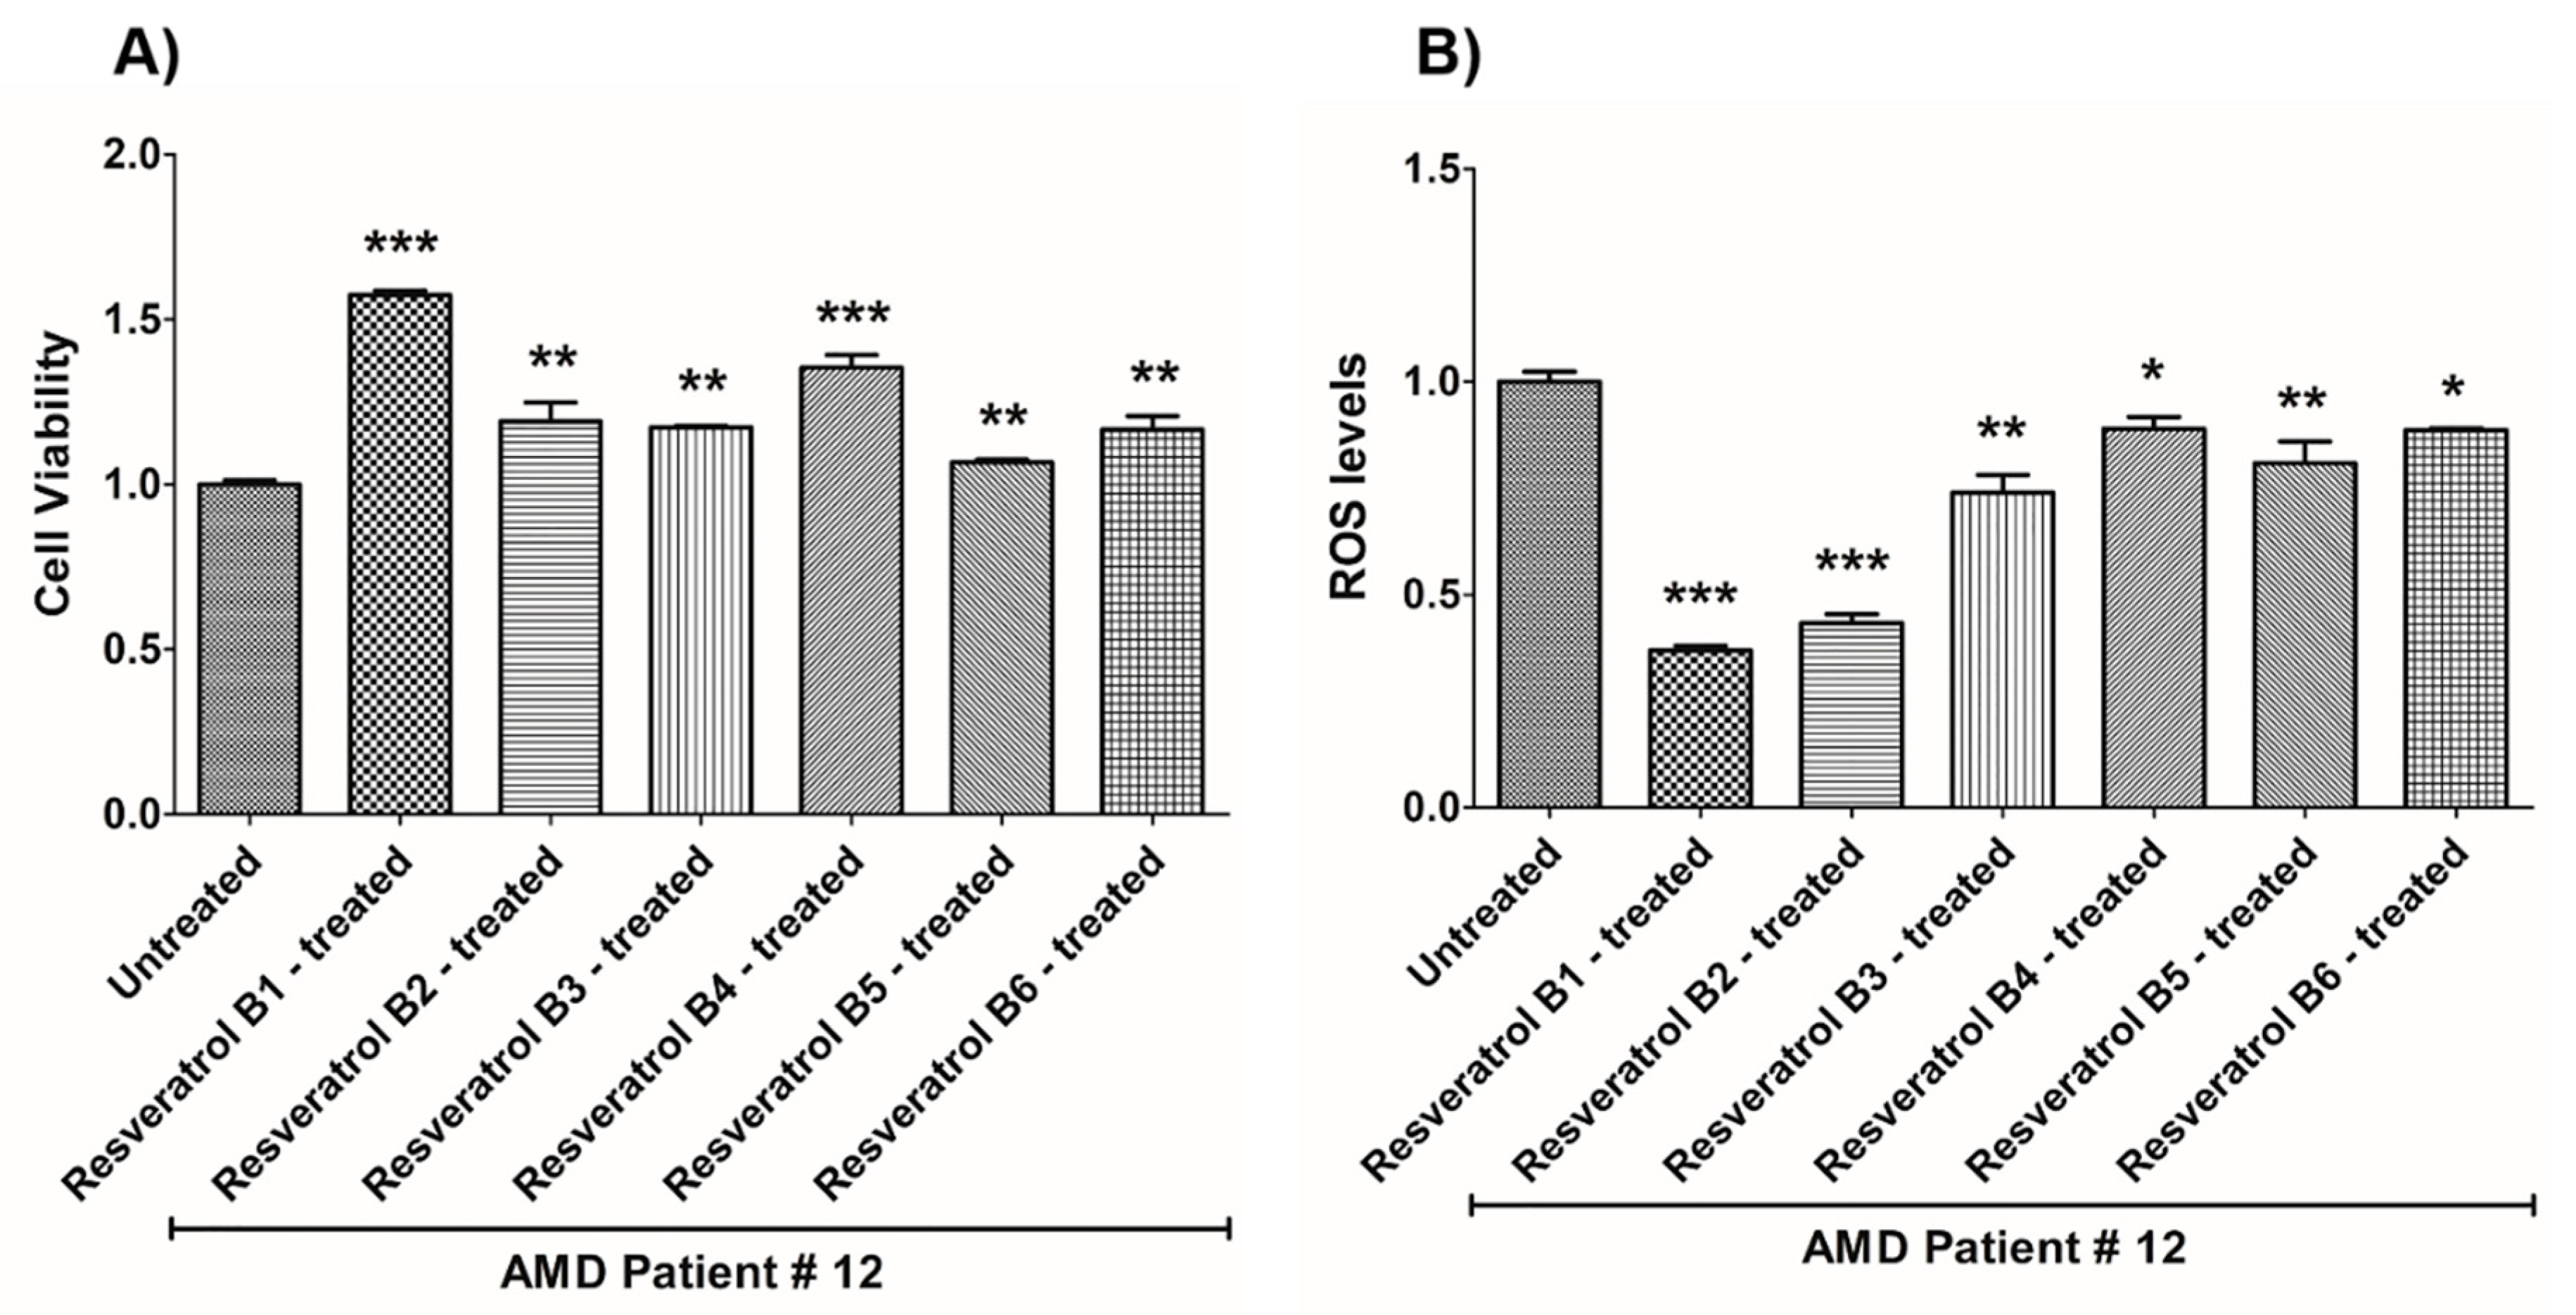
| (a) AMD PATIENT #12_Resveratrol Effects on Cell Viability. | |||
| Cell Viability | Percent Increase/p-Value | Untreated Mean ± SEM | Resveratrol Brands Mean ± SEM |
| AMD UN vs. AMD B1-treated | 57.3% 0.0005 | 1 ± 0.01253 | 1.573 ± 0.01362 |
| AMD UN vs. AMD B2-treated | 19.1% 0.0043 | 1 ± 0.01253 | 1.191 ± 0.05657 |
| AMD UN vs. AMD B3-treated | 17.3% 0.0095 | 1 ± 0.01253 | 1.173 ± 0.004108 |
| AMD UN vs. AMD B4-treated | 35.4% 0.0007 | 1 ± 0.01253 | 1.354 ± 0.03830 |
| AMD UN vs. AMD B5-treated | 6.6% 0.0095 | 1 ± 0.01253 | 1.066 ± 0.009232 |
| AMD UN vs. AMD B6-treated | 16.6% 0.0027 | 1 ± 0.01253 | 1.166 ± 0.04125 |
| (b) AMD PATIENT #12_Resveratrol Effects on ROS Levels. | |||
| Ros Levels | Percent Decrease/p-Value | Untreated Mean ± SEM | Resveratrol Brands Mean ± SEM |
| AMD UN vs. AMD B1-treated | 63.04% 0.0001 | 1 ± 0.02391 | 0.3696 ± 0.01083 |
| AMD UN vs. AMD B2-treated | 56.68% 0.0009 | 1 ± 0.02391 | 0.4332 ± 0.02135 |
| AMD UN vs. AMD B3-treated | 26.04% 0.0013 | 1 ± 0.02391 | 0.7396 ± 0.04140 |
| AMD UN vs. AMD B4-treated | 11.05% 0.0100 | 1 ± 0.02391 | 0.8895 ± 0.02766 |
| AMD UN vs. AMD B5-treated | 19.12% 0.0019 | 1 ± 0.02391 | 0.8088 ± 0.05079 |
| AMD UN vs. AMD B6-treated | 11.33% 0.0317 | 1 ± 0.02391 | 0.8867 ± 0.004355 |
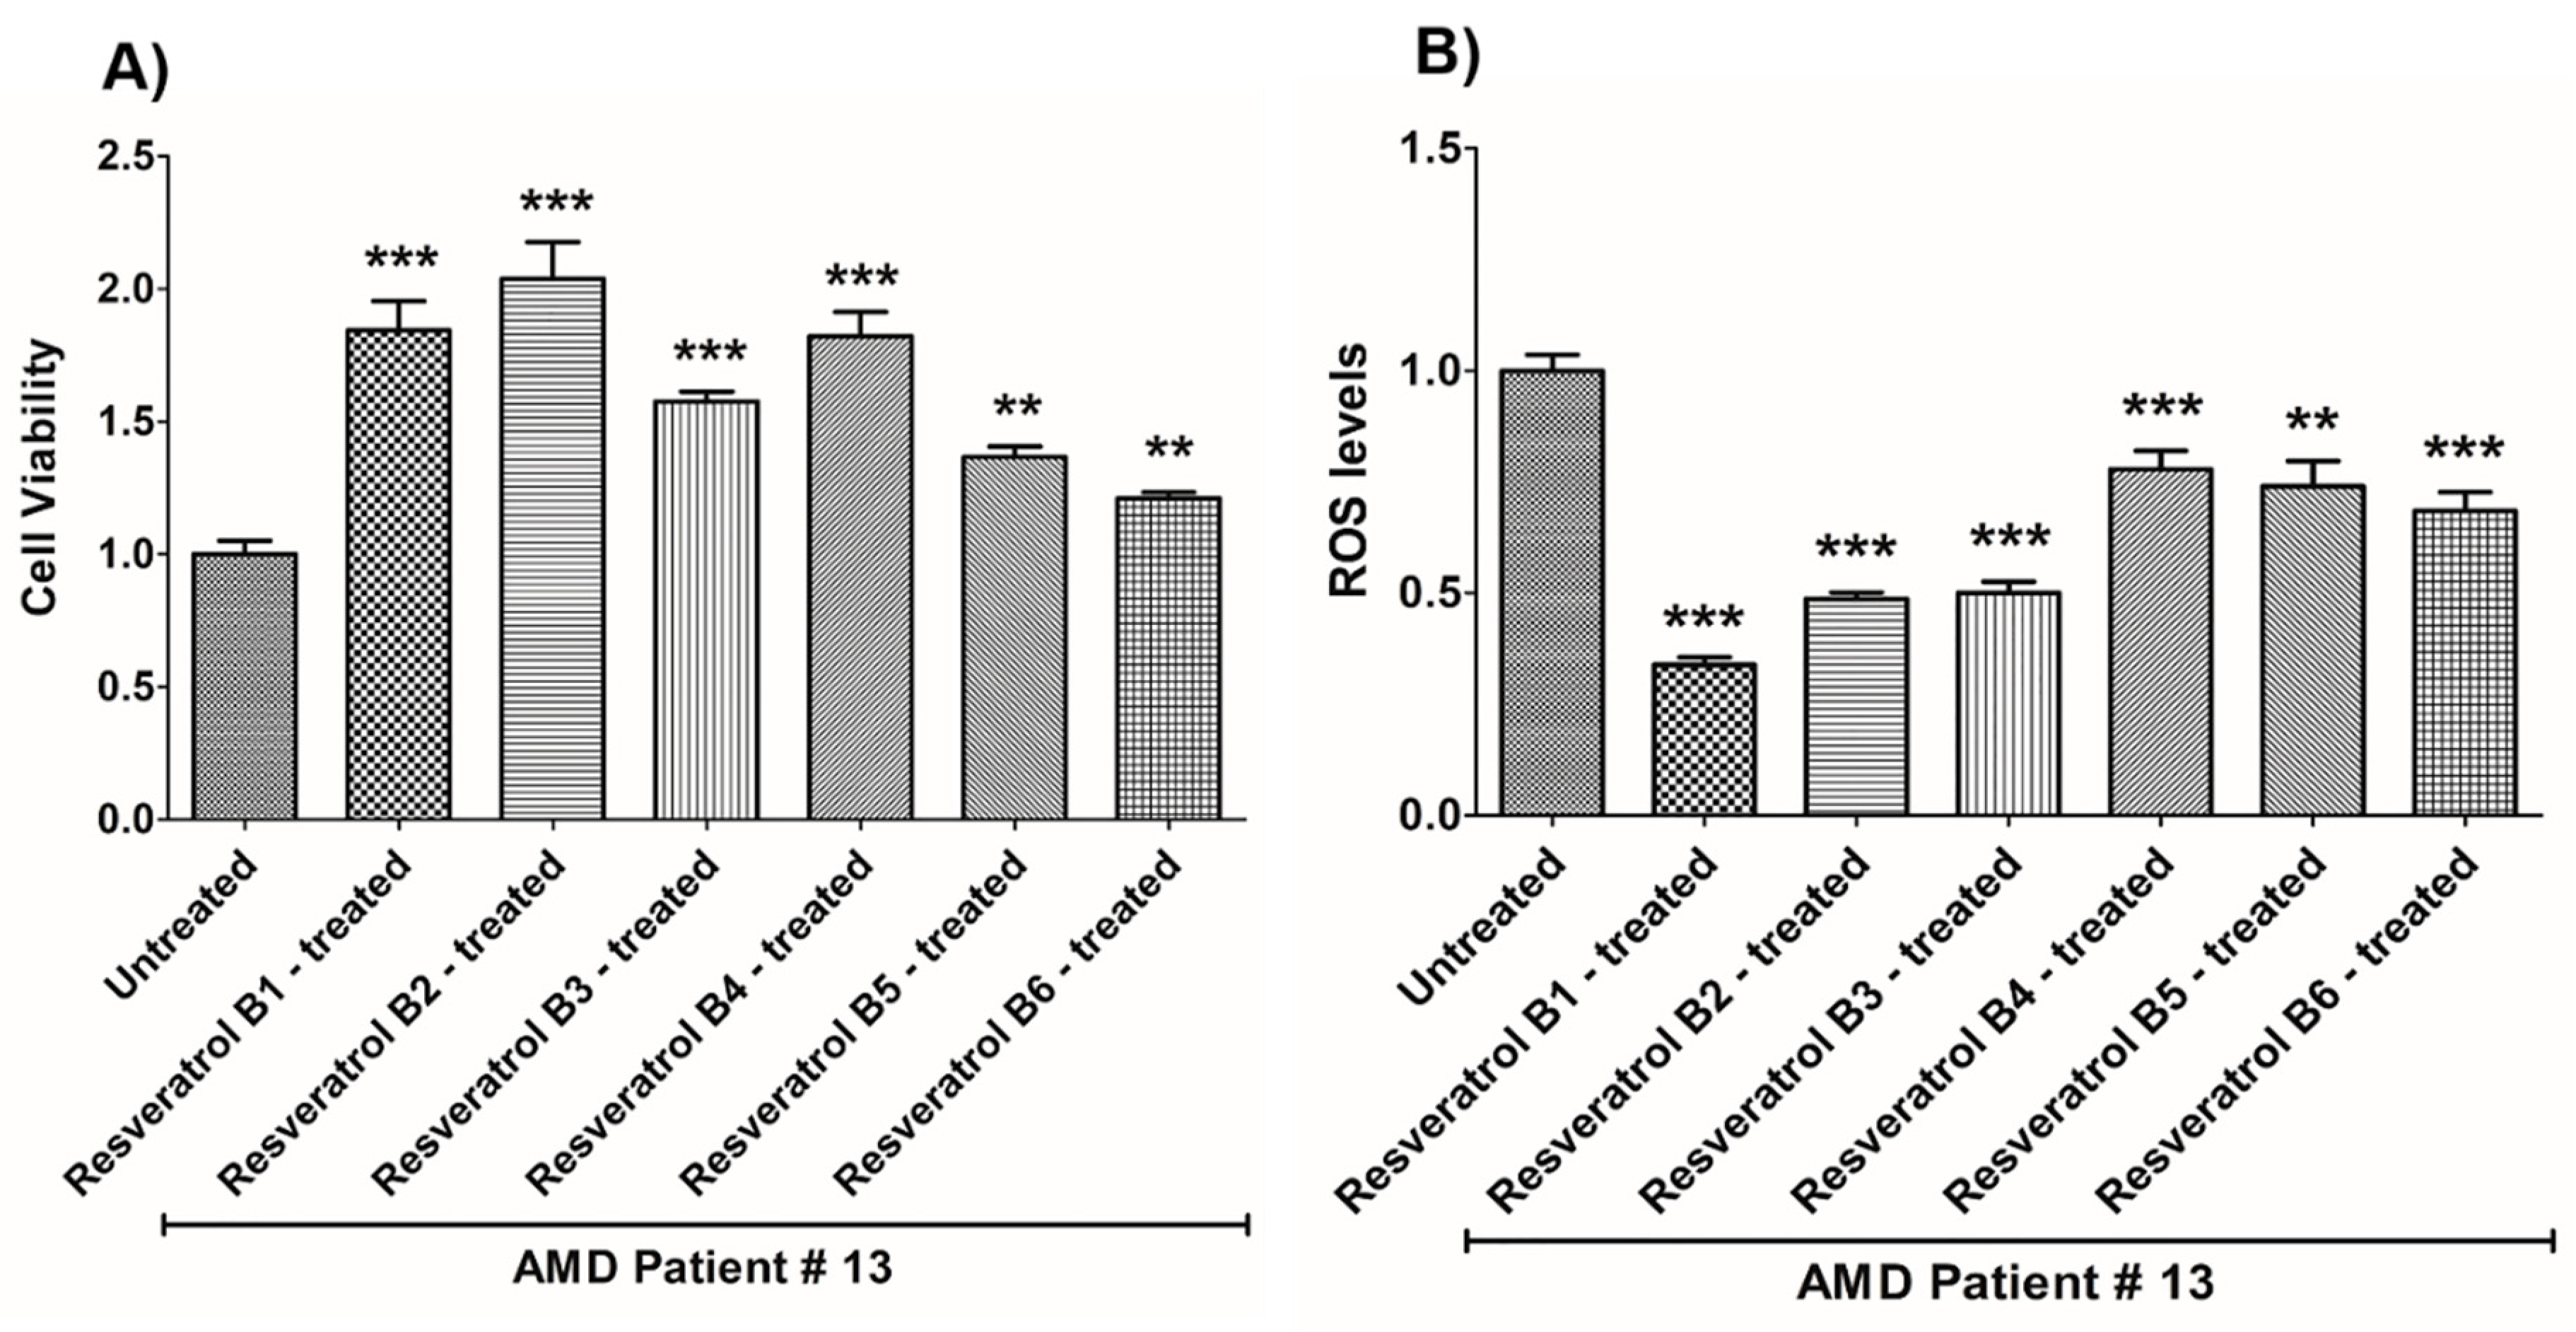
| (a) AMD PATIENT #13_Resveratrol Effects on Cell Viability. | |||
| Cell Viability | Percent Increase/p-Value | Untreated Mean ± SEM | Resveratrol Brands Mean ± SEM |
| AMD UN vs. AMD B1-treated | 84.3% 0.0002 | 1 ± 0.05060 | 1.843 ± 0.1106 |
| AMD UN vs. AMD B2-treated | 103.8% 0.0002 | 1 ± 0.05060 | 2.038 ± 0.1386 |
| AMD UN vs. AMD B3-treated | 57.6% 0.0002 | 1 ± 0.05060 | 1.576 ± 0.03683 |
| AMD UN vs. AMD B4-treated | 82.1% 0.0002 | 1 ± 0.05060 | 1.821 ± 0.09256 |
| AMD UN vs. AMD B5-treated | 36.6% 0.0012 | 1 ± 0.05060 | 1.366 ± 0.03996 |
| AMD UN vs. AMD B6-treated | 21% 0.0093 | 1 ± 0.05060 | 1.210 ± 0.02351 |
| (b) AMD PATIENT #13_Resveratrol Effects on ROS Levels. | |||
| Ros Levels | Percent Decrease/p-Value | Untreated Mean ± SEM | Resveratrol Brands Mean ± SEM |
| AMD UN vs. AMD B1-treated | 66.14% 0.0007 | 1 ± 0.03609 | 0.3386 ± 0.01675 |
| AMD UN vs. AMD B2-treated | 51.29% 0.0007 | 1 ± 0.03609 | 0.4871 ± 0.01380 |
| AMD UN vs. AMD B3-treated | 49.99% 0.0007 | 1 ± 0.03609 | 0.5001 ± 0.02519 |
| AMD UN vs. AMD B4-treated | 22.14% 0.0007 | 1 ± 0.03609 | 0.7786 ± 0.04144 |
| AMD UN vs. AMD B5-treated | 25.98% 0.0043 | 1 ± 0.03609 | 0.7402 ± 0.05699 |
| AMD UN vs. AMD B6-treated | 31.56% 0.0007 | 1 ± 0.03609 | 0.6844 ± 0.04228 |
| (a) Summary of Resveratrol effects on Cell Viability. | |||||||||||||
| Treatment | P1 | P2 | P3 | P4 | P5 | P6 | P7 | P8 | P9 | P10 | P11 | P12 | P13 |
| B1 Resveratrol Formulation | ** | * | *** | * | ** | * | *** | ** | ** | *** | ** | *** | *** |
| B2 Resveratrol Formulation | ** | * | ** | * | ** | * | *** | * | ** | *** | ** | ** | *** |
| B3 Resveratrol Formulation | ** | * | ** | * | ** | * | *** | ** | ** | *** | ** | ** | *** |
| B4 Resveratrol Formulation | ** | ** | ** | ** | ** | ** | *** | ** | ** | *** | ** | *** | *** |
| B5 Resveratrol Formulation | ** | ** | ** | * | ** | ** | *** | ** | ** | *** | ** | ** | ** |
| B6 Resveratrol Formulation | ** | ** | * | ** | ** | * | *** | ns | ** | *** | ** | ** | ** |
| (b) Summary of Resveratrol Effects on ROS Levels. | |||||||||||||
| Treatment | P1 | P2 | P3 | P4 | P5 | P6 | P7 | P8 | P9 | P10 | P11 | P12 | P13 |
| B1 Resveratrol Formulation | ** | *** | ** | ** | ** | *** | *** | *** | * | *** | *** | *** | *** |
| B2 Resveratrol Formulation | ** | *** | ** | ** | ** | *** | *** | *** | ** | *** | *** | *** | *** |
| B3 Resveratrol Formulation | ** | *** | ** | ** | ** | *** | *** | *** | ** | *** | *** | ** | *** |
| B4 Resveratrol Formulation | ** | ** | ** | ns | ns | ** | * | ** | ns | ns | *** | * | *** |
| B5 Resveratrol Formulation | ** | *** | ns | ** | * | *** | * | * | ns | *** | *** | ** | ** |
| B6 Resveratrol Formulation | ** | ** | * | ** | * | * | ** | *** | * | * | *** | * | *** |
Increase; Decrease.© 2020 by the authors. Licensee MDPI, Basel, Switzerland. This article is an open access article distributed under the terms and conditions of the Creative Commons Attribution (CC BY) license (http://creativecommons.org/licenses/by/4.0/).
Share and Cite
Nashine, S.; Nesburn, A.B.; Kuppermann, B.D.; Kenney, M.C. Role of Resveratrol in Transmitochondrial AMD RPE Cells. Nutrients 2020, 12, 159. https://doi.org/10.3390/nu12010159
Nashine S, Nesburn AB, Kuppermann BD, Kenney MC. Role of Resveratrol in Transmitochondrial AMD RPE Cells. Nutrients. 2020; 12(1):159. https://doi.org/10.3390/nu12010159
Chicago/Turabian StyleNashine, Sonali, Anthony B. Nesburn, Baruch D. Kuppermann, and Maria Cristina Kenney. 2020. "Role of Resveratrol in Transmitochondrial AMD RPE Cells" Nutrients 12, no. 1: 159. https://doi.org/10.3390/nu12010159
APA StyleNashine, S., Nesburn, A. B., Kuppermann, B. D., & Kenney, M. C. (2020). Role of Resveratrol in Transmitochondrial AMD RPE Cells. Nutrients, 12(1), 159. https://doi.org/10.3390/nu12010159