3.1. Methods
The starting point of the methodology is based on McKelvey [
3], who studied the relationships between unit value and the quality demanded on commodity groups. He follows Deaton [
2] in assuming that commodities are divided into groups, each consisting of a number of consumer goods; for instance, if the group is confectionery, it will comprise chocolates, candies. The expenditure for group c is given by:
where
and
are vectors containing the price and quantity of each consumption good in the group. The price vector is then decomposed as:
where
is a vector capturing the relative price of commodities within the group and
is a scalar capturing the component of price that is common to all the commodities in the group (e.g., a Laspeyres price index). In this analysis
is understood as a price index for the category c.
Replacing (2) into (1), one obtains:
Multiplying and dividing the right hand side by the total quantity purchased, i.e.,
and replacing
, (3) becomes:
As explained by McKelvey [
3],
is a measure of the quality of group c purchases. If the relative prices are constant, a higher
means that the chosen
is more expensive per unit of group c consumption and this is interpreted as buying a higher quality of group c goods. However, note that the term quality is used in vague way, as it is not associated with any particular attribute.
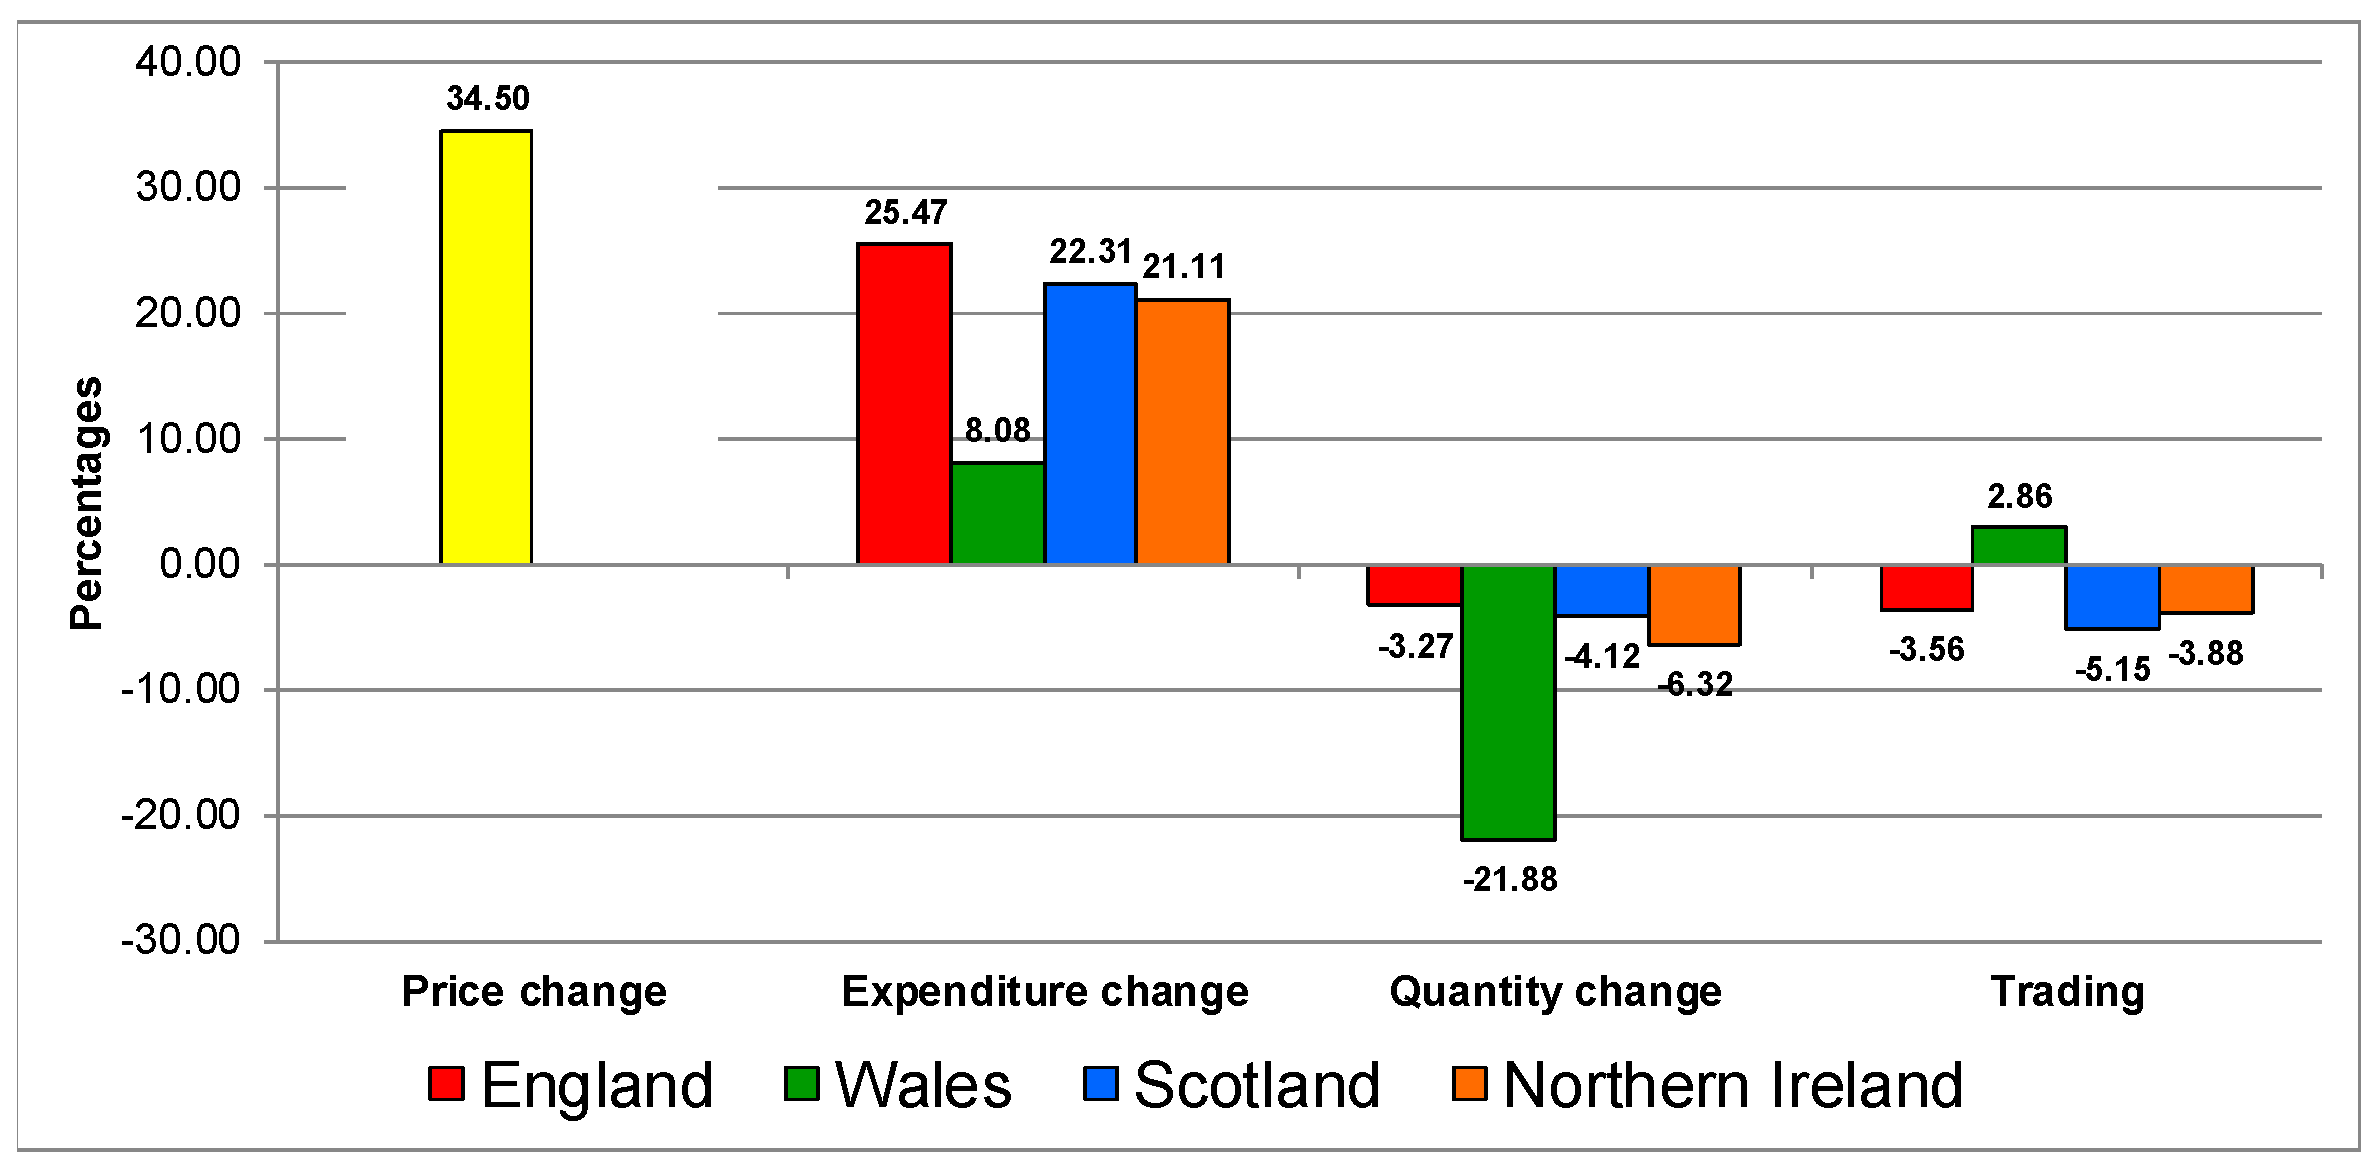
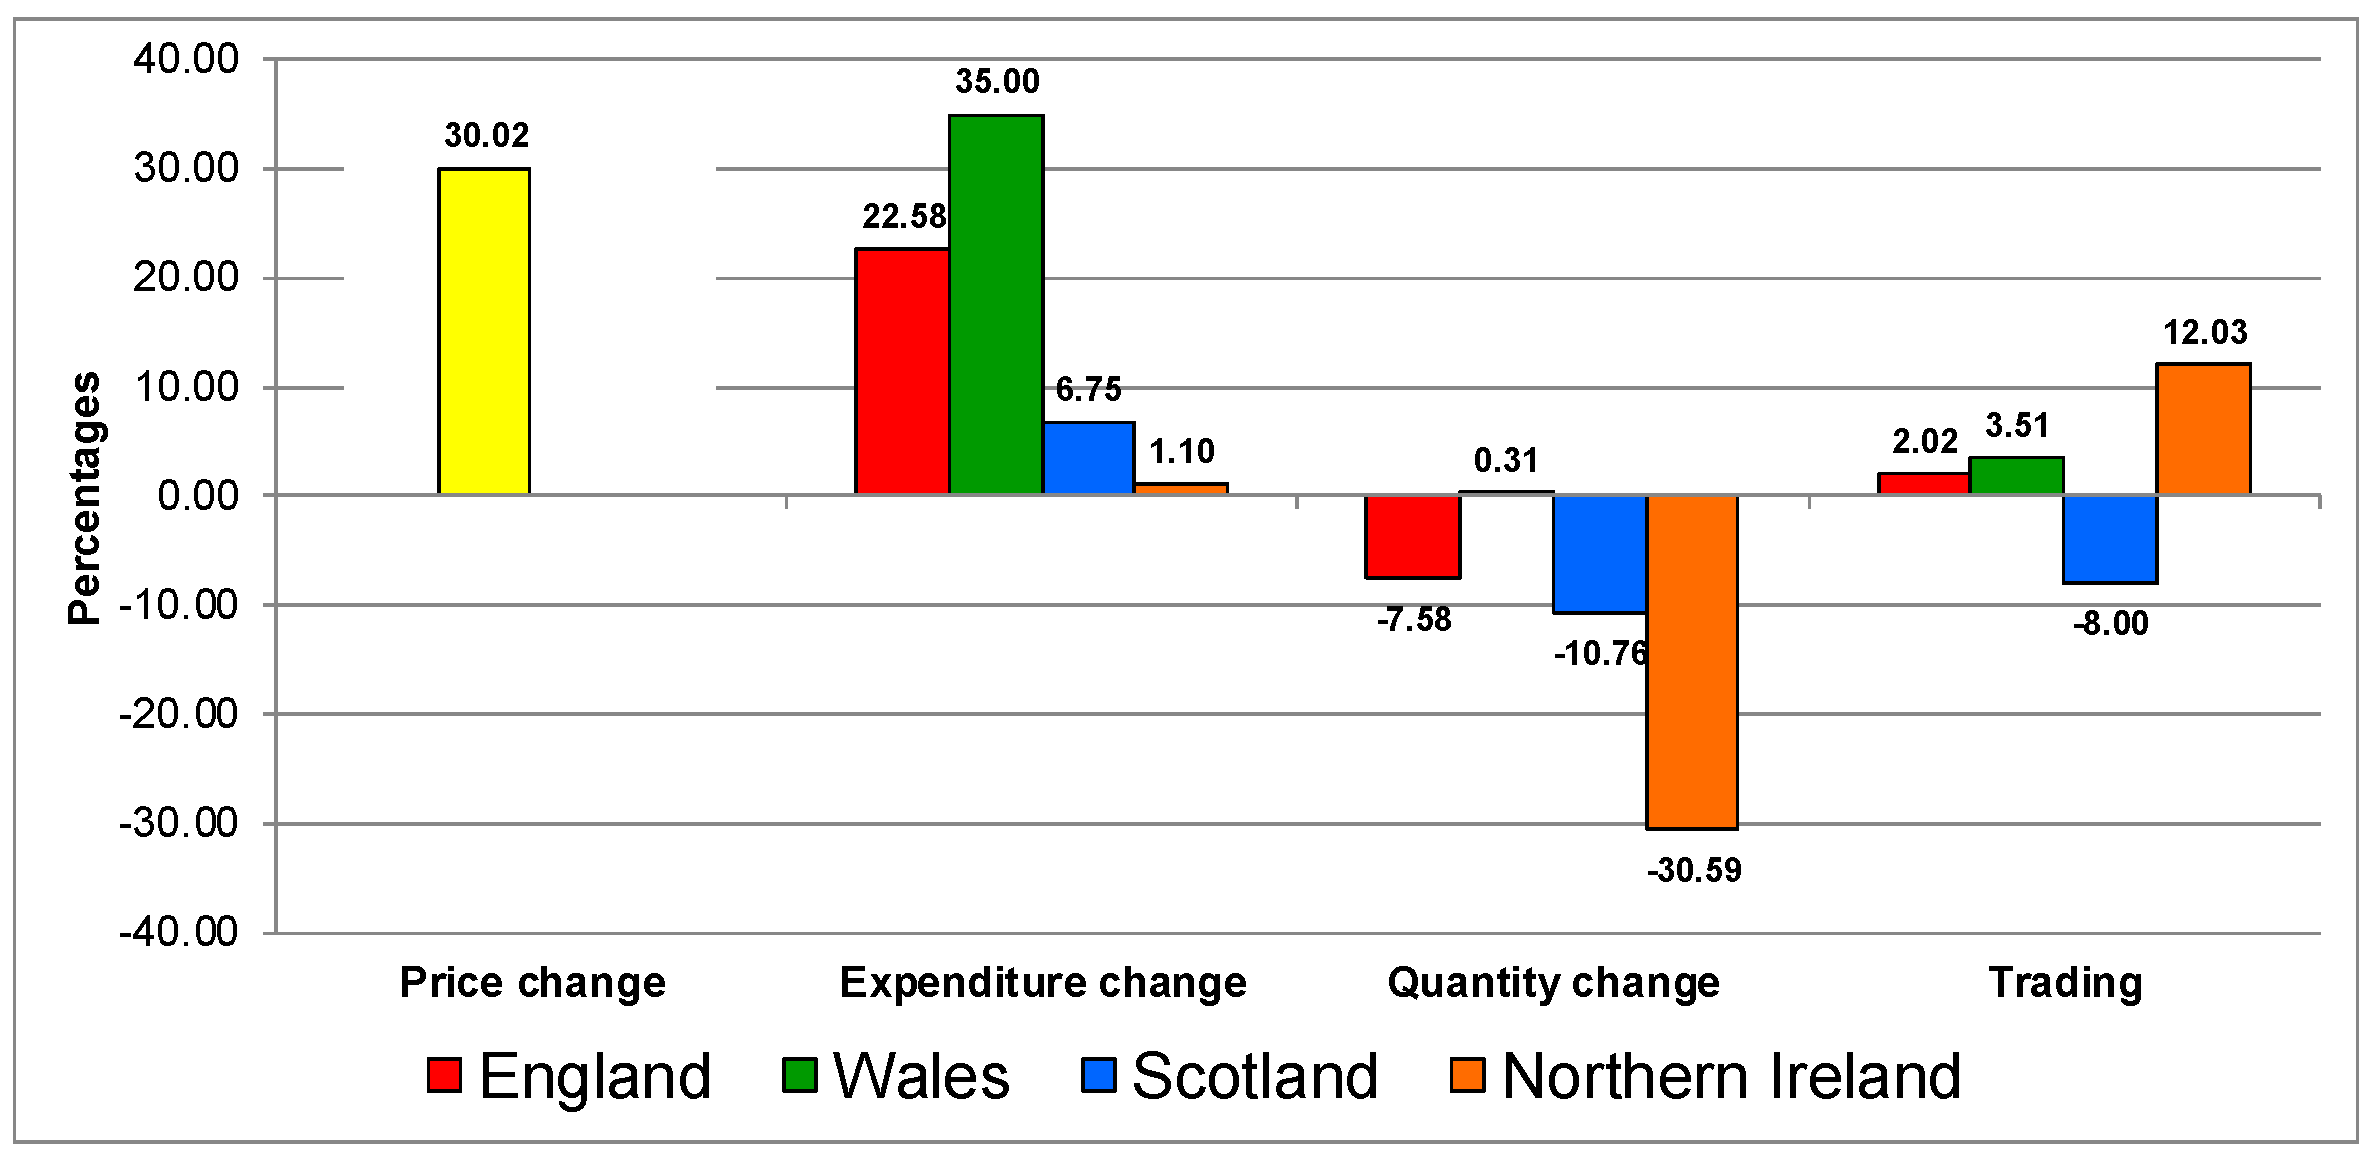
Expressing (4) as discrete changes from period t-1 to t we obtain (5):
where ‘^’ indicate the relative change with respect to the previous period. From (5), it is clear that to keep the expenditure constant after an increase in the category price, a consumer can reduce its total quantity purchase or trade down the quality of the purchases or a combination of both. If
is negative, the consumer is trading down in quality.
The next step once
is computed from (5) is to explore to what extent the change in quality as explained above is associated with a change of nutrients. This is an empirical question, as the cheaper products in a category might not be least nutritional ones. To do this, we considered the following pooled regression based on Suits [
17]:
where
is the relative change of nutrient i in country j in time period t;
and
are the intercept and slope of the regression, respectively, and
,
,
and
are parameters based on dummies (i.e., that take the value of one if the observation is for the country and zero otherwise) that measure the deviations with respect to
for the cases of the four UK countries, namely England (Eng), Northern Ireland (NI), Scotland (Sc) and Wales (W).
The most important parameter of regression (6) is the slope , which indicates the reaction of the nutrient (i.e., how it changes in relative terms) to a trading in quality. Note that if the coefficient of the slope is negative and statistically significant (using a t test to check whether the slope is different than zero), it means that trading down in quality (which is a negative relative change in the real unit value) increases the nutrients. In contrast, if the slope is positive, trading down in quality decreases the demand for nutrients. Of course, if the slope is not statistically significant, it means that trading in quality is unrelated to nutrition.
3.2. Data Used on the Analysis
The data available for the computation of the trading up/down in quality are disaggregated information from the Defra’s “Family Food” publication for each of the four UK countries. These data provide information about weekly per capita expenditures and purchases [
4,
5].
The prices used for the categories were from the Office for National Statistics (ONS) Retail Price Indices for the studied groups (base 1987 = 100), which match the groups of the Family Food statistics.
The information about nutrients per food category was taken from disaggregated data underpinning the “Family Food” publication and can be found in the UK Data Archive as part of the Living Costs and Food Surveys. These nutrient intakes are calculated from food purchases using nutrient composition data supplied by Public Health England (PHE) [
4,
5]. The majority of the data are from PHE’s nutrient analysis programme, supplemented by values from manufacturers and retailers. The nutrient conversion excludes inedible parts of purchased foods, such as fish heads, banana peels; it assumes all food is eaten. Intakes from dietary supplements are not included in any of the tables. The nutrients categories considered in the analysis were energy (i.e., calories), macronutrients (i.e., fat, carbohydrates and proteins), saturated fats, Non-milk extrinsic (NME) sugars, sodium, total Sugars and cholesterol.
In terms of the categories used for the analysis, these included the following Defra’s Family Food categories. Note that the aggregation of the groups is due to the fact that the retail price indices are only available on an aggregated way:
Food and drink: which was made of: milk and milk products excluding cheese, cheese, carcase meat, non-carcase meat and meat products, fish, eggs, fats, sugar and preserves, fresh and processed fruit and vegetables, including potatoes, bread, flour, cakes, buns and pastries, biscuits and crispbreads, other cereals and cereal products, beverages, other food and drink, soft drinks, confectionery and alcoholic drinks.
Biscuits and cakes: chocolate biscuits, sweet biscuits (not chocolate) and cereal bars, cream crackers and other unsweetened biscuits and crispbread.
Confectionery: chocolate bars—solid, chocolate bars—filled, chewing gum, mints and boiled sweets, fudges, toffees, caramels and takeaway confectionery.
Processed potato products: chips—frozen or not frozen, takeaway chips, instant potato, canned potatoes, crisps and potato snacks and other potato products, frozen or not frozen.
Processed vegetables (excluding processed potatoes): tomatoes, canned or bottled, peas, canned, beans canned, baked beans in sauce, other canned beans and pulses, other canned vegetables, dried pulses other than air-dried, air-dried vegetables, vegetable juices and purees, tomato puree and vegetable purees, vegetable juices, e.g., tomato juice, carrot juice, peas, frozen, beans, frozen, ready meals and other vegetable products (including takeaways), ready meals and other vegetable products, frozen or not frozen, all vegetable takeaway products and other frozen vegetables.
Soft drinks: concentrated (not low calorie), not concentrated (not low calorie), concentrated (low calorie) and not concentrated (low calorie).
Note that the cases of biscuits and cakes, confectionery and soft drinks are part of the discretionary food categories as defined by the Food Standard Scotland (FSS); these are categories not necessary for nutrition and which are contributors of sugar, saturated fats and salts [
18]. Thus, according to the FSS, these foods have a significant impact on the diet, accounting for, on average, about one-fifth of total calories, total fat and saturated fats and over half of daily free sugars consumption. Moreover, the FSS concluded that a key step towards meeting dietary goals would be to reduce the intake of these foods.


