Interrelation between Plasma Concentrations of Vitamins C and E along the Trajectory of Ageing in Consideration of Lifestyle and Body Composition: A Longitudinal Study over Two Decades

Abstract
:
1. Introduction
2. Materials and Methods
2.1. Study Design
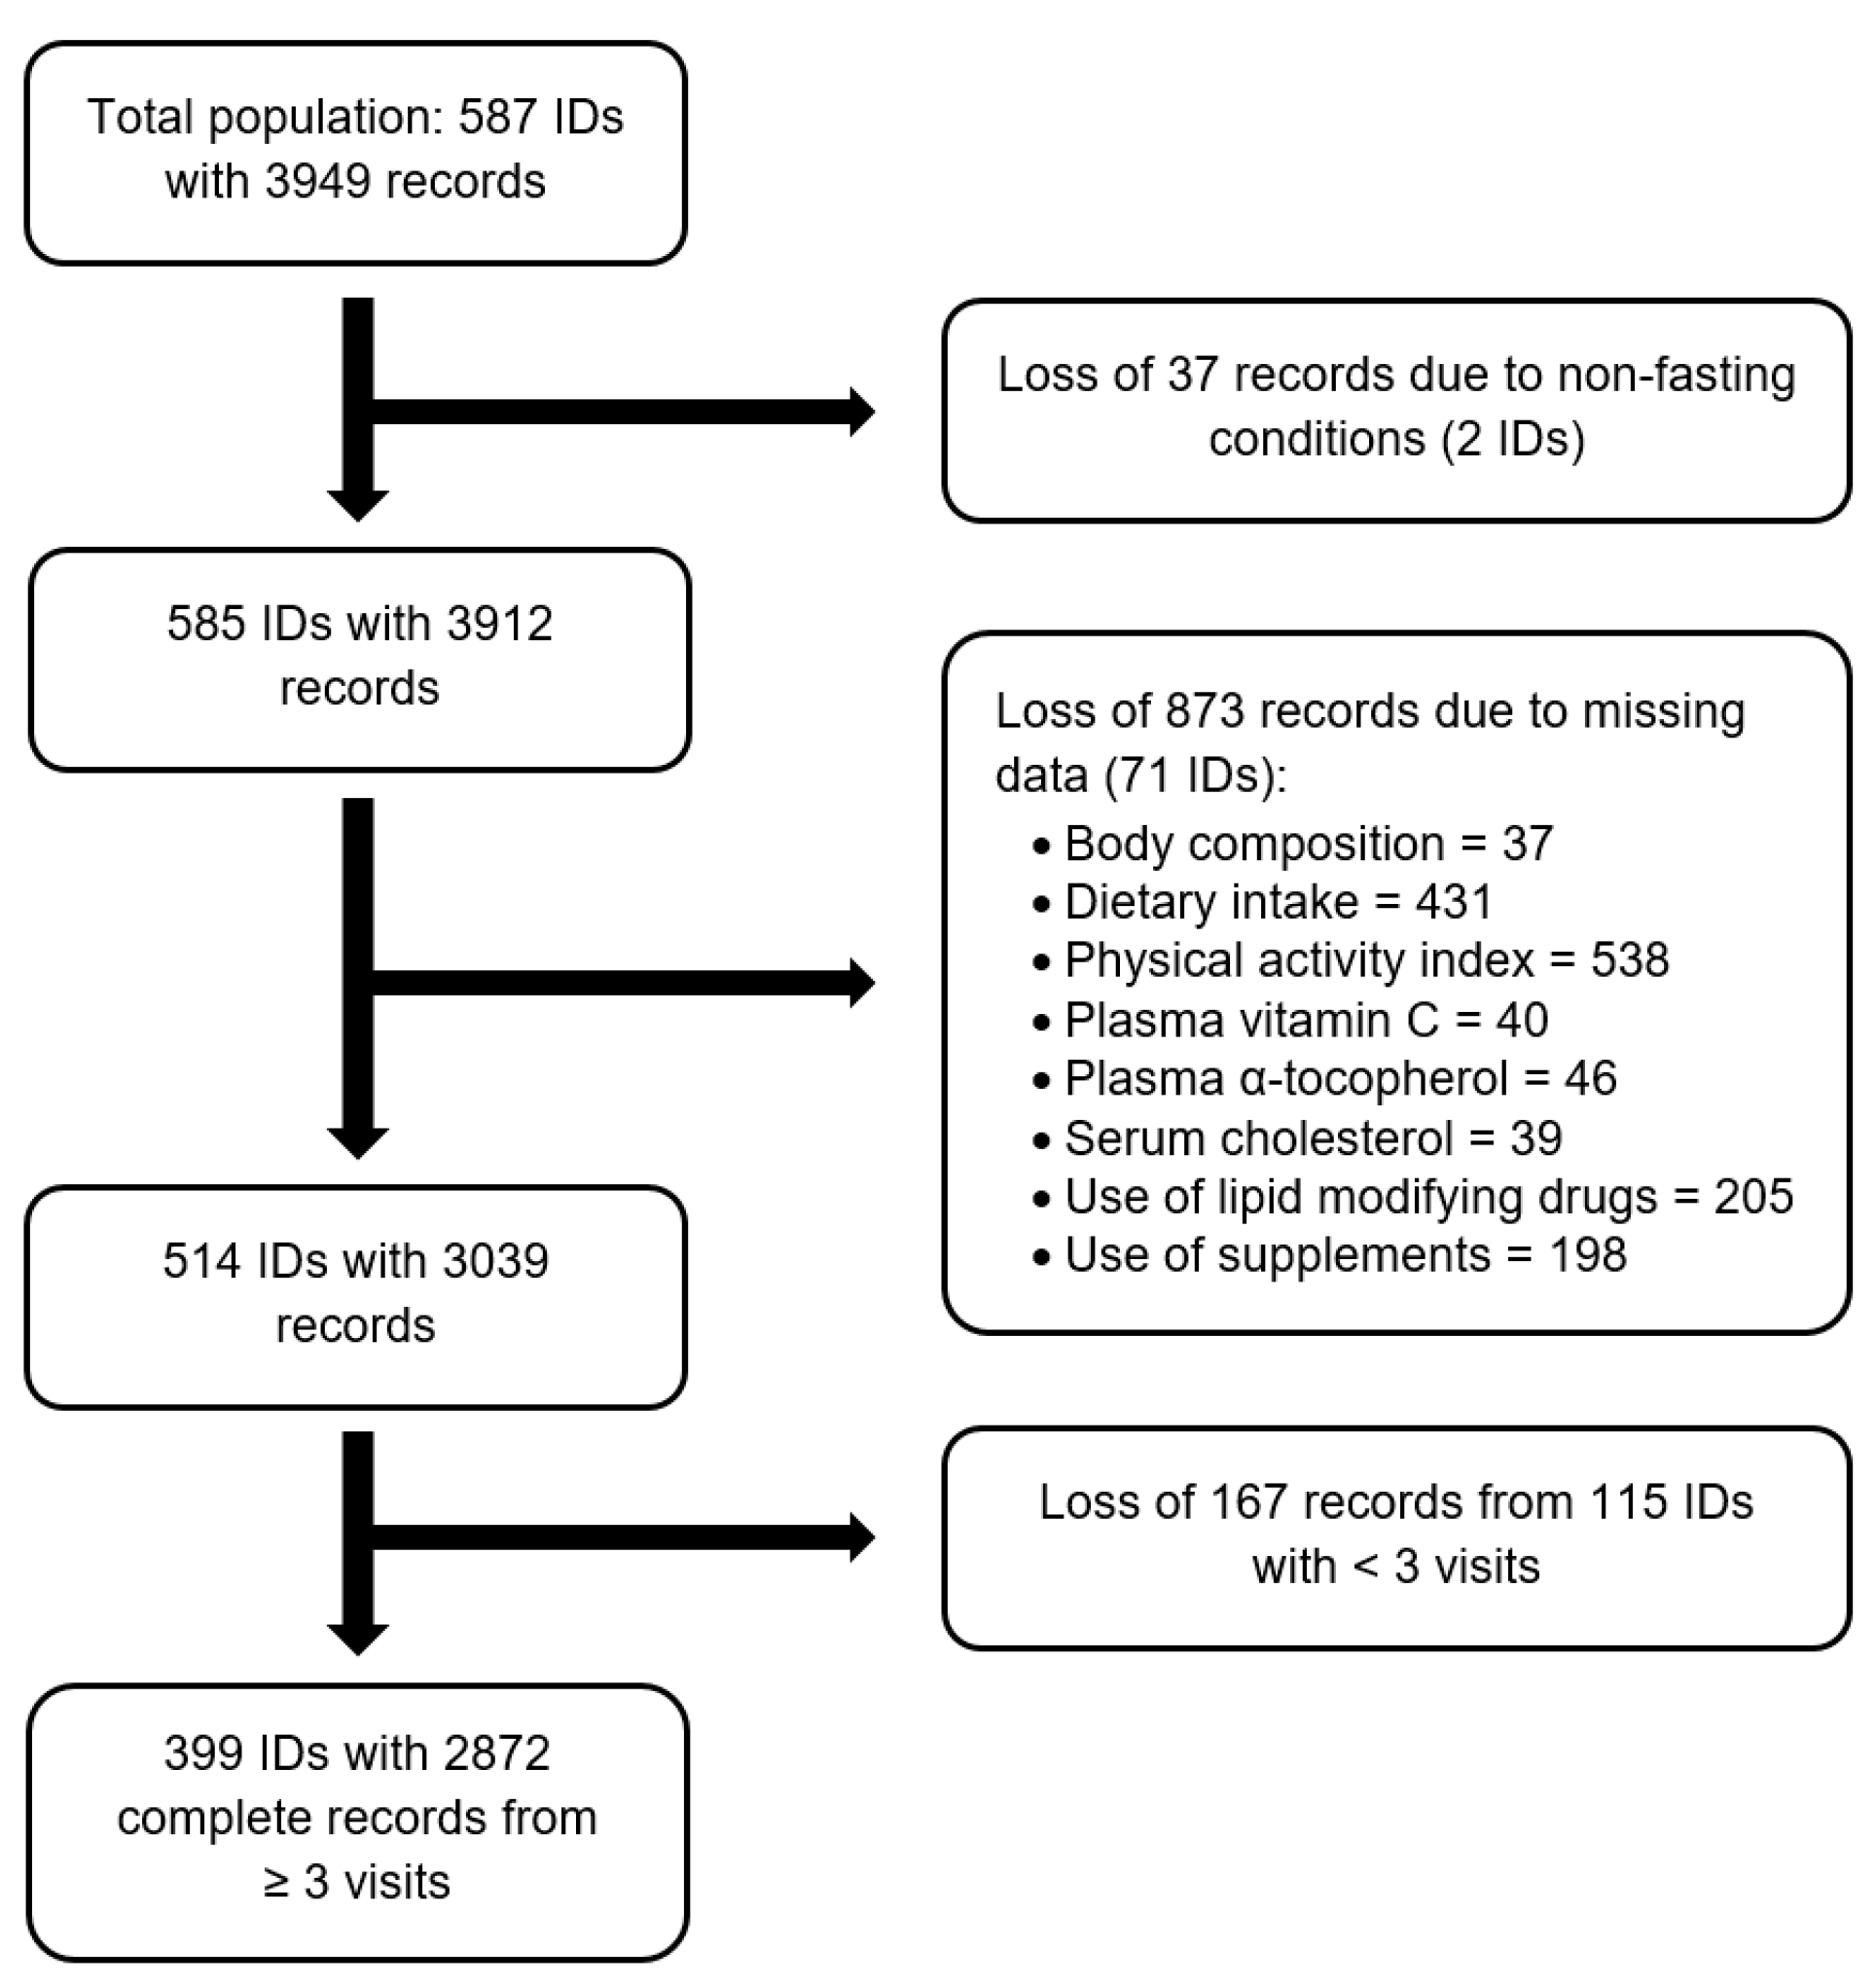
2.2. Study Subjects
2.3. Blood Biomarkers
2.4. Anthropometric Data and Body Composition
2.5. Lifestyle Factors
2.6. Disease History and Use of Lipid-Modifying Drugs
2.7. Dietary Factors and Use of Supplements
2.8. Statistical Analyses
- For the log α-tocopherol/total cholesterol ratio: (1) The dietary variable “α-tocopherol equivalents” was replaced by the ratio of mg α-tocopherol to g PUFA (centered to 1 mg/g) to investigate whether this ratio is a better proxy for the log α-tocopherol/total cholesterol ratio than α-tocopherol equivalents. (2) Absolute FM was replaced by relative FM (centered to 39%) to investigate which body composition parameter, if any, shows a stronger association with the log α-tocopherol/total cholesterol ratio.
- For log plasma α-tocopherol: Serum cholesterol (centered to 5.6 mmol/L) was included as additional fixed effect to investigate whether the former identified predicting variables show associations with plasma α-tocopherol independent of serum cholesterol.
3. Results
3.1. Baseline Characteristics
3.2. Determinants of Plasma Concentrations of Vitamins C and E Based on a Longitudinal Approach
4. Discussion
4.1. Determinants of Vitamin C Biomarker Status in the Course of Ageing
4.2. Determinants of Vitamin E Biomarker Status in the Course of Ageing
4.3. Interrelation between Vitamins C and E
4.4. Study Limitations and Strengths
5. Conclusions
Supplementary Materials
Author Contributions
Funding
Acknowledgments
Conflicts of Interest
Abbreviations
| 95% CI | 95% confidence interval |
| BIA | bioelectrical impedance analysis |
| BMI | body mass index |
| DRVs | dietary reference values |
| FFM | fat-free mass |
| FM | fat mass |
| GISELA | longitudinal study on nutrition and health status of senior citizens in Giessen |
| PAI | physical activity index |
| PRI | Population Reference Intakes |
| PUFA | polyunsaturated fatty acids |
References
- Traber, M.G.; Stevens, J.F. Vitamins C and E: Beneficial effects from a mechanistic perspective. Free Radic. Biol. Med. 2011, 51, 1000–1013. [Google Scholar] [CrossRef] [PubMed] [Green Version]
- EFSA NDA Panel (EFSA Panel on Dietetic Products, Nutrition and Allergies). Scientific opinion on dietary reference values for vitamin E as α-tocopherol. EFSA J. 2015, 13, 4149. [Google Scholar] [CrossRef]
- Sharma, M.K.; Buettner, G.R. Interaction of vitamin C and vitamin E during free radical stress in plasma: An ESR study. Free Radic. Biol. Med. 1993, 14, 649–653. [Google Scholar] [CrossRef]
- Niki, E.; Noguchi, N.; Tsuchihashi, H.; Gotoh, N. Interaction among vitamin C, vitamin E, and beta-carotene. Am. J. Clin. Nutr. 1995, 62, 1322S–1326S. [Google Scholar] [CrossRef]
- Hamilton, I.M.; Gilmore, W.S.; Benzie, I.F.; Mulholland, C.W.; Strain, J.J. Interactions between vitamins C and E in human subjects. Br. J. Nutr. 2000, 84, 261–267. [Google Scholar] [CrossRef] [Green Version]
- Yeum, K.J.; Beretta, G.; Krinsky, N.I.; Russell, R.M.; Aldini, G. Synergistic interactions of antioxidant nutrients in a biological model system. Nutrition 2009, 25, 839–846. [Google Scholar] [CrossRef]
- Cabello-Verrugio, C.; Simon, F.; Trollet, C.; Santibañez, J.F. Oxidative stress in disease and aging: Mechanisms and therapies 2016. Oxid. Med. Cell Longev. 2017, 2017, 4310469. [Google Scholar] [CrossRef]
- Olmedilla, B.; Granado, F.; Southon, S.; Wright, A.J.; Blanco, I.; Gil-Martinez, E.; van den Berg, H.; Corridan, B.; Roussel, A.M.; Chopra, M.; et al. Serum concentrations of carotenoids and vitamins A, E, and C in control subjects from five European countries. Br. J. Nutr. 2001, 85, 227–238. [Google Scholar] [CrossRef] [Green Version]
- Dietrich, M.; Block, G.; Norkus, E.P.; Hudes, M.; Traber, M.G.; Cross, C.E.; Packer, L. Smoking and exposure to environmental tobacco smoke decrease some plasma antioxidants and increase gamma-tocopherol in vivo after adjustment for dietary antioxidant intakes. Am. J. Clin. Nutr. 2003, 77, 160–166. [Google Scholar] [CrossRef] [Green Version]
- Canoy, D.; Wareham, N.; Welch, A.; Bingham, S.; Luben, R.; Day, N.; Khaw, K.T. Plasma ascorbic acid concentrations and fat distribution in 19,068 British men and women in the European Prospective Investigation into Cancer and Nutrition Norfolk cohort study. Am. J. Clin. Nutr. 2005, 82, 1203–1209. [Google Scholar] [CrossRef] [Green Version]
- Galan, P.; Viteri, F.E.; Bertrais, S.; Czernichow, S.; Faure, H.; Arnaud, J.; Ruffieux, D.; Chenal, S.; Arnault, N.; Favier, A.; et al. Serum concentrations of beta-carotene, vitamins C and E, zinc and selenium are influenced by sex, age, diet, smoking status, alcohol consumption and corpulence in a general French adult population. Eur. J. Clin. Nutr. 2005, 59, 1181–1190. [Google Scholar] [CrossRef] [PubMed] [Green Version]
- Faure, H.; Preziosi, P.; Roussel, A.M.; Bertrais, S.; Galan, P.; Hercberg, S.; Favier, A. Factors influencing blood concentration of retinol, alpha-tocopherol, vitamin C, and beta-carotene in the French participants of the SU.VI.MAX trial. Eur. J. Clin. Nutr. 2006, 60, 706–717. [Google Scholar] [CrossRef] [PubMed] [Green Version]
- Schleicher, R.L.; Carroll, M.D.; Ford, E.S.; Lacher, D.A. Serum vitamin C and the prevalence of vitamin C deficiency in the United States: 2003−2004 National Health and Nutrition Examination Survey (NHANES). Am. J. Clin. Nutr. 2009, 90, 1252–1263. [Google Scholar] [CrossRef]
- Jungert, A.; Neuhäuser-Berthold, M. The lower vitamin C plasma concentrations in elderly men compared with elderly women can partly be attributed to a volumetric dilution effect due to differences in fat-free mass. Br. J. Nutr. 2015, 113, 859–864. [Google Scholar] [CrossRef] [Green Version]
- Langlois, K.; Cooper, M.; Colapinto, C.K. Vitamin C status of Canadian adults: Findings from the 2012/2013 Canadian Health Measures Survey. Health Rep. 2016, 27, 3–10. [Google Scholar] [PubMed]
- Lührmann, P.M.; Herbert, B.M.; Gaster, C.; Neuhäuser-Berthold, M. Validation of a self-administered 3-day estimated dietary record for use in the elderly. Eur. J. Nutr. 1999, 38, 235–240. [Google Scholar] [CrossRef] [PubMed]
- Krems, C.; Lührmann, P.M.; Neuhäuser-Berthold, M. Physical activity in young and elderly subjects. J. Sports Med. Phys. Fit. 2004, 44, 71–76. [Google Scholar]
- Lührmann, P.M.; Bender, R.; Edelmann-Schäfer, B.; Neuhäuser-Berthold, M. Longitudinal changes in energy expenditure in an elderly German population: A 12-year follow-up. Eur. J. Clin. Nutr. 2009, 63, 986–992. [Google Scholar] [CrossRef]
- Jungert, A.; Zenke-Philippi, C.; Neuhäuser-Berthold, M. Dynamics and interactions of cobalamin and folate status during advanced aging—A longitudinal study in a community-dwelling cohort with multiple follow-ups. Nutr. J. 2020, 19, 64. [Google Scholar] [CrossRef]
- EFSA NDA Panel (EFSA Panel on Dietetic Products, Nutrition and Allergies). Scientific opinion on dietary reference values for vitamin C. EFSA J. 2013, 11, 3418. [Google Scholar] [CrossRef] [Green Version]
- Traber, M.G. Vitamin E inadequacy in humans: Causes and consequences. Adv. Nutr. 2014, 5, 503–514. [Google Scholar] [CrossRef] [PubMed] [Green Version]
- Deutsche Gesellschaft für Ernährung; Österreichische Gesellschaft für Ernährung; Schweizerische Gesellschaft für Ernährung. Vitamin E (Tocopherole). In Referenzwerte für die Nährstoffzufuhr, 2. Auflage, 5. aktualisierte Ausgabe; Deutsche Gesellschaft für Ernährung; Österreichische Gesellschaft für Ernährung; Schweizerische Gesellschaft für Ernährung: Bonn, Germany, 2019; pp. 1–5. [Google Scholar]
- Traber, M.G.; Jialal, I. Measurement of lipid-soluble vitamins – further adjustment needed? Lancet 2000, 355, 2013–2014. [Google Scholar] [CrossRef]
- Raederstorff, D.; Wyss, A.; Calder, P.C.; Weber, P.; Eggersdorfer, M. Vitamin E function and requirements in relation to PUFA. Br. J. Nutr. 2015, 114, 1113–1122. [Google Scholar] [CrossRef] [Green Version]
- Bates, D.; Mächler, M.; Bolker, B.; Walker, S. Fitting linear mixed-effects models using lme4. J. Stat. Softw. 2015, 67, 1–48. [Google Scholar] [CrossRef]
- Hothorn, T.; Bretz, F.; Westfall, P. Simultaneous inference in general parametric models. Version 1.4−13. 2020. Available online: https://cran.r-project.org/web/packages/multcomp/multcomp.pdf (accessed on 10 May 2020).
- Lüdecke, D.; Makowski, D.; Waggoner, P.; Patil, I. Performance: Assessment of regression models performance, 2020. CRAN, R package. Available online: https://cran.r-project.org/web/packages/performance/performance.pdf (accessed on 23 September 2020). [CrossRef]
- Schwarzpaul, S.; Strassburg, A.; Lührmann, P.M.; Neuhäuser-Berthold, M. Intake of vitamin and mineral supplements in an elderly German population. Ann. Nutr. Metab. 2006, 50, 155–162. [Google Scholar] [CrossRef] [PubMed]
- Carr, A.C.; Pullar, J.M.; Bozonet, S.M.; Vissers, M.C. Marginal ascorbate status (hypovitaminosis C) results in an attenuated response to vitamin C supplementation. Nutrients 2016, 8, 341. [Google Scholar] [CrossRef] [Green Version]
- Monacelli, F.; Acquarone, E.; Giannotti, C.; Borghi, R.; Nencioni, A. Vitamin C, aging and Alzheimer’s disease. Nutrients 2017, 9, 670. [Google Scholar] [CrossRef] [Green Version]
- Forster, S.; Gariballa, S. Age as a determinant of nutritional status: A cross sectional study. Nutr. J. 2005, 4, 28. [Google Scholar] [CrossRef] [Green Version]
- Weber, D.; Stuetz, W.; Toussaint, O.; Debacq-Chainiaux, F.; Dollé, M.E.T.; Jansen, E.; Gonos, E.S.; Franceschi, C.; Sikora, E.; Hervonen, A.; et al. Associations between specific redox biomarkers and age in a large European cohort: The MARK-AGE project. Oxid. Med. Cell Longev. 2017, 2017, 1401452. [Google Scholar] [CrossRef]
- Gomez-Cabrera, M.C.; Domenech, E.; Viña, J. Moderate exercise is an antioxidant: Upregulation of antioxidant genes by training. Free Radic. Biol. Med. 2008, 44, 126–131. [Google Scholar] [CrossRef]
- Carlsohn, A.; Rohn, S.; Mayer, F.; Schweigert, F.J. Physical activity, antioxidant status, and protein modification in adolescent athletes. Med. Sci. Sports Exerc. 2010, 42, 1131–1139. [Google Scholar] [CrossRef] [PubMed]
- Parker, L.; McGuckin, T.A.; Leicht, A.S. Influence of exercise intensity on systemic oxidative stress and antioxidant capacity. Clin. Physiol. Funct. Imaging 2014, 34, 377–383. [Google Scholar] [CrossRef] [PubMed]
- Pincemail, J.; Vanbelle, S.; Degrune, F.; Cheramy-Bien, J.-P.; Charlier, C.; Chapelle, J.-P.; Giet, D.; Collette, G.; Albert, A.; Defraigne, J.-O. Lifestyle behaviours and plasma vitamin C and β-carotene levels from the ELAN population (Liège, Belgium). J. Nutr. Metab. 2011, 2011, 494370. [Google Scholar] [CrossRef] [PubMed] [Green Version]
- Saito, K.; Yokoyama, T.; Yoshida, H.; Kim, H.; Shimada, H.; Yoshida, Y.; Iwasa, H.; Shimizu, Y.; Kondo, Y.; Handa, S.; et al. A significant relationship between plasma vitamin C concentration and physical performance among Japanese elderly women. J. Gerontol. A Biol. Sci. Med. Sci. 2012, 67, 295–301. [Google Scholar] [CrossRef]
- Suboticanec-Buzina, K.; Buzina, R.; Brubacher, G.; Sapunar, J.; Christeller, S. Vitamin C status and physical working capacity in adolescents. Int. J. Vitam. Nutr. Res. 1984, 54, 55–60. [Google Scholar]
- Paschalis, V.; Theodorou, A.A.; Kyparos, A.; Dipla, K.; Zafeiridis, A.; Panayiotou, G.; Vrabas, I.S.; Nikolaidis, M.G. Low vitamin C values are linked with decreased physical performance and increased oxidative stress: Reversal by vitamin C supplementation. Eur. J. Nutr. 2016, 55, 45–53. [Google Scholar] [CrossRef]
- Mason, S.A.; Trewin, A.J.; Parker, L.; Wadley, G.D. Antioxidant supplements and endurance exercise: Current evidence and mechanistic insights. Redox Biol. 2020, 35, 101471. [Google Scholar] [CrossRef]
- Alberg, A. The influence of cigarette smoking on circulating concentrations of antioxidant micronutrients. Toxicology 2002, 180, 121–137. [Google Scholar] [CrossRef]
- Waniek, S.; di Giuseppe, R.; Esatbeyoglu, T.; Plachta-Danielzik, S.; Ratjen, I.; Jacobs, G.; Nöthlings, U.; Koch, M.; Schlesinger, S.; Rimbach, G.; et al. Vitamin E (α- and γ-tocopherol) levels in the community: Distribution, clinical and biochemical correlates, and association with dietary patterns. Nutrients 2017, 10, 3. [Google Scholar] [CrossRef] [Green Version]
- Schultz, M.; Leist, M.; Petrzika, M.; Gassmann, B.; Brigelius-Flohé, R. Novel urinary metabolite of alpha-tocopherol, 2,5,7,8-tetramethyl−2(2′-carboxyethyl)−6-hydroxychroman, as an indicator of an adequate vitamin E supply? Am. J. Clin. Nutr. 1995, 62, 1527S–1534S. [Google Scholar] [CrossRef]
- Haller, J.; Weggemans, R.M.; Lammi-Keefe, C.J.; Ferry, M. Changes in the vitamin status of elderly Europeans: Plasma vitamins A, E, B−6, B−12, folic acid and carotenoids. SENECA Investigators. Eur. J. Clin. Nutr. 1996, 50, S32–S46. [Google Scholar] [PubMed]
- Grolier, P.; Boirie, Y.; Levadoux, E.; Brandolini, M.; Borel, P.; Azais-Braesco, V.; Beaufrère, B.; Ritz, P. Age-related changes in plasma lycopene concentrations, but not in vitamin E, are associated with fat mass. Br. J. Nutr. 2000, 84, 711–716. [Google Scholar] [CrossRef] [Green Version]
- Winklhofer-Roob, B.M.; Roob, J.M.; Maritschnegg, M.; Sprinz, G.; Hiller, D.; Marktfelder, E.; Preinsberger, M.; Wuga, S.; Sundl, I.; Tiran, B.; et al. Does aging affect the response of vitamin E status to vitamin E depletion and supplementation? Ann. N. Y. Acad. Sci. 2004, 1031, 381–384. [Google Scholar] [CrossRef] [PubMed]
- Ford, E.S.; Schleicher, R.L.; Mokdad, A.H.; Ajani, U.A.; Liu, S. Distribution of serum concentrations of alpha-tocopherol and gamma-tocopherol in the US population. Am. J. Clin. Nutr. 2006, 84, 75–383. [Google Scholar] [CrossRef]
- Stuetz, W.; Weber, D.; Dollé, M.E.; Jansen, E.; Grubeck-Loebenstein, B.; Fiegl, S.; Toussaint, O.; Bernhardt, J.; Gonos, E.S.; Franceschi, C.; et al. Plasma carotenoids, tocopherols, and retinol in the age-stratified (35−74 years) general population: A cross-sectional study in six European countries. Nutrients 2016, 8, 614. [Google Scholar] [CrossRef]
- Weber, D.; Kochlik, B.; Demuth, I.; Steinhagen-Thiessen, E.; Grune, T.; Norman, K. Plasma carotenoids, tocopherols and retinol—association with age in the Berlin Aging Study II. Redox Biol. 2020, 32, 101461. [Google Scholar] [CrossRef] [PubMed]
- Horwitt, M.K.; Harvey, C.C.; Dahm, C.H., Jr.; Searcy, M.T. Relationship between tocopherol and serum lipid levels for determination of nutritional adequacy. Ann. N. Y. Acad. Sci. 1972, 203, 223–236. [Google Scholar] [CrossRef]
- Thurnham, D.I.; Davies, J.A.; Crump, B.J.; Situnayake, R.D.; Davis, M. The use of different lipids to express serum tocopherol: Lipid ratios for the measurement of vitamin E status. Ann. Clin. Biochem. 1986, 23, 514–520. [Google Scholar] [CrossRef]
- Jungjohann, S.M.; Lührmann, P.M.; Bender, R.; Blettner, M.; Neuhäuser-Berthold, M. Eight-year trends in food, energy and macronutrient intake in a sample of elderly German subjects. Br. J. Nutr. 2005, 93, 361–378. [Google Scholar] [CrossRef]
- Nordestgaard, B.G.; Langlois, M.R.; Langsted, A.; Chapman, M.J.; Aakre, K.M.; Baum, H.; Borén, J.; Bruckert, E.; Catapano, A.; Cobbaert, C.; et al. Quantifying atherogenic lipoproteins for lipid-lowering strategies: Consensus-based recommendations from EAS and EFLM. Atherosclerosis 2020, 294, 46–61. [Google Scholar] [CrossRef] [Green Version]
- Sahebkar, A.; Simental-Mendía, L.E.; Ferretti, G.; Bacchetti, T.; Golledge, J. Statin therapy and plasma vitamin E concentrations: A systematic review and meta-analysis of randomized placebo-controlled trials. Atherosclerosis 2015, 243, 579–588. [Google Scholar] [CrossRef] [PubMed]
- Hall, W.L.; Jeanes, Y.M.; Lodge, J.K. Hyperlipidemic subjects have reduced uptake of newly absorbed vitamin E into their plasma lipoproteins, erythrocytes, platelets, and lymphocytes, as studied by deuterium-labeled alpha-tocopherol biokinetics. J. Nutr. 2005, 135, 58–63. [Google Scholar] [CrossRef] [PubMed] [Green Version]
- Sies, H.; Stahl, W. Vitamins E and C, beta-carotene, and other carotenoids as antioxidants. Am. J. Clin. Nutr. 1995, 62, 1315S–1321S. [Google Scholar] [CrossRef] [PubMed]
- Bruno, R.S.; Leonard, S.W.; Atkinson, J.; Montine, T.J.; Ramakrishnan, R.; Bray, T.M.; Traber, M.G. Faster plasma vitamin E disappearance in smokers is normalized by vitamin C supplementation. Free Radic. Biol. Med. 2006, 40, 689–697. [Google Scholar] [CrossRef] [PubMed]
- Li, G.; Li, Y.; Chen, X.; Sun, H.; Hou, X.; Shi, J. Circulating tocopherols and risk of coronary artery disease: A systematic review and meta-analysis. Eur. J. Prev. Cardiol. 2016, 23, 748–757. [Google Scholar] [CrossRef] [PubMed]
- Kontush, A.; Finckh, B.; Karten, B.; Kohlschütter, A.; Beisiegel, U. Antioxidant and prooxidant activity of alpha-tocopherol in human plasma and low density lipoprotein. J. Lipid Res. 1996, 37, 1436–1448. [Google Scholar] [PubMed]


| Parameter | Total (n = 399) | Women (n = 278) | Men (n = 121) | |||
|---|---|---|---|---|---|---|
| Median | Q25, Q75 | Median | Q25, Q75 | Median | Q25, Q75 | |
| Age (years) | 66 | 62, 70 | 67 | 62, 71 | 66 | 63, 70 |
| Body mass index (kg/m2) | 26 | 24, 29 | 26 | 24, 29 | 26 | 24, 28 |
| Fat-free mass (kg) | 42 | 38, 52 | 39 | 38, 42 | 54 | 52, 58 |
| Fat mass (kg) | 27 | 22, 33 | 28 | 23, 35 | 23 | 19, 29 |
| Fat mass (%) | 39 | 33, 44 | 42 | 38, 46 | 30 | 27, 33 |
| Plasma vitamin C (µmol/L) | 74 | 64, 85 | 77 | 67, 88 | 68 | 60, 76 |
| Plasma α-tocopherol (µmol/L) | 35 | 29, 42 | 36 | 30, 42 | 32 | 27, 39 |
| Serum cholesterol (mmol/L) | 5.8 | 5.2, 6.4 | 5.9 | 5.3, 6.5 | 5.6 | 4.7, 6.2 |
| Energy intake (MJ/d) | 8.5 | 7.1, 10 | 8.1 | 6.8, 9.6 | 9.9 | 8.0, 12 |
| Vitamin C intake (mg/d) | 117 | 84, 152 | 117 | 84, 156 | 117 | 83, 138 |
| Vitamin E intake (mg/d) b | 9.9 | 7.5, 14 | 9.8 | 7.4, 14 | 10 | 8.0, 13 |
| PUFA intake (g/d) | 10 | 7.7, 13 | 9.6 | 7.1, 13 | 11 | 8.4, 14 |
| Physical activity index | 1.7 | 1.6, 1.8 | 1.7 | 1.6, 1.8 | 1.7 | 1.6, 1.8 |
| n | % | n | % | n | % | |
| Female sex | 278 | 70 | ||||
| Vitamin C supplement users | 112 | 28 | 81 | 29 | 31 | 26 |
| Vitamin E supplement users | 107 | 27 | 81 | 29 | 26 | 22 |
| Multivitamin supplement users | 104 | 26 | 79 | 28 | 25 | 21 |
| Current/past smokers | 178 | 45 | 86 | 31 | 92 | 76 |
| Users of lipid-modifying drugs | 63 | 16 | 48 | 17 | 15 | 12 |
| Disease diagnosis c | 236 | 59 | 180 | 65 | 56 | 46 |
| Model 2 (n = 399) | Model 3 (n = 399) | Model 4 (n = 301) | Model 5 (n = 226) | |||||
|---|---|---|---|---|---|---|---|---|
| CE | [95% CI] | CE | [95% CI] | CE | [95% CI] | CE | [95% CI] | |
| Intercept | 7.5 × 10+1 *** | [7.3 × 10+1, 7.8 × 10+1] | 7.5 × 10+1 *** | [7.2 × 10+1, 7.7 × 10+1] | 7.5 × 10+1 *** | [7.3 × 10+1, 7.8 × 10+1] | 7.5 × 10+1 *** | [7.2 × 10+1, 7.9 × 10+1] |
| Age (years) | −3.2 × 10⁻² | [−1.5 × 10⁻¹, 8.9 × 10⁻²] | −7.6 × 10⁻² | [−2.3 × 10⁻¹, 7.5 × 10⁻²] | −6.8 × 10⁻² | [−2.1 × 10⁻¹, 7.3 × 10⁻²] | −1.4 × 10⁻² | [−1.5 × 10⁻¹, 1.2 × 10⁻¹] |
| Age2 (years) | 3.4 × 10⁻³ | [−8.1 × 10⁻³, 1.5 × 10⁻²] | 3.1 × 10⁻³ | [−8.5 × 10⁻³, 1.5 × 10⁻²] | 1.2 × 10⁻³ | [−1.3 × 10⁻², 1.5 × 10⁻²] | 4.4 × 10⁻³ | [−8.2 × 10⁻³, 1.7 × 10⁻²] |
| Male sex | −1.6 × 10+0 | [−6.4 × 10+0, 3.2 × 10+0] | −5.8 × 10+0 | [−1.2 × 10+1, 2.6 × 10⁻¹] | −1.8 × 10+0 | [−7.1 × 10+0, 3.5 × 10+0] | −2.4 × 10+0 | [−8.1 × 10+0, 3.5 × 10+0] |
| FFM (kg) | −3.7 × 10⁻¹ * | [−6.2 × 10⁻¹, −1.3 × 10⁻¹] | −6.1 × 10⁻¹ ** | [−9.2 × 10⁻¹, −3.0 × 10⁻¹] | −3.7 × 10⁻¹ ‡ | [−6.5 × 10⁻¹, −9.5 × 10⁻²] | −3.3 × 10⁻¹ | [−6.2 × 10⁻¹, −3.8 × 10⁻²] |
| Current/past smoking | −3.0 × 10+0 | [−5.8 × 10+0, −2.0 × 10⁻¹] | −3.2 × 10+0 | [−6.0 × 10+0, −3.6 × 10⁻¹] | −2.0 × 10+0 | [−5.0 × 10+0, 1.0 × 10+0] | −2.3 × 10+0 | [−5.7 × 10+0, 1.1 × 10+0] |
| PAI | 8.3 × 10+0 ** | [4.1 × 10+0, 1.3 × 10+1] | 8.2 × 10+0 ** | [3.9 × 10+0, 1.2 × 10+1] | 9.8 × 10+0 ** | [4.6 × 10+0, 1.5 × 10+1] | 7.5 × 10+0 * | [2.4 × 10+0, 1.2 × 10+1] |
| Vitamin C intake (mg/d) | 1.8 × 10⁻¹ | [4.0 × 10⁻², 3.2 × 10⁻¹] | 1.6 × 10⁻¹ | [−1.2 × 10⁻², 3.3 × 10⁻¹] | 1.5 × 10⁻¹ | [−2.6 × 10⁻², 3.2 × 10⁻¹] | 1.7 × 10⁻¹ | [−4.1 × 10⁻³, 3.5 × 10⁻¹] |
| Vitamin C intake2 (mg/d) | −7.8 × 10⁻³ | [−1.4 × 10⁻², −1.3 × 10⁻³] | −7.6 × 10⁻³ | [−1.4 × 10⁻², −1.0 × 10⁻³] | −6.7 × 10⁻³ | [−1.7 × 10⁻², 3.0 × 10⁻³] | −5.1 × 10⁻³ | [−1.5 × 10⁻², 5.0 × 10⁻³] |
| Use of supplements c | 3.9 × 10+0 *** | [2.7 × 10+0, 5.2 × 10+0] | 3.9 × 10+0 *** | [2.7 × 10+0, 5.2 × 10+0] | 4.3 × 10+0 *** | [2.9 × 10+0, 5.8 × 10+0] | ||
| Use of lipid-modifying drugs | 9.8 × 10⁻² | [−1.6 × 10+0, 1.8 × 10+0] | 1.9 × 10⁻¹ | [−1.5 × 10+0, 1.9 × 10+0] | −7.3 × 10⁻¹ | [−2.8 × 10+0, 1.3 × 10+0] | −2.7 × 10⁻¹ | [−2.2 × 10+0, 1.7 × 10+0] |
| Plasma TOC (µmol/L) | 1.5 × 10⁻¹ *** | [9.1 × 10⁻², 2.0 × 10⁻¹] | 1.3 × 10⁻¹ ** | [6.9 × 10⁻², 2.0 × 10⁻¹] | 2.0 × 10⁻¹ *** | [1.2 × 10⁻¹, 2.7 × 10⁻¹] | 2.0 × 10⁻¹ *** | [1.3 × 10⁻¹, 2.7 × 10⁻¹] |
| Disease diagnosis d | −1.2 × 10+0 | [−3.9 × 10+0, 1.4 × 10+0] | −1.0 × 10+0 | [−3.7 × 10+0, 1.7 × 10+0] | −2.3 × 10+0 | [−5.2 × 10+0, 5.5 × 10⁻¹] | −1.4 × 10+0 | [−4.7 × 10+0, 2.0 × 10+0] |
| I (male sex:age) | 6.3 × 10⁻² | [−1.9 × 10⁻¹, 3.2 × 10⁻¹] | ||||||
| I (male sex:FFM) | 6.0 × 10⁻¹ | [1.0 × 10⁻¹, 1.1 × 10+0] | ||||||
| I (male sex:VC intake) | −5.6 × 10⁻² | [−2.9 × 10⁻¹, 1.8 × 10⁻¹] | ||||||
| I (age:VC intake) | 5.0 × 10⁻³ | [−8.3 × 10⁻³, 1.8 × 10⁻²] | ||||||
| I (smoking:VC intake) | 6.9 × 10⁻² | [−1.4 × 10⁻¹, 2.8 × 10⁻¹] | ||||||
| I (male sex:plasma TOC) | 6.4 × 10⁻² | [−6.7 × 10⁻², 1.9 × 10⁻¹] | ||||||
| I (age:plasma TOC) | 4.6 × 10⁻³ | [−3.2 × 10⁻³, 1.2 × 10⁻²] | ||||||
| R2, marginal/conditional | 0.107/0.571 | 0.112/0.574 | 0.104/0.561 | 0.121/0.573 | ||||
| Model 2 (n = 399) | Model 3 (n = 399) | Model 4 (n = 289) | Model 5 (n = 226) | |||||
|---|---|---|---|---|---|---|---|---|
| CE | [95% CI] | CE | [95% CI] | CE | [95% CI] | CE | [95% CI] | |
| Intercept | 3.5 × 10+0 *** | [3.5 × 10+0, 3.6 × 10+0] | 3.5 × 10+0 *** | [3.5 × 10+0, 3.6 × 10+0] | 3.5 × 10+0 *** | [3.5 × 10+0, 3.5 × 10+0] | 3.5 × 10+0 *** | [3.5 × 10+0, 3.6 × 10+0] |
| Age (years) | 5.1 × 10⁻³ *** | [3.3 × 10⁻³, 7.0 × 10⁻³] | 6.0 × 10⁻³ *** | [3.8 × 10⁻³, 8.1 × 10⁻³] | 5.5 × 10⁻³ *** | [3.6 × 10⁻³, 7.3 × 10⁻³] | 6.6 × 10⁻³ *** | [4.6 × 10⁻³, 8.6 × 10⁻³] |
| Age2 (years) | −1.8 × 10⁻⁴ | [−3.5 × 10⁻⁴, −1.7 × 10⁻⁵] | −1.6 × 10⁻⁴ | [−3.3 × 10⁻⁴, 1.2 × 10⁻⁵] | −2.0 × 10⁻⁴ | [−3.7 × 10⁻⁴, −2.0 × 10⁻⁵] | −1.9 × 10⁻⁴ | [−3.7 × 10⁻⁴, −1.5 × 10⁻⁵] |
| Male sex | −1.1 × 10⁻¹ *** | [−1.6 × 10⁻¹, −5.6 × 10⁻²] | −1.1 × 10⁻¹ ** | [−1.6 × 10⁻¹, −5.1 × 10⁻²] | −1.1 × 10⁻¹ ** | [−1.6 × 10⁻¹, −5.2 × 10⁻²] | −1.5 × 10⁻¹ *** | [−2.1 × 10⁻¹, −7.9 × 10⁻²] |
| FM (kg) | 6.1 × 10⁻⁴ | [−1.4 × 10⁻³, 2.6 × 10⁻³] | 7.4 × 10⁻⁴ | [−1.6 × 10⁻³, 3.1 × 10⁻³] | 1.0 × 10⁻⁵ | [−2.1 × 10⁻³, 2.1 × 10⁻³] | −2.8 × 10⁻⁴ | [−2.8 × 10⁻³, 2.2 × 10⁻³] |
| Current/past smoking | 4.2 × 10⁻² | [−6.2 × 10⁻³, 9.0 × 10⁻²] | 4.3 × 10⁻² | [−4.6 × 10⁻³, 9.1 × 10⁻²] | 3.4 × 10⁻² | [−1.4 × 10⁻², 8.3 × 10⁻²] | 4.8 × 10⁻² | [−1.2 × 10⁻², 1.1 × 10⁻¹] |
| PAI | 2.6 × 10⁻² | [−3.4 × 10⁻², 8.5 × 10⁻²] | 2.7 × 10⁻² | [−3.3 × 10⁻², 8.7 × 10⁻²] | 1.9 × 10⁻² | [−4.5 × 10⁻², 8.3 × 10⁻²] | 9.1 × 10⁻² | [2.3 × 10⁻², 1.6 × 10⁻¹] |
| TOC intake (mg/d) | 2.3 × 10⁻³ | [2.1 × 10⁻⁴, 4.4 × 10⁻³] | 3.5 × 10⁻³ | [9.9 × 10⁻⁴, 6.1 × 10⁻³] | 5.3 × 10⁻⁴ | [−1.7 × 10⁻³, 2.8 × 10⁻³] | 2.8 × 10⁻³ | [4.4 × 10⁻⁴, 5.2 × 10⁻³] |
| TOC intake2 (mg/d) | −9.6 × 10⁻⁵ | [−2.5 × 10⁻⁴, 5.5 × 10⁻⁵] | −6.7 × 10⁻⁵ | [−2.2 × 10⁻⁴, 9.0 × 10⁻⁵] | −2.4 × 10⁻⁵ | [−1.8 × 10⁻⁴, 1.3 × 10⁻⁴] | −1.7 × 10⁻⁴ | [−3.5 × 10⁻⁴, 7.8 × 10⁻⁶] |
| Use of supplements c | 1.2 × 10⁻¹ *** | [1.0 × 10⁻¹, 1.4 × 10⁻¹] | 1.2 × 10⁻¹ *** | [1.0 × 10⁻¹, 1.4 × 10⁻¹] | 1.1 × 10⁻¹ *** | [8.7 × 10⁻², 1.3 × 10⁻¹] | ||
| Use of lipid-modifying drugs | −5.4 × 10⁻² *** | [−7.8 × 10⁻², −3.0 × 10⁻²] | −5.4 × 10⁻² *** | [−7.8 × 10⁻², −2.9 × 10⁻²] | −3.1 × 10⁻² | [−5.7 × 10⁻², −3.5 × 10⁻³] | −5.6 × 10⁻² *** | [−8.3 × 10⁻², −2.9 × 10⁻²] |
| Plasma vitamin C (µmol/L) | 1.6 × 10⁻³ *** | [1.1 × 10⁻³, 2.1 × 10⁻³] | 1.5 × 10⁻³ *** | [9.0 × 10⁻⁴, 2.1 × 10⁻³] | 1.7 × 10⁻³ *** | [1.1 × 10⁻³, 2.3 × 10⁻³] | 1.8 × 10⁻³ *** | [1.2 × 10⁻³, 2.4 × 10⁻³] |
| Disease diagnosis d | 1.1 × 10⁻¹ *** | [6.9 × 10⁻², 1.6 × 10⁻¹] | 1.1 × 10⁻¹ *** | [6.8 × 10⁻², 1.6 × 10⁻¹] | 7.5 × 10⁻² * | [3.0 × 10⁻², 1.2 × 10⁻¹] | 9.2 × 10⁻² * | [3.4 × 10⁻², 1.5 × 10⁻¹] |
| I (male sex:age) | −2.4 × 10⁻³ | [−6.1 × 10⁻³, 1.4 × 10⁻³] | ||||||
| I (male sex:FM) | −3.5 × 10⁻⁴ | [−4.9 × 10⁻³, 4.2 × 10⁻³] | ||||||
| I (male sex:TOC intake) | −9.1 × 10⁻⁴ | [−4.8 × 10⁻³, 3.0 × 10⁻³] | ||||||
| I (age:TOC intake) | −1.1 × 10⁻⁴ | [−3.3 × 10⁻⁴, 1.0 × 10⁻⁴] | ||||||
| I (smoking:TOC intake) | −2.2 × 10⁻³ | [−5.9 × 10⁻³, 1.4 × 10⁻³] | ||||||
| I (male sex:plasma vitamin C) | 2.8 × 10⁻⁴ | [−8.1 × 10⁻⁴, 1.4 × 10⁻³] | ||||||
| I (age:plasma vitamin C) | −3.0 × 10⁻⁵ | [−9.8 × 10⁻⁵, 3.8 × 10⁻⁵] | ||||||
| R2, marginal/conditional | 0.148/0.710 | 0.149/0.710 | 0.110/0.701 | 0.177/0.727 | ||||
| Model 2 (n = 399) | Model 3 (n = 399) | Model 4 (n = 289) | Model 5 (n = 226) | |||||
|---|---|---|---|---|---|---|---|---|
| CE | [95% CI] | CE | [95% CI] | CE | [95% CI] | CE | [95% CI] | |
| Intercept | 1.8 × 10+0 *** | [1.8 × 10+0, 1.8 × 10+0] | 1.8 × 10+0 *** | [1.8 × 10+0, 1.8 × 10+0] | 1.8 × 10+0 *** | [1.8 × 10+0, 1.8 × 10+0] | 1.8 × 10+0 *** | [1.8 × 10+0, 1.9 × 10+0] |
| Age (years) | 9.9 × 10⁻³ *** | [8.4 × 10⁻³, 1.1 × 10⁻²] | 1.0 × 10⁻² *** | [8.3 × 10⁻³, 1.2 × 10⁻²] | 9.9 × 10⁻³ *** | [8.3 × 10⁻³, 1.1 × 10⁻²] | 1.1 × 10⁻² *** | [9.5 × 10⁻³, 1.3 × 10⁻²] |
| Age2 (years) | −1.2 × 10⁻⁴ | [−2.7 × 10⁻⁴, 3.8 × 10⁻⁵] | −1.1 × 10⁻⁴ | [−2.6 × 10⁻⁴, 5.3 × 10⁻⁵] | −1.4 × 10⁻⁴ | [−3.0 × 10⁻⁴, 2.3 × 10⁻⁵] | −1.6 × 10⁻⁴ | [−3.2 × 10⁻⁴, 9.7 × 10⁻⁶] |
| Male sex | −4.3 × 10⁻³ | [−4.9 × 10⁻², 4.1 × 10⁻²] | −3.1 × 10⁻³ | [−4.8 × 10⁻², 4.2 × 10⁻²] | 3.1 × 10⁻³ | [−4.1 × 10⁻², 4.8 × 10⁻²] | −2.2 × 10⁻² | [−7.6 × 10⁻², 3.3 × 10⁻²] |
| FM (kg) | 2.1 × 10⁻³ | [3.2 × 10⁻⁴, 3.8 × 10⁻³] | 2.5 × 10⁻³ | [4.8 × 10⁻⁴, 4.6 × 10⁻³] | 9.3 × 10⁻⁴ | [−9.1 × 10⁻⁴, 2.8 × 10⁻³] | 1.1 × 10⁻³ | [−1.1 × 10⁻³, 3.2 × 10⁻³] |
| Current/past smoking | 6.8 × 10⁻³ | [−3.3 × 10⁻², 4.7 × 10⁻²] | 8.0 × 10⁻³ | [−3.2 × 10⁻², 4.8 × 10⁻²] | −6.9 × 10⁻³ | [−4.7 × 10⁻², 3.3 × 10⁻²] | 1.0 × 10⁻² | [−3.8 × 10⁻², 5.9 × 10⁻²] |
| PAI | 1.9 × 10⁻² | [−3.9 × 10⁻², 7.7 × 10⁻²] | 1.9 × 10⁻² | [−3.9 × 10⁻², 7.8 × 10⁻²] | 4.9 × 10⁻³ | [−5.7 × 10⁻², 6.7 × 10⁻²] | 6.9 × 10⁻² | [2.5 × 10⁻³, 1.4 × 10⁻¹] |
| TOC intake (mg/d) | 2.1 × 10⁻³ | [1.1 × 10⁻⁴, 4.2 × 10⁻³] | 3.3 × 10⁻³ | [8.5 × 10⁻⁴, 5.8 × 10⁻³] | 2.0 × 10⁻⁴ | [−1.9 × 10⁻³, 2.4 × 10⁻³] | 2.3 × 10⁻³ | [−2.4 × 10⁻⁵, 4.6 × 10⁻³] |
| TOC intake2 (mg/d) | −3.7 × 10⁻⁵ | [−1.8 × 10⁻⁴, 1.1 × 10⁻⁴] | −2.5 × 10⁻⁵ | [−1.8 × 10⁻⁴, 1.3 × 10⁻⁴] | 8.8 × 10⁻⁶ | [−1.4 × 10⁻⁴, 1.6 × 10⁻⁴] | −7.7 × 10⁻⁵ | [−2.5 × 10⁻⁴, 9.6 × 10⁻⁵] |
| Use of supplements c | 1.2 × 10⁻¹ *** | [1.0 × 10⁻¹, 1.4 × 10⁻¹] | 1.2 × 10⁻¹ *** | [1.0 × 10⁻¹, 1.4 × 10⁻¹] | 1.1 × 10⁻¹ *** | [8.6 × 10⁻², 1.3 × 10⁻¹] | ||
| Use of lipid-modifying drugs | 7.5 × 10⁻² *** | [5.3 × 10⁻², 9.9 × 10⁻²] | 7.6 × 10⁻² *** | [5.3 × 10⁻², 9.9 × 10⁻²] | 9.9 × 10⁻² *** | [7.4 × 10⁻², 1.2 × 10⁻¹] | 7.8 × 10⁻² *** | [5.2 × 10⁻², 1.0 × 10⁻¹] |
| Plasma vitamin C (µmol/L) | 1.3 × 10⁻³ *** | [8.4 × 10⁻⁴, 1.8 × 10⁻³] | 1.3 × 10⁻³ *** | [7.0 × 10⁻⁴, 1.9 × 10⁻³] | 1.4 × 10⁻³ *** | [8.9 × 10⁻⁴, 2.0 × 10⁻³] | 1.6 × 10⁻³ *** | [1.0 × 10⁻³, 2.2 × 10⁻³] |
| Disease diagnosis d | 3.1 × 10⁻² | [−6.9 × 10⁻³, 6.9 × 10⁻²] | 3.0 × 10⁻² | [−7.3 × 10⁻³, 6.8 × 10⁻²] | −3.6 × 10⁻³ | [−4.1 × 10⁻², 3.4 × 10⁻²] | 2.6 × 10⁻² | [−2.1 × 10⁻², 7.3 × 10⁻²] |
| I (male sex:age) | −7.0 × 10⁻⁴ | [−3.9 × 10⁻³, 2.5 × 10⁻³] | ||||||
| I (male sex:FM) | −1.7 × 10⁻³ | [−5.7 × 10⁻³, 2.3 × 10⁻³] | ||||||
| I (male sex:TOC intake) | −1.6 × 10⁻³ | [−5.3 × 10⁻³, 2.2 × 10⁻³] | ||||||
| I (age:TOC intake) | −2.4 × 10⁻⁵ | [−2.3 × 10⁻⁴, 1.8 × 10⁻⁴] | ||||||
| I (smoking:TOC intake) | −1.7 × 10⁻³ | [−5.2 × 10⁻³, 1.8 × 10⁻³] | ||||||
| I (male sex:plasma vitamin C) | 2.1 × 10⁻⁴ | [−8.4 × 10⁻⁴, 1.3 × 10⁻³] | ||||||
| I (age:plasma vitamin C) | −1.5 × 10⁻⁵ | [−7.9 × 10⁻⁵, 4.9 × 10⁻⁵] | ||||||
| R2, marginal/conditional | 0.158/0.622 | 0.159/0.622 | 0.146/0.627 | 0.186/0.631 | ||||
© 2020 by the authors. Licensee MDPI, Basel, Switzerland. This article is an open access article distributed under the terms and conditions of the Creative Commons Attribution (CC BY) license (http://creativecommons.org/licenses/by/4.0/).
Share and Cite
Jungert, A.; Neuhäuser-Berthold, M. Interrelation between Plasma Concentrations of Vitamins C and E along the Trajectory of Ageing in Consideration of Lifestyle and Body Composition: A Longitudinal Study over Two Decades. Nutrients 2020, 12, 2944. https://doi.org/10.3390/nu12102944
Jungert A, Neuhäuser-Berthold M. Interrelation between Plasma Concentrations of Vitamins C and E along the Trajectory of Ageing in Consideration of Lifestyle and Body Composition: A Longitudinal Study over Two Decades. Nutrients. 2020; 12(10):2944. https://doi.org/10.3390/nu12102944
Chicago/Turabian StyleJungert, Alexandra, and Monika Neuhäuser-Berthold. 2020. "Interrelation between Plasma Concentrations of Vitamins C and E along the Trajectory of Ageing in Consideration of Lifestyle and Body Composition: A Longitudinal Study over Two Decades" Nutrients 12, no. 10: 2944. https://doi.org/10.3390/nu12102944