Abstract
Non-invasive anthropometric measurement methods such as those for measuring height and weight are crucial in pediatric patients. However, research focusing on the association between the type of dietary pattern and handgrip strength and handgrip-to-weight ratio in adolescents has not been carried out yet. This cross-sectional analysis of the 2014–2017 Korean National Health and Nutrition Examination Survey assessed 2327 adolescents (aged 10–18 years) who had their handgrip strength measured and analyzed its association with dietary pattern. The clusters were examined for nutritional values, and the ready-to-eat, balanced, and Western-style fast-food clusters were ultimately generated. Overall, 85.6% of the participants were assigned to a ready-to-eat dietary pattern, 9.3% to a Western-style fast-food dietary pattern, and 5.1% to a balanced dietary pattern. Compared with the participants following a balanced dietary pattern, those following a ready-to-eat dietary pattern were shown to have a significantly lower handgrip strength and handgrip-to-weight ratio. Decreased handgrip strength and handgrip-to-weight ratio values in participants following ready-to-eat dietary patterns indicate a diffuse problem in adolescents’ health and possibly imply an association between reduced muscle quality and dietary pattern. Therefore, the overall environmental factors potentially inducing such unhealthy dietary preferences should be investigated, and appropriate lifestyle changes in Korean adolescents should be encouraged.
1. Introduction
Non-invasive anthropometric measurements methods, such as those for measuring height and weight, are crucial for pediatric patients [1,2,3]. In fact, anthropometric measurements can help the decision-making process about the need for additional tests. In this context, muscle strength has recently been recognized as an essential measurement [4,5,6]. Although muscle strength is a crucial factor for muscular force exertion, several other factors are known to be involved. An individual with high muscle strength is likely to follow an appropriate diet as well as a regular physical activity schedule, in addition to being in a healthy psychological state. In fact, several studies have reported an association between sarcopenia and obesity, metabolic syndrome, non-alcoholic fatty liver disease (NAFLD), and even mental disorders [7,8,9]. Skeletal-muscle mass can be assessed by either dual-energy X-ray absorptiometry or bioelectrical impedance analysis and magnetic resonance imaging (MRI); ultrasound can be used to measure skeletal muscle quantity [10]. Furthermore, muscle strength can be accessed by plank exercise, modified pull-up, knee extension exercises, and handgrip strength. Nevertheless, measuring handgrip strength (HGS) is a simple and inexpensive way to evaluate muscle strength [11,12,13]. Furthermore, muscle quality can be estimated by dividing muscle strength by muscle mass size. However, in a simple way, we can predict relative muscle strength by dividing handgrip strength by body weight. Moreover, HGS has been shown to be associated with many diseases in children, such as metabolic syndrome and NAFLD [11].
Adequate dietary intake is essential for the health of children and adolescents. Unbalanced dietary-intake habits are known to contribute to obesity in adolescents [14,15]; additionally, they are associated with major health problems, including metabolic syndrome, mental disorders, and even cancer [16]. Moreover, chronic conditions such as adolescent obesity are likely to continue and even worsen in young adults [17]. According to several studies, balanced dietary intake is essential for both adolescents and adults, since it can affect the whole life span.
Infectious diseases, mental disorders, alcohol and/or drug abuse, nutrition deficiencies, obesity, and physical inactivity are the primary health risks for adolescents [18]. Moreover, nutritional inadequacies (e.g., undernutrition, overnutrition, picky eating) are known for being common causes of several pathologies in adolescents [19]. On the other hand, many studies have demonstrated a decrease in handgrip strength in the pediatric population [5,8,12,13]. However, the association between dietary pattern and handgrip strength and handgrip-strength-to-weight ratio in adolescents has not been thoroughly investigated yet. In this study, we investigated the association between handgrip strength and dietary intake patterns in Korean adolescents.
2. Materials and Methods
2.1. Study Population
We collected data from the 2014–2017 Korean National Health and Nutrition Examination Survey (KNHANES), a nationally representative cross-sectional survey carried out by the Korea Center for Disease Control and Prevention (KCDC) every 3–4 years. The scope of KNHANES is to assess the health status of the Korean population by using a multistage, clustered, stratified, and rolling sampling method [20]. This study was conducted in accordance with the guidelines of the Declaration of Helsinki (1964), and its protocol was approved by the Institutional Review Board (IRB) of the KCDC. Informed consent was obtained from all participants at the time of the survey. The Kyung Hee Institutional Review Board approved this study protocol (KHSIRB-20-052(EA)).
We initially collected data on a total of 2988 subjects from the 2014–2017 KNHANES database; thereafter, we excluded non-adolescent subjects (i.e., ≥19 years old or <10 years old) (n = 340), as well as subjects with extreme energy-intake levels (i.e., <500 kcal/day or >5000 kcal/day) (n = 41) and subjects without height, weight, and/or HGS data (n = 280). In total, 2327 participants were eventually included in our study (Figure 1).
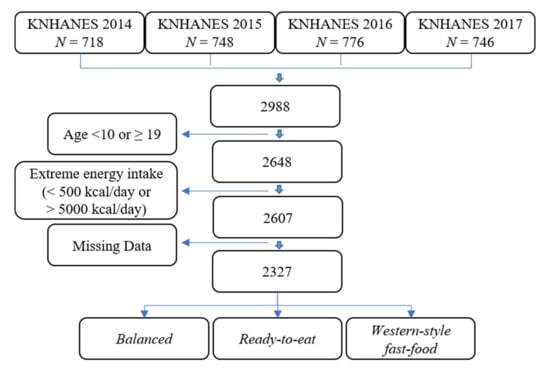
Figure 1.
Flow chart for participant selection (2327 participants). KNHANES: Korean National Health and Nutrition Examination Survey.
2.2. Assessment of Socioeconomic Data and Physical Activity
Sociodemographic data of the study participants included age, house income level, province, and physical activity level. Physical activity was defined using the metabolic equivalent task (MET) score according to the scoring protocol of the Korean Physical Activity Questionnaire short form [21]. Physical activity was categorized according to the total MET score as inactive (<600 MET-min/week), active (600–3000 MET-min/week), or health-enhancing (>3000 MET-min/week).
2.3. Anthropometric Measurements
Height (Seca 225; SECA, Hamburg, Germany), weight (GL-6000-20; CASKOREA Co., Ltd., Seoul, Korea), and waist circumference (Seca 200; SECA, Hamburg, Germany) were measured by trained medical staff using standardized techniques and calibrated equipment. Body mass index (BMI) was calculated as weight (kg) divided by height squared (m2). The 2017 Korean Children and Adolescents Growth Standard values were used for anthropometric assessment and BMI age- and sex-specific reference data [22]. Blood pressure (BP) was measured before and after a 5-min interval, and the mean value of the two measurements was implemented in our analysis.
2.4. Measurement of Handgrip Strength
HGS was measured thrice for each hand using a digital grip strength dynamometer (TKK 5401; Takei Scientific Instruments Co., Ltd., Tokyo, Japan). All participants were instructed to hold the dynamometer in an upright standing position with the arms by their sides and to squeeze the grip with full force for 3 s each time. The mean of three trials was used for data analysis. Handgrip-strength-to-weight ratio (HGSWR) was determined by the following equation: HGS/body weight (kg) × 100 [11,12,13].
2.5. Dietary Intake Assessment and Food Grouping
One week after the health interview and examination, dietary intake was assessed using the single 24-h diet recall method through home interviews by trained interviewers. Nutrient intake was calculated by using the Korean Foods and Nutrients Database of the Rural Development Administration [23,24].
Food data were categorized into 25 food groups by using the Korean Nutrient Database. Food types were divided into 18 groups (grains, potatoes, sugars, beans, nuts, vegetables, mushrooms, fruits, meats, eggs, fish, seaweeds, dairy products, oils, beverages, seasonings, processed foods, and other) in the Korean Nutrient Database to simplify the interpretation of components. Due to the high intake rate of grains and their derivatives in Korea, we further divided this food group into four subgroups based on their nutritional profiles: white rice, other grains, wheat and bread, and noodles. Additionally, kimchi—a traditional fermented-cabbage-based food—was also separated from the vegetable group, since it is a commonly consumed side dish in Korea. Ultimately, the beverages group was further divided into soda, sugar-sweetened beverages (SSBs), and non-sugar beverages, based on sugar content; in addition, alcohol was removed from the group due to the age of the participants.
2.6. Dietary Pattern Analysis
Dietary patterns were generated by a k-means cluster analysis using SAS FASTCLUS based on the gram per day (g/day) percentage of total energy contribution for each food group. This k-means procedure generates clusters by comparing the Euclidean distance between each subject. Two to five solutions were examined to assess which cluster set was more suitable for the determination of the dietary patterns. The content of the clusters was examined for its nutritional value, and a three-cluster set was eventually selected. Three types of dietary patterns were thereby identified and named according to the food groups with high consumption: the ready-to-eat dietary pattern, which contained only white rice, eggs, fish, dairy products, and processed food; the Western-style fast-food dietary pattern, which was based on wheat/bread, noodles, sugars, meat, oils, sodas (sweetened and unsweetened), and seasonings; and the balanced dietary pattern, which was based on whole grains, potatoes, beans, nuts, vegetables, mushrooms, fruits, eggs, fish, seaweed, and dairy products.
2.7. Statistical Analysis
Statistical analysis was performed using PROC SURVEY in SAS to take into account the complex sampling design and appropriate sampling weights for the national survey. The k-means procedure was used as an algorithm in the cluster analysis, as it is commonly used to classify individuals based on the extraction of patterns from a dataset of 25 food group categories.
The chi-squared test was used to compare categorical variables such as age, sex, household income, province, and physical activity. The descriptive comparisons were presented as least squares means ± standard error (SE), adjusted for age, sex, BMI, and energy intake (kcal), MET score (METs), and house income using analysis of covariance (ANCOVA). Continuous variables, such as BMI, HGS, HGSWR, BP, and nutrients, and food groups were adjusted for age and sex and tested with the Bonferroni post-hoc multiple comparison after one-way analysis of variance (ANOVA) and ANCOVA using the SURVEYREG procedures. Finally, multiple regression analysis was used to evaluate HGS as a function of the food components.
All analyses were performed using SAS version 9.4 (SAS version 9.4, SAS Institute, Inc., Cary, NC, USA). Statistical significance was defined as a p value < 0.05.
3. Results
Most of the participants were categorized into the ready-to-eat group. About 85.6% of the subjects were attributed to a ready-to-eat dietary pattern, 9.3% of the subjects to a Western-style fast-food dietary pattern, and 5.1% participants to a balanced dietary pattern.
Table 1 shows the general characteristics of the study participants as separated by dietary patterns. In the Western-style fast-food group, 51.1% of the participants were 16–18 years old, while 18.4% were 10–12 years old (p < 0.001). The Western-style fast-food group had the highest proportion of boys (68.6%, p < 0.001). With regards to anthropometric variables, adjusted BMI (20.8 ± 0.3 p < 0.001), BP (systolic: 110.8 ± 0.8 mmHg, diastolic: 68.0 ± 0.7 mmHg, p < 0.001), and adjusted BP (systolic: 109.0 ± 0.8, diastolic: 66.6 ± 0.7, p < 0.001) were the highest in the Western-style fast-food group. Gender difference in HGS was observed (boys: 30.9 ± 0.4 vs. girls: 21.9 ± 0.2, p < 0.001), with boys tending to have higher HGS values than girls (Table S1). HGS and HGSWR were higher in participants with a balanced dietary pattern than in participants with a ready-to-eat pattern group following age-, sex-, and total energy intake-based adjustments (26.6 ± 0.7 and 50.0 ± 1.0, p < 0.001).

Table 1.
General characteristics of 10–18-year-old children and adolescents according to the three dietary patterns 1.
The food and nutrient intake rates of the study participants are summarized in Table 2. Significant differences in total energy (kcal/day), protein (g/day), fat (g/day), and carbohydrate (g/day) intake according to the three dietary patterns were detected (p < 0.05).
Table 2.
Nutrients and food intake of 10–18-year-old children and adolescents according to the three dietary patterns.
More specifically, higher total energy, protein, and fat consumption rates were shown in the Western-style fast-food group. Among the food groups, higher consumption rates of white rice, wheat/bread, eggs, fish, and dairy products were shown in the ready-to-eat group (p < 0.05), whereas in the balanced group, higher consumption rates of whole grains, vegetables, fruits, seaweed, and dairy products were found (p < 0.05). By contrast, a higher intake of wheat/bread, meat, meat products, oils, and soda was reported in the Western-style fast-food (p < 0.05).
A multivariable adjusted regression analysis was performed to evaluate the associations between dietary patterns and HGS. The results are presented as adjusted coefficients and 95% confidence intervals for the ready-to-eat and Western-style fast-food patterns, which were compared with the balanced pattern (Table 3).
Table 3.
Differences in food intake of 10–18-year-old children and adolescents according to the three dietary patterns.
Compared with the balanced dietary pattern, the ready-to-eat and Western-style fast-food patterns were shown to have lower nutrient content. Notably, higher intakes of wheat/bread, meat (including its derivatives), and oils, as well as lower intakes of fruit, were shown in the ready-to-eat and Western-style fast-food patterns; in addition, these two last patterns were also shown to imply a lower intake of carbohydrates, fibers, calcium, and vitamin C than the balanced diet pattern.
Multivariate linear regression analysis was used to evaluate the association between dietary patterns and HGS and HGSWR in the 10–18-year-old children and adolescents, as presented in Table 4. Both Model 1 (i.e., adjustment for age, sex, and house income) and Model 2 (i.e., adjustment for age, sex, BMI, energy intake (kcal), METs, and house income) were inversely associated with HGS and HGSWR (p < 0.05). Compared with the balanced pattern, the ready-to-eat pattern was shown to be associated with significantly lower HGS and HGSWR. However, no significant association was found between HGS or HGSWR in the Western-style fast-food pattern compared to balanced pattern.
Table 4.
Multivariate linear regression analysis of the association between dietary patterns and HGS of 10–18-year-old children and adolescents.
4. Discussion
According to our results, there was a higher proportion of ready-to-eat dietary patterns than we expected in Korean children and adolescents, particularly ready-to-eat dietary patterns with high consumption of white rice, wheat/bread, eggs, fish, and dairy products. The ready-to-eat dietary pattern seems to have unhealthy effects on children and adolescents due to its hypocaloric and nutrient-poor content. Moreover, HGS was lower in participants from the ready-to-eat group than those from the balanced and Western-style fast-food groups. Further, following adjustment for potential confounders, HGSWR was higher in participants following a balanced or Western-style fast-food dietary pattern rather than in those following a ready-to-eat dietary pattern. In a study of in 1086 adolescents, McNaughton et al. showed that a dietary pattern rich in fruit, salad, cereals, and fish might be associated with lower diastolic BP in adolescents [25]. Moreover, recent studies showed that greater HGS is associated with longitudinal health maintenance and health improvements in adolescents [26]; in addition, Ng et al. reported that low HGS could serve as a prognostic indicator of cardiometabolic risk and could help to identify adolescents who would benefit most from lifestyle interventions to improve muscular fitness [26]. Remarkably, our results agree with those of the aforementioned studies. However, in the present study, the additional evaluation of HGSWR deepened the investigation of relative muscle strength; HGSWR seems to also be associated with the dietary intake of adolescents, especially with the ready-to-eat dietary pattern.
Furthermore, the participants following a ready-to-eat or Western-style fast-food dietary pattern showed a lower consumption of carbohydrates, fibers, calcium, and vitamin C compared to those following a balanced dietary pattern. The ready-to-eat dietary pattern implies a high intake of eggs, fish, processed products, and refined carbohydrates—such as white rice, flour, and bread—as well as a low intake of vegetables and fruits, which is rather common for foods from convenience stores or street-food stalls. By contrast, the balanced dietary pattern is crucial for adolescents, especially when active physical and emotional development is considered. Nevertheless, Korean adolescents seem to prefer simple meals such as bread, sandwiches, and cereals, and the frequency of convenient dietary patterns is increasing [27]. In addition, the data from the Korean Student Health Examination and the Korean Youth Risk Behavior Web-based Survey showed that the consumption of healthy foods such as fruits and vegetables tended to decrease, while the consumption of foods such as fast food and ramen increased [28,29]. According to the Korean Youth Risk Behavior Web-based Survey (n = 62,276), 39.3% of the Korean adolescents consumed convenient food more than once or twice a week, whereas 26.0% more consumed it more than thrice a week. High school students had a higher intake of convenient food than middle school students. Adolescents who consumed convenient food more than thrice a week had a lower intake of recommended foods such as fruits, vegetables, and milk, as well as higher intakes of fast food, snacks, and soda, than the rest of the adolescent population. However, this is not only a problem of Korean adolescents; in fact, the food consumption patterns of Indian adolescents have also been shown to imply inadequate dietary intakes, including lower consumption of vegetables and higher consumption of energy-dense snacks [30]. Cutler et al. reported increases in fast-food consumption patterns in older boys and girls [31]. In the United States, fast food is consumed by one-third of children each day and by two-thirds of children every week [32]. In summary, adolescents’ preference for ready-to-eat dietary patterns seems to be a problem worldwide [33].
The participants following a balanced dietary pattern ate a lot of whole grains, potatoes, beans, nuts, vegetables, mushrooms, fruits, eggs, fish, seaweed, and dairy products, as the name balanced suggests; notably, their HGSWR was significantly higher than that of the participants following a ready-to-eat dietary pattern. Western-style fast-food dietary patterns, which were based on wheat, bread, noodles, sugars, meats, oils, sodas, and seasonings, were not associated with decreased HGSWR compared to balanced dietary patterns in this study. This may be due to the inclusion of unique Korean eating patterns in the definition of the Western-style fast-food pattern group. Remarkably, kimchi—a traditional Korean food—was consumed in all groups; this may deviate from the traditional Western-style diet as we know it. In this study, we defined the Western-style fast-food dietary pattern as based on wheat/bread, noodles, sugar, meat, oils, sodas, and seasonings. However, other studies defined the Western-style diet as based on poultry, eggs, mayonnaise, fast foods, pizza, pies, and fried potatoes [33]. As a consequence, further studies are still necessary in order to find an association between the Western-style diet and HGSWR.
Interestingly, high BMI and low socioeconomic status are known to be associated with decreased muscle strength [34,35]. However, in this study, a reduction of HGSWR was observed in association with the ready-to-eat group rather than with the balanced group, even with adjustments for BMI and socioeconomic status. Therefore, the results of this study show that dietary patterns could independently play an essential role in relative muscle strength.
Robinson et al. showed an association between nutrition and sarcopenia and insisted that efforts to support the development of muscle strength should be started earlier in life with the optimization of diet and nutrition [36]. Moreover, unhealthy diets are well-known risk factors for several pathologies [37]. Fiber intake, fat, and physical activity have been introduced as distal risk factors in a chronic disease prevention model, and specific strategies are underway by several countries for the prevention of chronic diseases. The participants with the ready-to-eat dietary pattern had low caloric intakes and were more likely to ingest nutrient-poor content, with lower consumption of carbohydrates, fiber, calcium, and vitamin C when compared with the balanced diet. Children and adolescents need good quality food and nutrition to thrive. The results of this study suggest that when children and adolescent intake nutrient-poor and hypocaloric food, it might cause a decrease in their HGS and HGSWR. Reduction in HGS and HGSWR by participants following a ready-to-eat dietary pattern indicates that Korean adolescents are also experiencing problems due to nutritional imbalances. Further, adolescents need to learn the importance of following a balanced diet and reducing the intake of fast food or ready-to-eat foods in early life. In addition, an appropriate environment is required for the spread of balanced dietary customs. National efforts are needed to create and promote nutritional policies for reducing ready-to-eat dietary customs and the overall environment related to nutritional imbalances.
This study has several limitations. Firstly, data stemming from a single 24-h dietary recall might not be representative of the usual intake of the children and adolescents; nevertheless, this dietary recall method has been previously used and validated in various population-based nutritional studies. Secondly, this was a cross-sectional study; and a longitudinal study might instead be a better method for detecting an association between food intake and HGSWR. Finally, MRI is still the gold standard method of measuring muscle mass; however, due to the high costs associated with MRI, it is not appropriate for use in a large-scaled population-based study. Additionally, more precise data would be possible if knee extensor muscle measurements were included instead of measures of handgrip strength. Despite these limitations, this is the first study to investigate the association between HGS, HGSWR, and dietary intake in adolescents.
5. Conclusions
In this study, we compared three types of dietary intake patterns with HGS and HGSWR. The results of the study showed an association between HGS and HGSWR and the type of dietary pattern followed by children and adolescents.
HGS and HGSWR were significantly reduced in children and adolescents with ready-to-eat dietary patterns. The lower HGS and HGSWR values do not just indicate reduced muscle strength, but also imply the possible occurrence of several concurrent problems related to reduced relative muscle strength, which might be reflected by HGS and HGSWR. The overall environmental factors potentially inducing such unhealthy dietary preferences should be investigated, and appropriate lifestyle changes in Korean adolescents should be encouraged.
Supplementary Materials
The following is available online at https://www.mdpi.com/2072-6643/12/10/3048/s1: Table S1: General differences in 10–18-year-old children and adolescents according to gender and age.
Author Contributions
H.K. and H.L. were the group leaders; Y.K., H.L., and H.K. performed the conceptualization; J.K. and D.-Y.K. conducted the formal analysis; J.K., D.-Y.K., S.K., and S.P. worked with software. All authors have read and agreed to the published version of the manuscript.
Funding
This research received no external funding.
Conflicts of Interest
The authors declare no conflict of interest.
Availability of Data and Materials
Data are available at https://knhanes.cdc.go.kr/.
References
- Chiabi, A.; Tchokoteu, P.F.; Takou, V.; Fru, F.; Tchouine, F. Anthropometric measurements of children attending a vaccination clinic in Yaounde, Cameroon. Afr. Health Sci. 2008, 8, 174–179. [Google Scholar] [PubMed]
- Hardy, J.; Kuter, H.; Campbell, M.; Canoy, D. Reliability of anthropometric measurements in children with special needs. Arch. Dis Child. 2018, 103, 757–762. [Google Scholar] [CrossRef] [PubMed]
- Group, W.H.O.M.G.R.S. WHO Child Growth Standards based on length/height, weight and age. Acta Paediatr. Suppl. 2006, 450, 76–85. [Google Scholar]
- Fry, A.C.; Irwin, C.C.; Nicoll, J.X.; Ferebee, D.E. Muscular Strength and Power in 3-to 7-Year-Old Children. Pediatr. Exerc. Sc.i 2015, 27, 345–354. [Google Scholar] [CrossRef]
- Hogrel, J.Y.; Decostre, V.; Alberti, C.; Canal, A.; Ollivier, G.; Josserand, E.; Taouil, I.; Simon, D. Stature is an essential predictor of muscle strength in children. BMC Musculoskelet. Disord. 2012, 13, 176. [Google Scholar] [CrossRef]
- Sandercock, G.R.H.; Cohen, D.D. Temporal trends in muscular fitness of English 10-year-olds 1998-2014: An allometric approach. J. Sci Med. Sport 2019, 22, 201–205. [Google Scholar] [CrossRef]
- Firth, J.; Firth, J.A.; Stubbs, B.; Vancampfort, D.; Schuch, F.B.; Hallgren, M.; Veronese, N.; Yung, A.R.; Sarris, J. Association Between Muscular Strength and Cognition in People With Major Depression or Bipolar Disorder and Healthy Controls. JAMA Psychiatry 2018, 75, 740–746. [Google Scholar] [CrossRef] [PubMed]
- Ervin, R.B.; Fryar, C.D.; Wang, C.Y.; Miller, I.M.; Ogden, C.L. Strength and body weight in US children and adolescents. Pediatrics 2014, 134, e782–e789. [Google Scholar] [CrossRef]
- Peterson, M.D.; Saltarelli, W.A.; Visich, P.S.; Gordon, P.M. Strength capacity and cardiometabolic risk clustering in adolescents. Pediatrics 2014, 133, e896–e903. [Google Scholar] [CrossRef]
- Cruz-Jentoft, A.J.; Bahat, G.; Bauer, J.; Boirie, Y.; Bruyere, O.; Cederholm, T.; Cooper, C.; Landi, F.; Rolland, Y.; Sayer, A.A.; et al. Sarcopenia: Revised European consensus on definition and diagnosis. Age Ageing 2019, 48, 16–31. [Google Scholar] [CrossRef]
- Kang, Y.; Park, S.; Kim, S.; Koh, H. Handgrip Strength Among Korean Adolescents With Metabolic Syndrome in 2014-2015. J. Clin. Densitom. 2020, 23, 271–277. [Google Scholar] [CrossRef] [PubMed]
- Ramirez-Velez, R.; Pena-Ibagon, J.C.; Martinez-Torres, J.; Tordecilla-Sanders, A.; Correa-Bautista, J.E.; Lobelo, F.; Garcia-Hermoso, A. Handgrip strength cutoff for cardiometabolic risk index among Colombian children and adolescents: The FUPRECOL Study. Sci. Rep. 2017, 7, 42622. [Google Scholar] [CrossRef] [PubMed]
- Steffl, M.; Chrudimsky, J.; Tufano, J.J. Using relative handgrip strength to identify children at risk of sarcopenic obesity. PLoS ONE 2017, 12, e0177006. [Google Scholar] [CrossRef] [PubMed]
- Centers for Disease Control and Prevention. U.S. Obesity Trends. 2011. Available online: https://www.cdc.gov/obesity/data/databases.html (accessed on 4 October 2020).
- The, U.S.; Department of Health & Human Services. Physical activity. Available online: https://health.gov/our-work/physical-activity (accessed on 4 October 2020).
- Frazier, A.L.; Li, L.; Cho, E.; Willett, W.C.; Colditz, G.A. Adolescent diet and risk of breast cancer. Cancer Causes Control 2004, 15, 73–82. [Google Scholar] [CrossRef] [PubMed]
- Park, M.J.; Scott, J.T.; Adams, S.H.; Brindis, C.D.; Irwin, C.E., Jr. Adolescent and young adult health in the United States in the past decade: Little improvement and young adults remain worse off than adolescents. J. Adolesc. Health 2014, 55, 3–16. [Google Scholar] [CrossRef] [PubMed]
- Reavley, N.; Patton, G.C.; Sawyer, S.M.; Kennedy, E.; Azzopardi, P. Health and Disease in Adolescence. In Child and Adolescent Health and Development, 3rd ed.; Bundy, D.A.P., Silva, N., Horton, S., Jamison, D.T., Patton, G.C., Eds.; Washington, DC, USA, 2017. [Google Scholar]
- Birch, L.; Savage, J.S.; Ventura, A. Influences on the Development of Children’s Eating Behaviours: From Infancy to Adolescence. Can. J. Diet. Pract. Res. 2007, 68, s1–s56. [Google Scholar]
- Korea Centers for Disease Control and Prevention. Korea National Health and Nutrition Examination Survey: 2014–2017. Available online: https://knhanes.cdc.go.kr/knhanes/eng/index.do (accessed on 4 October 2020).
- Oh, J.Y.; Yang, Y.J.; Kim, B.S.; Kang, J.H. Validity and Reliability of Korean Version of International Physical Activity Questionnaire (IPAQ) Short Form. Korean J. Fam. Med. 2007, 28, 532–541. [Google Scholar]
- Kim, J.H.; Yun, S.; Hwang, S.S.; Shim, J.O.; Chae, H.W.; Lee, Y.J.; Lee, J.H.; Kim, S.C.; Lim, D.; Yang, S.W.; et al. The 2017 Korean National Growth Charts for children and adolescents: Development, improvement, and prospects. Korean J. Pediatr. 2018, 61, 135–149. [Google Scholar] [CrossRef]
- Park, S.-H.; Kim, S.-N.; Lee, S.H.; Choe, J.-S.; Choi, Y. Development of 9th Revision Korean Food Composition Table and Its Major Changes. Korean J. Community Nutr. 2018, 23, 352–365. [Google Scholar] [CrossRef]
- National Institute of Agricultural Sciences. Korean Standard Food Composition Table. The 9th Revision. Available online: http://koreanfood.rda.go.kr/eng/fctFoodSrchEng/engMain (accessed on 4 October 2020).
- McNaughton, S.A.; Ball, K.; Mishra, G.D.; Crawford, D.A. Dietary patterns of adolescents and risk of obesity and hypertension. J. Nutr. 2008, 138, 364–370. [Google Scholar] [CrossRef]
- Ng, A.K.; Hairi, N.N.; Jalaludin, M.Y.; Majid, H.A. Dietary intake, physical activity and muscle strength among adolescents: The Malaysian Health and Adolescents Longitudinal Research Team (MyHeART) study. BMJ Open 2019, 9, e026275. [Google Scholar] [CrossRef] [PubMed]
- Rural Economic Institute. Available online: http://www.krei.re.kr/foodSurvey/selectBbsNttView.do?key=807&bbsNo=450&nttNo=127802&searchCtgry=&searchCnd=all&searchKrwd=&pageIndex=1&integrDeptCode= (accessed on 4 October 2020).
- Korean Educational Development Institute. Available online: http://schoolhealth.kr/web/srs/selectPublicDataList.do?bbsTyCode=pData&shNum=22&pageIndex=1&pageUnit=10&dataType=&searchCnd=&searchWrd= (accessed on 4 October 2020).
- The 13th Korea Youth Risk Behavior Web-Based Survey. 2017. Available online: http://yhs.cdc.go.kr (accessed on 4 October 2020).
- Rathi, N.; Riddell, L.; Worsley, A. Indian adolescents’ perceptions of the home food environment. BMC Public Health 2018, 18, 169. [Google Scholar] [CrossRef] [PubMed]
- Cutler, G.J.; Flood, A.; Hannan, P.; Neumark-Sztainer, D. Major patterns of dietary intake in adolescents and their stability over time. J. Nutr. 2009, 139, 323–328. [Google Scholar] [CrossRef]
- Kliegman, R.M. Nelson Textbook of Pediatrics, 21st ed.; Elsevier: Philadelphia, MO, USA, 2019. [Google Scholar]
- Boumtje, P.I.; Huang, C.L.; Lee, J.Y.; Lin, B.H. Dietary habits, demographics, and the development of overweight and obesity among children in the United States. Food Policy 2005, 30, 115–128. [Google Scholar] [CrossRef]
- Stenholm, S.; Mehta, N.K.; Elo, I.T.; Heliovaara, M.; Koskinen, S.; Aromaa, A. Obesity and muscle strength as long-term determinants of all-cause mortality—A 33-year follow-up of the Mini-Finland Health Examination Survey. Int J. Obes. (Lond.) 2014, 38, 1126–1132. [Google Scholar] [CrossRef]
- Shahar, S.; Vanoh, D.; Mat Ludin, A.F.; Singh, D.K.A.; Hamid, T.A. Factors associated with poor socioeconomic status among Malaysian older adults: An analysis according to urban and rural settings. BMC Public Health 2019, 19, 549. [Google Scholar] [CrossRef]
- Robinson, S.; Cooper, C.; Aihie Sayer, A. Nutrition and sarcopenia: A review of the evidence and implications for preventive strategies. J. Aging Res. 2012, 2012, 510801. [Google Scholar] [CrossRef]
- Cecchini, M.; Sassi, F.; Lauer, J.A.; Lee, Y.Y.; Guajardo-Barron, V.; Chisholm, D. Tackling of unhealthy diets, physical inactivity, and obesity: Health effects and cost-effectiveness. Lancet 2010, 376, 1775–1784. [Google Scholar] [CrossRef]

© 2020 by the authors. Licensee MDPI, Basel, Switzerland. This article is an open access article distributed under the terms and conditions of the Creative Commons Attribution (CC BY) license (http://creativecommons.org/licenses/by/4.0/).