The Effect of Exercise on Nutritional Status and Body Composition in Hemodialysis: A Systematic Review

 , and
, and
Abstract
:1. Introduction
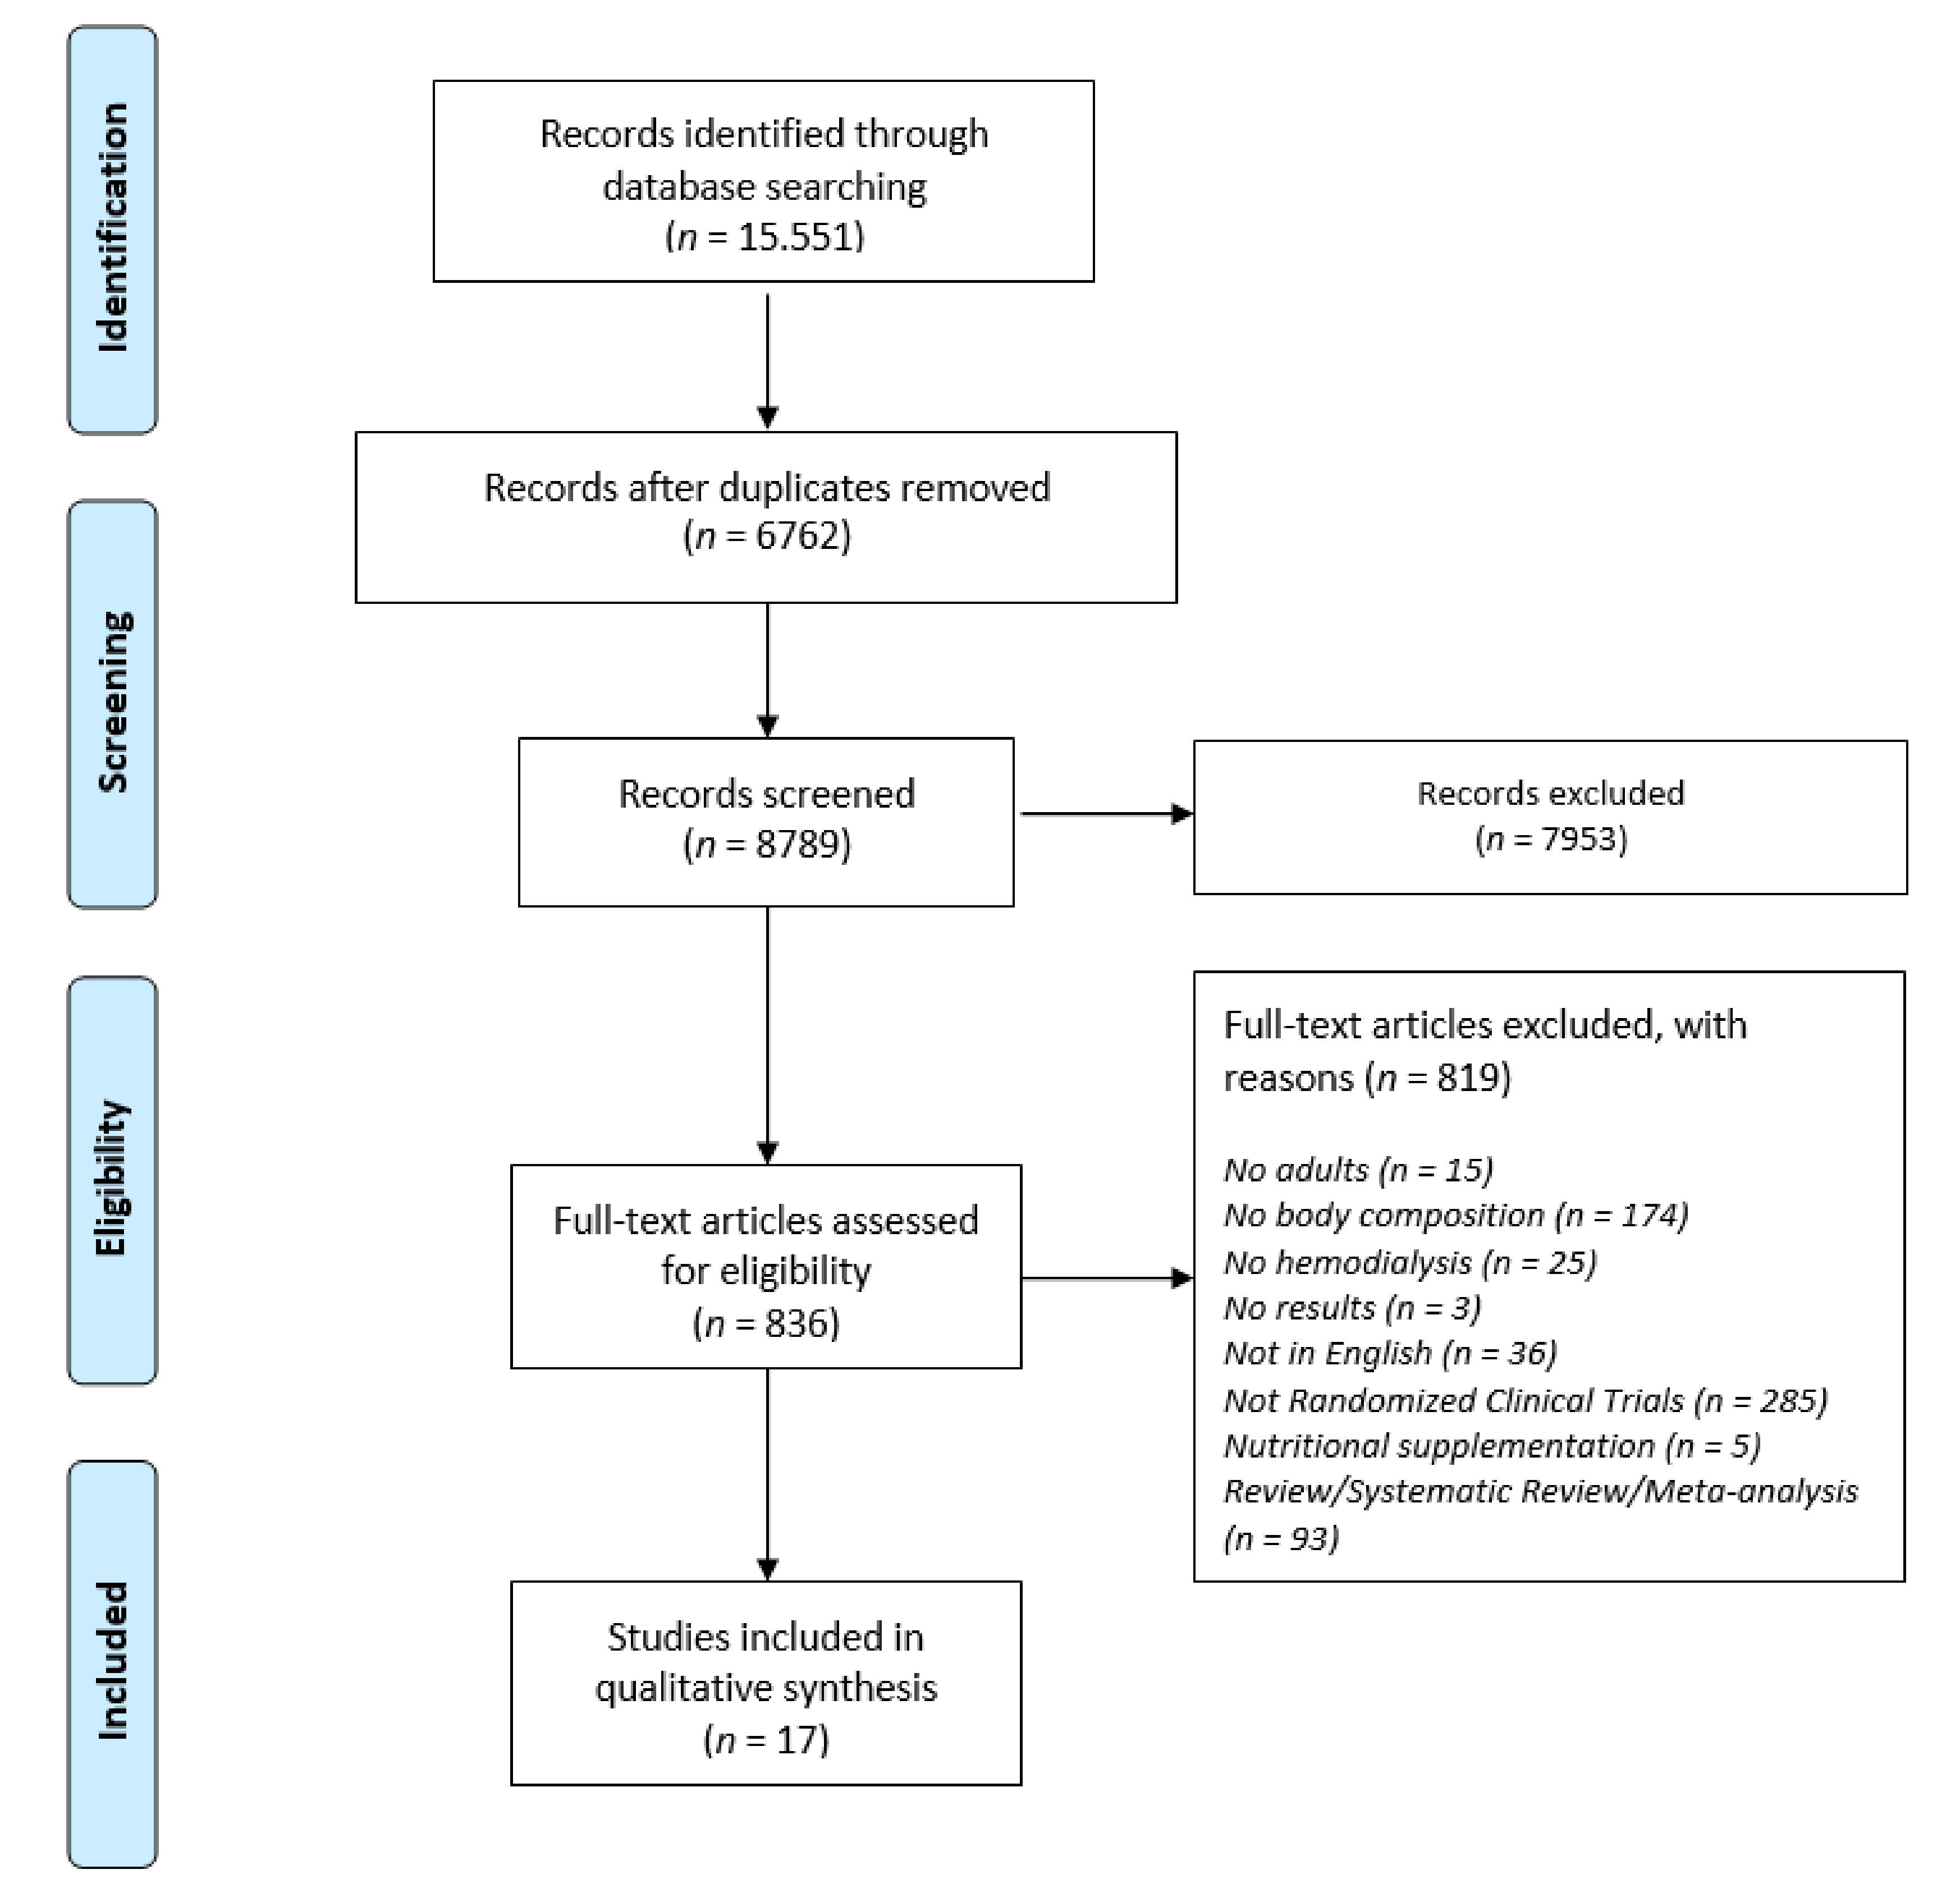
2. Materials and Methods
3. Results
3.1. Body Mass Index (BMI)
3.2. Mid-Arm, Waist, and Midthigh Circumferences
3.3. Body Fat
3.4. Skeletal Muscle Index
3.5. Strength and Functionality Evaluation
3.6. Performance Status
4. Discussion
5. Conclusions
Supplementary Materials
Author Contributions
Funding
Conflicts of Interest
Abbreviations
| BCM | Body composition monitor |
| BF | Body fat |
| BMI | Body mass index |
| CKD | Chronic kidney disease |
| CRP | C-reactive protein |
| CVD | Cardiovascular diseases |
| DEXA | Dual-energy x-ray absorptiometry |
| ESRD | End-stage renal disease |
| FM | Fat mass |
| HD | Hemodialysis |
| HrQoL | Health related quality of life |
| HGS | Hand grip strength |
| LBM | Lean body mass |
| MAMC | Mid arm muscular circumference |
| MNA | Mini-Nutritional Assessment |
| PD | Peritoneal dialysis |
| RCT | Randomized clinical trial |
| RRT | Renal replacement therapy |
| sALB | Serum Albumin |
| SD | Standard deviation |
| SMI | Skeletal muscle mass |
| QoL | Quality of life |
| WC | Waist circumference |
| 6MWT | 6 min walk test |
References
- Hill, N.R.; Fatoba, S.T.; Oke, J.L.; Hirst, J.A.; O’Callaghan, C.A.; Lasserson, D.S.; Hobbs, F.D. Global Prevalence of Chronic Kidney Disease—A Systematic Review and Meta-Analysis. PLoS ONE 2016, 11, e0158765. [Google Scholar] [CrossRef]
- Levey, A.S.; Coresh, J.; Balk, E.; Kausz, A.T.; Levin, A.; Steffes, M.W.; Hogg, R.J.; Perrone, R.D.; Lau, J.; Eknoyan, G. National Kidney Foundation practice guidelines for chronic kidney disease: Evaluation, classification, and stratification. Ann. Intern. Med. 2003, 139, 137–147. [Google Scholar] [CrossRef]
- Vaziri, N.D. Dyslipidemia of chronic renal failure: The nature, mechanisms, and potential consequences. Am. J. Physiol. Physiol. 2006, 290, F262–F272. [Google Scholar] [CrossRef]
- Tonelli, M.; Wiebe, N.; Culleton, B.; House, A.; Rabbat, C.; Fok, M.; McAlister, F.; Garg, A.X. Chronic kidney disease and mortality risk: A systematic review. J. Am. Soc. Nephrol. 2006, 17, 2034–2047. [Google Scholar] [CrossRef] [PubMed] [Green Version]
- Levin, A.; Li, Y.C. Vitamin D and its analogues: Do they protect against cardiovascular disease in patients with kidney disease? Kidney Int. 2005, 68, 1973–1981. [Google Scholar] [CrossRef] [PubMed] [Green Version]
- Siew, E.D.; Ikizler, T.A. Insulin resistance and protein energy metabolism in patients with advanced chronic kidney disease. Sem. Dial. 2010, 23, 378–382. [Google Scholar] [CrossRef] [PubMed]
- Slee, A.D. Exploring metabolic dysfunction in chronic kidney disease. Nutr. Metab. 2012, 9, 36. [Google Scholar] [CrossRef] [PubMed] [Green Version]
- Iorember, F.M. Malnutrition in Chronic Kidney Disease. Front. Pediatr. 2018, 6, 161. [Google Scholar] [CrossRef] [PubMed]
- Lim, H.-S.; Kim, H.-S.; Kim, J.K.; Park, M.; Choi, S.J. Nutritional Status and Dietary Management According to Hemodialysis Duration. Clin. Nutr. Res. 2019, 8, 28–35. [Google Scholar] [CrossRef] [Green Version]
- Laws, R.A.; Tapsell, L.C.; Kelly, J. Nutritional status and its relationship to quality of life in a sample of chronic hemodialysis patients. J. Ren. Nutr. 2000, 10, 139–147. [Google Scholar] [CrossRef]
- Cohen, S.D.; Kimmel, P.L. Nutritional status, psychological issues and survival in hemodialysis patients. Contrib. Nephrol. 2007, 155, 1–17. [Google Scholar] [CrossRef] [PubMed]
- Ikizler, T.A. Optimal nutrition in hemodialysis patients. Adv. Chronic Kidney Dis. 2013, 20, 181–189. [Google Scholar] [CrossRef] [PubMed] [Green Version]
- Omari, A.M.; Omari, L.S.; Dagash, H.H.; Sweileh, W.M.; Natour, N.; Zyoud, S.H. Assessment of nutritional status in the maintenance of haemodialysis patients: A cross-sectional study from Palestine. BMC Nephrol. 2019, 20, 92. [Google Scholar] [CrossRef] [PubMed]
- Keane, D.; Gardiner, C.; Lindley, E.; Lines, S.; Woodrow, G.; Wright, M. Changes in Body Composition in the Two Years after Initiation of Haemodialysis: A Retrospective Cohort Study. Nutrients 2016, 8. [Google Scholar] [CrossRef] [Green Version]
- Painter, P. Physical functioning in end-stage renal disease patients: Update. Hemodial. Int. 2005, 9, 218–235. [Google Scholar] [CrossRef]
- Painter, P.; Roshanravan, B. The association of physical activity and physical function with clinical outcomes in adults with chronic kidney disease. Curr. Opin. Nephrol. Hypertens. 2013, 22, 615–623. [Google Scholar] [CrossRef]
- Roshanravan, B.; Robinson-Cohen, C.; Patel, K.V.; Ayers, E.; Littman, A.J.; de Boer, I.H.; Ikizler, T.A.; Himmelfarb, J.; Katzel, L.I.; Kestenbaum, B.; et al. Association between physical performance and all-cause mortality in CKD. J. Am. Soc. Nephrol. 2013, 24, 822–830. [Google Scholar] [CrossRef] [Green Version]
- Johansen, K.L.; Chertow, G.M.; Ng, A.V.; Mulligan, K.; Carey, S.; Schoenfeld, P.Y.; Kent-Braun, J.A. Physical activity levels in patients on hemodialysis and healthy sedentary controls. Kidney Int. 2000, 57, 2564–2570. [Google Scholar] [CrossRef] [Green Version]
- Hirai, K.; Ookawara, S.; Morishita, Y. Sarcopenia and Physical Inactivity in Patients with Chronic Kidney Disease. Nephrourol. Mon. 2016, 8, e37443. [Google Scholar] [CrossRef] [Green Version]
- Moon, S.J.; Kim, T.H.; Yoon, S.Y.; Chung, J.H.; Hwang, H.J. Relationship between Stage of Chronic Kidney Disease and Sarcopenia in Korean Aged 40 Years and Older Using the Korea National Health and Nutrition Examination Surveys (KNHANES IV-2, 3, and V-1, 2), 2008–2011. PLoS ONE 2015, 10, e0130740. [Google Scholar] [CrossRef] [Green Version]
- Domanski, M.; Ciechanowski, K. Sarcopenia: A major challenge in elderly patients with end-stage renal disease. J. Aging Res. 2012, 2012, 754739. [Google Scholar] [CrossRef] [PubMed] [Green Version]
- Tabibi, H.; As’habi, A.; Najafi, I.; Hedayati, M. Prevalence of dynapenic obesity and sarcopenic obesity and their associations with cardiovascular disease risk factors in peritoneal dialysis patients. Kidney Res. Clin. Pract. 2018, 37, 404–413. [Google Scholar] [CrossRef] [PubMed] [Green Version]
- Malhotra, R.; Deger, S.M.; Salat, H.; Bian, A.; Stewart, T.G.; Booker, C.; Vincz, A.; Pouliot, B.; Ikizler, T.A. Sarcopenic Obesity Definitions by Body Composition and Mortality in the Hemodialysis Patients. J. Ren. Nutr. 2017, 27, 84–90. [Google Scholar] [CrossRef] [PubMed] [Green Version]
- Androga, L.; Sharma, D.; Amodu, A.; Abramowitz, M.K. Sarcopenia, obesity, and mortality in USA adults with and without chronic kidney disease. Kidney Int. Rep. 2017, 2, 201–211. [Google Scholar] [CrossRef] [PubMed] [Green Version]
- Kim, J.K.; Kim, S.G.; Oh, J.E.; Lee, Y.K.; Noh, J.W.; Kim, H.J.; Song, Y.R. Impact of sarcopenia on long-term mortality and cardiovascular events in patients undergoing hemodialysis. Korean J. Intern. Med. 2019, 34, 599–607. [Google Scholar] [CrossRef] [PubMed]
- Mohammadi, H.R.; Khoshnam, M.S.; Khoshnam, E. Effects of Different Modes of Exercise Training on Body Composition and Risk Factors for Cardiovascular Disease in Middle-aged Men. Int. J. Prev. Med. 2018, 9, 9. [Google Scholar] [CrossRef] [PubMed]
- Van Craenenbroeck, A.H.; Van Craenenbroeck, E.M.; Van Ackeren, K.; Hoymans, V.Y.; Verpooten, G.A.; Vrints, C.J.; Couttenye, M.M. Impaired vascular function contributes to exercise intolerance in chronic kidney disease. Nephrol. Dial. Transplant. 2016, 31, 2064–2072. [Google Scholar] [CrossRef]
- Kosmadakis, G.C.; Bevington, A.; Smith, A.C.; Clapp, E.L.; Viana, J.L.; Bishop, N.C.; Feehally, J. Physical exercise in patients with severe kidney disease. Nephron. Clin. Pract. 2010, 115, c7–c16. [Google Scholar] [CrossRef]
- Nishikawa, M.; Ishimori, N.; Takada, S.; Saito, A.; Kadoguchi, T.; Furihata, T.; Fukushima, A.; Matsushima, S.; Yokota, T.; Kinugawa, S.; et al. AST-120 ameliorates lowered exercise capacity and mitochondrial biogenesis in the skeletal muscle from mice with chronic kidney disease via reducing oxidative stress. Nephrol. Dial. Transplant. 2015, 30, 934–942. [Google Scholar] [CrossRef] [Green Version]
- K/DOQI clinical practice guidelines for cardiovascular disease in dialysis patients. Am. J. Kidney Dis. Off. J. Natl. Kidney Found. 2005, 45, S1–S153.
- Milam, R.H. Exercise Guidelines for Chronic Kidney Disease Patients. J. Ren. Nutr. 2016, 26, e23–e25. [Google Scholar] [CrossRef] [PubMed] [Green Version]
- Matsuzawa, R.; Roshanravan, B. Management of Physical Frailty in Patients Requiring Hemodialysis Therapy. Contrib. Nephrol. 2018, 196, 101–109. [Google Scholar] [CrossRef] [PubMed]
- Cheema, B.S.; Singh, M.A. Exercise training in patients receiving maintenance hemodialysis: A systematic review of clinical trials. Am. J. Nephrol. 2005, 25, 352–364. [Google Scholar] [CrossRef] [PubMed]
- Fuzari, H.K.B.; Leite, J.; Souza, H.; Rocha, T.; de Andrade, A.D.; Marinho, P. Exercise effectiveness of arteriovenous fistula maturation in chronic renal patients: A systematic review with meta-analysis. Int. J. Ther. Rehabil. 2017, 24, 98–104. [Google Scholar] [CrossRef]
- Qiu, Z.; Zheng, K.; Zhang, H.; Feng, J.; Wang, L.; Zhou, H. Physical Exercise and Patients with Chronic Renal Failure: A Meta-Analysis. BioMed Res. Int. 2017, 2017, 7191826. [Google Scholar] [CrossRef]
- Scapini, K.B.; Bohlke, M.; Moraes, O.A.; Rodrigues, C.G.; Inacio, J.F.S.; Sbruzzi, G.; Leguisamo, C.P.; Sanches, I.C.; Tourinho, H.; Irigoyen, M.C. Combined training is the most effective training modality to improve aerobic capacity and blood pressure control in people requiring haemodialysis for end-stage renal disease: Systematic review and network meta-analysis. J. Physiother. 2019, 65, 4–15. [Google Scholar] [CrossRef]
- Wyngaert, K.V.; Van Craenenbroeck, A.H.; Van Biesen, W.; Dhondt, A.; Tanghe, A.; Van Ginckel, A.; Celie, B.; Calders, P. The effects of aerobic exercise on eGFR, blood pressure and VO (2) peak in patients with chronic kidney disease stages 3-4: A systematic review and meta-analysis. PLoS ONE 2018, 13, e0203662. [Google Scholar] [CrossRef]
- Yang, H.; Wu, X.; Wang, M. Exercise Affects Cardiopulmonary Function in Patients with Chronic Kidney Disease: A Meta-Analysis. BioMed Res. Int. 2017, 2017, 6405797. [Google Scholar] [CrossRef] [Green Version]
- De Medeiros, A.I.C.; Fuzari, H.K.B.; Rattesa, C.; Brandao, D.C.; de Melo Marinho, P.E. Inspiratory muscle training improves respiratory muscle strength, functional capacity and quality of life in patients with chronic kidney disease: A systematic review. J. Physiother. 2017, 63, 76–83. [Google Scholar] [CrossRef]
- Koufaki, P.; Greenwood, S.A.; Macdougall, I.C.; Mercer, T.H. Exercise therapy in individuals with chronic kidney disease: A systematic review and synthesis of the research evidence. Annu. Rev. Nurs. Res. 2013, 31, 235–275. [Google Scholar] [CrossRef]
- Neto, M.G.; de Lacerda, F.F.R.; Lopes, A.A.; Martinez, B.P.; Saquetto, M.B. Intradialytic exercise training modalities on physical functioning and health-related quality of life in patients undergoing maintenance hemodialysis: Systematic review and meta-analysis. Clin. Rehabil. 2018, 32, 1189–1202. [Google Scholar] [CrossRef]
- Pei, G.Q.; Tang, Y.; Tan, L.; Tan, J.X.; Ge, L.; Qin, W. Aerobic exercise in adults with chronic kidney disease (CKD): A meta-analysis. Int. Urol. Nephrol. 2019, 51, 1787–1795. [Google Scholar] [CrossRef] [PubMed]
- Pu, J.; Jiang, Z.; Wu, W.; Li, L.; Zhang, L.; Li, Y.; Liu, Q.; Ou, S. Efficacy and safety of intradialytic exercise in haemodialysis patients: A systematic review and meta-analysis. BMJ Open 2019, 9, e020633. [Google Scholar] [CrossRef] [PubMed] [Green Version]
- Sheng, K.; Zhang, P.; Chen, L.; Cheng, J.; Wu, C.; Chen, J. Intradialytic exercise in hemodialysis patients: A systematic review and meta-analysis. Am. J. Nephrol. 2014, 40, 478–490. [Google Scholar] [CrossRef] [PubMed]
- Young, H.M.L.; March, D.S.; Graham-Brown, M.P.M.; Jones, A.W.; Curtis, F.; Grantham, C.S.; Churchward, D.R.; Highton, P.; Smith, A.C.; Singh, S.J.; et al. Effects of intradialytic cycling exercise on exercise capacity, quality of life, physical function and cardiovascular measures in adult haemodialysis patients: A systematic review and meta-analysis. Nephrol. Dial. Transplant. 2018, 33, 1436–1445. [Google Scholar] [CrossRef] [PubMed] [Green Version]
- Lu, Y.; Wang, Y.J.; Lu, Q. Effects of Exercise on Muscle Fitness in Dialysis Patients: A Sys tematic Review and Meta-Analysis. Am. J. Nephrol. 2019, 50, 291–302. [Google Scholar] [CrossRef] [PubMed]
- Molsted, S.; Bjorkman, A.S.D.; Lundstrom, L.H. Effects of strength training to patients undergoing dialysis: A systematic review. Dan. Med. J. 2019, 66, 9. [Google Scholar]
- Liberati, A.; Altman, D.G.; Tetzlaff, J.; Mulrow, C.; Gotzsche, P.C.; Ioannidis, J.P.; Clarke, M.; Devereaux, P.J.; Kleijnen, J.; Moher, D. The PRISMA statement for reporting systematic reviews and meta-analyses of studies that evaluate health care interventions: Explanation and elaboration. PLoS Med. 2009, 6, e1000100. [Google Scholar] [CrossRef]
- Abreu, C.C.; Cardozo, L.; Stockler-Pinto, M.B.; Esgalhado, M.; Barboza, J.E.; Frauches, R.; Mafra, D. Does resistance exercise performed during dialysis modulate Nrf2 and NF-kappa B in patients with chronic kidney disease? Life Sci. 2017, 188, 192–197. [Google Scholar] [CrossRef]
- Cheema, B.; Abas, H.; Smith, B.; O’Sullivan, A.; Chan, M.; Patwardhan, A.; Kelly, J.; Gillin, A.; Pang, G.; Lloyd, B.; et al. Progressive exercise for anabolism in kidney disease (PEAK): A randomized, controlled trial of resistance training during hemodialysis. J. Am. Soc. Nephrol. 2007, 18, 1594–1601. [Google Scholar] [CrossRef] [Green Version]
- Chen, J.L.; Godfrey, S.; Ng, T.T.; Moorthi, R.; Liangos, O.; Ruthazer, R.; Jaber, B.L.; Levey, A.S.; Castaneda-Sceppa, C. Effect of intra-dialytic, low-intensity strength training on functional capacity in adult haemodialysis patients: A randomized pilot trial. Nephrol. Dial. Transplant. 2010, 25, 1936–1943. [Google Scholar] [CrossRef] [PubMed] [Green Version]
- Cheng, Y.J.; Zhao, X.J.; Zeng, W.; Xu, M.C.; Ma, Y.C.; Wang, M. Effect of Intradialytic Exercise on Physical Performance and Cardiovascular Risk Factors in Patients Receiving Maintenance Hemodialysis: A Pilot and Feasibility Study. Blood Purif. 2019. [Google Scholar] [CrossRef]
- Cooke, A.B.; Ta, V.; Iqbal, S.; Gomez, Y.H.; Mavrakanas, T.; Barre, P.; Vasilevsky, M.; Rahme, E.; Daskalopoulou, S.S. The Impact of Intradialytic Pedaling Exercise on Arterial Stiffness: A Pilot Randomized Controlled Trial in a Hemodialysis Population. Am. J. Hypertens. 2018, 31, 458–466. [Google Scholar] [CrossRef] [PubMed]
- Frih, B.; Jaafar, H.; Mkacher, W.; Ben Salah, Z.; Hammami, M.; Frih, A. The Effect of Interdialytic Combined Resistance and Aerobic Exercise Training on Health Related Outcomes in Chronic Hemodialysis Patients: The Tunisian Randomized Controlled Study. Front. Physiol. 2017, 8, 288. [Google Scholar] [CrossRef] [PubMed]
- Groussard, C.; Rouchon-Isnard, M.; Coutard, C.; Romain, F.; Malarde, L.; Lemoine-Morel, S.; Martin, B.; Pereira, B.; Boisseau, N. Beneficial effects of an intradialytic cycling training program in patients with end-stage kidney disease. Appl. Physiol. Nutr. Metab. 2015, 40, 550–556. [Google Scholar] [CrossRef]
- Johansen, K.L.; Painter, P.L.; Sakkas, G.K.; Gordon, P.; Doyle, J.; Shubert, T. Effects of resistance exercise training and nandrolone decanoate on body composition and muscle function among patients who receive hemodialysis: A randomized, controlled trial. J. Am. Soc. Nephrol. JASN 2006, 17, 2307–2314. [Google Scholar] [CrossRef]
- Kopple, J.D.; Wang, H.; Casaburi, R.; Fournier, M.; Lewis, M.I.; Taylor, W.; Storer, T.W. Exercise in maintenance hemodialysis patients induces transcriptional changes in genes favoring anabolic muscle. J. Am. Soc. Nephrol. JASN 2007, 18, 2975–2986. [Google Scholar] [CrossRef] [Green Version]
- Liao, M.T.; Liu, W.C.; Lin, F.H.; Huang, C.F.; Chen, S.Y.; Liu, C.C.; Lin, S.H.; Lu, K.C.; Wu, C.C. Intradialytic aerobic cycling exercise alleviates inflammation and improves endothelial progenitor cell count and bone density in hemodialysis patients. Medicine 2016, 95, e4134. [Google Scholar] [CrossRef]
- Lopes, L.C.C.; Mota, J.F.; Prestes, J.; Schincaglia, R.M.; Silva, D.M.; Queiroz, N.P.; Freitas, A.; Lira, F.S.; Peixoto, M.D.G. Intradialytic Resistance Training Improves Functional Capacity and Lean Mass Gain in Individuals on Hemodialysis: A Randomized Pilot Trial. Arch. Phys. Med. Rehabil. 2019, 100, 2151–2158. [Google Scholar] [CrossRef]
- Marinho, S.M.; Mafra, D.; Pelletier, S.; Hage, V.; Teuma, C.; Laville, M.; Carraro Eduardo, J.C.; Fouque, D. In Hemodialysis Patients, Intradialytic Resistance Exercise Improves Osteoblast Function: A Pilot Study. J. Ren. Nutr. 2016, 26, 341–345. [Google Scholar] [CrossRef]
- Olvera-Soto, M.G.; Valdez-Ortiz, R.; Lopez Alvarenga, J.C.; Espinosa-Cuevas Mde, L. Effect of Resistance Exercises on the Indicators of Muscle Reserves and Handgrip Strength in Adult Patients on Hemodialysis. J. Ren. Nutr. 2016, 26, 53–60. [Google Scholar] [CrossRef]
- Rosa, C.S.D.; Nishimoto, D.Y.; Souza, G.D.E.; Ramirez, A.P.; Carletti, C.O.; Daibem, C.G.L.; Sakkas, G.K.; Monteiro, H.L. Effect of continuous progressive resistance training during hemodialysis on body composition, physical function and quality of life in end-stage renal disease patients: A randomized controlled trial. Clin. Rehabil. 2018, 32, 899–908. [Google Scholar] [CrossRef] [PubMed] [Green Version]
- Silva, V.; Belik, F.S.; Hueb, J.C.; Goncalves, R.D.; Caramori, J.C.T.; Vogt, B.P.; Barretti, P.; Bazan, S.G.Z.; De Stefano, G.; Martin, L.C.; et al. Aerobic Exercise Training and Nontraditional Cardiovascular Risk Factors in Hemodialysis Patients: Results from a Prospective Randomized Trial. Cardiorenal Med. 2019, 9, 391–399. [Google Scholar] [CrossRef]
- Song, W.J.; Sohng, K.Y. Effects of progressive resistance training on body composition, physical fitness and quality of life of patients on hemodialysis. J. Korean Acad. Nurs. 2012, 42, 947–956. [Google Scholar] [CrossRef] [Green Version]
- Suhardjono; Umami, V.; Tedjasukmana, D.; Setiati, S. The effect of intradialytic exercise twice a week on the physical capacity, inflammation, and nutritional status of dialysis patients: A randomized controlled trial. Hemodial. Int. 2019, 23, 486–493. [Google Scholar] [CrossRef] [PubMed]
- Wilund, K.R.; Tomayko, E.J.; Wu, P.T.; Ryong Chung, H.; Vallurupalli, S.; Lakshminarayanan, B.; Fernhall, B. Intradialytic exercise training reduces oxidative stress and epicardial fat: A pilot study. Nephrol. Dial. Transplant. 2010, 25, 2695–2701. [Google Scholar] [CrossRef] [Green Version]
- Enright, P.L. The six-minute walk test. Respir. Care 2003, 48, 783–785. [Google Scholar]
- Higgins, J.P.T.; Altman, D.G.; Gøtzsche, P.C.; Jüni, P.; Moher, D.; Oxman, A.D.; Savović, J.; Schulz, K.F.; Weeks, L.; Sterne, J.A.C. The Cochrane Collaboration’s tool for assessing risk of bias in randomised trials. BMJ 2011, 343, d5928. [Google Scholar] [CrossRef] [Green Version]
- Conlon, J.A.; Newton, R.U.; Tufano, J.J.; Penailillo, L.E.; Banyard, H.G.; Hopper, A.J.; Ridge, A.J.; Haff, G.G. The efficacy of periodised resistance training on neuromuscular adaptation in older adults. Eur. J. Appl. Physiol. 2017, 117, 1181–1194. [Google Scholar] [CrossRef]
- Keller, U. Nutritional Laboratory Markers in Malnutrition. J. Clin. Med. 2019, 8. [Google Scholar] [CrossRef] [Green Version]
- Cabrerizo, S.; Cuadras, D.; Gomez-Busto, F.; Artaza-Artabe, I.; Marin-Ciancas, F.; Malafarina, V. Serum albumin and health in older people: Review and meta analysis. Maturitas 2015, 81, 17–27. [Google Scholar] [CrossRef]
- Levitt, D.G.; Levitt, M.D. Human serum albumin homeostasis: A new look at the roles of synthesis, catabolism, renal and gastrointestinal excretion, and the clinical value of serum albumin measurements. Int. J. Gen. Med. 2016, 9, 229–255. [Google Scholar] [CrossRef] [PubMed] [Green Version]
- Friedman, A.N.; Fadem, S.Z. Reassessment of albumin as a nutritional marker in kidney disease. J. Am. Soc. Nephrol. 2010, 21, 223–230. [Google Scholar] [CrossRef] [PubMed] [Green Version]
- Hanafusa, N.; Nitta, K.; Okazaki, M.; Komatsu, M.; Shiohira, S.; Kawaguchi, H.; Tsuchiya, K. Serum albumin level adjusted with C-reactive protein predicts hemodialysis patient survival. Ren. Replace. Ther. 2017, 3, 9. [Google Scholar] [CrossRef] [Green Version]
- Anders, H.J.; Andersen, K.; Stecher, B. The intestinal microbiota, a leaky gut, and abnormal immunity in kidney disease. Kidney Int. 2013, 83, 1010–1016. [Google Scholar] [CrossRef] [PubMed] [Green Version]
- Girndt, M.; Sester, M.; Sester, U.; Kaul, H.; Kohler, H. Molecular aspects of T—and B-cell function in uremia. Kidney Int. Suppl. 2001, 78, S206–S211. [Google Scholar] [CrossRef] [PubMed] [Green Version]
- Castaneda, C.; Gordon, P.L.; Uhlin, K.L.; Levey, A.S.; Kehayias, J.J.; Dwyer, J.T.; Fielding, R.A.; Roubenoff, R.; Singh, M.F. Resistance training to counteract the catabolism of a low-protein diet in patients with chronic renal insufficiency. A randomized, controlled trial. Ann. Intern. Med. 2001, 135, 965–976. [Google Scholar] [CrossRef]
- Chan, D.; Cheema, B.S. Progressive Resistance Training in End-Stage Renal Disease: Systematic Review. Am. J. Nephrol. 2016, 44, 32–45. [Google Scholar] [CrossRef]
- Zhang, F.; Zhou, W.; Sun, Q.; Zhai, Y.; Zhang, Y.; Su, H.; Wang, Z. Effects of intradialytic resistance exercises on physical performance, nutrient intake and quality of life among haemodialysis people: A systematic review and meta-analysis. Nurs. Open 2019. [Google Scholar] [CrossRef] [Green Version]
- Cruz-Jentoft, A.J.; Bahat, G.; Bauer, J.; Boirie, Y.; Bruyère, O.; Cederholm, T.; Cooper, C.; Landi, F.; Rolland, Y.; Sayer, A.A.; et al. Sarcopenia: Revised European consensus on definition and diagnosis. Age Ageing 2018, 48, 16–31. [Google Scholar] [CrossRef] [Green Version]
- Kemp, G.J.; Crowe, A.V.; Anijeet, H.K.; Gong, Q.Y.; Bimson, W.E.; Frostick, S.P.; Bone, J.M.; Bell, G.M.; Roberts, J.N. Abnormal mitochondrial function and muscle wasting, but normal contractile efficiency, in haemodialysed patients studied non-invasively in vivo. Nephrol. Dial. Transplant. 2004, 19, 1520–1527. [Google Scholar] [CrossRef]
- Tamaki, M.; Miyashita, K.; Wakino, S.; Mitsuishi, M.; Hayashi, K.; Itoh, H. Chronic kidney disease reduces muscle mitochondria and exercise endurance and its exacerbation by dietary protein through inactivation of pyruvate dehydrogenase. Kidney Int. 2014, 85, 1330–1339. [Google Scholar] [CrossRef] [PubMed] [Green Version]
- Ide, T.; Tsutsui, H.; Hayashidani, S.; Kang, D.; Suematsu, N.; Nakamura, K.; Utsumi, H.; Hamasaki, N.; Takeshita, A. Mitochondrial DNA damage and dysfunction associated with oxidative stress in failing hearts after myocardial infarction. Circ. Res. 2001, 88, 529–535. [Google Scholar] [CrossRef] [PubMed] [Green Version]
- López-Armada, M.J.; Riveiro-Naveira, R.R.; Vaamonde-García, C.; Valcárcel-Ares, M.N. Mitochondrial dysfunction and the inflammatory response. Mitochondrion 2013, 13, 106–118. [Google Scholar] [CrossRef] [PubMed]
- Balakrishnan, V.S.; Rao, M.; Menon, V.; Gordon, P.L.; Pilichowska, M.; Castaneda, F.; Castaneda-Sceppa, C. Resistance training increases muscle mitochondrial biogenesis in patients with chronic kidney disease. Clin. J. Am. Soc. Nephrol. 2010, 5, 996–1002. [Google Scholar] [CrossRef] [PubMed] [Green Version]
- Ferrari, F.; Helal, L.; Dipp, T.; Soares, D.; Soldatelli, Â.; Mills, A.L.; Paz, C.; Tenório, M.C.C.; Motta, M.T.; Barcellos, F.C.; et al. Intradialytic training in patients with end-stage renal disease: A systematic review and meta-analysis of randomized clinical trials assessing the effects of five different training interventions. J. Nephrol. 2020, 33, 251–266. [Google Scholar] [CrossRef]
- Regolisti, G.; Sabatino, A.; Fiaccadori, E. Exercise in patients on chronic hemodialysis: Current evidence, knowledge gaps and future perspectives. Curr. Opin. Clin. Nutr. Metab. Care 2020, 23, 181–189. [Google Scholar] [CrossRef]


| Identity | Exercise Type | Strength Assessment Tool | Performance Status Assessment | Body Composition Assessment Tool | Participants Exercise Group | Female/Male Exercise Group | Mean Age Exercise Group (Years) | Participants Control Group | Female/Male Control Group | Mean Age Control Group (Years) |
|---|---|---|---|---|---|---|---|---|---|---|
| Abreu et al. [49] | Resistance exercise 3 times/week for 12 weeks | N/A | N/A | Circumferences and skinfold thickness | 25 | 54.5%/45.5% | 45.7 ± 15.2 | 19 | 61.5%/38.5% | 42.5 ± 13.5 |
| Cheema et al. [50] | Resistance exercise 3 times/week for 12 weeks | HGS 1 | 6MWT | Computed tomography and standard protocols by dietician | 24 | 7/17 | 60.0 ± 5.3 | 25 | 8/17 | 65.0 ± 12.9 |
| Chen et al. [51] | Resistance exercise 2 times/week for 24 weeks | ΝA | NA | DEXA | 22 | 10/12 | 71.1 ± 12.6 | 22 | 11/11 | 66.9 ± 13.4 |
| Cheng et al. [52] | Resistance exercise 3 times/week for 2 years | N/A | 6MWT | N/A | 67 | 28/39 | 54.6 ± 12.6 | 65 | 25/40 | 55.8 ± 11.98 |
| Cooke et al. [53] | Aerobic exercise 3 times/week for 16 weeks | HGS 2 | 6 m course as quickly as possible | N/A | 10 | 3/7 | 58.2 ± 17.2 | 10 | 3/7 | 52.5 ± 15.4 |
| Frih et al. [54] | Resistance training 4 times/week for 16 weeks | HGS 3 | 6MWT | N/A | 21 | 0/21 | 64.2 ± 3.4 | 20 | 0/20 | 65.2 ± 3.1 |
| Groussard et al. [55] | Aerobic exercise 3 days/weak for 3 months | NA | 6MWT | DEXA | 8 | 3/5 | 66.5 ± 4.6 | 10 | 3/7 | 68.4 ± 3.7 |
| Johan-sen et al. [56] | Resistance exercise 3 times/week for 12 weeks | HGS 4 | Walking 6 m at their usual pace and as fast as possible | DEXA | 20 | 8/12 | 54.4 ± 13.6 | 20 | 6/14 | 56.8 ± 13.8 |
| Kopple, et al. [57] * | Aerobic exercise 3 times/week for 18 weeks | N/A | N/A | DEXA | 10 | 4/6 | 45.9 ± 4.1 | 14 | 5/9 | 41.3 ± 3.3 |
| Kopple et al. [57] * | Resistance training 3 times/week for 18 weeks | N/A | N/A | DEXA | 15 | 6/9 | 46.0 ± 2.7 | 14 | 5/9 | 41.3 ± 3.3 |
| Kopple et al. [57] * | Combined exercise 3 times/week for 18 weeks | N/A | N/A | DEXA | 12 | 5/7 | 42.7 ± 3.8 | 14 | 5/9 | 41.3 ± 3.3 |
| Liao et al. [58] | Aerobic exercise 3 times/week for 12 weeks | N/A | 6MWT | DEXA | 20 | 12/8 | 62 ± 8 | 20 | 11/9 | 62 ± 9 |
| Lopes et al. [59] # | Resistance exercise (moderate load) 3 times/week for 12 weeks | HGS | N/A | DEXA | 14 | 6/8 | 48.1 ± 10.8 | 20 | 1/13 | 56.9 ± 12.4 |
| Lopes et al. [59] # | Resistance exercise (heavy load) 3 times/week for 12 weeks | HGS | N/A | DEXA | 16 | 7/9 | 56.2 ± 12.5 | 20 | 1/13 | 56.9 ± 12.4 |
| Marinho et al. [60] | Resistance exercise 3 times/week for 8 weeks | N/A | N/A | BCM | 6 | 3/3 | 71.5 (58.5–87.2) * | 7 | 4/3 | 76.0 (59.0-83.0) * |
| Olvera-Soto et al. [61] | Resistance exercise 2 times/week for 12 weeks | HGS 5 | N/A | Circumferences and skinfolds | 30 | 16/14 | 28.5 (23–46.5) * | 31 | 12/2019 | 29 (19–38) * |
| Rosa et al. [62] | Resistance exercise 3 times/weeks for 12 weeks | Wells Bench test | 6MWT | DEXA | 28 | 8/2020 | 54.5 ± 11.97 | 24 | 9/15 | 57.10 ± 16.20 |
| Silva et al. [63] | Aerobic exercise 3 times/week for 12 weeks | N/A | N/A | N/A | 14 | 7/7 | 50 ± 17.2 | 14 | 6/8 | 58 ± 15.0 |
| Song et al. [64] | Resistance exercise 3 times/week for 12 weeks | HGS 6 | N/A | InBody s107 | 20 | 12/8 | 52.1 ± 12.4 | 20 | 8/12 | 54.6 ± 10.1 |
| Suhardjonoc et al. [65] @ | Aerobic exercise 2 times/week for 12 weeks | HGS 6 | walk 4 m back and forth for an 8 m distance | BIA | 42 | 14/28 | 49.8 ± 11.7 | 39 | 21/18 | 50.5 ± 10.8 |
| Suhardjonoc et al. [65] @ | Combined exercise 2 times/week for 12 weeks | HGS 6 | walk 4 m back and forth for a total distance of 8 m | BIA | 39 | 21/18 | 50.5 ± 10.8 | 39 | 21/18 | 50.5 ±10.8 |
| Wilund et al. [66] | Aerobic exercise 3 days/week for 4 months | N/A | N/A | N/A | 7 | 4/3 | 60.8 ± 3.2 | 8 | 5/3 | 59.0 ± 4.9 |
| Identity | Exercise Group Before | Exercise Group After | Exercise Group Change | Control Group Before | Control Group After | Control Group Change | p-Value |
|---|---|---|---|---|---|---|---|
| Abreu et al. [49] | 23.9 ± 4.7 | 23.8 ± 4.5 | Not reported | 24.4 ± 4.8 | 24.1 ± 4.9 | Not reported | >0.05 |
| Cheema et al. [50] | 27.0 ± 6.0 | Not reported | 0.3 ± 0.5 | 28.0 ± 5.7 | Not reported | 0.1 ± 0.5 | 0.02 |
| Cooke et al. [53] | 25.6 ± 4.3 | Not reported | 0.28 (−0.23–0.95) | 27.2 ± 6.1 | Not reported | 0.20 (−0.03–0.45) | 0.485 |
| Groussard et al. [55] | 29.4 ± 2.1 | 29.5 ± 1.9 | Not reported | 26.5 ± 1.8 | 26.2 ± 1.9 | Not reported | >0.05 |
| Kopple et al. [57] a | 26.9 ± 1.9 | 26.6 ± 1.8 | Not reported | 24.9 ± 1.1 | 25.1 ± 1.2 | Not reported | >0.05 |
| Kopple et al. [57] b | 28.7 ± 2.5 | 27.7 ± 2.5 | Not reported | 24.9 ± 1.1 | 25.1 ± 1.2 | Not reported | >0.05 |
| Kopple et al. [57] c | 26.2 ± 1.5 | 26.0 ± 1.5 | Not reported | 24.9 ± 1.1 | 25.1 ± 1.2 | Not reported | >0.05 |
| Liao et al. [58] | 22.9 ± 3.3 | 22.96 ± 3.36 | Not reported | 23.67 ± 4.16 | 23.91 ± 5.27 | Not reported | 0.054 |
| Marinho et al. [60] | 28.5 (21.1–35.8) | 28.4 (21.8–36.2) | Not reported | 28.4 (20.8–35.2) | 28.6 (23.6–35.2) | Not reported | >0.05 |
| Rosa et al. [62] | 26.4 ± 4.48 | 26.6 ± 4.44 | Not reported | 25.54 ± 3.95 | 25.5 ± 4.03 | Not reported | 0.752 |
| Wilund et al. [66] | 30.1 ± 2.4 | 30.3 ± 2.5 | Not reported | 29.0 ± 2.0 | 28.3 ± 1.8 | Not reported | <0.05 |
| Identity | Exercise Group Before | Exercise Group After | Exercise Group Change | Control Group Before | Control Group After | Control Group Change | p-Value |
|---|---|---|---|---|---|---|---|
| Abreu et al. [49] | 32.3 ± 14.6 | 33.9 ± 14.7 | Not reported | 35.6 ± 12.4 | 34.9 ± 15.2 | Not reported | >0.05 |
| Cheema et al. [50] | 30.1 ± 4.0 | Not reported | 0.4 ± 1.4 | 30.1 ± 4.0 | Not reported | −0.6 ± 0.9 | 0.004 |
| Olvera-Soto et al. [61] | 23.4 (20.3–25.4) | 24.1 (20.3–26.5) | 2.15 (−0.25 to 4.84) * | 22.6 (19.7–25.2) | 22.5 (19.6–25.5) | 0.67 (−1.35 to 2.87) * | <0.01 |
| Song et al. [64] | 23.4 ± 1.4 | 23.5 ± 1.4 | 0.1 ± 0.7 | 23.7 ± 2.7 | 23.8 ± 2.6 | 0.0 ± 0.6 | 0.747 |
| Identity | Exercise Group Before | Exercise Group After | Exercise Group Change | Control Group Before | Control Group After | Control Group Change | p-Value |
|---|---|---|---|---|---|---|---|
| Chen et al. [51] (%) | 31.3 ± 10.4 | 29.6 ± 9.8 | Not reported | 30.8 ± 11.2 | 33.1 ± 10.1 | Not reported | 0.9 |
| Groussard et al. [55] (%) | 32.2 ± 3.1 | 32.4 ± 3.2 | Not reported | 27.2 ± 2.7 | 27.3 ± 2.8 | Not reported | >0.05 |
| Johansen et al. [56] (kg) | 22.4 ± 11.3 | 24.5 ± 11.1 | 2.2 ± 2.9 | 21.3 ± 11.9 | 21.4 ± 12.1 | 0.2 ± 1.6 | 0.05 |
| Kopple et al. [57] a (%) | 27.3 ± 3.0 | 26.8 ± 3.4 | Not reported | 24.3 ± 2.5 | 25.1 ± 2.6 | Not reported | <0.01 |
| Kopple et al. [57] b (%) | 23.5 ± 2.6 | 23.7 ± 2.6 | Not reported | 24.3 ± 2.5 | 25.1 ± 2.6 | Not reported | <0.01 |
| Kopple et al. [57] c (%) | 28.3 ± 2.6 | 27.1 ± 2.8 | Not reported | 24.3 ± 2.5 | 25.1 ± 2.6 | Not reported | <0.01 |
| Lopes et al. [59] A (kg) | 20.0 ± 2.5 | 19.9 ± 2.5 | Not reported | 24.7 ± 2.1 | 24.6 ± 2.1 | Not reported | 0.69 |
| Lopes et al. [59] B (kg) | 23.7 ± 2.3 | 23.3 ± 2.3 | Not reported | 24.7 ± 2.1 | 24.6 ± 2.1 | Not reported | 0.69 |
| Marinho et al. [60] (kg) | 47.4 (33.6–48.8) | 46.8 (35.0-48.6) | Not reported | 53.0 (42.1–54.8) | 52.1 (45.5–55.3) | Not reported | >0.05 |
| Olvera-Soto et al. [61] (%) | 16 (12.2–21.1) | 16.8 (13.1–20.3) | 5.43 (0.0 to 5.21) * | 14 (9.4–18.3) | 14.3 (11.3–18.8) | 0.42 (−13.2 to 7.97) * | 0.03 |
| Rosa et al. [62] (%) | 23.8 ± 9.21 | 23.10% ± 8.40 | Not reported | 23.15 ± 8.98 | 21.92 ±8.81 | Not reported | 0.619 |
| Song et al. [64] (%) | 27.5 ± 9.4 | 26.0 ± 8.6 | −1.5 ± 3.7 | 26.0 ± 9.3 | 27.2 ± 8.9 | 1.2 ± 3.8 | 0.020 |
| Identity | Exercise Group Before | Exercise Group After | Exercise Group Change | Control Group Before | Control Group After | Control Group Change | p-Value |
|---|---|---|---|---|---|---|---|
| Chen et al. [51] | 45.8 ± 8.9 | 47.9 ± 9.9 | Not reported | 47.8 ± 9.0 | 46.3 ± 8.7 | Not reported | 0.5 |
| Johansen et al. [56] | 47.5 ± 12.3 | 47.1 ± 11.2 | −0.3 ± 3.0 | 48.4 ± 8.2 | 48.2 ± 8.8 | −0.1 ± 1.6 | 0.66 |
| Kopple et al. [57] a | 52.1 ± 0.28 | 51.4 ± 0.27 | Not reported | 47.7 ± 0.27 | 48.4 ± 0.26 | Not reported | >0.05 |
| Kopple et al. [57] b | 47.3 ± 0.26 | 47.7 ± 0.27 | Not reported | 47.7 ± 0.27 | 48.4 ± 0.26 | Not reported | >0.05 |
| Kopple et al. [57] c | 48.0 ± 0.33 | 48.5 ± 0.32 | Not reported | 47.7 ± 0.27 | 48.4 ± 0.26 | Not reported | >0.05 |
| Lopes et al. [59] A | 39.1 ± 2.1 | 39.4 ± 2.2 | Not reported | 41.6 ± 1.8 | 41.5 ± 1.8 | Not reported | 0.60 |
| Lopes et al. [59] B | 41.6 ± 0.8 | 41.9 ± 0.8 | Not reported | 41.6 ± 1.8 | 41.5 ± 1.8 | Not reported | 0.60 |
| Marinho et al. [60] (%) | 34.7 (32.3–53.3) | 35.7 (32.8–50.3) | Not reported | 24.4 (18.9–39.0) | 27.4 (23.8–34.0) | Not reported | >0.05 |
| Rosa et al. [62] | 46.55 ± 9.03 | 47.55 ± 9.49 | Not reported | 43.48 ± 8.02 | 44.04 ± 8.23 | Not reported | 0.277 |
| Song et al. [64] (kg) * | 21.4 ± 3.6 | 22.2 ± 3.7 | 0.8 ± 1.0 | 22.8 ± 5.3 | 22.5 ± 5.2 | −0.3 ± 1.1 | 0.002 |
| Identity | Exercise Group Before | Exercise Group After | Exercise Group Change | Control Group Before | Control Group After | Control Group Change | p-Value |
|---|---|---|---|---|---|---|---|
| Lopes et al. [59] a | 6.4 ± 1.2 | 6.6 ± 1.2 | Not reported | 6.8 ± 1.03 | 6.6 ± 1.1 | Not reported | <0.01 |
| Lopes et al. [59] b | 6.7 ± 1.2 | 6.8 ± 1.1 | Not reported | 6.8 ± 1.03 | 6.6 ± 1.1 | Not reported | <0.01 |
| Suhardjono et al. [65] A | Males 10.4 ± 1.16 Females 9.77 ± 0.58 | Not reported | 0.15 (−2.11–2.89) | Males 9.92 ± 1.46 Females 9.79 ± 1.17 | Not reported | 0.01 (−6.14–7.33) | >0.05 |
| Suhardjono et al. [65] B | Males 9.92 ± 1.46 Females 9.79 ± 1.17 | Not reported | 0.04 (−0.85–4.19) | Males 9.92 ± 1.46 Females 9.79 ± 1.17 | Not reported | 0.01 (−6.14–7.33) | >0.05 |
| Identity | Parameter | Exercise Group Before | Exercise Group After | Exercise Group Change | Control Group Before | Control Group After | Control Group Change | p-Value | |
|---|---|---|---|---|---|---|---|---|---|
| Abreu et al. [49] | sALB | 4.3 ± 0.3 | 4.3 ± 0.3 | Not reported | 4.2 ± 0.2 | 4.2 ± 0.2 | Not reported | ||
| CRP | 7.7 ± 6.0 | 5.8 ± 4.4 | 8.54 ± 4.2 | 8.4 ± 7.5 | >0.05 | ||||
| Cheema et al. [50] | sALB | 3.45 ± 0.31 | Not reported | 0.03 ± 0.24 | 3.36 ± 0.79 | Not reported | 0.01 ± 0.24 | 0.45 | |
| CRP | 0.78 ± 0.60 | −0.08 ± 0.37 | 0.72 ± 0.55 | 0.24 ± 0.37 | 0.02 | ||||
| Cheng et al. [52] | sALB | 4.05 ± 0.27 | 4.09 ± 0.18 | Not reported | 3.96 ± 0.32 | 4.02 ± 0.36 | Not reported | 0.747 | |
| hs-CRP | 0.25 (0.08–0.37) | 0.15 (0.06–0.55) | 0.28 (0.16–0.43) | 0.26 (0.15–0.52) | |||||
| Frih et al. [54] | sALB | 3.96 ± 0.35 | 0.40 ± 0.26 | Not reported | 3.99 ± 0.37 | 4.04 ± 0.37 | Not reported | ||
| CRP | 4.1 ± 1.3 | 4.1 ± 1.3 | 4.1 ± 1.1 | 4.0 ± 1.4 | >0.05 | ||||
| Kopple et al. [57] a | sALB | 3.7 ± 0.1 | 3.8 ± 0.1 | Not reported | 3.9 ± 0.1 | 3.9 ± 0.1 | Not reported | >0.05 | |
| CRP | 4.5 ± 1.5 | 2.5 ± 0.6 | 2.1 ± 0.4 | 2.8 ± 0.8 | |||||
| Kopple et al. [57] b | sALB | 3.9 ± 0.1 | 3.8 ± 0.1 | Not reported | 3.9 ± 0.1 | 3.9 ± 0.1 | Not reported | ||
| CRP | 3.5 ± 0.8 | 4.2 ± 1.3 | 2.1 ± 0.4 | 2.8 ± 0.8 | >0.05 | ||||
| Kopple et al. [57] c | sALB | 3.8 ± 0.1 | 3.8 ± 0.1 | Not reported | 3.9 ± 0.1 | 3.9 ± 0.1 | Not reported | ||
| CRP | 4.6 ± 1.4 | 5.8 ± 2.1 | 2.1 ± 0.4 | 2.8 ± 0.8 | >0.05 | ||||
| Liao et al. [58] | sALB | 3.89 ± 0.33 | 4.16 ± 0.30 | Not reported | 4.00 ± 0.35 | 4.01 ± 0.42 | Not reported | ||
| Hs-CRP | 1.25 ± 2.01 | 0.78 ± 0.83 | 1.24 ± 2.04 | 1.23 ± 0.21 | <0.05 | ||||
| CRP | 0.7 ± 0.33 | 0.6 ± 0.20 | 1.2 ± 0.97 | 1.5 ± 0.89 | <0.01 | ||||
| Wilund et al. [66] | CRP | 5.2 ± 0.78 | 4.9 ± 0.69 | Not reported | 6.2 ± 0.22. | 6.0 ± 0.67 | Not reported | <0.05 | |
| sALB | 3.9 ± 0.14 | 3.9 ± 0.15 | 3.8 ± 0.09 | 3.8 ± 0.06 | |||||
| Identity | Parameter | Exercise Group Before | Exercise Group After | Exercise Group Change | Control Group Before | Control Group After | Control Group Change | p-Value |
|---|---|---|---|---|---|---|---|---|
| Cheema et al. [50] | Total strength | 98.1 ± 36.6 | Not reported | 15.2 ± 15.4 | 86.0 ± 33.8 | Not reported | −2.4 ± 13.8 | 0.002 |
| Chen et al. [51] | Knee extensors strength (kg) | 11.4 ± 5.0 | 15.8 ± 5.0 | Not reported | 14.8 ± 6.0 | 12.1 ± 6.1 | Not reported | 0.08 |
| Cooke et al. [53] | HGS | 23.2 ± 10.5 | Not reported | 1.3 (−0.5, 6.5) | 25.9 ± 13.8 | Not reported | 2.5 (−0.5, 4.0) | 0.464 |
| Frih et al. [54] | Handgrip force (N) | 29.8 ± 6.0 | 37.4 ± 4.8 | Not reported | 29.3 ± 5.6 | 30 ± 5.2 | Not reported | <0.05 |
| Johansen et al. [56] | Knee extension 3RM (lb) | 14.0 ± 8.4 | 22.6 ± 11.6 | 8.6 ± 6.9 | 19.2 ± 8.7 | 20.0 ± 9.1 | 0.8 ± 2.0 | <0.0001 |
| Hip abduction 3RM (lb) | 8.5 ± 5.2 | 15.4 ± 6.9 | 6.9 ± 5.0 | 11.8 ± 4.3 | 11.8 ± 5.9 | −0.1 ± 2.5 | <0.0001 | |
| Hip flexion 3RM (lb) | 7.6 ± 5.3 | 13.7 ± 6.8 | 6.1 ± 4.3 | 10.9 ± 4.5 | 11.4 ± 6.3 | 0.5 ± 2.7 | <0.0001 | |
| Lopes a et al. [59] a | HGS (kg) | 29.2 ± 10.2 | 32.1 ± 11.4 | Not reported | 25.3 ± 9.1 | 25.4 ± 9.9 | Not reported | 0.60 |
| Lopes a et al. [59] b | HGS (kg) | 30.0 ± 8.7 | 29.9 ± 10.1 | Not reported | 25.3 ± 9.1 | 25.4 ± 9.9 | Not reported | 0.60 |
| Olveira-Soto et al. [61] | HGS (kg) | 19.6 (11–28) | 21.2 (13–32) | Not reported | 19.8 (14-26) | 17.8 (15-26) | Not reported | <0.01 |
| Rosa et al. [62] | HGS (kg/strength) | 65.7 ± 23.3 | 66.61 ± 22.22 | Not reported | 59.21 ± 20.66 | 58.52 ± 18.19 | Not reported | 0.213 |
| Song et al. [64] | HGS (kg) | 26.3 ± 8.5 | 28.7 ± 9.0 | 2.4 ± 2.8 | 26.2 ± 10.2 | 27.8 ± 11.8 | 1.6 ± 4.0 | 0.465 |
| Leg muscle strength (kg) | 33.0 ± 15.3 | 37.3 ± 19.0 | 4.3 ± 8.7 | 34.8 ± 20.3 | 33.4 ± 19.5 | −1.4 ± 7.0 | 0.027 | |
| Suhardjono b et al. [65] A | HGS (kg) | Males: 24.8 ± 9.19 Females: 14.6 ± 4.66 | Not reported | −0.08 (−2.83–18.50) | Males: 22.1 ± 9.26 Females: 17.3 ± 8.27 | Not reported | −0.1 (2.78) | >0.05 |
| Suhardjono b et al. [65] B | HGS (kg) | Males: 21.6 ± 8.84 Females: 18.3 ± 5.45 | Not reported | 0 (−5.33–9.50) | Males: 22.1 ± 9.26 Females: 17.3 ± 8.27 | Not reported | −0.1 (2.78) | >0.05 |
| Identity | Test Used | Exercise Group Before | Exercise Group After | Exercise Group Change | Control Group Before | Control Group After | Control Group Change | p-Value |
|---|---|---|---|---|---|---|---|---|
| Cheema et al. [50] | 6MWT (m) | 496.0 ± 138.9 | Not reported | 19.6 ± 4.0 | 412.6 ± 138.9 | Not reported | 1.5 ± 23.7 | 0.16 |
| Cheng et al. [52] | 6MWT (m) | 439.1 ± 85.5 | 490.5 ± 70.3 | Not reported | 460.3 ± 79.1 | 456.7 ± 94.1 | Not reported | 0.207 |
| Cooke et al. [53] | 6 m course as quickly as possible (m/s) | 0.8 ± 0.2 | Not reported | 0.02 (−0.02, 0.11) | 0.9 ± 0.3 | Not reported | −0.11 (−0.17, 0.08) | 0.158 |
| Frih et al. [54] | 6MWT (m) | 420 ± 35.1 | 480.5 ± 31.9 | Not reported | 422.2 ± 26.6 | 415.6 ± 36.3 | Not reported | <0.05 |
| Groussard et al. [55] | 6MWT (m) | 406 ± 18 | 500 ± 30 | Not reported | 376 ± 20 | 406 ± 18 | Not reported | <0.001 |
| Johansen et al. [56] | Walking 6m at their usual pace and as fast as possible (gait speed-cm/s) | 100.9 ± 35.5 | 103.5 ± 34.2 | 2.7 ± 17.3 | 99.8 ± 31.5 | 105.7 ± 31.1 | 6.0 ± 17.2 | 0.71 |
| Rosa et al. [62] | 6MWT (m) | 506.1 ± 130.3 | 526.5 ± 126.2 | Not reported | 452.65 ± 169.19 | 469.4 ± 162.9 | Not reported | 0.277 |
| Suhardjono et al. [65] a | Walk 4 m back and forth for a total distance of 8 m (m/s) | Males: 0.86 ± 0.25 Females: 0.81 ± 0.2 | Not reported | 0.08 ± 0.16 | Males: 0.8 ± 0.25 Females: 0.81 ± 0.23 | Not reported | 0.07 ± 0.19 | >0.05 |
| Suhardjono et al. [65] b | Walk 4 m back and forth for a total distance of 8 m (m/s) | Males: 0.87 ± 0.19 Females: 0.85 ± 0.17 | Not reported | 0.10 ± 0.12 | Males: 0.8 ± 0.25 Females: 0.81 ± 0.23 | Not reported | 0.07 ± 0.19 | >0.05 |
© 2020 by the authors. Licensee MDPI, Basel, Switzerland. This article is an open access article distributed under the terms and conditions of the Creative Commons Attribution (CC BY) license (http://creativecommons.org/licenses/by/4.0/).
Share and Cite
Bakaloudi, D.R.; Siargkas, A.; Poulia, K.A.; Dounousi, E.; Chourdakis, M. The Effect of Exercise on Nutritional Status and Body Composition in Hemodialysis: A Systematic Review. Nutrients 2020, 12, 3071. https://doi.org/10.3390/nu12103071
Bakaloudi DR, Siargkas A, Poulia KA, Dounousi E, Chourdakis M. The Effect of Exercise on Nutritional Status and Body Composition in Hemodialysis: A Systematic Review. Nutrients. 2020; 12(10):3071. https://doi.org/10.3390/nu12103071
Chicago/Turabian StyleBakaloudi, Dimitra Rafailia, Antonios Siargkas, Kalliopi Anna Poulia, Evangelia Dounousi, and Michail Chourdakis. 2020. "The Effect of Exercise on Nutritional Status and Body Composition in Hemodialysis: A Systematic Review" Nutrients 12, no. 10: 3071. https://doi.org/10.3390/nu12103071