Nutritional Guideline for the Management of Mexican Patients with CKD and Hyperphosphatemia

 ,
,
Abstract
:1. Introduction
2. Materials and Methods
3. Results
4. Discussion
- Its independent of the portion size or serving.
- It focuses simultaneous attention on both proteins and phosphates, which are transcendental for the nutritional treatment of CDK.
- The ratio allows you to choose from two similar options with different amounts of phosphorus but almost equal amounts of protein [16].
- -
- To provide a complete food chart considering highly consumed products in Mexico of all food groups with an equivalent format and visual classification of the recommendation level of each food.
- -
- To stress the necessity of new labeling policies in foods that could help complete the present food table and improve dietetic management of patients,
- -
- To highlight the importance of phosphorus hidden in additives and medications often used in CKD, which contribute to the phosphorus load of the patients, and
- -
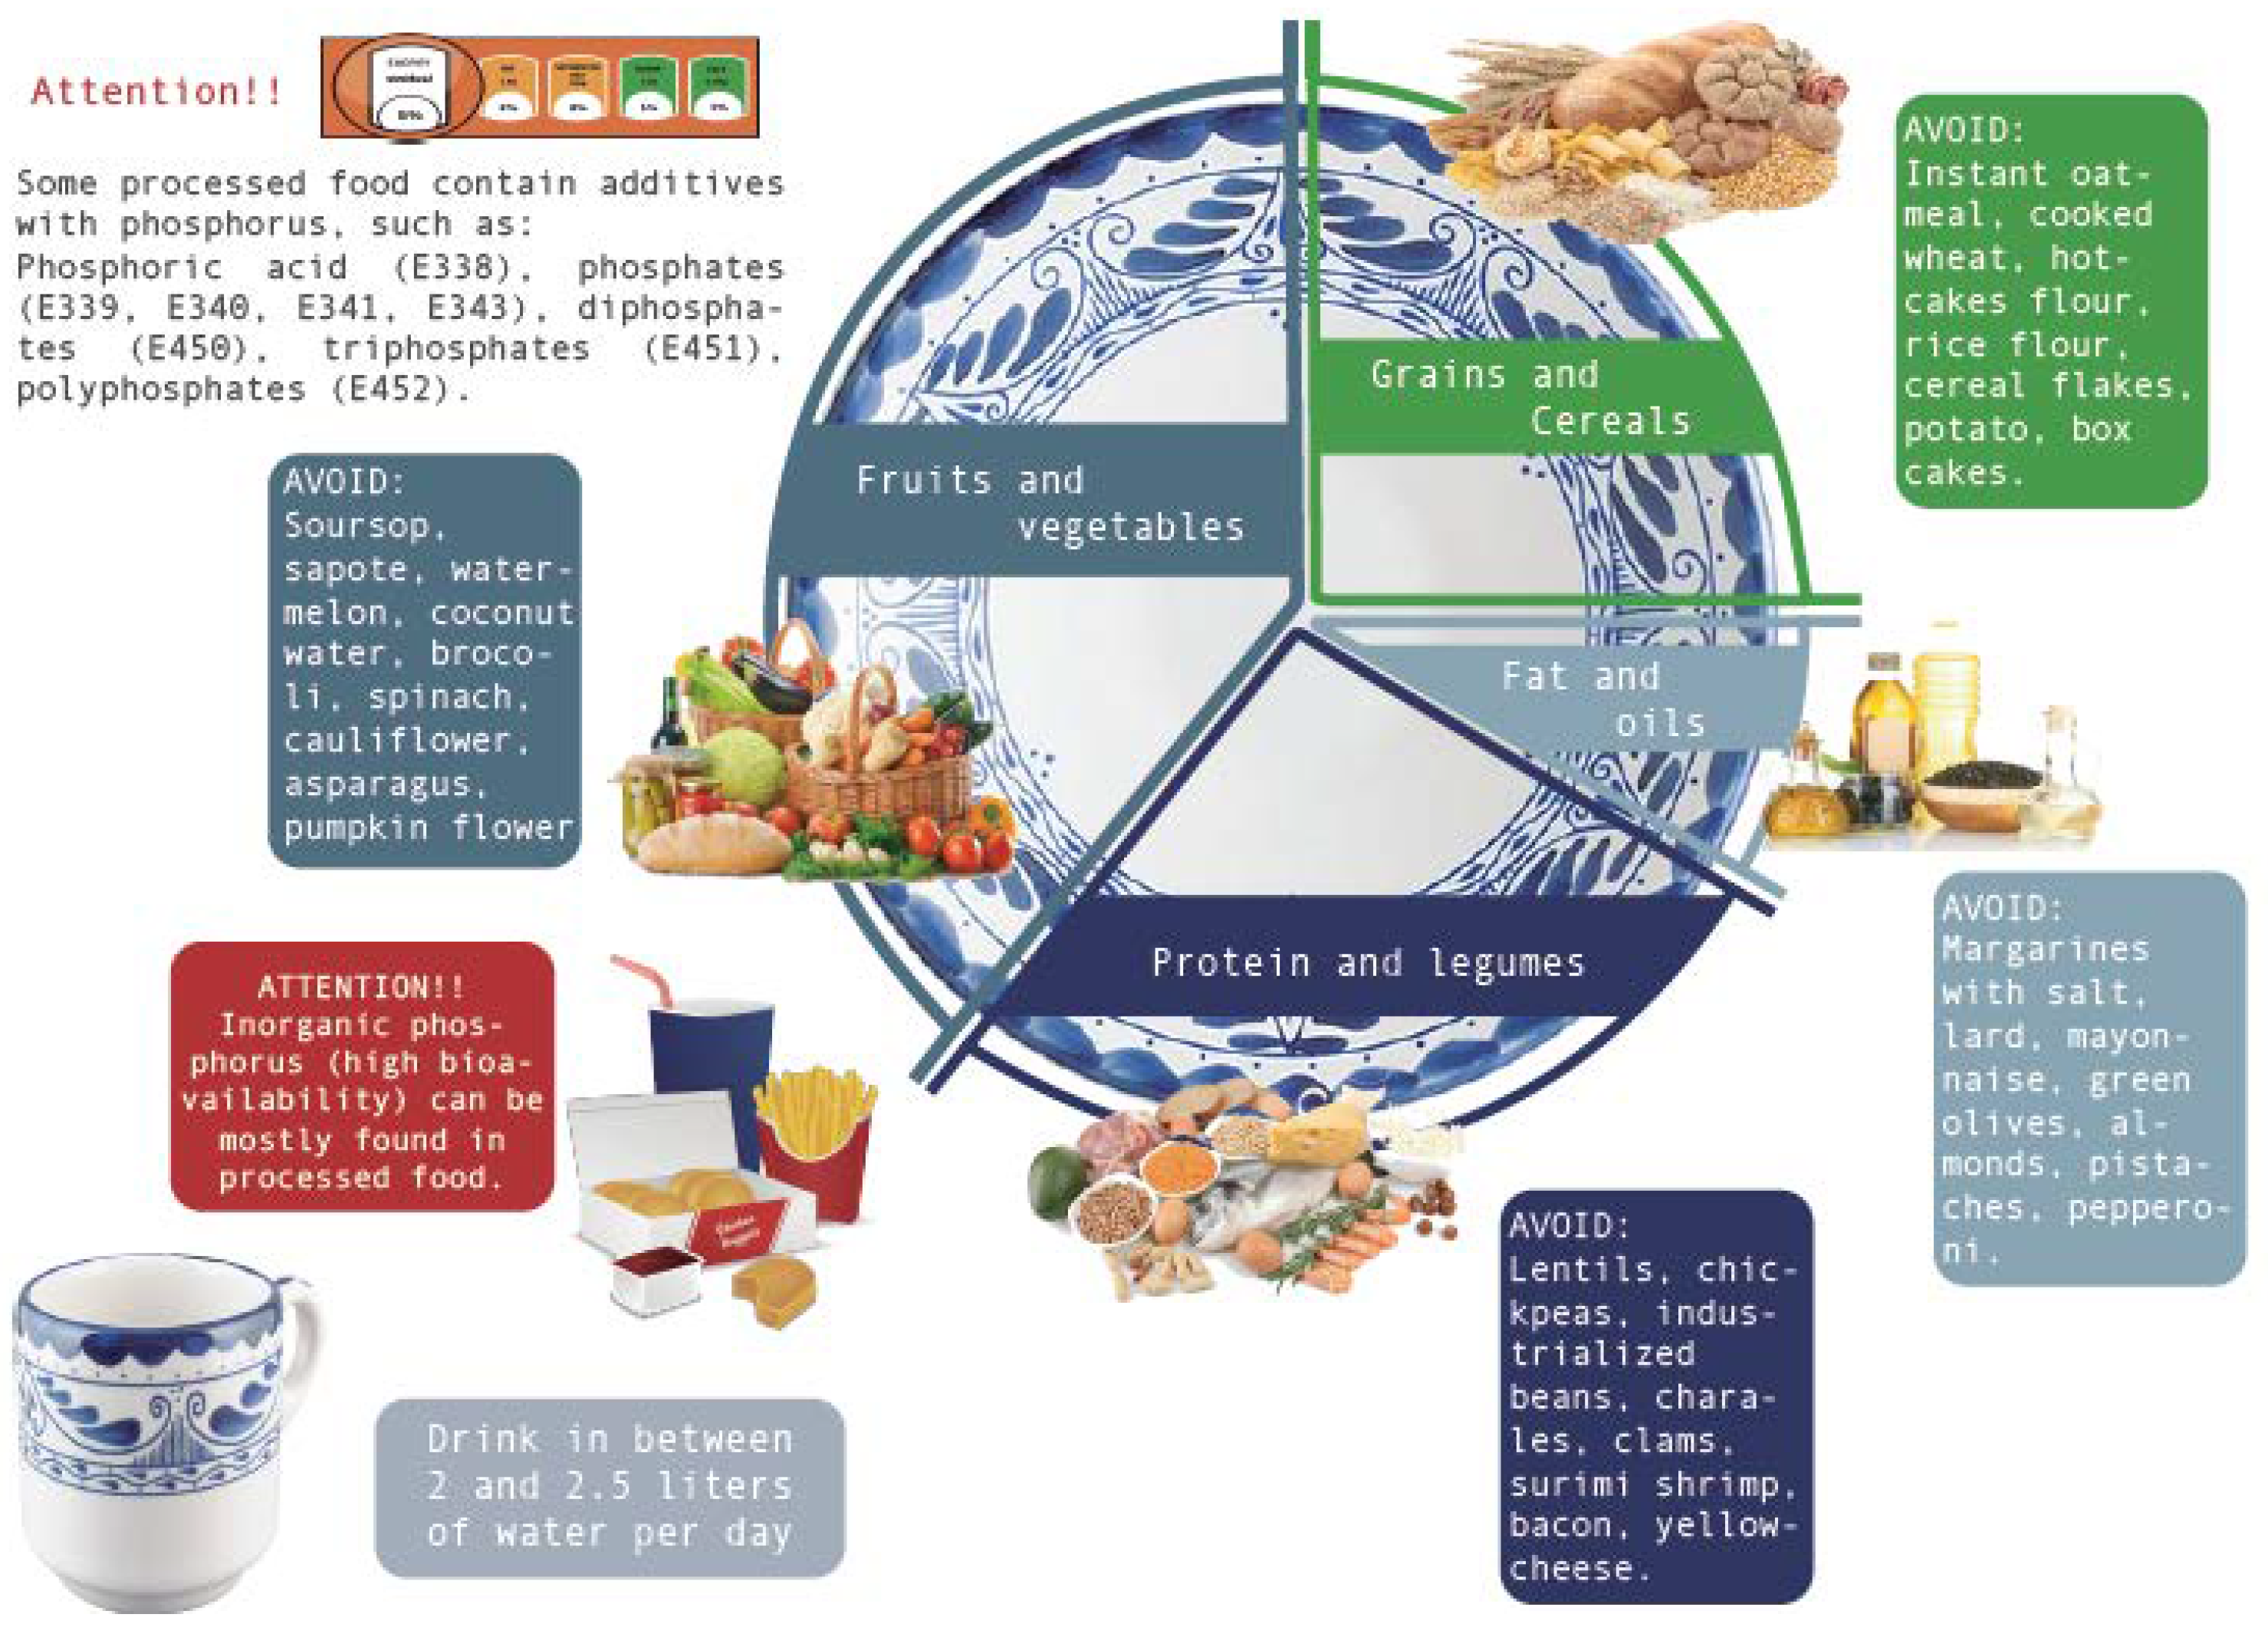
- To use the image of our “Low Phosphate Plate” to spread the nutritional recommendations among our targeted patients throughout the country.
Author Contributions
Funding
Acknowledgments
Conflicts of Interest
References
- Tamayo y Orozco, J.A.; Lastiri Quiroz, H.S. La enfermedad Renal Crónica en México; Intersistemas Editores: Mexico City, Mexico, 2016. [Google Scholar]
- Kazancioğlu, R. Risk factors for chronic kidney disease: An update. Kidney Int. Suppl. 2013, 3, 368–371. [Google Scholar] [CrossRef] [PubMed] [Green Version]
- ENSANUT. Encuesta Nacional de Salud y Nutrición 2018; INEGI, Secretaria de Salud; Instituto Nacional de Salud Pública: Cuernavaca, Mexico, 2018. [Google Scholar]
- Flores, J.C.; Alvo, M.; Borja, H.; Morales, J.; Vega, J.; Zúñiga, C. Enfermedad renal crónica: Clasificación, identificación, manejo y complicaciones. Rev. Méd. Chile 2009, 137, 137–177. [Google Scholar] [CrossRef] [PubMed] [Green Version]
- Askar, A.M. The hidden killer in chronic kidney disease. Saudi Med. J. 2015, 36, 13–19. [Google Scholar] [CrossRef] [PubMed]
- Goyal, R.; Jialal, I. Hyperphosphatemia; StatPearls: Treasure Island, FL, USA, 2020; p. 1. [Google Scholar]
- Vervloet, M.G.; Sezer, S.; Massy, Z.A.; Johansson, L.; Cozzolino, M.; Fouque, D. The role of phosphate in kidney disease. Nat. Rev. 2017, 13, 27–38. [Google Scholar] [CrossRef] [PubMed]
- Kendrick, J.; Kestenbaum, B.; Chonchol, M. Phosphate and cardiovascular disease. Adv. Chronic Kidney Dis. 2011, 18, 113–119. [Google Scholar] [CrossRef] [PubMed] [Green Version]
- Waziri, B.; Duarte, R.; Naicker, S. Chronic Kidney Disease-Mineral and Bone Disorder (CKD-MBD): Current perspectives. Int. J. Nephrol. Renov. Dis. 2019, 12, 263–276. [Google Scholar] [CrossRef] [PubMed] [Green Version]
- Barril-Cuadrado, G.; Puchulu, M.B.; Sánchez-Tomero, J.A. Tablas de ratio fósforo/proteína de alimentos para población española. Utilidad en la enfermedad renal crónica. Rev. Nefrol. 2013, 33, 362–371. [Google Scholar]
- Ospina, C.A.G.; Holguín, M.C.; Escobar, D.C.; Valencia, C.A.R. Importancia de la hiperfosfatemia en la enfermedad renal crónica, cómo evitarla y tratarla por medidas nutricionales. Rev. Colomb. Nefrol. 2017, 4, 38–56. [Google Scholar] [CrossRef] [Green Version]
- Puchulu, M.B.; Giménez, M.; Ganduglia, M.; Amore-Pérez, M.; Texido, L.; Viollaz, R. Tablas de la Relación Fósforo/Proteína de los alimentos y su relación en la Enfermedad Renal Crónica. Dieta 2014, 7–23. [Google Scholar] [CrossRef]
- Osuna Padilla, I.A.; Leal Escobar, G.; Garza García, C.A. Manejo nutricional de la hiperfosfatemia en la enfermedad renal crónica. Nutr. Clínica Dietética Hosp. 2017, 37, 140–148. [Google Scholar]
- Puchulu, M.B.; Ogonowski, N.; Sanchez-Meza, F.; Cuevas, M.L.; Miranda-Alatriste, P. Dietary phosphorus to protein ratio for the mexican population with chronic kidney disease. J. Am. Coll. Nutr. 2018, 38, 1–12. [Google Scholar] [CrossRef] [PubMed]
- Kalantar-Zadeh, K. Patient education for phosphorus management in chronic kidney disease. Patient Prefer. Adherence 2013, 7, 379–390. [Google Scholar] [CrossRef] [PubMed] [Green Version]
- Noori, N.; Sims, J.; Kopple, J.; Shah, A.; Colman, S.; Shinaberger, C.; Bross, R.; Mehrotra, R.; Kovesdy, C.; Kalantar-Zadeh, K. Organic and inorganic dietary phosphorus and its management in chronic kidney disease. Iran. J. Kidney Dis. 2010, 4, 89–99. [Google Scholar] [PubMed]
- Ledesma Solano, J.A.; Chávez Villasana, A.; Pérez-Gil Romo, F.; Mendoza Martínez, E.; Calvo Carrillo, C. Composición de alimentos Miriam Muñoz de Chávez. Valor nutritivo de los alimentos de mayor consumo, 2nd ed.; McGraw-Hill: México DF, Mexico, 2010; ISBN 9789701067413. [Google Scholar]
- Northwestern Memorial Hospital. Phosphorus Content of Foods. Patient Education. Diet and Nutrition; NMH Department of Clinical Nutrition: Chicago, IL, USA, 2018. [Google Scholar]
- TodoAlimentos.org. Available online: http://www.todoalimentos.org/.
- Fatsecret.com. Available online: https://www.fatsecret.com.mx.
- Pérez Lizaur, A.B.; Palacios González, B. Sistema Mexicano de Alimentos Equivalentes, 4th ed.; Fomento de nutrición y salud. A.C.: México DF, Mexico, 2014; ISBN 9786070079283. [Google Scholar]
- Pérez Lizaur, A.B.; Palacios Gonzélez, B. Sistema Mexicano de Alimentos Equivalentes para Pacientes Renales, 1st ed.; Fomento de nutrición y salud. A.C.: México DF, Mexico, 2019; ISBN 9786070014246. [Google Scholar]
- Taketani, Y.; Koiwa, F.; Yokoyama, K. Management of phosphorus load in CDK patients. Jpn. Soc. Nephrol. 2017, 21 (Suppl. S1), 27–36. [Google Scholar]
- Taketani, Y.; Masuda, M.; Yamanaka-Okumura, H.; Tatsumi, S.; Segawa, H.; Miyamoto, K.; Takeda, E.; Yamamoto, H. Niacin and chronic kidney disease. J. Nutr. Sci. Vitaminol. 2015, 61, S173–S175. [Google Scholar] [CrossRef] [PubMed]
- Markiewicz, L.H.; Honke, J.; Haros, M.; Świątecka, D.; Wróblewska, B. Diet shapes the ability of human intestinal microbiota to degrade phytate--in vitro studies. J. Appl. Microbiol. 2013, 115, 247–259. [Google Scholar] [CrossRef] [PubMed] [Green Version]
- Martins, C.T.B.; Biavo, B.M.M.; Uezima, C.B.B.; Dos Santos, J.A.P.; De Barros, C.M.; Júnior, E.R.; Troconis, P.C.; Scavone, C.; Luiz, M.V.D.S.J. EPIC Trial: Education programme impact on serum phosphorous control in CKD 5D patients on hemodialysis. J. Bras. Nefrol. 2017, 39, 398–405. [Google Scholar] [CrossRef] [PubMed]
- Vervloet, M.; van Ballegooijen, A. Prevention and treatment of hyperphosphatemia in chronic kidney disease. Kidney Int. 2018, 93, 1060–1072. [Google Scholar] [CrossRef] [PubMed]

| Food | Portion | Protein (g) | Phosphorus (mg) | Phosphorus/Protein Ratio | Level of Recommendation | Potassium (mg) | Sodium (mg) | |
| Cactus Fruit | 2 pieces (138 g) | 1 | 4.3 | 4.3 | 302.5 | 0.1 | ||
| Grapefruit | 1 piece (25 g) | 0.9 | 5.3 | 5.8 | 225.7 | 0 | ||
| Cherry | 20 pieces (88 g) | 0.9 | 8.8 | 9.8 | 197.6 | 0 | ||
| Chopped pineapple | 3/4 cup (124 g) | 0.7 | 8.7 | 12.4 | 139.7 | 1.2 | ||
| Pineapple syrup | 1 slice (50 g) | 0.2 | 2.5 | 12.5 | 51.3 | 0.5 | ||
| Tangerine | 2 pieces (128 g) | 1 | 12.8 | 12.8 | 227.5 | 1.3 | ||
| Papaya | 1 cup (140 g) | 0.8 | 11.2 | 14 | 359.8 | 4.2 | ||
| Carabao mango | 1 piece (145 g) | 1.2 | 17.4 | 14.5 | 273.9 | 10.2 | ||
| Dry date | 2 pieces (17 g) | 0.3 | 4.9 | 16.4 | 108.2 | 0.5 | ||
| Fig | 2 pieces (72 g) | 0.6 | 10.1 | 16.8 | 167 | 0.7 | ||
| Mamey Sapote | 1/3 piece (85 g) | 1.4 | 23.8 | 17 | 191.5 | - | ||
| Orange | 2 pieces (152 g) | 1.4 | 25.8 | 18.5 | 276 | 1.5 | ||
| Grape | 18 pieces (86 g) | 0.6 | 11.2 | 18.6 | 158.5 | 1.7 | ||
| Apple porridge | 3/4 bottle (85 g) | 0.3 | 6 | 20 | 42.3 | 2.5 | ||
| Natural orange juice | 1/2 cup (120 g) | 0.8 | 18 | 22.5 | 240 | 1.2 | ||
| Ataulfo mango | 1/2 piece (62 g) | 0.3 | 6.8 | 22.7 | 96.3 | 0 | ||
| Apple | 1 piece (106 g) | 0.3 | 7.4 | 24.7 | 122.4 | 0 | ||
| Sapodilla sapota | 1/2 piece (75 g) | 0.3 | 7.5 | 25 | 144.3 | 9 | ||
| Lime | 3 pieces (147 g) | 1 | 26.5 | 26.5 | 203 | 2.9 | ||
| Strawberries | 17 pieces (204 g) | 1.4 | 38.8 | 27.7 | 312 | 2 | ||
| Blackberry | 3/4 cup (108 g) | 0.8 | 22.7 | 28.4 | 211.7 | 0 | ||
| Pear | 1/2 piece (81 g) | 0.3 | 8.9 | 29.7 | 101.2 | 0 | ||
| Guava | 3 pieces (124 g) | 1 | 31 | 31 | 352.7 | 3.7 | ||
| Black sapote | 1/2 piece (93 g) | 0.7 | 24.2 | 34.5 | 43.7 | 0 | ||
| Kiwi | 1 1/2 piece (114 g) | 1.2 | 45.6 | 38 | 376.4 | 5.7 | ||
| Cantaloupe | 1/3 piece (179 g) | 1.5 | 57.3 | 38.2 | 553.4 | 16.1 | ||
| Plantain | 1/4 piece (49 g) | 0.5 | 21.6 | 43.1 | 195.6 | 7.8 | ||
| Soursop | 1 piece (238 g) | 1 | 57.1 | 57.1 | 109 | 0 | ||
| Coconut water | 1 1/2 cup (360 g) | 1.1 | 244.8 | 222.5 | 529.2 | 90 | ||
| Chopped watermelon | 1 cup (160 g) | 1 | 452.8 | 452.8 | 186 | 3.2 | ||
| Creole mango | 1 1/2 piece (162 g) | 1.3 | 12.9 | 9.9 | 306.2 | 8.1 | ||
| Chopped pineapple | 3/4 cup (124 g) | 0.7 | 8.7 | 12.4 | 139.7 | 1.2 | ||
| Tangerine | 2 pieces (128 g) | 1 | 12.8 | 12.8 | 227.5 | 1.3 | ||
| Yellow peach | 2 pieces (153 g) | 1.4 | 18.3 | 13.1 | 301 | 0 | ||
| Bitter orange | 2 pieces (152 g) | 1.9 | 25.8 | 13.6 | 252 | 0 | ||
| Chopped papaya | 1 cup (140 g) | 0.8 | 11.2 | 14 | 359.8 | 4.2 | ||
| Grape | 18 pieces (86 g) | 0.6 | 11.2 | 18.6 | 158.5 | 1.7 | ||
| Apple | 1 piece (106 g) | 0.3 | 7.4 | 24.7 | 122.4 | 0 | ||
| Whole strawberries | 17 pieces (204 g) | 1.4 | 38.7 | 27.6 | 312.1 | 2 | ||
| Pear | 1/2 piece (81 g) | 0.3 | 8.9 | 29.7 | 101.2 | 0 | ||
| Guava | 3 pieces (124 g) | 1 | 31 | 31 | 352.7 | 3.7 | ||
| Grapefruit | 1 piece (162 g) | 0.9 | 34 | 37.8 | 225.7 | 0 | ||
| Valencian melon | 1/3 piece (179 g) | 1.5 | 57.3 | 38.2 | 553.4 | 16.1 | ||
| Chopped watermelon | 1 cup (160 g) | 1 | 452.8 | 452.8 | 186 | 3.2 | ||
| Vegetables | ||||||||
| Food | Portion | Protein (g) | Phosphorus (mg) | Phosphorus/Protein Ratio | Level of Recommendation | Potassium (mg) | Sodium (mg) | |
| Huauzontle | 1/2 cup (40 g) | 1.8 | 3.4 | 1.9 | 186.4 | 0 | ||
| Cooked chopped eggplant | 3/4 cup (24 g) | 0.6 | 3.6 | 6 | 184.1 | 0.2 | ||
| Poblano pepper | 2/3 piece (43 g) | 1.1 | 9.5 | 8.6 | 145.1 | 2.1 | ||
| Chopped jicama | 1/2 cup (60 g) | 0.4 | 3.6 | 9 | 90 | 3.6 | ||
| Raw beet | 1/4 piece (39 g) | 0.8 | 7.4 | 9.3 | 131 | 22.2 | ||
| Raw papaloquelite | 2 cups (108 g) | 1.9 | 18.3 | 9.6 | 659.9 | - | ||
| Cherry tomatoes | 75 g | 2.3 | 24 | 10.4 | 131.6 | 9.7 | ||
| Cooked nopal | 1 cup (149 g) | 2 | 23.8 | 11.9 | 291 | 29.8 | ||
| Tomato | 120 g (113 g) | 1 | 12.4 | 12.4 | 267.3 | 6.7 | ||
| Cooked chopped chard | 1/2 cup (72 g) | 1.9 | 23.7 | 12.5 | 654.5 | 128.8 | ||
| Raw watercress | 1 piece (28 g) | 0.8 | 11.2 | 14 | 112 | 3.6 | ||
| Cooked cauliflower | 3/4 cup (94 g) | 1.7 | 30 | 17.6 | 133.1 | 14.1 | ||
| Cooked spinach | 1/2 cup (90 g) | 2.7 | 50.4 | 18.7 | 419 | 63 | ||
| Raw asparagus | 6 pieces (90 g) | 2.3 | 46.8 | 20.3 | 144 | 1.8 | ||
| Cooked brussels sprout | 3 pieces (63 g) | 1.6 | 35.2 | 22 | 199.5 | 13.2 | ||
| Raw chopped coriander | 1 3/4 cup (105 g) | 2.2 | 57.7 | 26.2 | 547.1 | 21 | ||
| Cooked medium artichoke | 1 piece (48 g) | 1.4 | 36.9 | 26.4 | 137.3 | 38.4 | ||
| Cooked onion | 1/4 cup (53 g) | 0.7 | 18.5 | 26.4 | 87 | 1.6 | ||
| Cooked broccoli | 1/2 cup (92 g) | 2.7 | 75.4 | 27.9 | 268.9 | 51.5 | ||
| Lettuce | 3 cups (135 g) | 1.7 | 52.6 | 30.9 | 334.4 | 12.1 | ||
| Cooked pumpkin flower | 1 cup (134 g) | 1.4 | 45.5 | 32.5 | 142 | 8 | ||
| Raw celery | 1 1/2 cup (135 g) | 0.9 | 35.1 | 39 | 350.6 | 118.8 | ||
| Carrot juice | 1/4 cup (59 g) | 0.6 | 24.7 | 41.2 | 172.2 | 17.1 | ||
| Cooked Cushaw pumpkin | 1/2 cup (110 g) | 0.8 | 33 | 41.3 | 253 | 1.1 | ||
| Chopped cooked chayote | 1/2 cup (80 g) | 0.5 | 23.2 | 46.4 | 138.4 | 189.6 | ||
| Sliced cucumber | 1 1/4 cup (130 g) | 0.8 | 67.6 | 84.5 | 191.1 | 2.6 | ||
| Raw cheese | 80 g (66 g) | 3.1 | 291.7 | 94.1 | 400.8 | 13.2 | ||
| Chopped raw spinach | 2 cups (120 g) | 3.4 | 562.8 | 165.5 | 669.9 | 156 | ||
| Xoconostle | 3 pieces (71 g) | 0.1 | 29.1 | 291 | 155.7 | - | ||
| Most Consumed Vegetables in the Mexican Population | ||||||||
| Food | Portion | Protein (g) | Phosphorus (mg) | Phosphorus/Protein Ratio | Level of Recommendation | Potassium (mg) | Sodium (mg) | |
| Poblano pepper | 2/3 piece (43 g) | 1.1 | 9.5 | 8.6 | 145.1 | 2.1 | ||
| Cooked nopal | 1 cup (149 g) | 2 | 23.8 | 11.9 | 291 | 29.8 | ||
| Tomato | 120 g (113 g) | 1 | 12.4 | 12.4 | 267.3 | 6.7 | ||
| Cooked chopped chard | 1/2 cup (72 g) | 1.9 | 23.7 | 12.5 | 654.5 | 128.8 | ||
| Cooked cauliflower | 3/4 cup (94 g) | 1.7 | 30 | 17.6 | 188 | 14.1 | ||
| Cooked spinach | 1/2 cup (90 g) | 2.7 | 50.4 | 18.7 | 419 | 63 | ||
| Cooked broccoli | 1/2 cup (92 g) | 2.7 | 75.4 | 27.9 | 381 | 52.6 | ||
| Lettuce | 3 cups (135 g) | 1.7 | 52.6 | 30.9 | 334.4 | 12.1 | ||
| Cooked Castile squash | 1/2 cup (110 g) | 0.8 | 33 | 41.3 | 253 | 1.1 | ||
| Sliced white onion | 1/2 cup (58 g) | 0.5 | 23.2 | 46.4 | 87 | 2.3 | ||
| Chopped cooked chayote | 1/2 cup (80 g) | 0.5 | 23.2 | 46.4 | 138.4 | 189.6 | ||
| Sliced peeled cucumber | 1 1/4 cup (130 g) | 0.8 | 67.6 | 84.5 | 191.1 | 2.6 | ||
| Type A Cereals | ||||||||
| Food | Portion | Protein (g) | Phosphorus (mg) | Phosphorus/Protein Ratio | Level of Recommendation | Potassium (mg) | Sodium (mg) | |
| Powder Atole | 7 teaspoons (18 g) | 0 | 40 | Not applicable | - | 1 | ||
| Cornstarch | 2 tablespoons (16 g) | 0 | 35 | Not applicable | - | 1 | ||
| Tapioca | 2 tablespoons (19 g) | 0 | 1 | Not applicable | - | 0 | ||
| Wheat tortilla | 1/2 piece (14 g) | 1 | 0 | 0 | - | 105 | ||
| Cornflakes | 1/3 cup (13 g) | 1.1 | 5 | 4.5 | - | 163 | ||
| Hamburger bun | 1/2 piece (26 g) | 2.5 | 15 | 6 | - | 112 | ||
| Ground bread | 8 teaspoons (16 g) | 2.1 | 15 | 7.1 | - | 96 | ||
| Bagel | 1/3 piece (24 g) | 2.5 | 23 | 9.2 | - | 126 | ||
| Whole grain bagel | 1/3 piece (24 g) | 2.5 | 23 | 9.2 | - | 120 | ||
| Cooked wheat pasta | 1/2 cup (60 g) | 3.2 | 31 | 9.7 | - | 49 | ||
| Croutons | 1/2 cup (15 g) | 1.8 | 18 | 10 | - | 105 | ||
| Cooked spaghetti | 1/3 cup (46 g) | 2.5 | 25 | 10 | - | 1 | ||
| Bread sticks | 3 pieces (18 g) | 2.2 | 22 | 10 | - | 118 | ||
| Wheat flour | 2 1/2 tablespoons (20 g) | 2 | 21 | 10.5 | - | 1 | ||
| Low fat granola | 3 tablespoons (18 g) | 1.5 | 17.1 | 11.4 | - | 37 | ||
| Baguette | 1/7 piece (27 g) | 2.2 | 26 | 11.8 | - | 146 | ||
| Box bread | 1 slice (27 g) | 2.2 | 26 | 11.8 | - | 150 | ||
| Pretzels | 3/4 cup (19 g) | 1.7 | 21 | 12.4 | - | 325 | ||
| Roll | 1/3 piece (20 g) | 1.9 | 25 | 13.2 | - | 113 | ||
| Pambazo | 1 piece (25 g) | 2.4 | 32 | 13.3 | - | 142 | ||
| Animal cookie | 6 pieces (15 g) | 1.1 | 17 | 15.5 | - | 59 | ||
| Cooked sweet potato | 1/4 cup (53 g) | 0.9 | 14 | 15.6 | - | 7 | ||
| Cooked whole wheat spaghetti | 1/3 cup (46 g) | 2.5 | 41 | 16.4 | - | 1 | ||
| Cooked whole wheat pasta | 1/3 cup (46 g) | 2.5 | 41 | 16.4 | - | 1 | ||
| Pasta for soup | 20 g | 2.7 | 45 | 16.7 | - | 2 | ||
| Cooked rice | 1/4 cup (47 g) | 1.1 | 20 | 18.2 | - | 2 | ||
| Tortilla dough | 45 g | 1.6 | 35 | 21.9 | - | 1 | ||
| Cornmeal | 2 1/2 tablespoons (18 g) | 1.7 | 40 | 23.5 | - | 1 | ||
| Corn flour for tamales | 2 1/2 tablespoons (18 g) | 1.7 | 40 | 23.5 | - | 1 | ||
| Hot cake | 3/4 piece (38 g) | 2.5 | 59 | 23.6 | - | 165 | ||
| Whole wheat bread | 1 slice (25 g) | 2.4 | 57 | 23.8 | - | 146 | ||
| Whole wheat flour | 2 1/2 tablespoons (19 g) | 2.6 | 65 | 25 | - | 1 | ||
| Canned yellow corn | 1/2 piece (82 g) | 2.1 | 53 | 25.2 | - | 175 | ||
| Baked sweet potato | 1/3 cup (70 g) | 1.2 | 31 | 25.8 | - | 6 | ||
| Corn flour for atole | 2 1/2 tablespoons (19 g) | 1.5 | 41 | 27.3 | - | 1 | ||
| Oat bar | 1/2 piece (14 g) | 0.8 | 22 | 27.5 | - | 53 | ||
| Roasted amaranth | 1/4 cup (16 g) | 2.2 | 62 | 28.2 | - | 7 | ||
| Cooked yellow corn | 1 1/2 piece (174 g) | 2.2 | 68 | 30.9 | - | 2 | ||
| Hominy | 1/3 cup (54 g) | 1.8 | 56 | 31.1 | - | 9 | ||
| Rye | 5 teaspoons (22 g) | 2.6 | 81 | 31.2 | - | 1 | ||
| White corn shelled | 1/2 cup (83 g) | 2.6 | 85 | 32.7 | - | 4 | ||
| Cooked brown rice | 1/3 cup (65 g) | 1.5 | 54 | 36 | - | 1 | ||
| Cooked oatmeal | 3/4 cup (164 g) | 5.2 | 196 | 37.7 | - | 1 | ||
| Baked potato | 1/2 piece (85 g) | 1.5 | 63 | 42 | - | 4 | ||
| Instant oatmeal | 2 tablespoons (28 g) | 4.8 | 202 | 42.1 | - | 71 | ||
| Potato | 3 pieces (105 g) | 1.8 | 78 | 43.3 | - | 6 | ||
| Rice flour | 2 tablespoons (20 g) | 1.4 | 67 | 47.9 | - | 2 | ||
| Cooked wheat | 1 1/2 tablespoons (21 g) | 2.2 | 106 | 48.2 | - | 1 | ||
| Cereal flakes with dried fruit | 1/3 cup (18 g) | 1.3 | 83 | 63.8 | - | 110 | ||
| Corn tortilla | 1 piece (30 g) | 1.4 | 94 | 67.1 | - | 14 | ||
| Flour for hot cakes | 2 tablespoons (18 g) | 1.7 | 122 | 71.8 | - | 244 | ||
| Nixtamalized corn tortilla | 1 piece (30 g) | 1.3 | 94 | 72.3 | - | 14 | ||
| Type B Cereals | ||||||||
| Food | Portion | Protein (g) | Phosphorus (mg) | Phosphorus/Protein Ratio | Level of Recommendation | Potassium (mg) | Sodium (mg) | |
| Garlic bread | 1 piece (28 g) | 2 | 0 | 0 | - | 142 | ||
| Muffin | 1 slice (45 g) | 4 | 0 | 0 | - | 0 | ||
| Microwave Buttered Popcorn | 2 1/2 cups (38 g) | 3.5 | 0 | 0 | - | 384 | ||
| Cinnamon rolls with raisins | 1/3 piece (29 g) | 1.8 | 22 | 12.2 | - | 112 | ||
| Apple pie | 1/3 slice (42 g) | 0.8 | 10 | 12.5 | - | 111 | ||
| Seasoned croutons | 3/4 cup (23 g) | 2.4 | 32 | 13.3 | - | 278 | ||
| Cream cake | 1/2 slice (23 g) | 1.4 | 19 | 13.6 | - | 65 | ||
| Cheese pie | 1/2 slice (28 g) | 1.5 | 25 | 16.7 | - | 57 | ||
| Mac and cheese | 1/4 cup (50 g) | 4.2 | 81 | 19.3 | - | 272 | ||
| Commercial brownie | 1/2 piece (28 g) | 1.4 | 29 | 20.7 | - | 88 | ||
| Oatmeal cookie | 1/3 piece (24 g) | 1.5 | 33 | 22 | - | 92 | ||
| Mashed potatoes | 1/2 cup (105 g) | 2 | 48 | 24 | - | 333 | ||
| Chocolate-covered cookie | 1 1/2 piece (21 g) | 1.2 | 29 | 24.2 | - | 62 | ||
| Granola with almonds | 3 tablespoons (21 g) | 2.5 | 62 | 24.8 | - | 7 | ||
| Granola with raisins and dates | 3 tablespoons (21 g) | 2.5 | 62 | 24.8 | - | 5 | ||
| Frozen potato for frying | 50 g | 1.6 | 41 | 25.6 | - | 15 | ||
| Granola bar | 3/4 piece (21 g) | 2.2 | 59 | 26.8 | - | 62 | ||
| chips | 6 pieces (18 g) | 1.1 | 30 | 27.3 | - | 118 | ||
| corn chips | 20 g | 1.4 | 41 | 29.3 | - | 107 | ||
| Granola bar with raisins and walnuts | 3/4 piece (21 g) | 1.7 | 51 | 30 | - | 54 | ||
| Nachos | 3 pieces (21 g) | 1.7 | 52 | 30.6 | - | 151 | ||
| Carrot cake | 1/2 slice (25 g) | 1.3 | 44 | 33.8 | - | 89 | ||
| Chocolate-covered granola bar | 3/4 piece (21 g) | 1.2 | 42 | 35 | - | 42 | ||
| Glazed donut | 1/3 piece (22 g) | 1 | 35 | 35 | - | 74 | ||
| Chocolate cake | 3/4 slice (38 g) | 2.1 | 76 | 36.2 | - | 213 | ||
| Donut | 1/3 piece (21 g) | 1 | 58 | 58 | - | 117 | ||
| Sugared donut | 1/3 piece (21 g) | 1 | 58 | 58 | - | 117 | ||
| Lemon pie with meringue | 1/3 slice (38 g) | 0.6 | 40 | 66.7 | - | 55 | ||
| Bisquet | 1/2 piece (33 g) | 2 | 140 | 70 | - | 342 | ||
| Most Consumed Cereals in The Mexican Population | ||||||||
| Food | Portion (grams) | Protein (g) | Phosphorus (mg) | Phosphorus/Protein Ratio | Level of Recommendation | Potassium (mg) | Sodium (mg) | Additives with Phosphorus |
| Quaker Instant Oatmeal | 1 bag (35 g) | 2.8 | 130 | 2.9 | - | 382 | - | |
| Instant rice “knorr” | 3/4 cup (125 g) | 2.4 | Not applicable | 310 | disodium iosinate and guanylate | |||
| Coconut bar “gamesa” | 30 g | 2 | - | Not applicable | - | 366 | E340 | |
| Bar “All-bran” | 37 g | 3 | - | Not applicable | - | 188 | E338 | |
| Chia multigrain bar “bimbo” | 32 g | 3 | 80 | 26.6 | - | 152 | - | |
| Cereal “Nesquik” | 100 g | 5.7 | - | Not applicable | - | 246 | Dicalcium phosphate, trisodium phosphate | |
| Cereal “Corn-Flakes” | 100 g | 7.5 | 102 | 13.6 | 168 | 729 | Tricalcium phosphate, trisodium phosphate | |
| Legumes | ||||||||
| Food | Portion | Protein (g) | Phosphorus (mg) | Phosphorus/Protein Ratio | Level of Recommendation | Potassium (mg) | Sodium (mg) | |
| Pea sprouts | 1/2 cup (103 g) | 7.2 | 25 | 3.5 | 275 | 3 | ||
| Bean sprouts | 1 cup (190 g) | 9.1 | 72 | 7.9 | 369 | 13 | ||
| Cooked beans | 1/2 cup (90 g) | 8.7 | 101 | 11.6 | 502 | 5 | ||
| Cooked dry pea or alverjón | 1/2 cup (98 g) | 8.2 | 97 | 11.8 | 355 | 2 | ||
| Lamapa black bean “green valley” (bagged bean) | 48 g | 10 | 125 | 12.5 | - | 160 | ||
| Stewed canned beans | 1/3 cup (86 g) | 6.3 | 79 | 12.5 | 393 | 300 | ||
| Soya flour | 4 tablespoons (25 g) | 9.3 | 117 | 12.6 | 500 | 3 | ||
| Cooked sprouted beans | 1 cup (124 g) | 8.8 | 128 | 14.5 | 393 | 17 | ||
| Cooked soy | 1/3 cup (57 g) | 9.4 | 139 | 14.8 | 292 | 1 | ||
| Average cooked beans | 1/2 cup (86 g) | 7.6 | 120 | 15.8 | 305 | 1 | ||
| Soybean sprouts | 1 cup (94 g) | 8 | 127 | 15.9 | 334 | 9 | ||
| Cooked beans | 1/2 cup (85 g) | 6.5 | 106 | 16.3 | 281 | 4 | ||
| Canned whole beans | 1/2 cup (128 g) | 6.7 | 115 | 17.2 | 303 | 379 | ||
| Canned chickpeas | 1/2 cup (120 g) | 6 | 108 | 18 | 207 | 359 | ||
| Cooked chickpeas | 1/2 cup (82 g) | 7.3 | 138 | 18.9 | 239 | 6 | ||
| Ibes or cooked lime beans | 1/2 cup (85 g) | 5.8 | 111 | 19.1 | 485 | 14 | ||
| Pinto beans “valle verde” (bean bag) | 49 g | 10 | 192 | 19.2 | - | 3 | ||
| Lentil sprouts | 1 cup (77 g) | 6.9 | 133 | 19.3 | 248 | 8 | ||
| Cooked lentils | 1/2 cup (99 g) | 9 | 178 | 19.8 | 366 | 2 | ||
| Black beans “green valley” (bagged bean) | 47 g | 10 | 238 | 23.8 | - | 161 | ||
| Most Consumed Legumes in the Mexican Population | ||||||||
| Food | Portion | Protein (g) | Phosphorus (mg) | Phosphorus/Protein Ratio | Level of Recommendation | Potassium (mg) | Sodium (mg) | |
| Chickpeas | 1/2 cup (82 g) | 7.3 | 138 | 18.9 | 239 | 6 | ||
| Cooked lentils | 1/2 cup (99 g) | 9 | 178 | 19.8 | 366 | 2 | ||
| Bean “Green valley” | 1/4 cup (45 g) | 9 | 199.2 | 22.1 | - | 8 | ||
| Animal Source Foods | ||||||||
| Food | Portion | Protein (g) | Phosphorus (mg) | Phosphorus/Protein Ratio | Level of Recommendation | Potassium (mg) | Sodium (mg) | |
| Egg whites | 2 pieces (66 g) | 7.2 | 10 | 1.4 | 95 | 110 | ||
| Dried beef | 11 g | 7.1 | 19 | 2.7 | 48.8 | 382 | ||
| Beef legs | 120 g | 6.7 | 30 | 4.5 | - | 309 | ||
| Smoked white fish | 32 g | 7.5 | 42 | 5.6 | - | 326 | ||
| Roast chicken breast | 25 g | 7.2 | 40 | 5.6 | - | 16 | ||
| Cooked chicken breast | 25 g | 7.2 | 40 | 5.6 | - | 16 | ||
| Cooked chicken | 25 g | 7.2 | 40 | 5.6 | - | 16 | ||
| Cooked groupers | 30 g | 7.5 | 43 | 5.7 | - | 16 | ||
| Corned beef | 25 g | 6 | 37 | 6.2 | 74.3 | 275 | ||
| Spicy beef Cecina | 25 g | 6 | 37 | 6.2 | - | 275 | ||
| Cooked chicken gizzards | 25 g | 7.6 | 47 | 6.2 | - | 14 | ||
| Tuna in water | 1/5 cup 31 g) | 7.9 | 50 | 6.3 | - | 104 | ||
| Light tuna | 1/5 cup (31 g) | 7.9 | 50 | 6.3 | - | 104 | ||
| Cooked shrimp | 5 pieces (34 g) | 7.1 | 47 | 6.6 | 41.5 | 76 | ||
| Guinea fowl with fur | 30 g | 5.8 | 38 | 6.6 | - | 17 | ||
| Chicken tuna without skin | 1 piece (29 g) | 6.4 | 45 | 7 | - | 24 | ||
| Leg of lamb | 30 g | 6.4 | 46 | 7.2 | - | 15 | ||
| Kid (lamb) | 25 g | 6.8 | 50 | 7.4 | - | 22 | ||
| Cooked pork heart | 25 g | 5.9 | 45 | 7.6 | - | 9 | ||
| Cooked red snapper | 28 g | 7.4 | 56 | 7.6 | - | 16 | ||
| Cooked red snapper | 28 g | 7.4 | 56 | 7.6 | - | 16 | ||
| Shredded cooked crab | 1/3 cup (47 g) | 8.1 | 65 | 8 | 124.6 | 19 | ||
| Chicken Milanese | 30 g | 7 | 56 | 8 | - | 20 | ||
| Ground chicken | 32 g | 7.4 | 60 | 8.1 | - | 22 | ||
| Raw skinless chicken fajita | 1 1/3 piece (33 g) | 6.8 | 55 | 8.1 | - | 29 | ||
| Crab pulp | 1/3 cup (46 g) | 8 | 65 | 8.1 | - | 19 | ||
| Guinea fowl without skin | 55 g | 7.2 | 59 | 8.2 | - | 24 | ||
| Raw skinless chicken leg | 1/4 piece (33 g) | 6.6 | 55 | 8.3 | - | 28 | ||
| Fresh anchovies | 30 g | 6.1 | 52 | 8.5 | - | 31 | ||
| Raw chicken thighs without skin | 2/5 piece (36 g) | 7.1 | 60 | 8.5 | - | 31 | ||
| Raw skinless chicken thighs | 1/2 piece (34 g) | 6.8 | 58 | 8.5 | - | 30 | ||
| Aguayón | 30 g | 6.3 | 54 | 8.6 | 107.4 | 19 | ||
| Cooked beef hearts | 20 g | 5.8 | 50 | 8.6 | - | 12 | ||
| Steak | 30 g | 7.2 | 63 | 8.8 | - | 18 | ||
| Beef steak | 30 g | 7.2 | 63 | 8.8 | - | 18 | ||
| Mignon steak | 1/4 piece (30 g) | 7.2 | 63 | 8.8 | - | 18 | ||
| Tampiqueña steak | 1/4 piece (30 g) | 7.2 | 63 | 8.8 | - | 18 | ||
| Steak medallions | 1/4 piece (30 g) | 7.2 | 63 | 8.8 | - | 18 | ||
| Breaded beef | 30 g | 7.2 | 63 | 8.8 | - | 18 | ||
| Fillet tips | 30 g | 7.2 | 63 | 8.8 | - | 18 | ||
| Beef tips | 30 g (24 g) | 7.2 | 63 | 8.8 | - | 18 | ||
| Tampiqueña | 1/4 piece (30 g) | 7.2 | 63 | 8.8 | - | 18 | ||
| Smoked salmon | 35 g | 6.4 | 57 | 8.9 | - | 274 | ||
| Cooked beef hearts | 25 g | 7.1 | 64 | 9 | - | 15 | ||
| Cooked lobsters | 35 g | 7.2 | 65 | 9 | - | 133 | ||
| Shank | 35 g | 6.8 | 62 | 9.1 | 105 | 20 | ||
| Dry shrimp | 10 g | 7.5 | 70 | 9.3 | - | 221 | ||
| Salty dried shrimp | 10 g | 7.5 | 70 | 9.3 | - | 221 | ||
| Cooked octopus | 25 g | 7.5 | 70 | 9.3 | - | 115 | ||
| Cooked pork kidneys | 28 g | 7.1 | 67 | 9.4 | - | 22 | ||
| Raw anchovy | 45 g | 6.4 | 63 | 9.8 | - | 37 | ||
| Fish steak | 40 g | 7.5 | 74 | 9.9 | - | 32 | ||
| Filleted fish | 40 g | 7.5 | 74 | 9.9 | - | 32 | ||
| Cooked snook | 30 g | 7.3 | 72 | 9.9 | - | 26 | ||
| Ground turkey | 33 g | 7.4 | 75 | 10.1 | - | 473 | ||
| Turkey breasts | 1 1/2 slice (32 g) | 7.1 | 72 | 10.1 | - | 452 | ||
| Cooked crab | 1/3 cup (39 g) | 8 | 81 | 10.1 | - | 110 | ||
| Cooked perch | 30 g | 7.4 | 77 | 10.4 | - | 24 | ||
| Beef balls | 35 g | 7.3 | 77 | 10.5 | - | 22 | ||
| Cooked chicken giblets | 25 g | 6.8 | 72 | 10.6 | - | 17 | ||
| Baked tuna | 20 g | 6 | 65 | 10.8 | - | 10 | ||
| Cottage cheese | 3 tablespoons (48 g) | 6.6 | 72 | 10.9 | - | 195 | ||
| Low fat cottage cheese | 1/4 cup (57 g) | 7 | 76 | 10.9 | - | 230 | ||
| Fresh tuna | 30 g | 7 | 76 | 10.9 | - | 12 | ||
| Fresh abalone | 40 g | 6.8 | 76 | 11.2 | - | 120 | ||
| Cooked beef kidneys | 25 g | 6.8 | 76 | 11.2 | - | 24 | ||
| Fresh fish cod | 45 g | 8 | 92 | 11.5 | - | 24 | ||
| Beef belly | 45 g | 6.2 | 73 | 11.8 | - | 20 | ||
| Cooked shelled mussels | 25 g | 5.9 | 71 | 12 | - | 92 | ||
| Cooked turkey hearts | 30 g | 6.4 | 78 | 12.2 | - | 27 | ||
| Fresh clam without shells | 4 pieces (58 g) | 7.4 | 98 | 13.2 | 136.3 | 33 | ||
| Cooked swordfish | 28 g | 7.1 | 94 | 13.2 | - | 32 | ||
| Roast beef | 2 1/2 slices (33 g) | 6.6 | 90 | 13.6 | - | 329 | ||
| Smoked ham | 2 thin slices (42 g) | 7 | 98 | 14 | - | 510 | ||
| Squid rings | 1/4 cup (38 g) | 5.9 | 83 | 14.1 | - | 16 | ||
| Cooked veal kidneys | 25 g | 6.6 | 93 | 14.1 | - | 28 | ||
| Cooked ham | 2 thin slices (42 g) | 7 | 100 | 14.3 | - | 566 | ||
| Clean fresh squid | 45 g | 7 | 100 | 14.3 | - | 20 | ||
| Shrimp | 110 g | 7.2 | 106 | 14.7 | 402.6 | 181 | ||
| Dried codfish | 13 g | 7.4 | 111 | 15 | - | 822 | ||
| Low sodium ham | 2 thin slices (36 g) | 5.9 | 91 | 15.4 | - | 301 | ||
| Smoked turkey breasts | 1 1/2 slice (34 g) | 6.7 | 107 | 16 | - | 403 | ||
| Low-fat smoked turkey breasts | 2 1/3 slice (49 g) | 7.3 | 119 | 16.3 | - | 535 | ||
| Smoked pork chops | 1/2 piece (38 g) | 6.1 | 105 | 17.2 | - | 457 | ||
| Canadian Bacon | 3 slices (45 g) | 8 | 139 | 17.4 | - | 605 | ||
| Surimi | 2/3 bar (40 g) | 6 | 112 | 18.7 | - | 57 | ||
| Cambarellus | 50 g | 7.4 | 148 | 20 | - | 0 | ||
| Surimi shrimp | 40 g | 5 | 113 | 22.6 | - | 282 | ||
| Imitation shrimp surimi | 40 g | 4.9 | 113 | 23.1 | - | 282 | ||
| Dry charales | 15 g | 8.2 | 314 | 38.3 | - | 294 | ||
| Clam juice | 7 cups (1680 g) | 7 | 1918 | 274 | - | 3612 | ||
| Most Consumed Animal Source Foods In The Mexican Population | ||||||||
| Food | Portion | Protein (g) | Phosphorus (mg) | Phosphorus/Protein Ratio | Level of Recommendation | Potassium (mg) | Sodium (mg) | |
| Dried beef (machaca) | 11 g | 7.1 | 19 | 2.7 | 48.8 | 382 | ||
| Chicken breast | 25 g | 7.2 | 40 | 5.6 | - | 16 | ||
| Shrimp | 5 pieces (34 g) | 7.1 | 47 | 6.6 | 41.5 | 76 | ||
| Pork meat | 25 g | 5.9 | 45 | 7.6 | - | 9 | ||
| Raw skinless chicken legs | 1/4 piece (33 g) | 6.6 | 55 | 8.3 | - | 28 | ||
| Beef | 30 g | 7.2 | 63 | 8.8 | - | 18 | ||
| Fresh fish | 40 g | 7.5 | 74 | 9.9 | - | 32 | ||
| Chicken feet | 25 g | 6.8 | 72 | 10.6 | - | 17 | ||
| Fresh cod | 45 g | 8 | 92 | 11.5 | - | 24 | ||
| Oils And Fats | ||||||||
| Food | Portion (g) | Protein (g) | Phosphorus (mg) | Phosphorus/Protein Ratio | Level of Recommendation | Potassium (mg) | Sodium (mg) | |
| Oil | 1 teaspoon (5 g) | 0 | 0 | Not applicable | - | 0 | ||
| Canola oil | 1 teaspoon (5 g) | 0 | 0 | Not applicable | - | 0 | ||
| Sunflower oil | 1 teaspoon (5 g) | 0 | 0 | Not applicable | - | 0 | ||
| Corn oil | 1 teaspoon (5 g) | 0 | 0 | Not applicable | - | 0 | ||
| Olive oil | 1 teaspoon (5 g) | 0 | 0 | Not applicable | - | 0 | ||
| Pepperoni | 4 slices (15 g) | 2.8 | 22.4 | 8 | 52.1 | 274 | ||
| Skin avocado | 1 1/2 piece (36 g) | 0.5 | 7 | 14 | 308 | 1 | ||
| Roasted peanut | 13 pieces (12 g) | 2.8 | 46 | 16.4 | 79 | 96 | ||
| Almond | 10 pieces (12 g) | 2.7 | 62.4 | 23.1 | 92.8 | 1 | ||
| Pistachio | 18 pieces (13 g) | 2.6 | 65.4 | 25.2 | 126.4 | 86 | ||
| Pitted green olives | 8 pieces (24 g) | 0.3 | 17 | 56.7 | 55 | 236 | ||
| Margarine with salt | 1 teaspoon (6 g) | 0.1 | 22.9 | 229 | 42 | 61 | ||
| Butter with salt | 1 1/2 teaspoon (6 g) | 0.1 | 23 | 230 | 26 | 54 | ||
| Unsalted butter | 1 1/2 teaspoon (4 g) | 0.1 | 23 | 230 | 10 | 1 | ||
| Mayonnaise | 1 teaspoon (5 g) | 0.1 | 28 | 280 | - | 28 | ||
| Other (Snacks, Aperitives) | ||||||||
| Food | Portion (g) | Protein (g) | Phosphorus (mg) | Phosphorus/Protein Ratio | Level of Recommendation | Potassium (mg) | Sodium (mg) | |
| Candy, hard or jelly beans | 10 pieces (80 g) | 1.2 | 1.0 | 0.8 | ||||
| Popsicle, fruit and juice bars | 30 g | 1.2 | 5.0 | 4.2 | 8.0 | 4.0 | ||
| Cookie: chocolate chip or sugar (medium size) | 1 piece (15 g) | 2.0 | 15.0 | 7.5 | 30 | 60 | ||
| Candy, caramels | 1 piece (10 g) | 0.0 | 10.0 | 10 | ||||
| Gelatin/Jell-O® | 1/2 cup (113 g) | 2.0 | 30.0 | 15.0 | - | 43.5 | ||
| Brownie (2″ square) | 1 slice (50 g) | 2.8 | 55 | 19.6 | 61.0 | 175.0 | ||
| Candy bar, white chocolate (turion) | 28 g | 2.0 | 50.0 | 25.0 | - | 35.0 | ||
| Whipped topping, frozen, fat-free | 1/2 cup (113 g) | 1.1 | 30.0 | 27.3 | 38.0 | 27.0 | ||
| Nutella (chocolate-flavored hazelnut spread) | 2 tablespoons (37 g) | 2.0 | 55.0 | 27.5 | - | 15.0 | ||
| Sherbet | 1/2 cup (113 g) | 1.0 | 30.0 | 30.0 | 92.5 | 44.5 | ||
| Popcorn, air or oil popped, regular or microwave | 1 cup (70 g) | 0.8 | 25.0 | 31.3 | 21.0 | 88.0 | ||
| Ice cream, soft serve, or frozen chocolate | 1/2 cup (113 g) | 2.5 | 100.0 | 40.0 | - | 50.1 | ||
| Ice cream, soft serve, or frozen yogurt | 1/2 cup (113 g) | 2.4 | 100.0 | 41.7 | 128.0 | 66.5 | ||
| Ice cream, soft serve, or frozen vanilla | 1/2 cup (113 g) | 2.3 | 100.0 | 43.5 | - | 52.8 | ||
| Candy bar, milk or dark chocolate | 28 g | 1.8 | 85 | 47.2 | - | 28.0 | ||
| Pudding, vanilla, ready-to-eat | 1/2 cup (113 g) | 0.9 | 45.0 | 50.0 | 128.0 | 53.0 | ||
| Pudding, chocolate, ready- to-eat | 1/2 cup (113 g) | 0.9 | 65.0 | 72.2 | - | 59.8 | ||
| Cocoa, dry powder | 2 tablespoons (10 g) | 1.0 | 80.0 | 80.0 | 0.0 | 1.0 | ||
| Beverages | ||||||||
| Food | Portion (g) | Protein (g) | Phosphorus (mg) | Phosphorus/Protein Ratio | Level of Recommendation | Potassium (mg) | Sodium (mg) | |
| Cola-type beverages | 340 g | 0.0 | 35.0 | Not applicable | 3.4 | 13.6 | ||
| Non-cola beverages, all types | 340 g | 0.0 | 0.0 | Not applicable | - | 93.0 | ||
| Beer, regular | 340 g | 40.8 | 60.0 | 1.5 | 85.0 | 17.0 | ||
| Tea, black or herbal | 1 cup (226 g) | 0.3 | 2.0 | 6.7 | - | - | ||
| Coffee, black, brewed | 1 cup (226 g) | 0.3 | 5.0 | 17.9 | 111.0 | 5.0 | ||
| Wine, red or white | 1/2 cup (113 g) | 0.2 | 25.0 | 125.0 | 100.6 | 9 | ||
| Code | Name | Use in Mexican Products |
|---|---|---|
| E340 | Potassium orthophosphates | Very common |
| E340i | Monopotassium dihydrogen phosphate | |
| E340ii | Dipotassium mono-hydrogen phosphate | |
| E341 | Calcium phosphates | |
| E341i | Monocalcium phosphate | |
| E450 | Di-phosphates | |
| E450i | Di-sodium di-phosphate (di-sodium pyrophosphate) | |
| E101ii | Riboflavin-5-Sodium Phosphate | Uncommon |
| E338 | Phosphoric acid | |
| E339 | Sodium orthophosphates | |
| E339i | Monosodium di-hydrogen phosphate | |
| E339ii | Disodium mono-hydrogen phosphate | |
| E339iii | Tri-sodium phosphate | |
| E340iii | Tri-potassium phosphate | |
| E341ii | Calcium hydrogen phosphate | |
| E341iii | Tri-calcium phosphate | |
| E442 | Ammonium phosphatides | |
| E450ii | Tri-sodium di-phosphate | |
| E450iii | Tetra-sodium pyrophosphate | |
| E451 | Tri-phosphates | |
| E451i | Penta-sodium tri-phosphate | |
| E452 | Polyphosphates | |
| E452i | Sodium polyphosphate | |
| E541 | Sodium aluminium phosphate | |
| E1414 | Acetylated di-starch phosphate |
| Medication | Class | Manufacturer Reporting P Content | Phosphorus Content (mg) |
|---|---|---|---|
| Lisinopril | Angiotensin-converting enzyme inhibitors | Merck | 21.4/10 mg tablet |
| Enalapril | NA | ||
| Captopril | NA | ||
| Losartán | Angiotensin II receptor blockers | NA | |
| Valsartán | NA | ||
| Propanol | β—blockers | NA | |
| Bisoprolol | NA | ||
| Metoprolol | NA | ||
| Atenolol | NA | ||
| Rosuvastatin | Statins | AztraZeneca | 1.8/10 mg tablet |
| Artrovastatin | NA | ||
| Fluvastatin | NA | ||
| Bezafibrate | Fibrate | NA | |
| Ezetimibe | Cholesterols absorption inhibitors | NA | |
| Canaglifozin | Sodium-glucose co-transporters 2 | NA | |
| Dapagliflozin | NA | ||
| Empaglifozin | NA | ||
| Metformin | Biguanides | NA | |
| Glyburide | Sulfonylurea | Aurobindo | 27.6/5 mg tablet |
| Repaglinide 1 mg | Meglitinides | Caraco | 9.4/1 mg tablet |
| Sitagliptin 25 mg | DPP-4 inhibitors | Merck | 7.3/25 mg tablet |
| Sitagliptin 50 mg | Merck | 9.4/50 mg tablet | |
| Furosemide | Loop diuretic | NA | |
| Spironolactone | Potassium-sparing diuretics | NA |
Publisher’s Note: MDPI stays neutral with regard to jurisdictional claims in published maps and institutional affiliations. |
© 2020 by the authors. Licensee MDPI, Basel, Switzerland. This article is an open access article distributed under the terms and conditions of the Creative Commons Attribution (CC BY) license (http://creativecommons.org/licenses/by/4.0/).
Share and Cite
Palafox-Serdán, F.; Luna-Montiel, O.A.; Pablo-Franco, S.E.; Guillen-Tejada, D.L.; Carreño-Vázquez, S.D.; Silva Pereira, T.S.; Islas Romero, L.M.; Villaseñor López, K.; Ortega-Régules, A.E.; Jiménez-Garduño, A.M. Nutritional Guideline for the Management of Mexican Patients with CKD and Hyperphosphatemia. Nutrients 2020, 12, 3289. https://doi.org/10.3390/nu12113289
Palafox-Serdán F, Luna-Montiel OA, Pablo-Franco SE, Guillen-Tejada DL, Carreño-Vázquez SD, Silva Pereira TS, Islas Romero LM, Villaseñor López K, Ortega-Régules AE, Jiménez-Garduño AM. Nutritional Guideline for the Management of Mexican Patients with CKD and Hyperphosphatemia. Nutrients. 2020; 12(11):3289. https://doi.org/10.3390/nu12113289
Chicago/Turabian StylePalafox-Serdán, Frida, Olinto A. Luna-Montiel, Sebastián E. Pablo-Franco, Daniela L. Guillen-Tejada, Sandra D. Carreño-Vázquez, Taísa S. Silva Pereira, Laura M. Islas Romero, Karen Villaseñor López, Ana E. Ortega-Régules, and Aura M. Jiménez-Garduño. 2020. "Nutritional Guideline for the Management of Mexican Patients with CKD and Hyperphosphatemia" Nutrients 12, no. 11: 3289. https://doi.org/10.3390/nu12113289