Expression Patterns of Muscle-Specific miR-133b and miR-206 Correlate with Nutritional Status and Sarcopenia


 ,
, 
 and
and
Abstract
:1. Introduction
2. Materials and Methods
2.1. Participants
2.2. Ethics Statement
2.3. Assessment of Muscle Mass
2.4. Measurement of Muscle Strength
2.5. Assessment of Muscle Performance
2.6. Evaluation of Disability
2.7. Nutritional Assessment
2.8. Diagnosis of Sarcopenia
2.9. Blood Plasma Collection
2.10. RNA Extraction and miRNA Quantification
2.11. Statistical Analysis
3. Results
4. Discussion
5. Conclusions
Supplementary Materials
Author Contributions
Funding
Acknowledgments
Conflicts of Interest
References
- Ahmed, T.; Haboubi, N. Assessment and management of nutrition in older people and its importance to health. Clin. Interv. Aging 2010, 5, 207–216. [Google Scholar] [PubMed] [Green Version]
- Dato, S.; Bellizzi, D.; Rose, G.; Passarino, G. The impact of nutrients on the aging rate: A complex interaction of demographic, environmental and genetic factors. Mech. Ageing Dev. 2016, 154, 49–61. [Google Scholar] [PubMed]
- Agarwal, E.; Miller, M.; Yaxley, A.; Isenring, E. Malnutrition in the elderly: A narrative review. Maturitas 2013, 76, 296–302. [Google Scholar] [PubMed] [Green Version]
- Kaiser, M.J.; Bauer, J.M.; Rämsch, C.; Uter, W.; Guigoz, Y.; Cederholm, T.; Thomas, D.R.; Anthony, P.S.; Charlton, K.E.; Maggio, M.; et al. Mini Nutritional Assessment International Group. Frequency of malnutrition in older adults: A multinational perspective using the mini nutritional assessment. J. Am. Geriatr. Soc. 2010, 58, 1734–1738. [Google Scholar]
- Rasheed, S.; Woods, R. Malnutrition and quality of life in older people: A systematic review and meta-analysis. Ageing Res. Rev. 2013, 12, 561–566. [Google Scholar]
- Covinsky, K.E. Malnutrition and bad outcomes. J. Gen. Intern. Med. 2002, 17, 956–957. [Google Scholar]
- Harris, D.; Haboubi, N. Malnutrition screening in the elderly population. J. R. Soc. Med. 2005, 98, 411–414. [Google Scholar]
- Meyer, C.; Dostou, J.M.; Welle, S.L.; Gerich, J.E. Role of human liver, kidney, and skeletal muscle in postprandial glucose homeostasis. Am. J. Physiol. Endocrinol. Metab. 2002, 84, 475–482. [Google Scholar]
- Morley, J.E. Sarcopenia: Diagnosis and treatment. J. Nutr. Heal. Aging 2008, 12, 452–456. [Google Scholar]
- Gielen, E.; Verschueren, S.; O’Neill, T.W.; Pye, S.R.; O’Connell, M.D.L.; Lee, D.M.; Ravindrarajah, R.; Claessens, F.; Laurent, M.; Milisen, K.; et al. Musculoskeletal frailty: A geriatric syndrome at the core of fracture occurrence in older age. Calcif. Tissue Int. 2012, 91, 161–177. [Google Scholar]
- Santilli, V.; Bernetti, A.; Mangone, M.; Paoloni, M. Clinical definition of sarcopenia. Clin. Cases Miner. Bone Metab. 2014, 11, 177–180. [Google Scholar] [CrossRef] [PubMed]
- Liguori, I.; Russo, G.; Aran, L. Sarcopenia: Assessment of disease burden and strategies to improve outcomes. Clin. Interv. Aging 2018, 13, 913–927. [Google Scholar] [CrossRef] [PubMed] [Green Version]
- Shafiee, G.; Keshtkar, A.; Soltani, A.; Ahadi, Z.; Larijani, B.; Heshmat, R. Prevalence of sarcopenia in the world: A systematic review and metaanalysis of general population studies. J. Diabetes Metab. Disord. 2017, 16, 21. [Google Scholar] [CrossRef] [PubMed] [Green Version]
- Bianchi, M.; Renzini, A.; Adamo, S.; Moresi, V. Coordinated actions of microRNAs with other epigenetic factors regulate skeletal muscle development and adaptation. Int. J. Mol. Sci. 2017, 18, 840. [Google Scholar] [CrossRef]
- Pillai, R.S. Inhibition of translational initiation by Let-7 MicroRNA in human cells. Science 2005, 309, 1573–1576. [Google Scholar] [CrossRef] [Green Version]
- Zhang, Y.; Yu, B.; He, J.; Chen, D. From nutrient to microRNA: A novel insight into cell signaling involved in skeletal muscle development and disease. Int. J. Biol. Sci. 2016, 12, 1247–1261. [Google Scholar] [CrossRef] [Green Version]
- Jung, H.J.; Lee, K.P.; Kwon, K.S.; Suh, Y. MicroRNAs in skeletal muscle aging: Current issues and perspectives. J. Gerontol. A Biol. Sci. Med. Sci. 2019, 74, 1008–1074. [Google Scholar] [CrossRef]
- Drummond, M.J.; McCarthy, J.J.; Sinha, M. Aging and microRNA expression in human skeletal muscle: A microarray and bioinformatics analysis. Physiol. Genom. 2011, 43, 595–603. [Google Scholar] [CrossRef] [Green Version]
- Rivas, D.A.; Lessard, S.J.; Rice, N.P. Diminished skeletal muscle micro-RNA expression with aging is associated with attenuated muscle plasticity and inhibition of IGF-1 signaling. FASEB J. 2014, 28, 4133–4147. [Google Scholar] [CrossRef] [Green Version]
- Margolis, L.M.; Rivas, D.A. Potential role of microRNA in the anabolic capacity of skeletal muscle with aging. Exerc. Sport Sci. Rev. 2018, 46, 86–91. [Google Scholar] [CrossRef]
- Brown, D.M.; Goljanek-Whysall, K. MicroRNAs: Modulators of the underlying pathophysiology of sarcopenia? Ageing Res. Rev. 2015, 24, 263–273. [Google Scholar] [CrossRef]
- Güller, I.; Russell, A.P. MicroRNAs in skeletal muscle: Their role and regulation in development, disease and function. J. Physiol. 2010, 588, 4075–4087. [Google Scholar] [CrossRef] [PubMed] [Green Version]
- McCarthy, J.J. The MyomiR network in skeletal muscle plasticity. Exerc. Sport Sci. Rev. 2011, 39, 150–154. [Google Scholar] [CrossRef] [PubMed]
- Wang, X.H. MicroRNA in myogenesis and muscle atrophy. Curr. Opin. Clin. Nutr. Metab. Care 2013, 16, 258–266. [Google Scholar] [CrossRef] [PubMed] [Green Version]
- Sharma, M.; Juvvuna, P.K.; Kukreti, H.; McFarlane, C. Mega roles of microRNAs in regulation of skeletal muscle health and disease. Front. Physiol. 2014, 5, 239. [Google Scholar] [CrossRef] [Green Version]
- Horak, M.; Novak, J.; Bienertova-Vasku, J. Muscle-specific microRNAs in skeletal muscle development. Dev. Biol. 2016, 1, 1–13. [Google Scholar] [CrossRef]
- Schiaffino, S.; Mammucari, C. Regulation of skeletal muscle growth by the IGF1-Akt/PKB pathway: Insights from genetic models. Skelet. Muscle 2011, 1, 4. [Google Scholar] [CrossRef]
- Nielsen, S.; Scheele, C.; Yfanti, C.; Åkerström, T.; Nielsen, A.R.; Pedersen, B.K.; Laye, M. Muscle specific microRNAs are regulated by endurance exercise in human skeletal muscle. J. Physiol. 2010, 588, 4029–4037. [Google Scholar] [CrossRef]
- Russell, A.P.; Lamon, S.; Boon, H.; Wada, S.; Güller, I.; Brown, E.L.; Chibalin, A.V.; Zierath, J.R.; Snow, R.J.; Stepto, N.; et al. Regulation of miRNAs in human skeletal muscle following acute endurance exercise and short-term endurance training. J. Physiol. 2013, 591, 4637–4653. [Google Scholar] [CrossRef]
- Drummond, M.J.; McCarthy, J.J.; Fry, C.S.; Esser, K.A.; Rasmussen, B.B. Aging differentially affects human skeletal muscle microRNA expression at rest and after an anabolic stimulus of resistance exercise and essential amino acids. Am. J. Physiol. Endocrinol. Metab. 2008, 295, E1333–E1340. [Google Scholar] [CrossRef] [Green Version]
- Margolis, L.M.; McClung, H.L.; Murphy, N.E.; Carrigan, C.T.; Pasiakos, S.M. Skeletal muscle myomiR are differentially expressed by endurance exercise mode and combined essential amino acid and carbohydrate supplementation. Front. Physiol. 2017, 23, 182. [Google Scholar] [CrossRef] [PubMed] [Green Version]
- Camera, D.M.; Ong, J.N.; Coffey, V.G.; Hawley, J.A. Selective modulation of microRNA expression with protein ingestion following concurrent resistance and endurance exercise in human skeletal muscle. Front. Physiol. 2016, 7, 87. [Google Scholar] [CrossRef] [PubMed] [Green Version]
- Haran, P.H.; Rivas, D.A.; Fielding, R.A. Role and potential mechanisms of anabolic resistance in sarcopenia. J. Cachexia Sarcopenia Muscle 2012, 3, 157–162. [Google Scholar] [CrossRef] [Green Version]
- Nielsen, S.; Hvid, T.; Kelly, M.; Lindegaard, B.; Dethlefsen, C.; Winding, K.; Mathur, N.; Scheele, C.; Pedersen, B.K.; Laye, L.J. Muscle specific miRNAs are induced by testosterone and independently upregulated by age. Front. Physiol. 2014, 4, 394. [Google Scholar] [CrossRef] [Green Version]
- Janssen, I.; Heymsfield, S.B.; Baumgartner, R.N.; Ross, R. Estimation of skeletal muscle mass by bioelectrical impedance analysis. J. Appl. Physiol. 2000, 89, 465–471. [Google Scholar] [CrossRef] [Green Version]
- Katz, S.; Downs, T.D.; Cash, H.R.; Grotz, R.C. Progress in development of the index of ADL. Gerontologist 1970, 10, 20–30. [Google Scholar] [CrossRef]
- Vellas, B.; Guigoz, Y.; Garry, P.J.; Nourhashemi, F.; Bennahum, D.; Lauque, S.; Albarede, J.L. The Mini Nutritional Assessment (MNA) and its use in grading the nutritional state of elderly patients. Nutrition 1999, 15, 116–122. [Google Scholar] [CrossRef]
- Cruz-Jentoft, A.J.; Bahat, G.; Bauer, J.; Boirie, Y.; Bruyère, O.; Cederholm, T.; Cooper, C.; Landi, F.; Rolland, Y.; Sayer, A.A.; et al. Sarcopenia: Revised European consensus on definition and diagnosis. Age Ageing 2019, 48, 16–31. [Google Scholar] [CrossRef] [Green Version]
- Schmittgen, T.D.; Livak, K.J. Analyzing real-time PCR data by the comparative C(T) method. Nat. Protoc. 2008, 3, 1101–1108. [Google Scholar] [CrossRef]
- Cereda, E.; Pedrolli, C.; Klersy, C. Nutritional status in older persons according to healthcare setting: A systematic review and meta-analysis of prevalence data using MNA((R)). Clin. Nutr. 2016, 35, 1282–1290. [Google Scholar] [CrossRef]
- Lu, Y.; Karagounis, L.G.; Ng, T.P.; Carre, C.; Narang, V.; Wong, G.; Ying Tan, C.T.; Zin Nyunt, M.S.; Gao, Q.; Abel, B.; et al. Systemic and metabolic signature of sarcopenia in community-dwelling older adults. J. Gerontol. A Biol. Sci. Med. Sci. 2019, 8. [Google Scholar] [CrossRef] [PubMed]
- Verlaan, S.; Aspray, T.J.; Bauer, J.M.; Cederholm, T.; Hemsworth, J.; Hill, T.R.; McPhee, J.S.; Piasecki, M.; Seal, C.; Sieber, C.C.; et al. Nutritional status, body composition, and quality of life in community-dwelling sarcopenic and non-sarcopenic older adults: A case-control study. Clin. Nutr. 2017, 36, 267–274. [Google Scholar] [CrossRef] [PubMed] [Green Version]
- Vandewoude, M.F.; Alish, C.J.; Sauer, A.C.; Hegazi, R.A. Malnutrition-sarcopenia syndrome: Is this the future of nutrition screening and assessment for older adults? J. Aging Res. 2012. [Google Scholar] [CrossRef] [PubMed]
- Cui, S.; Li, L.; Mubarokah, S.N.; Meech, R. Wnt/β-catenin signaling induces the myomiRs miR-133b and miR-206 to suppress Pax7 and induce the myogenic differentiation program. J. Cell Biochem. 2019, 120, 12740–12751. [Google Scholar] [CrossRef] [PubMed]
- Feng, Y.; Niu, L.-L.; Wei, W.; Zhang, W.-Y.; Li, X.-Y.; Cao, J.-H.; Zhao, S.-H. A feedback circuit between miR-133 and the ERK1/2 pathway involving an exquisite mechanism for regulating myoblast proliferation and differentiation Cell. Death Dis. 2013, 4, 934. [Google Scholar] [CrossRef] [PubMed] [Green Version]
- Alway, S.E. Regulation of satellite cell function in sarcopenia. Front. Aging Neurosci. 2014, 6, 246. [Google Scholar] [CrossRef] [Green Version]
- Sousa-Victor, P.; Muñoz-Cánoves, P. Regenerative decline of stem cells in sarcopenia. Mol. Asp. Med. 2016, 50, 109–117. [Google Scholar] [CrossRef]
- Ross, S.A.; Davis, C.D. The emerging role of microRNAs and nutrition in modulating health and disease. Annu. Rev. Nutr. 2014, 34, 305–336. [Google Scholar] [CrossRef]
- Ge, Y.; Chen, J. Mammalian target of rapamycin (mTOR) signaling network in skeletal myogenesis. J. Biol. Chem. 2012, 287, 43928–43935. [Google Scholar] [CrossRef] [Green Version]
- Mitchelson, K.R.; Qin, W.Y. Roles of the canonical myomiRs miR-1, -133 and -206 in cell development and disease. World J. Biol. Chem. 2015, 6, 162–208. [Google Scholar] [CrossRef]
- Dalle, S.; Rossmeislova, L.; Koppo, K. The role of inflammation in age-related sarcopenia. Front. Physiol. 2017, 8, 1045. [Google Scholar] [CrossRef] [PubMed]
- Aly, G.S.; Shaalan, A.H.; Mattar, M.K. Oxidative stress status in nutritionally stunted children. Gaz. Egypt. Paediatr. Assoc. 2014, 62, 28–33. [Google Scholar] [CrossRef] [Green Version]
- Mueller, C. Inflammation and malnutrition. Top. Clin. Nutr. 2011, 26, 3–9. [Google Scholar] [CrossRef]
- Georgantas, R.W.; Streicher, K.; Greenberg, S.A.; Greenlees, L.M.; Zhu, W.; Brohawn, P.Z.; Higgs, B.W.; Czapiga, M.; Morehouse, C.A.; Amato, A.; et al. Inhibition of myogenic microRNAs 1, 133 and 206 by inflammatory cytokines links inflammation and muscle degeneration in adult inflammatory myopathies. Arthritis Rheumatol. 2014, 66, 1022–1033. [Google Scholar] [CrossRef]
- Razak, A.M.; Khor, S.C.; Jaafar, F.; Karim, N.A.; Makpol, S. Targeting myomiRs by tocotrienol-rich fraction to promote myoblast differentiation. Genes Nutr. 2018, 13. [Google Scholar] [CrossRef]
- Keller, U. Nutritional laboratory markers in malnutrition. J. Clin. Med. 2019, 8, 775. [Google Scholar] [CrossRef] [Green Version]
- Soeters, P.B.; Wolfe, R.R.; Shenkin, A. Hypoalbuminemia: Pathogenesis and clinical significance. J. Parenter. Enter. Nutr. 2018, 43, 181–193. [Google Scholar] [CrossRef] [Green Version]
- Moen, I.W.; Bergholdt, H.K.M.; Mandrup-Poulsen, T. Increased plasma ferritin concentration and low-grade inflammation. A mendelian randomization study. Clin. Chem. 2018, 64. [Google Scholar] [CrossRef]

| Variables | No Sarcopenia (N = 109) | Sarcopenia (N = 109) | p-Value |
|---|---|---|---|
| Age (years) | 79.5 (7.3) | 83.7 (6.3) | <0.001 |
| Men (%) | 39.4 | 33.0 | 0.324 |
| HGS (kg) | 22.7 (11.7) | 12.4 (5.1) | <0.001 |
| SMI (kg/m2) | 8.5 (1.8) | 6.8 (1.9) | <0.001 |
| Gait speed (m/s) | 0.69 (0.33) | 0.58 (0.24) | 0.094 |
| ADL dependence (>1) | 43.7% | 75.9% | <0.001 |
| MNA-SF (<12 pt) | 35.4% | 59.4% | 0.002 |
| MNA-LF (<24 pt) | 50.0% | 77.4% | 0.002 |
| Glucose (mg/dL) | 104.3 (33.3) | 101 (46.1) | 0.555 |
| Total protein (g/dL) | 6.6 (0.5) | 6.5 (0.7) | 0.477 |
| Albumin (%) | 54.6 (7.9) | 51.8 (6.6) | 0.014 |
| Total cholesterol (mg/dL) | 169.6 (41.6) | 155.4 (39.5) | 0.011 |
| Triglycerides (mg/dL) | 96.6 (35.1) | 85.5 (31.6) | 0.025 |
| LDL cholesterol (mg/dL) | 51.1 (13.1) | 49.2 (14.4) | 0.315 |
| HDL cholesterol (mg/dL) | 122.3 (79.7) | 116.3 (56.2) | 0.530 |
| Creatinine (mg/dL) | 1.1 (0.3) | 1.1 (0.5) | 0.961 |
| Uric acid (mg/dL) | 4.6 (1.4) | 5.6 (7.2) | 0.218 |
| Sodium (mM/L) | 140.9 (2.6) | 140.6 (2.5) | 0.459 |
| Potassium (mM/L) | 4.4 (0.5) | 4.5 (0.6) | 0.728 |
| Clorure (mM/L) | 104.6 (4.5) | 104 (3.7) | 0.400 |
| Calcium (mg/dL) | 9.2 (0.6) | 9.1 (0.6) | 0.026 |
| Phosphorus (mg/dL) | 3.7 (0.6) | 3.7 (1) | 0.926 |
| Magnesium (mg/dL) | 1.9 (0.3) | 1.9 (0.3) | 0.243 |
| Iron (μg/dL) | 57.7 (29) | 53.7 (28.3) | 0.402 |
| Ferritin (ng/mL) * | 137.4 (177) | 204.8 (279.6) | 0.036 |
| C-Reactive Protein (mg/L) * | 8.9 (12.6) | 17.3 (21.9) | 0.040 |
| Model 1 | Model 2 | Model 3 | ||||
|---|---|---|---|---|---|---|
| OR (95%CI) | p–Value | OR (95%CI) | p–Value | OR (95%CI) | p–Value | |
| miR-133a | 1.30 (0.88–1.90) | 0.187 | 1.29 (0.85–1.97) | 0.229 | 1.09 (0.69–1.73) | 0.700 |
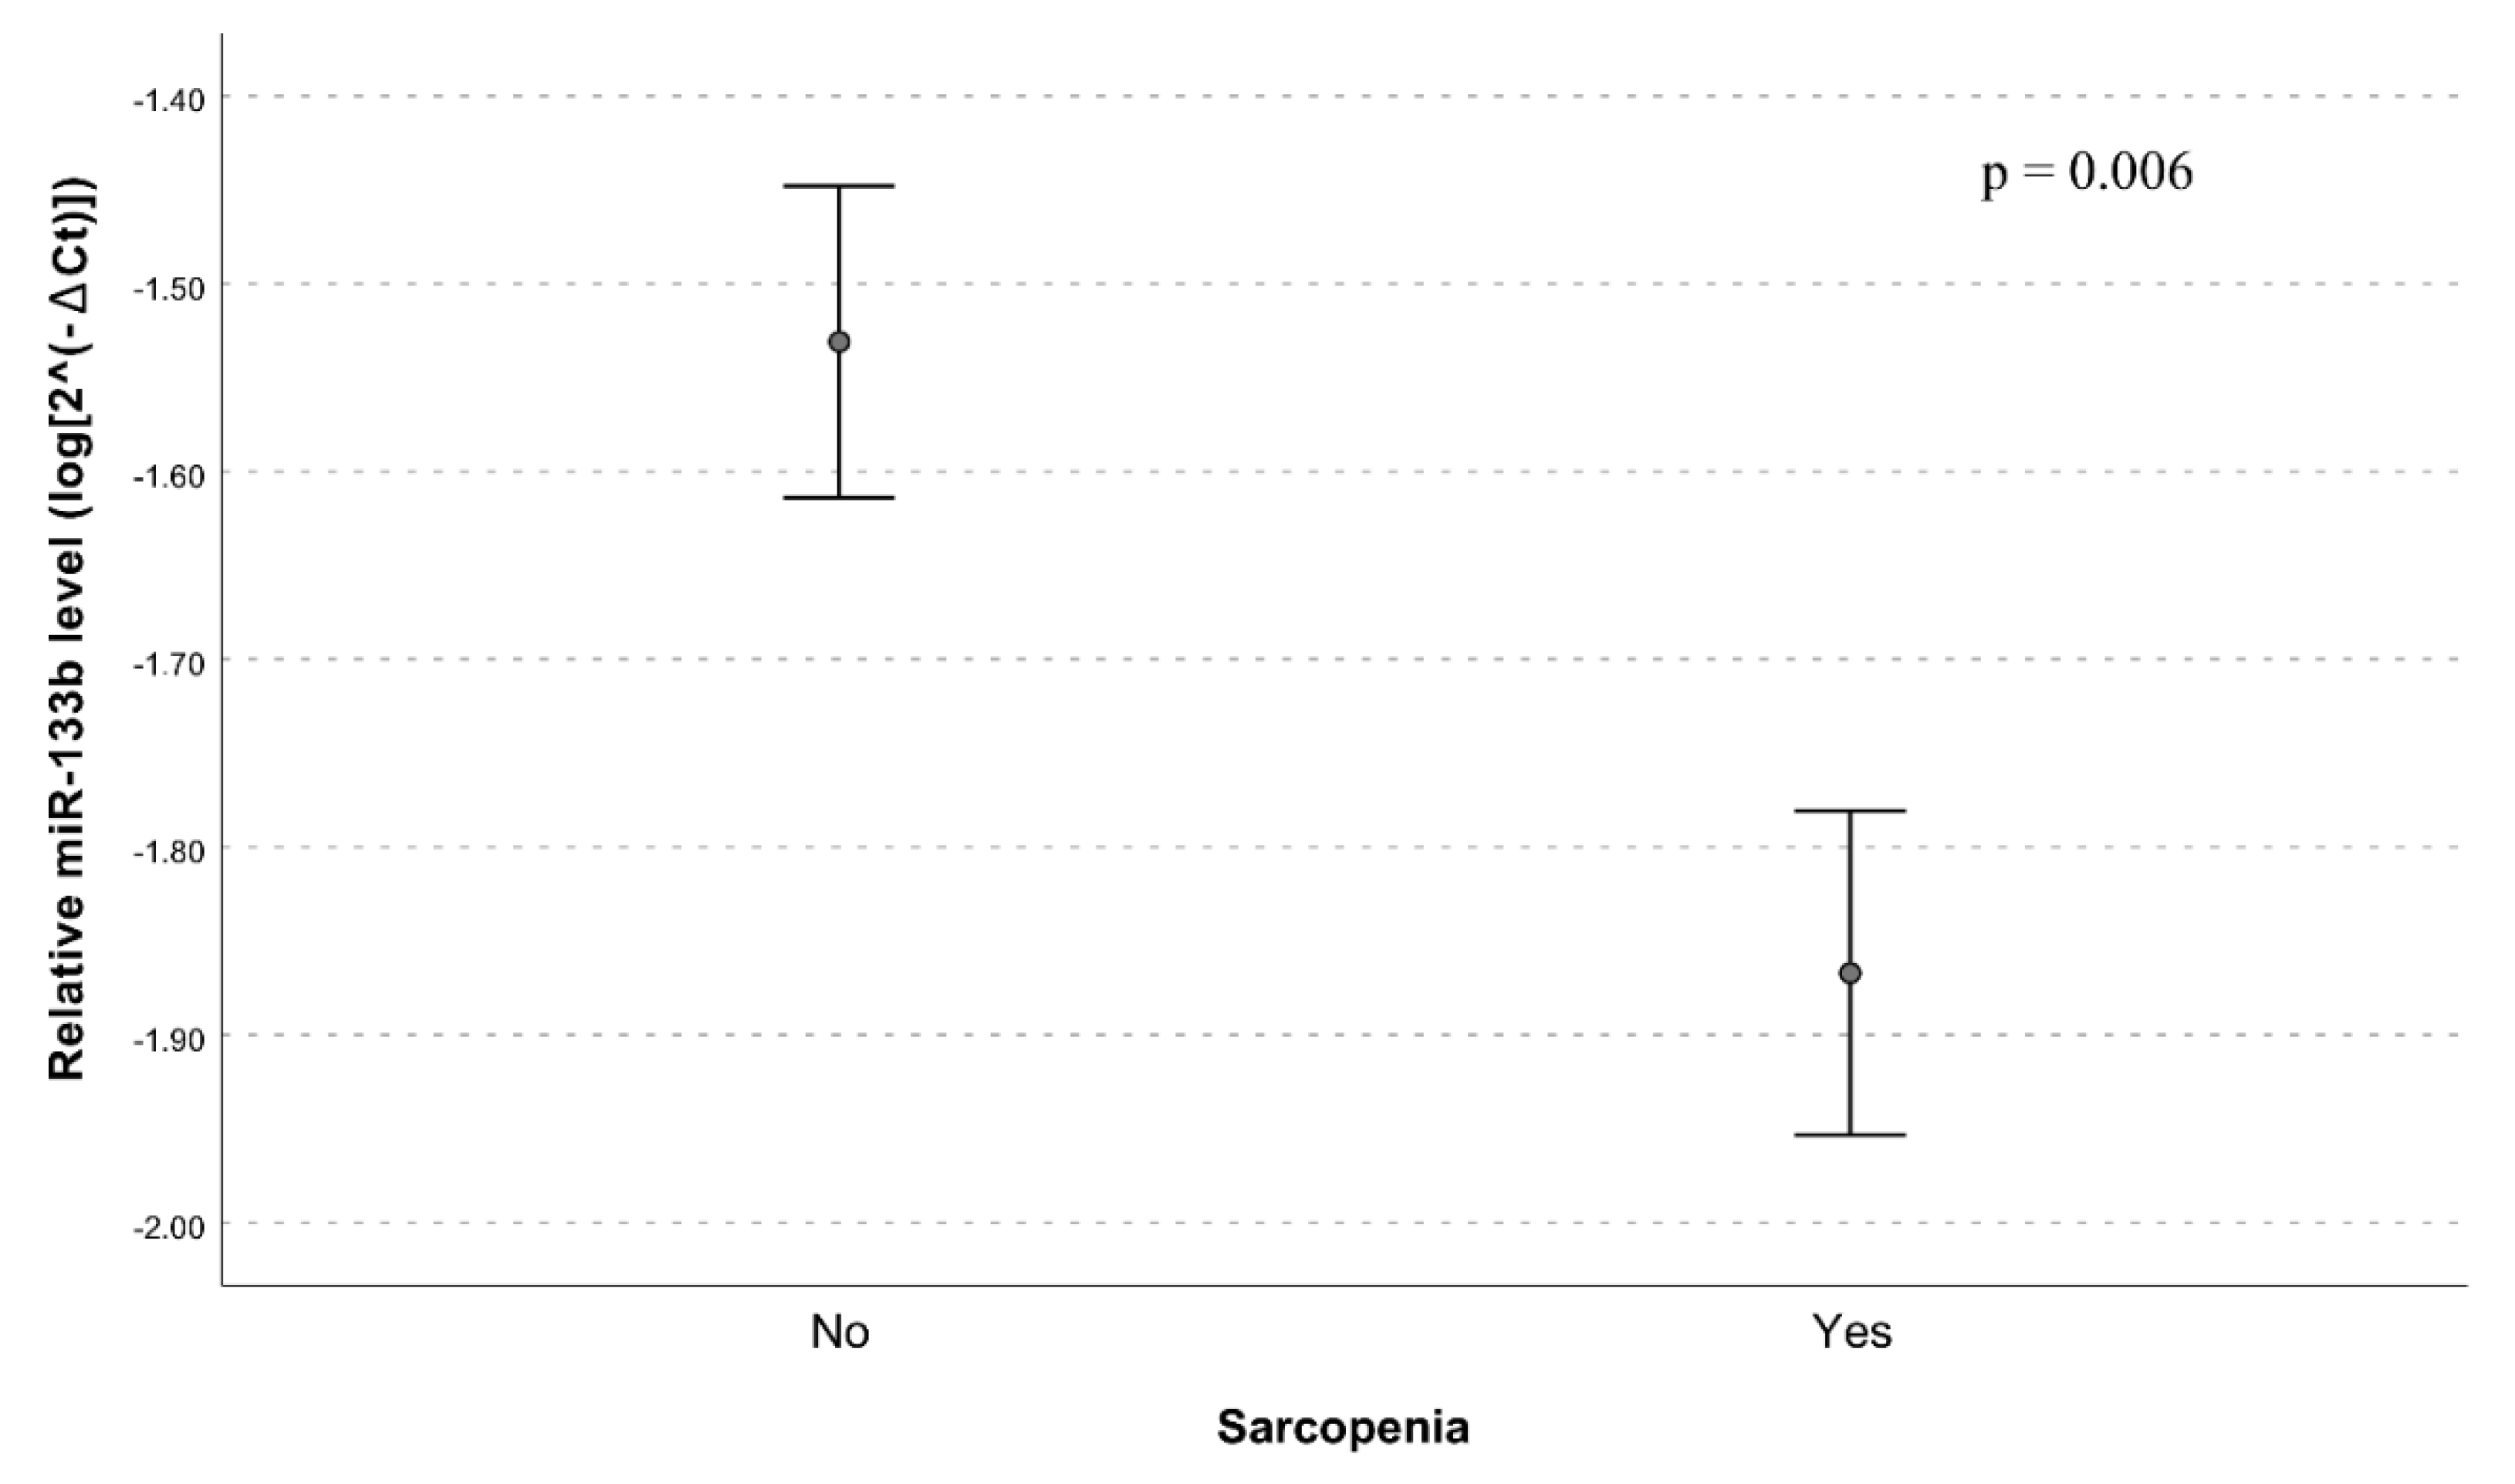
| miR-133b | 0.65 (0.47–0.89) | 0.006 | 0.69 (0.49–0.97) | 0.037 | 0.79 (0.53–1.17) | 0.228 |
| miR-206 | 1.06 (0.80–1.41) | 0.675 | 1.14 (0.84–1.55) | 0.413 | 1.20 (0.86–1.69) | 0.288 |
© 2020 by the authors. Licensee MDPI, Basel, Switzerland. This article is an open access article distributed under the terms and conditions of the Creative Commons Attribution (CC BY) license (http://creativecommons.org/licenses/by/4.0/).
Share and Cite
Iannone, F.; Montesanto, A.; Cione, E.; Crocco, P.; Caroleo, M.C.; Dato, S.; Rose, G.; Passarino, G. Expression Patterns of Muscle-Specific miR-133b and miR-206 Correlate with Nutritional Status and Sarcopenia. Nutrients 2020, 12, 297. https://doi.org/10.3390/nu12020297
Iannone F, Montesanto A, Cione E, Crocco P, Caroleo MC, Dato S, Rose G, Passarino G. Expression Patterns of Muscle-Specific miR-133b and miR-206 Correlate with Nutritional Status and Sarcopenia. Nutrients. 2020; 12(2):297. https://doi.org/10.3390/nu12020297
Chicago/Turabian StyleIannone, Francesca, Alberto Montesanto, Erika Cione, Paolina Crocco, Maria Cristina Caroleo, Serena Dato, Giuseppina Rose, and Giuseppe Passarino. 2020. "Expression Patterns of Muscle-Specific miR-133b and miR-206 Correlate with Nutritional Status and Sarcopenia" Nutrients 12, no. 2: 297. https://doi.org/10.3390/nu12020297
APA StyleIannone, F., Montesanto, A., Cione, E., Crocco, P., Caroleo, M. C., Dato, S., Rose, G., & Passarino, G. (2020). Expression Patterns of Muscle-Specific miR-133b and miR-206 Correlate with Nutritional Status and Sarcopenia. Nutrients, 12(2), 297. https://doi.org/10.3390/nu12020297