Associations between Triglyceride-Glucose Index and Micro- and Macro-Angiopathies in Type 2 Diabetes Mellitus

 , , and
Abstract
:1. Introduction
2. Materials and Methods
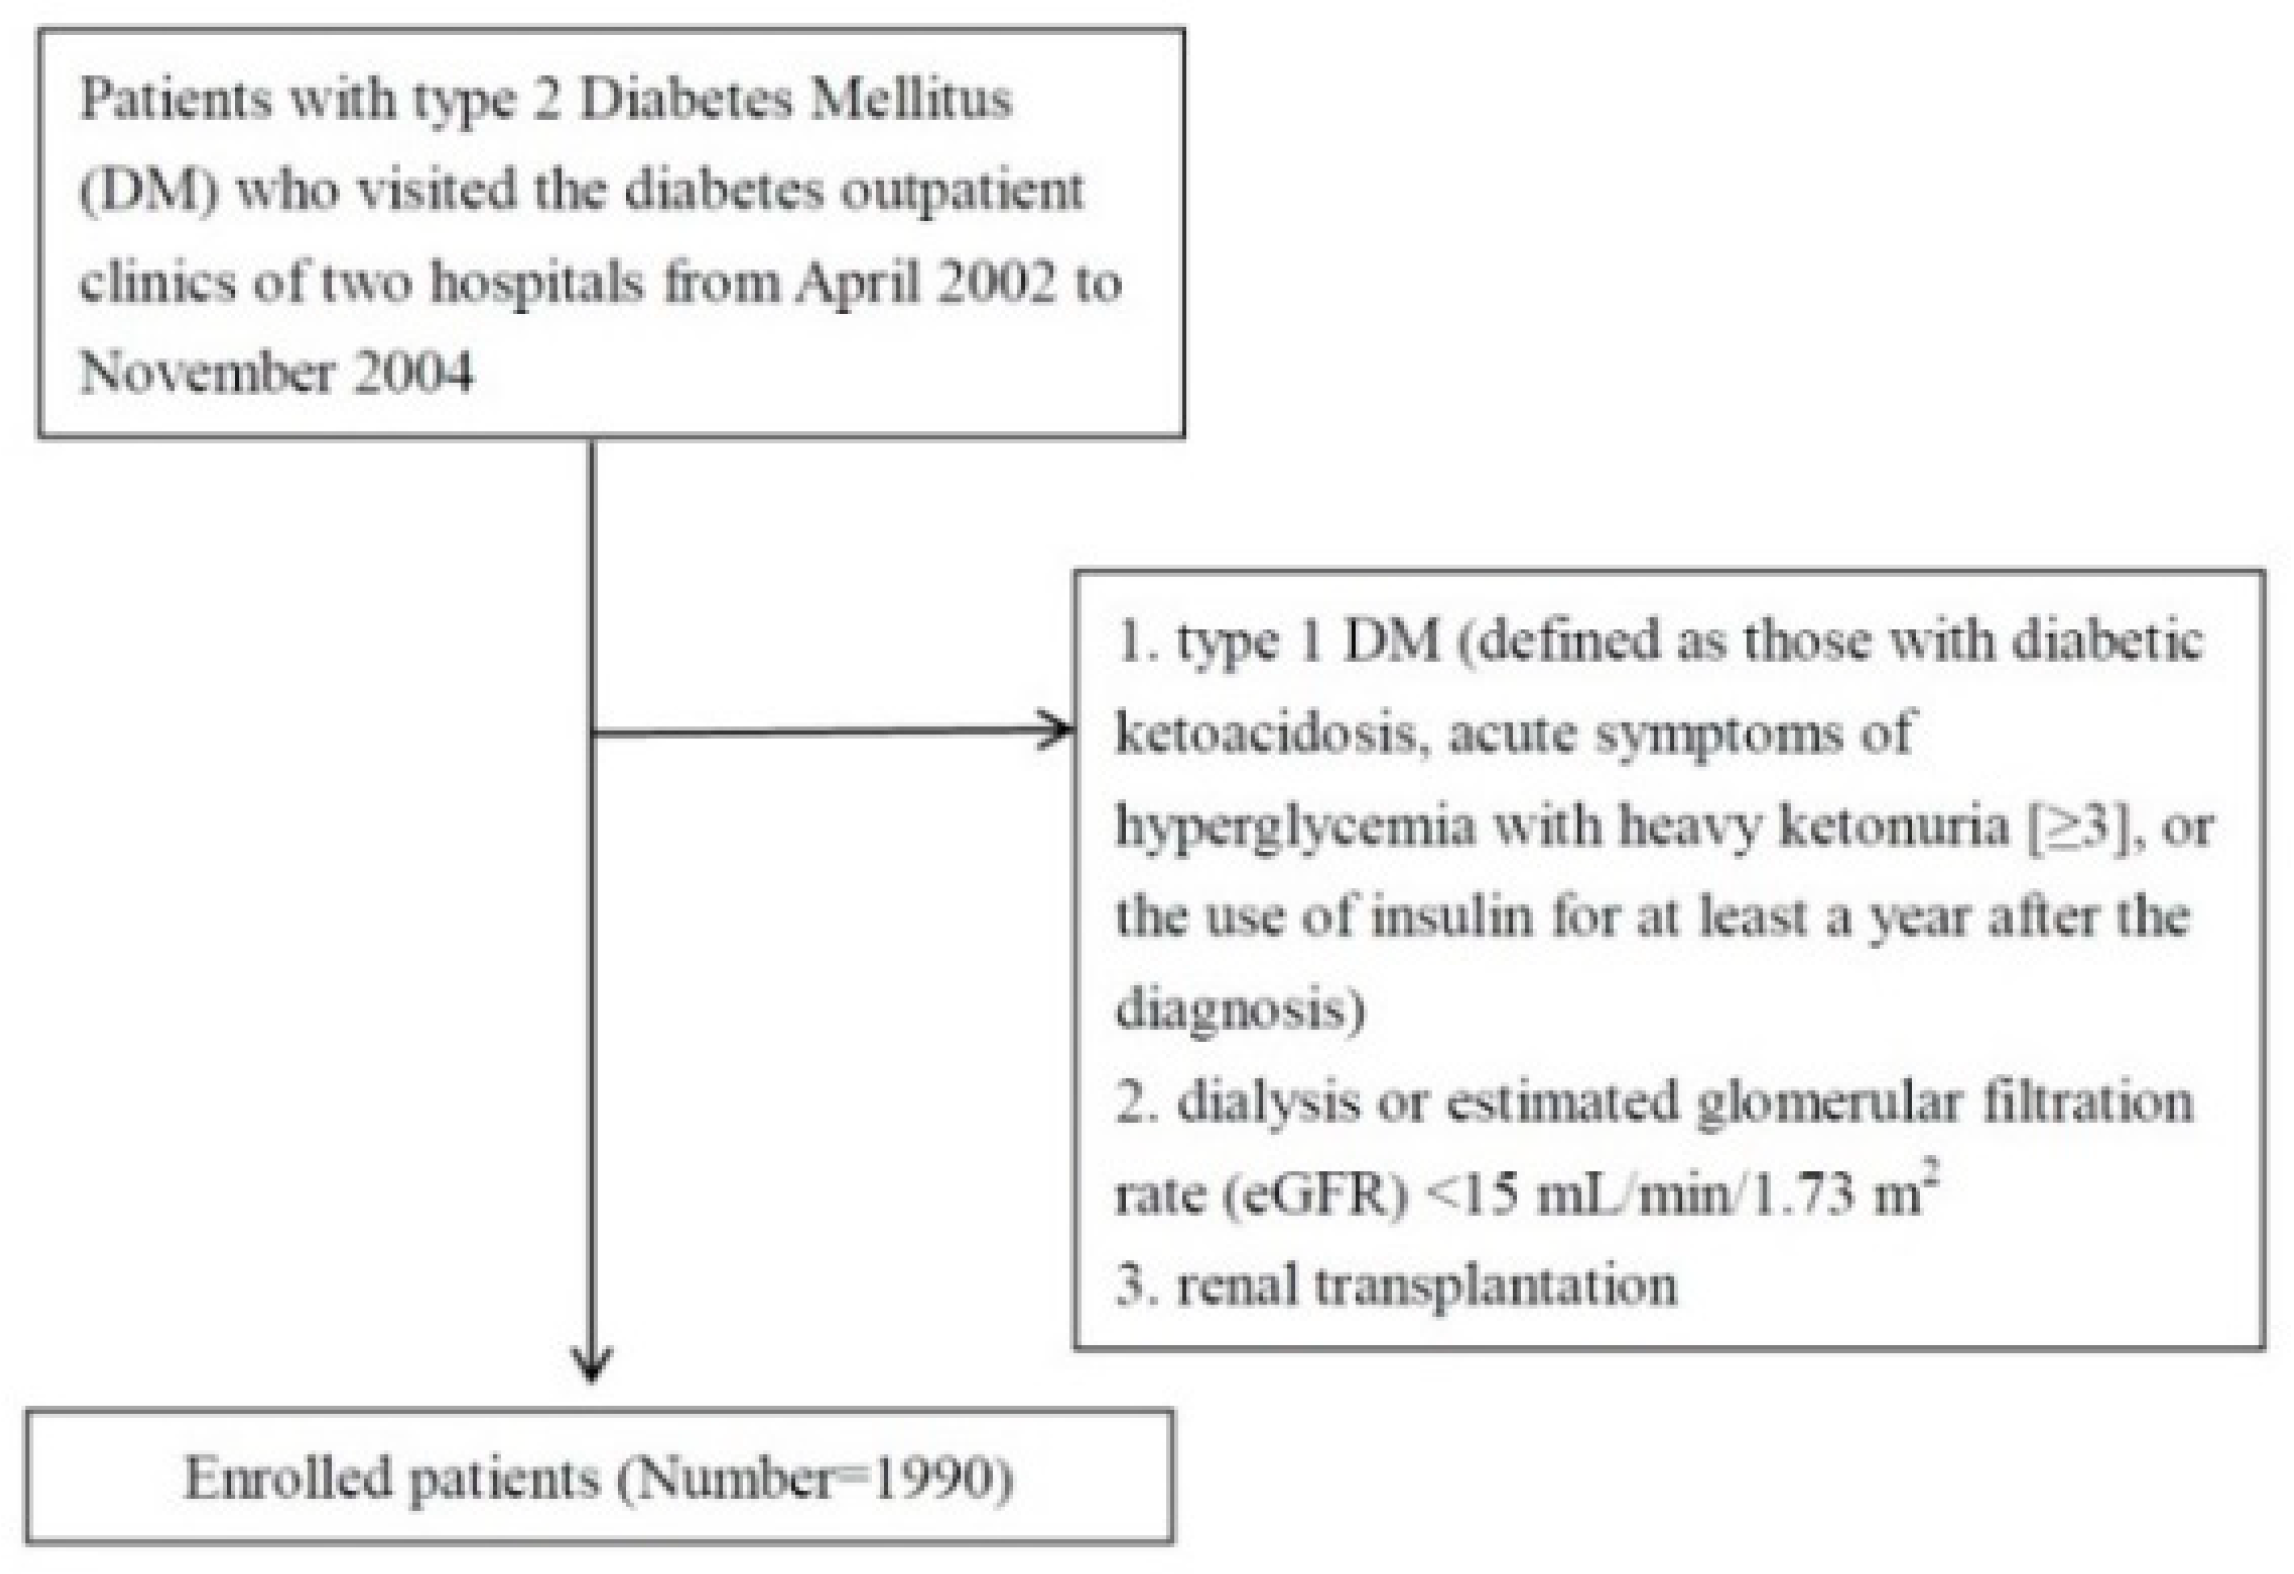
2.1. Study Patients
2.2. Collection of Demographic, Medical, and Laboratory Data
2.3. Definition of Albuminuria
2.4. Evaluation of DR
2.5. Definitions of CAD and CVA
2.6. Assessment of Ankle–Brachial Index (ABI) and Definition of PAOD
2.7. Statistical Analysis
3. Results
4. Discussion
5. Conclusions
Author Contributions
Funding
Conflicts of Interest
References
- Zheng, Y.; Ley, S.H.; Hu, F.B. Global aetiology and epidemiology of type 2 diabetes mellitus and its complications. Nat. Rev. Endocrinol. 2018, 14, 88. [Google Scholar] [CrossRef] [PubMed]
- Beckman, J.A.; Creager, M.A.; Libby, P. Diabetes and atherosclerosis: Epidemiology, pathophysiology, and management. JAMA 2002, 287, 2570–2581. [Google Scholar] [CrossRef] [PubMed]
- Yamagishi, S.; Imaizumi, T. Diabetic vascular complications: Pathophysiology, biochemical basis and potential therapeutic strategy. Curr. Pharm. Des. 2005, 11, 2279–2799. [Google Scholar] [CrossRef]
- Brownlee, M. The pathobiology of diabetic complications: A unifying mechanism. Diabetes 2005, 54, 1615–1625. [Google Scholar] [CrossRef] [Green Version]
- Laakso, M.; Kuusisto, J. Insulin resistance and hyperglycaemia in cardiovascular disease development. Nat. Rev. Endocrinol. 2014, 10, 293. [Google Scholar] [CrossRef]
- De Rosa, S.; Arcidiacono, B.; Chiefari, E.; Brunetti, A.; Indolfi, C.; Foti, D.P. Type 2 diabetes mellitus and cardiovascular disease: Genetic and epigenetic links. Front. Endocrinol. 2018, 9, 2. [Google Scholar] [CrossRef]
- Wallace, T.M.; Levy, J.C.; Matthews, D.R. Use and abuse of HOMA modeling. Diabetes Care 2004, 27, 1487–1495. [Google Scholar] [CrossRef] [Green Version]
- Simental-Mendía, L.E.; Rodríguez-Morán, M.; Guerrero-Romero, F. The product of fasting glucose and triglycerides as surrogate for identifying insulin resistance in apparently healthy subjects. Metab. Syndr. Relat. Disord. 2008, 6, 299–304. [Google Scholar] [CrossRef]
- Guerrero-Romero, F.; Simental-Mendía, L.E.; González-Ortiz, M.; Martínez-Abundis, E.; Ramos-Zavala, M.G.; Hernández-González, S.O.; Jacques-Camarena, O.; Rodríguez-Morán, M. The product of triglycerides and glucose, a simple measure of insulin sensitivity. Comparison with the euglycemic-hyperinsulinemic clamp. J. Clin. Endocrinol. Metab. 2010, 95, 3347–3351. [Google Scholar] [CrossRef] [Green Version]
- Du, T.; Yuan, G.; Zhang, M.; Zhou, X.; Sun, X.; Yu, X. Clinical usefulness of lipid ratios, visceral adiposity indicators, and the triglycerides and glucose index as risk markers of insulin resistance. Cardiovasc. Diabetol. 2014, 13, 146. [Google Scholar] [CrossRef]
- Irace, C.; Carallo, C.; Scavelli, F.B.; De Franceschi, M.S.; Esposito, T.; Tripolino, C.; Gnasso, A. Markers of insulin resistance and carotid atherosclerosis. A comparison of the homeostasis model assessment and triglyceride glucose index. Int. J. Clin. Pract. 2013, 67, 665–672. [Google Scholar] [CrossRef] [PubMed]
- Kim, M.K.; Ahn, C.W.; Kang, S.; Nam, J.S.; Kim, K.R.; Park, J.S. Relationship between the triglyceride glucose index and coronary artery calcification in Korean adults. Cardiovasc. Diabetol. 2017, 16, 108. [Google Scholar] [CrossRef] [PubMed]
- Won, K.B.; Park, G.M.; Lee, S.E.; Cho, I.J.; Kim, H.C.; Lee, B.K.; Chang, H.J. Relationship of insulin resistance estimated by triglyceride glucose index to arterial stiffness. Lipids Health Dis. 2018, 17, 268. [Google Scholar] [CrossRef] [PubMed]
- Lambrinoudaki, I.; Kazani, M.V.; Armeni, E.; Georgiopoulos, G.; Tampakis, K.; Rizos, D.; Augoulea, A.; Kaparos, G.; Alexandrou, A.; Stamatelopoulos, K. The TyG index as a marker of subclinical atherosclerosis and arterial stiffness in lean and overweight postmenopausal women. Heart Lung Circ. 2018, 27, 716–724. [Google Scholar] [CrossRef]
- da Silva, A.; Caldas, A.P.S.; Hermsdorff, H.H.M.; Bersch-Ferreira, Â.C.; Torreglosa, C.R.; Weber, B.; Bressan, J. Triglyceride-glucose index is associated with symptomatic coronary artery disease in patients in secondary care. Cardiovasc. Diabetol. 2019, 18, 89. [Google Scholar] [CrossRef]
- Mao, Q.; Zhou, D.; Li, Y.; Wang, Y.; Xu, S.C.; Zhao, X.H. The triglyceride-glucose index predicts coronary artery disease severity and cardiovascular outcomes in patients with non-st-segment elevation acute coronary syndrome. Dis. Markers 2019, 2019, 6891537. [Google Scholar] [CrossRef] [Green Version]
- Jin, J.L.; Cao, Y.X.; Wu, L.G.; You, X.D.; Guo, Y.L.; Wu, N.Q.; Zhu, C.G.; Gao, Y.; Dong, Q.T.; Zhang, H.W.; et al. Triglyceride glucose index for predicting cardiovascular outcomes in patients with coronary artery disease. J. Thorac. Dis. 2018, 10, 6137. [Google Scholar] [CrossRef]
- Sánchez-Iñigo, L.; Navarro-González, D.; Fernández-Montero, A.; Pastrana-Delgado, J.; Martínez, J.A. Risk of incident ischemic stroke according to the metabolic health and obesity states in the Vascular-Metabolic CUN cohort. Int. J. Stroke 2017, 12, 187–191. [Google Scholar] [CrossRef]
- Su, W.Y.; Chen, S.C.; Huang, Y.T.; Huang, J.C.; Wu, P.Y.; Hsu, W.H.; Lee, M.Y. Comparison of the Effects of Fasting Glucose, Hemoglobin A1c, and Triglyceride-Glucose Index on Cardiovascular Events in Type 2 Diabetes Mellitus. Nutrients 2019, 11, 2838. [Google Scholar] [CrossRef] [Green Version]
- Zhao, S.; Yu, S.; Chi, C.; Fan, X.; Tang, J.; Ji, H.; Teliewubai, J.; Zhang, Y.; Xu, Y. Association between macro-and microvascular damage and the triglyceride glucose index in community-dwelling elderly individuals: The Northern Shanghai Study. Cardiovasc Diabetol. Cardiovasc. Diabetol. 2019, 18, 95. [Google Scholar] [CrossRef]
- Lee, M.Y.; Hsiao, P.J.; Huang, J.C.; Hsu, W.H.; Chen, S.C.; Chang, J.M.; Shin, S.J. Associations between Triglyceride/High-Density Lipoprotein Cholesterol Ratio and Micro- and Macroangiopathies in Type 2 Diabetes Mellitus. Endocr. Pract. 2018, 24, 615–621. [Google Scholar] [CrossRef] [PubMed]
- Vickery, S.; Stevens, P.E.; Dalton, R.N.; van Lente, F.; Lamb, E.J. Does the ID-MS traceable MDRD equation work and is it suitable for use with compensated Jaffe and enzymatic creatinine assays? Nephrol. Dial. Transplant. 2006, 21, 2439–2445. [Google Scholar] [CrossRef] [PubMed]
- Levey, A.S.; Bosch, J.P.; Lewis, J.B.; Greene, T.; Rogers, N.; Roth, D. A more accurate method to estimate glomerular filtration rate from serum creatinine: A new prediction equation. Modification of Diet in Renal Disease Study Group. Ann. Intern. Med. 1999, 130, 461–470. [Google Scholar] [CrossRef]
- Watkins, P.J. Retinopathy. BMJ 2003, 326, 924–926. [Google Scholar] [CrossRef] [PubMed]
- Tsai, H.J.; Huang, J.C.; Tsai, Y.C.; Chen, L.I.; Chen, S.C.; Chang, J.M.; Chen, H.C. Association between albumin and C-reactive protein and ankle-brachial index in haemodialysis. Nephrology (Carlton) 2018, 23, 5–10. [Google Scholar] [CrossRef] [PubMed] [Green Version]
- Chen, S.C.; Chen, C.F.; Huang, J.C.; Lee, M.Y.; Chen, J.H.; Chang, J.M.; Hwang, S.J.; Chen, H.C. Link between Peripheral Artery Disease and Heart Rate Variability in Hemodialysis Patients. PLoS ONE 2015, 10, e0120459. [Google Scholar] [CrossRef] [PubMed]
- Tomiyama, H.; Yamashina, A.; Arai, T.; Hirose, K.; Koji, Y.; Chikamori, T.; Hori, S.; Yamamoto, Y.; Doba, N.; Hinohara, S. Influences of age and gender on results of noninvasive brachial-ankle pulse wave velocity measurement—A survey of 12517 subjects. Atherosclerosis 2003, 166, 303–309. [Google Scholar] [CrossRef]
- Yamashina, A.; Tomiyama, H.; Takeda, K.; Tsuda, H.; Arai, T.; Hirose, K.; Koji, Y.; Hori, S.; Yamamoto, Y. Validity, reproducibility, and clinical significance of noninvasive brachial-ankle pulse wave velocity measurement. Hypertens. Res. 2002, 25, 359–364. [Google Scholar] [CrossRef] [Green Version]
- Yokoyama, H.; Shoji, T.; Kimoto, E.; Shinohara, K.; Tanaka, S.; Koyama, H.; Emoto, M.; Nishizawa, Y. Pulse wave velocity in lower-limb arteries among diabetic patients with peripheral arterial disease. J. Atheroscler. Thromb. 2003, 10, 253–258. [Google Scholar] [CrossRef] [Green Version]
- Lee, S.H.; Kwon, H.S.; Park, Y.M.; Ha, H.S.; Jeong, S.H.; Yang, H.K.; Lee, J.H.; Yim, H.W.; Kang, M.I.; Lee, W.C.; et al. Predicting the development of diabetes using the product of triglycerides and glucose: The Chungju Metabolic Disease Cohort (CMC) study. PLoS ONE 2014, 9, e90430. [Google Scholar] [CrossRef]
- Jian, S.; Su-Mei, N.; Xue, C.; Jie, Z.; Xue-Sen, W. Association and interaction between triglyceride–glucose index and obesity on risk of hypertension in middle-aged and elderly adults. Clin. Exp. Hypertens. 2017, 39, 732–739. [Google Scholar] [CrossRef] [PubMed]
- Zheng, R.; Mao, Y. Triglyceride and glucose (TyG) index as a predictor of incident hypertension: A 9-year longitudinal population-based study. Lipids Health Dis. 2017, 16, 175. [Google Scholar] [CrossRef] [PubMed] [Green Version]
- Sánchez-Íñigo, L.; Navarro-González, D.; Fernández-Montero, A.; Pastrana-Delgado, J.; Martínez, J.A. The TyG index may predict the development of cardiovascular events. Eur. J. Clin. Investig. 2016, 46, 189–197. [Google Scholar] [CrossRef] [PubMed]
- Liang, S.; Cai, G.Y.; Chen, X.M. Clinical and pathological factors associated with progression of diabetic nephropathy. Nephrology 2017, 22, 14–19. [Google Scholar] [CrossRef] [Green Version]
- Shang, J.; Yu, D.; Cai, Y.; Wang, Z.; Zhao, B.; Zhao, Z.; Simmons, D. The triglyceride glucose index can predict newly diagnosed biopsy-proven diabetic nephropathy in type 2 diabetes: A nested case control study. Medicine 2019, 98, e17995. [Google Scholar] [CrossRef]
- Catalano, C.; Muscelli, E.; Quiñones Galvan, A.; Baldi, S.; Masoni, A.; Gibb, I.; Torffvit, O.; Seghieri, G.; Ferrannini, E. Effect of insulin on systemic and renal handling of albumin in nondiabetic and NIDDM subjects. Diabetes 1997, 46, 868–875. [Google Scholar] [CrossRef]
- Tucker, B.J.; Anderson, C.M.; Thies, R.S.; Collins, R.C.; Blantz, R.C. Glomerular hemodynamic alterations during acute hyperinsulinemia in normal and diabetic rats. Kidney Int. 1992, 42, 1160–1168. [Google Scholar] [CrossRef] [Green Version]
- Cohen, A.J.; McCarthy, D.M.; Stoff, J.S. Direct hemodynamic effect of insulin in the isolated perfused kidney. Am. J. Physiol. 1989, 257, F580–F585. [Google Scholar] [CrossRef]
- Helal, I.; Fick-Brosnahan, G.M.; Reed-Gitomer, B.; Schrier, R.W. Glomerular hyperfiltration: Definitions, mechanisms and clinical implications. Nat. Rev. Nephrol. 2012, 8, 293. [Google Scholar] [CrossRef]
- Cai, X.L.; Fang, W.; Ji, L.N. Risk factors of diabetic retinopathy in type 2 diabetic patients. Chin. Med. J. 2006, 119, 822–826. [Google Scholar] [CrossRef]
- Mwendw, F.M.; Otieno, C.F.; Kayima, J.K.; Amayo, E.O.; Otieno, P.O. Risk factor profile and the occurrence of microvascular complications in short term type 2 diabetes mellitus at Kenyatta National Hospital, Nairobi. East Afr. Med. J. 2005, 82, S163–S172. [Google Scholar]
- Park, C.Y.; Park, S.E.; Bae, J.C.; Kim, W.J.; Park, S.W.; Ha, M.M.; Song, S.J. Prevalence of and risk factors for diabetic retinopathy in Koreans with type II diabetes: Baseline characteristics of Seoul Metropolitan City-Diabetes Prevention Program (SMC-DPP) participants. Br. J. Ophthalmol. 2012, 96, 151–155. [Google Scholar] [CrossRef] [PubMed]
- Anan, F.; Takayuki, M.; Takahashi, N.; Nakagawa, M.; Eshima, N.; Saikawa, T.; Yoshimatsu, H. Diabetic retinopathy is associated with insulin resistance and cardiovascular autonomic dysfunction in type 2 diabetic patients. Hypertens. Res. 2009, 32, 299. [Google Scholar] [CrossRef] [Green Version]
- Howard, B.V. Insulin resistance and lipid metabolism. Am. J. Cardiol. 1999, 84, 28–32. [Google Scholar] [CrossRef]
- Wong, T.Y.; Klein, R.; Islam, F.M.; Cotch, M.F.; Folsom, A.R.; Klein, B.E.; Sharrett, A.R.; Shea, S. Diabetic retinopathy in a multi-ethnic cohort in the United States. Am. J. Ophthalmol. 2006, 141, 446–455. [Google Scholar] [CrossRef] [Green Version]
- Lyons, T.J.; Jenkins, A.J.; Zheng, D.; Lackland, D.T.; McGee, D.; Garvey, W.T.; Klein, R.L. Diabetic retinopathy and serum lipoprotein subclasses in the DCCT/EDIC cohort. Investig. Ophthalmol. Vis. Sci. 2004, 45, 910–918. [Google Scholar] [CrossRef] [Green Version]
- Stratton, I.M.; Kohner, E.M.; Aldington, S.J.; Turner, R.C.; Holman, R.R.; Manley, S.E.; Matthews, D.R. UKPDS 50: Risk factors for incidence and progression of retinopathy in Type II diabetes over 6 years from diagnosis. Diabetologia 2001, 44, 156–163. [Google Scholar] [CrossRef] [Green Version]
- Wu, M.; Chen, Y.; Wilson, K.; Chirindel, A.; Ihnat, M.A.; Yu, Y.; Boulton, M.E.; Szweda, L.I.; Ma, J.X.; Lyons, T.J. Intraretinal leakage and oxidation of LDL in diabetic retinopathy. Investig. Ophthalmol. Vis. Sci. 2008, 49, 2679–2685. [Google Scholar] [CrossRef]
- Simó, R.; García-Ramírez, M.; Higuera, M.; Hernández, C. Apolipoprotein A1 is overexpressed in the retina of diabetic patients. Am. J. Ophthalmol. 2009, 147, 319–325. [Google Scholar] [CrossRef]
- Vasques, A.C.J.; Novaes, F.S.; de Oliveira Mda, S.; Souza, J.R.; Yamanaka, A.; Pareja, J.C.; Tambascia, M.A.; Saad, M.J.; Geloneze, B. TyG index performs better than HOMA in a Brazilian population: A hyperglycemic clamp validated study. Diabetes Res. Clin. Pract. 2011, 93, e98–e100. [Google Scholar] [CrossRef] [Green Version]
- Palella, E.; Cimino, R.; Pullano, S.A.; Fiorillo, A.S.; Gulletta, E.; Brunetti, A.; Foti, D.P.; Greco, M. Laboratory Parameters of Hemostasis, Adhesion Molecules, and Inflammation in Type 2 Diabetes Mellitus: Correlation with Glycemic Control. Int. J. Environ. Res. Public Health 2020, 17, 300. [Google Scholar] [CrossRef] [PubMed] [Green Version]
- Lee, E.Y.; <monospace> </monospace>Yang, H.K.; Lee, J.; Kang, B.; Yang, Y.; Lee, S.H.; Ko, S.H.; Ahn, Y.B.; Cha, B.Y.; Yoon, K.H.; et al. Triglyceride glucose index, a marker of insulin resistance, is associated with coronary artery stenosis in asymptomatic subjects with type 2 diabetes. Lipids Health Dis. 2016, 15, 155. [Google Scholar] [CrossRef] [Green Version]
- Cho, Y.-R.; Ann, S.H.; Won, K.B.; Park, G.M.; Kim, Y.G.; Yang, D.H.; Kang, J.W.; Lim, T.H.; Kim, H.K.; Choe, J.; et al. Association between insulin resistance, hyperglycemia, and coronary artery disease according to the presence of diabetes. Sci. Rep. 2019, 9, 1–7. [Google Scholar] [CrossRef] [PubMed] [Green Version]
- Cholesterol Treatment Trialists’ (CTT) Collaborators; Kearney, P.M.; Blackwell, L.; Collins, R.; Keech, A.; Simes, J.; Peto, R.; Armitage, J.; Baigent, C.; Keech, A. Efficacy of cholesterol-lowering therapy in 18,686 people with diabetes in 14 randomised trials of statins: A meta-analysis. Lancet 2008, 371, 117–125. [Google Scholar] [CrossRef]
- Keech, A.; Simes, R.J.; Barter, P.; Best, J.; Scott, R.; Taskinen, M.R.; Forder, P.; Pillai, A.; Davis, T.; Glasziou, P.; et al. Effects of long-term fenofibrate therapy on cardiovascular events in 9795 people with type 2 diabetes mellitus (the FIELD study): Randomised controlled trial. Lancet 2005, 366, 1849–1861. [Google Scholar] [CrossRef]
- American Diabetes Association. Peripheral arterial disease in people with diabetes. Diabetes Care 2003, 26, 3333–3341. [Google Scholar] [CrossRef] [Green Version]
- Marso, S.P.; Hiatt, W.R. Peripheral arterial disease in patients with diabetes. J. Am. Coll. Cardiol. 2006, 47, 921–929. [Google Scholar] [CrossRef] [Green Version]
- Vonbank, A.; Saely, C.H.; Rein, P.; Drexel, H. Insulin resistance is significantly associated with the metabolic syndrome, but not with sonographically proven peripheral arterial disease. Cardiovasc. Diabetol. 2013, 12, 106. [Google Scholar] [CrossRef] [Green Version]
- Pande, R.L.; Perlstein, T.S.; Beckman, J.A.; Creager, M.A. Association of insulin resistance and inflammation with peripheral arterial disease: The National Health and Nutrition Examination Survey, 1999 to 2004. Circulation 2008, 118, 33–41. [Google Scholar] [CrossRef] [Green Version]
- Britton, K.A.; Mukamal, K.J.; Ix, J.H.; Siscovick, D.S.; Newman, A.B.; de Boer, I.H.; Thacker, E.L.; Biggs, M.L.; Gaziano, J.M.; Djoussé, L. Insulin resistance and incident peripheral artery disease in the Cardiovascular Health Study. Vasc. Med. 2012, 17, 85–93. [Google Scholar] [CrossRef] [Green Version]

| Characteristics | Quartile 1 | Quartile 2 | Quartile 3 | Quartile 4 |
|---|---|---|---|---|
| (<8.7) | (≥8.7, <9.1) | (≥9.1, <9.5) | (≥9.5) | |
| n = 497 | n = 499 | n = 495 | n = 499 | |
| TyG index | 8.3 ± 0.3 | 8.9 ± 0.1 a | 9.3 ± 0.1 ab | 10.0 ± 0.5 abc |
| Age (years) | 64.4 ± 12.1 | 64.7 ± 10.5 | 64.1 ± 11.4 | 63.1 ± 11.2 |
| Male (%) | 45.9 | 46.1 | 38.6 | 41.5 |
| Systolic blood pressure (mmHg) | 132.9 ± 19.6 | 134.3 ± 18.2 | 135.6 ± 17.5 | 136.8 ± 19.5 a |
| Diastolic blood pressure (mmHg) | 75.2 ± 10.6 | 78.1 ± 11.1 a | 78.2 ± 10.8 a | 79.8 ± 12.3 a |
| Pulse pressure (mmHg) | 57.7 ± 16.4 | 56.2 ± 14.7 | 57.4 ± 14.6 | 57.0 ± 15.3 |
| Body mass index (kg/m2) | 24.8 ± 3.4 | 26.0 ± 3.6 a | 26.2 ± 3.5 a | 26.4 ± 3.6 a |
| Waist circumference (cm) | 89.4 ± 47.8 | 90.1 ± 9.6 | 92.3 ± 40.8 | 90.8 ± 9.2 |
| Laboratory parameters | ||||
| Fasting glucose (mg/dL) | 115.6 ± 30.3 | 134.6 ± 31.6 a | 154.4 ± 41.9 ab | 189.5 ± 62.6 abc |
| HbA1c (%) | 7.0 ± 1.2 | 7.3 ± 1.3 a | 7.7 ± 1.5 ab | 8.6 ± 2.0 abc |
| TG (mg/dL) | 77.0 ± 23.0 | 114.2 ± 27.4 a | 149.7 ± 38.7 ab | 278.7 ± 217.8 abc |
| Total cholesterol (mg/dL) | 172.0 ± 30.5 | 177.7 ± 29.8 a | 188.0 ± 34.7 ab | 204.9 ± 48.3 abc |
| eGFR (mL/min/1.73 m2) | 70.7 ± 19.0 | 69.3 ± 19.3 | 67.0 ± 19.8 a | 67.6 ± 20.4 |
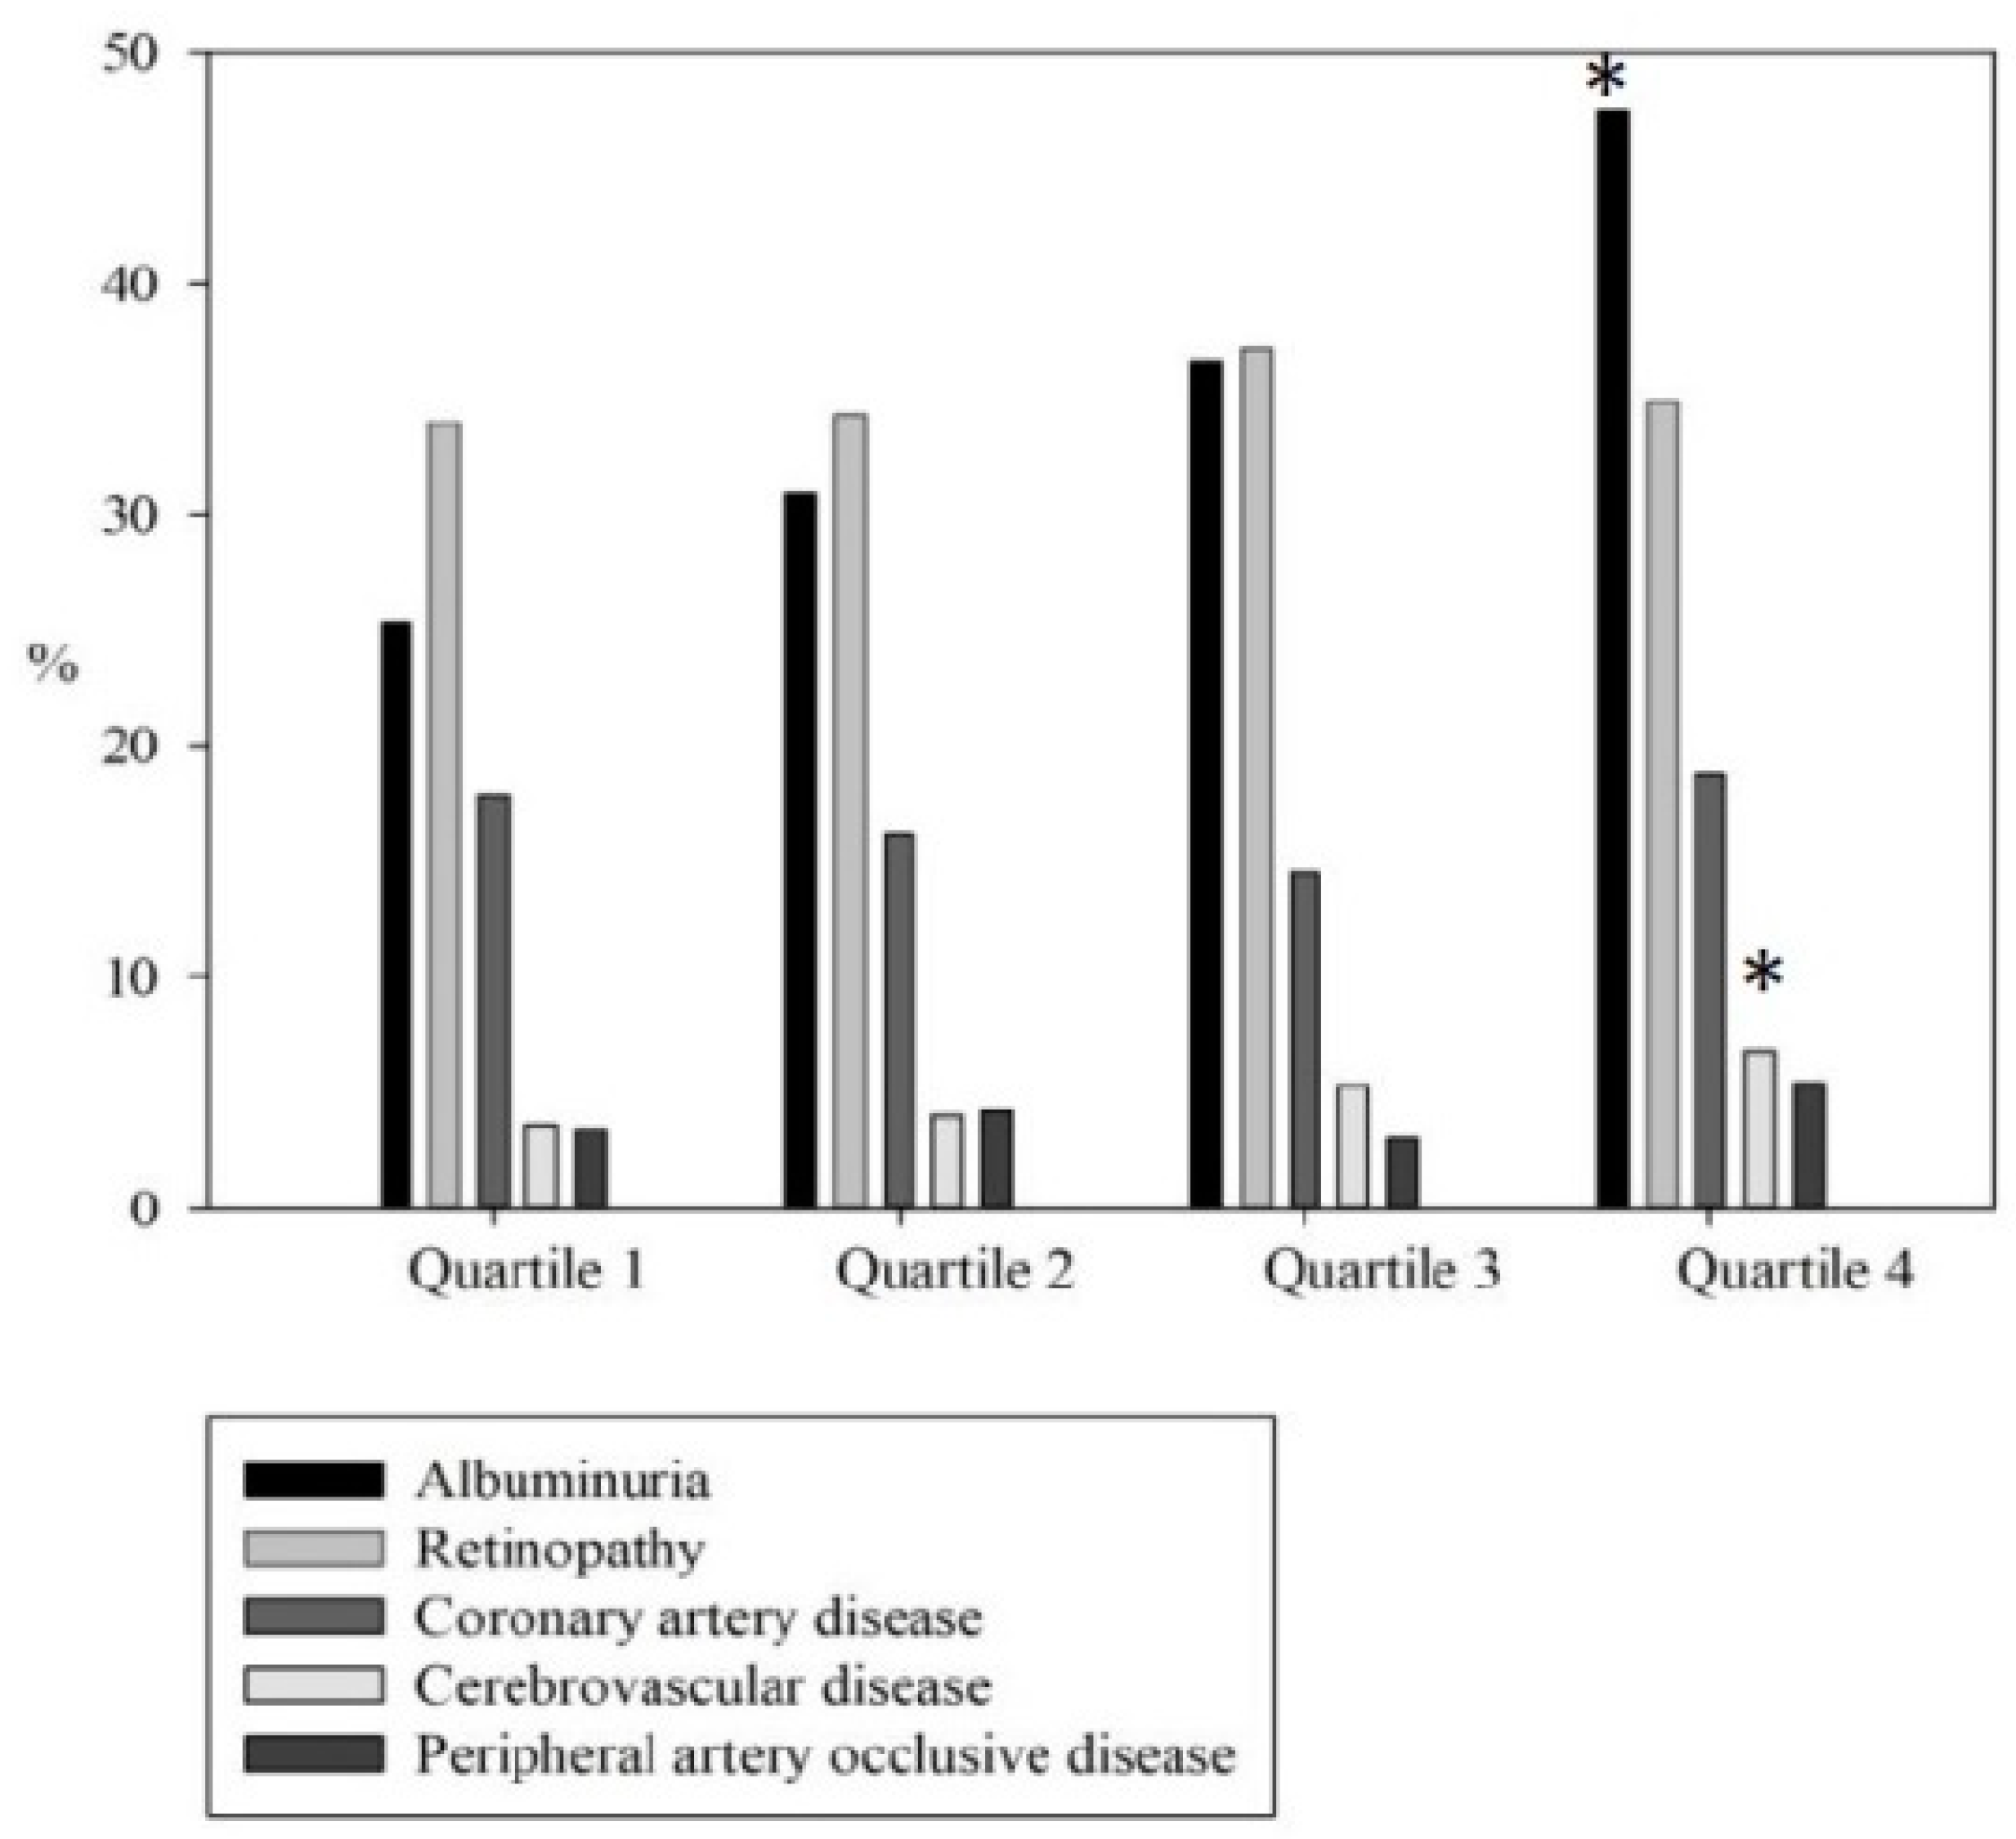
| Albuminuria ≥ 30 mg/g (%) | 25.4 | 30.9 | 36.6 a | 47.5 abc |
| DR (%) | 34.0 | 34.3 | 37.2 | 34.9 |
| CAD (%) | 17.9 | 16.2 | 14.5 | 18.8 |
| CVA (%) | 3.6 | 4.0 | 5.3 | 6.8 |
| ABI < 0.9 (%) | 3.4 | 4.2 | 3.0 | 5.4 |
| Medications | ||||
| ACEI and/or ARB (%) | 70.2 | 75.6 | 73.8 | 74.8 |
| Statin use (%) | 46.6 | 58. 5 a | 63.3 a | 71.2 ab |
| Fibrate use (%) | 4.7 | 8.2 | 14.6 ab | 39.0 abc |
| Microangiopathies | Multivariate a | |
|---|---|---|
| OR (95% CI) | p | |
| Albuminuria ≥ 30 mg/g b | ||
| TyG index | ||
| Quartile 1 | Reference | |
| Quartile 2 | 1.215 (0.905–1.631) | 0.196 |
| Quartile 3 | 1.424 (1.062–1.910) | 0.018 |
| Quartile 4 | 1.948 (1.437–2.642) | <0.001 |
| Pulse pressure (per 10 mm Hg) | 1.171(1.096–1.251) | <0.001 |
| Body mass index ≥ 25 kg/m2 | 1.370 (1.115–1.683) | 0.003 |
| HbA1c (per 1%) | 1.172 (1.099–1.249) | <0.001 |
| eGFR (per 10 mL/min/1.73 m2) | 0.903(0.856–0.952) | <0.001 |
| DR c | ||
| Pulse pressure (per 10 mm Hg) | 1.139(1.068–1.215) | <0.001 |
| HbA1c (per 1%) | 1.106 (1.040–1.176) | 0.001 |
| Cholesterol (per 1 mg/dL) | 0.997 (0.995–1.000) | 0.044 |
| eGFR (per 10 mL/min/1.73 m2) | 0.882(0.838–0.929) | <0.001 |
| Macroangiopathies | Multivariate a | |
|---|---|---|
| OR (95% CI) | p | |
| CAD b | ||
| Age (per 1 year) | 1.062 (1.046–1.077) | <0.001 |
| Body mass index ≥ 25 kg/m2 | 1.380 (1.062–1.793) | 0.016 |
| Cholesterol (per 1 mg/dL) | 0.996 (0.992–0.999) | 0.020 |
| eGFR (per 10 mL/min/1.73 m2) | 0.917 (0.851–0.989) | 0.024 |
| CVA c | ||
| TyG index | ||
| Quartile 1 | Reference | |
| Quartile 2 | 1.127 (0.585–2.171) | 0.720 |
| Quartile 3 | 1.618 (0.862–3.038) | 0.134 |
| Quartile 4 | 2.264 (1.243–4.122) | 0.008 |
| Age (per 1 year) | 1.059 (1.036–1.082) | <0.001 |
| Male (vs female) | 1.686 (1.101–2.581) | 0.016 |
| ABI < 0.9 d | ||
| Age (per 1 year) | 1.048 (1.019–1.077) | 0.001 |
| eGFR (per 10 mL/min/1.73 m2) | 0.702 (0.607–0.811) | <0.001 |
© 2020 by the authors. Licensee MDPI, Basel, Switzerland. This article is an open access article distributed under the terms and conditions of the Creative Commons Attribution (CC BY) license (http://creativecommons.org/licenses/by/4.0/).
Share and Cite
Chiu, H.; Tsai, H.-J.; Huang, J.-C.; Wu, P.-Y.; Hsu, W.-H.; Lee, M.-Y.; Chen, S.-C. Associations between Triglyceride-Glucose Index and Micro- and Macro-Angiopathies in Type 2 Diabetes Mellitus. Nutrients 2020, 12, 328. https://doi.org/10.3390/nu12020328
Chiu H, Tsai H-J, Huang J-C, Wu P-Y, Hsu W-H, Lee M-Y, Chen S-C. Associations between Triglyceride-Glucose Index and Micro- and Macro-Angiopathies in Type 2 Diabetes Mellitus. Nutrients. 2020; 12(2):328. https://doi.org/10.3390/nu12020328
Chicago/Turabian StyleChiu, Hsuan, Hui-Ju Tsai, Jiun-Chi Huang, Pei-Yu Wu, Wei-Hao Hsu, Mei-Yueh Lee, and Szu-Chia Chen. 2020. "Associations between Triglyceride-Glucose Index and Micro- and Macro-Angiopathies in Type 2 Diabetes Mellitus" Nutrients 12, no. 2: 328. https://doi.org/10.3390/nu12020328