Article

Alteration of Microbiome Profile by D-Allulose in Amelioration of High-Fat-Diet-Induced Obesity in Mice

1
Department of Food Science and Nutrition, Kyungpook National University, 1370 San-Kyuk Dong Puk-Ku, Daegu 41566, Korea
2
Center for Food and Nutritional Genomics Research, Kyungpook National University, 1370 San-Kyuk Dong Puk-Ku, Daegu 41566, Korea
3
Department of Advanced Green Energy and Environment, Handong Global University, Gyeongbuk, Pohang 37554, Korea
*
Author to whom correspondence should be addressed.
These authors contributed equally to this work.
Nutrients 2020, 12(2), 352; https://doi.org/10.3390/nu12020352
Submission received: 16 December 2019 / Revised: 17 January 2020 / Accepted: 28 January 2020 / Published: 29 January 2020

Abstract

:
Recently, there has been a global shift in diet towards an increased intake of energy-dense foods that are high in sugars. D-allulose has received attention as a sugar substitute and has been reported as one of the anti-obesity food components; however, its correlation with the intestinal microbial community is not yet completely understood. Thirty-six C57BL/6J mice were divided in to four dietary groups and fed a normal diet (ND), a high-fat diet (HFD, 20% fat, 1% cholesterol, w/w), and a HFD with 5% erythritol (ERY) and D-allulose (ALL) supplement for 16 weeks. A pair-feeding approach was used so that all groups receiving the high-fat diet would have the same calorie intake. As a result, body weight and body fat mass in the ALL group were significantly decreased toward the level of the normal group with a simultaneous decrease in plasma leptin and resistin. Fecal short-chain fatty acid (SCFA) production analysis revealed that ALL induced elevated total SCFA production compared to the other groups. Also, ALL supplement induced the change in the microbial community that could be responsible for improving the obesity based on 16S rRNA gene sequence analysis, and ALL significantly increased the energy expenditure in Day(6a.m to 6pm). Taken together, our findings suggest that 5% dietary ALL led to an improvement in HFD-induced obesity by altering the microbiome community.

1. Introduction

Obesity is a serious global health issue that, in combination with other risk factors, is increasing the prevalence of metabolic diseases [1,2,3,4,5]. Besides fat, sugar is one of the dietary factors responsible for obesity in modern society [4,5]. Among the different types of sugar, high fructose intake is particularly problematic because, unlike glucose, fructose does not stimulate insulin secretion from pancreatic β-cells or circulating leptin levels and fails to stimulate satiety signaling [6,7,8]. Persistent dysregulation of food intake and energy homeostasis due to reduced insulin and leptin signals can accelerate energy intake, weight gain, and obesity [9].
Numerous studies targeting the prevention and treatment of obesity have incorporated prebiotics, probiotics, or synbiotics as co-adjuvants [10,11,12,13,14]. The basis for this approach is the experimental evidence showing that modifying the gut microbiome in rodents ameliorates insulin sensitivity and decreases body weight and fat mass [12,13,14]. Furthermore, there is mounting evidence that the gut microbiota plays an essential role in energy harvesting and host metabolism, suggesting a link between the gut microbiota composition and metabolic diseases, such as obesity and type 2 diabetes [12,15,16]. The production of short-chain fatty acids (SCFAs) through non-digestible carbohydrates is one of the ways in which the microbiome regulates the energy expenditure (EE) and metabolism within the host [17,18]. These findings support the idea that prebiotics, probiotics, or synbiotics may ameliorate obesity through the modulation of the gut microbiome.
D-allulose, a C-3 epimer of D-fructose, is a sugar substitute, which has 70% of the sweetness of sucrose but almost zero calories and is rarely found in nature [19]. It is only present in small quantities in commercial mixtures of d-glucose and D-fructose obtained from the hydrolysis of sucrose or the isomerization of d-glucose. Several studies have provided preliminary evidence on the impact of D-allulose on lipid metabolism in animal and human models [20,21,22]. However, the mechanism underlying the microbial action of D-allulose is still not clear. In our past study with a diet-induced obesity (DIO) mouse model, D-allulose supplementation suppressed lipid absorption in the small intestine and increased the fecal lipid contents [22]. Thus, we assumed that D-allulose would improve DIO by altering the gut microbiome profile due to the gut bacteria and diet interactions, and then we performed an animal feeding study and evaluated both the biochemical composition of the microbiome by differentially abundant genera [23,24,25].

2. Methods

2.1. Animals and Diets

A total of 40 male C57BL/6J mice (4 weeks old) were purchased from the Jackson Laboratory (Bar Harbor, ME, USA). The animals were maintained in a room with a controlled temperature (20–23 °C) and lighting (12/12 h light–dark cycle) and fed a pelletized commercial non-purified diet for 1 week after arrival. The mice were then randomly divided into four groups (n = 9) and fed the respective experimental diets for 16 weeks, as shown in Table 1: normal diet control (ND, American Institute of Nutrition AIN-76 semi-synthetic diet); high-fat diet control (HFD, 20% fat plus 1% cholesterol based on the AIN-76 diet); 5% erythritol (ERY, 5% erythritol substituted for sucrose in HFD, w/w), and 5% D-allulose (ALL, 5% D-allulose substituted for sucrose in HFD, w/w). D-allulose was purchased from Sigma–Aldrich (St. Louis, MO, USA). The HFD was formulated to provide 39.5% of the total energy from fat, by replacing carbohydrate energy with lard and corn oil, and had the same amounts of vitamins and minerals per kilojoule as the ND. The ALL group was fed the D-allulose diet. The HFD and ERY groups were fed iso-caloric diets based on the energy intake of the ALL group in a pair-fed manner. The mice had free access to distilled water during the experimental period. Food intake was recorded daily and body weight was monitored every 2 weeks. The SYRCLE’s risk of bias was performed as described in the Supplementary Table S1. All animal procedures were approved by the Ethics Committee for Animal Studies at Kyungpook National University, Daegu, Republic of Korea (Approval No. KNU-2016-130).

2.2. Plasma Lipid Profile Analysis

The plasma-free fatty acid, apolipoprotein A-I (ApoA-1), and apolipoprotein B (ApoB) levels were measured using a Nittobo enzymatic kit (Nittobo Medical Co., Tokyo, Japan). The plasma HDL-cholesterol (HDL-C), triglyceride (TG), and total cholesterol (total-C) levels were determined using commercially available enzymatic kits (Asan, Seoul, South Korea).

2.3. Plasma Adipokines Measurement

Plasma leptin, resistin, and adiponectin were determined using a multiplex detection kit from Bio-Rad (Hercules, CA, USA). All of the samples were assayed in duplicate and analyzed using a Luminex® 200 LabMAP™ system (Luminex, Austin, TX, USA). The data analyses were performed using the Bio-Plex Manager software version 4.1.1 (Bio-Rad).

2.4. EE and Whole-Body Oxygen Consumption

EE was measured using an indirect calorimeter (Oxylet; Panlab, Cornella, Spain). The mice were placed into individual metabolic chambers at 25 °C, with free access to food and water. O2 and CO2 analyzers were calibrated with highly purified gas standards. Whole-body oxygen consumption (Vo2) and carbon dioxide production (Vco2) were recorded at 3-min intervals using a computer-assisted data acquisition program (Chart 5.2; AD Instruments, Sydney, Australia) over a 24-h period. The data were averaged for each mouse. EE was calculated as follows: EE (kcal/day/ [kg of body weight × 0.75]) = Vo2 × 1.44 × [3.815 + (1.232 × Vo2/Vco2)].

2.5. Histopathology Analysis

Liver and epididymal white adipose tissue (eWAT) were removed from mice and fixed in a buffer solution of 10% formalin. All fixed tissues were processed routinely for paraffin embedding. Sections of 4 mm in thickness were prepared and stained with hematoxylin–eosin and Masson’s trichrome (MT). The stained areas were viewed under an optical microscope (Nikon, Tokyo, Japan) with 200× magnification.

2.6. SCFA Analysis

All SCFAs were extracted from 50 mg of mice fecal sample in 500 μL of extraction buffer (0.1 M oxalic acid, 40 mM NaN3) with 0.3 g of zirconium beads. After bead-beating the sample for 3 min, the samples were incubated in a shaking incubator at room temperature for 1 h and centrifuged at 16,000× g at 25 °C for 5 min. according to Schwiertz et al. [25]. The supernatant of the centrifuged samples was collected and transferred to a transparent gas chromatography vial for analysis using a Shimadzu GC2010 (Agilent, Santa Clara, CA, USA) equipped with a flame ionization detector (FID) and HP INNOWax column (30 m × 32 mm). The operating conditions were as follows: column heated from 100 to 180 °C at the rate of 25 °C/min; splitter temperature 260 °C; FID temperature, 260 °C; pressure, 27.1 psi.

2.7. Microbiota Analysis

Fecal DNA was extracted using the QIAamp DNA Stool Mini Kit (Qiagen, Hilden, Germany). Briefly, 50 mg of feces was mixed vigorously with zircon/silica beads (BioSpec Products, Oklahoma, USA) for 3 min, and the remaining protocol proceeded as described in the manufacturer’s instructions. Microbial community profiling by 16S ribosomal RNA amplicon sequencing of 5 ng/μL of fecal DNA was performed using primers specifically targeting the 16S rRNA V3/V4 region. The PCR products were purified by PCR clean-up, according to the Illumina (San Diego, CA, USA) 16S Metagenomic Sequencing Library Preparation protocol. Dual indices were attached to the samples by using the Nextera XT Index Kit (FC-131-1002), and the indexed samples were sequenced on an Illumina MiSeq system. The raw data were visualized and analyzed for beta diversity, alpha diversity, and taxonomy using QIIME [26].

2.8. Statistical Analysis

All phenotype data are presented as the mean ± SE or SD. Statistical analysis was performed using SPSS software version 11.0 (SPSS, Inc., Chicago, IL, USA). The statistical differences between the ND and HFD results were determined by the Student’s t-test. One-way ANOVA was performed to compare the HFD groups, and Turkey’s multiple-range test was performed when significant differences were identified between the groups (p < 0.05).

3. Results

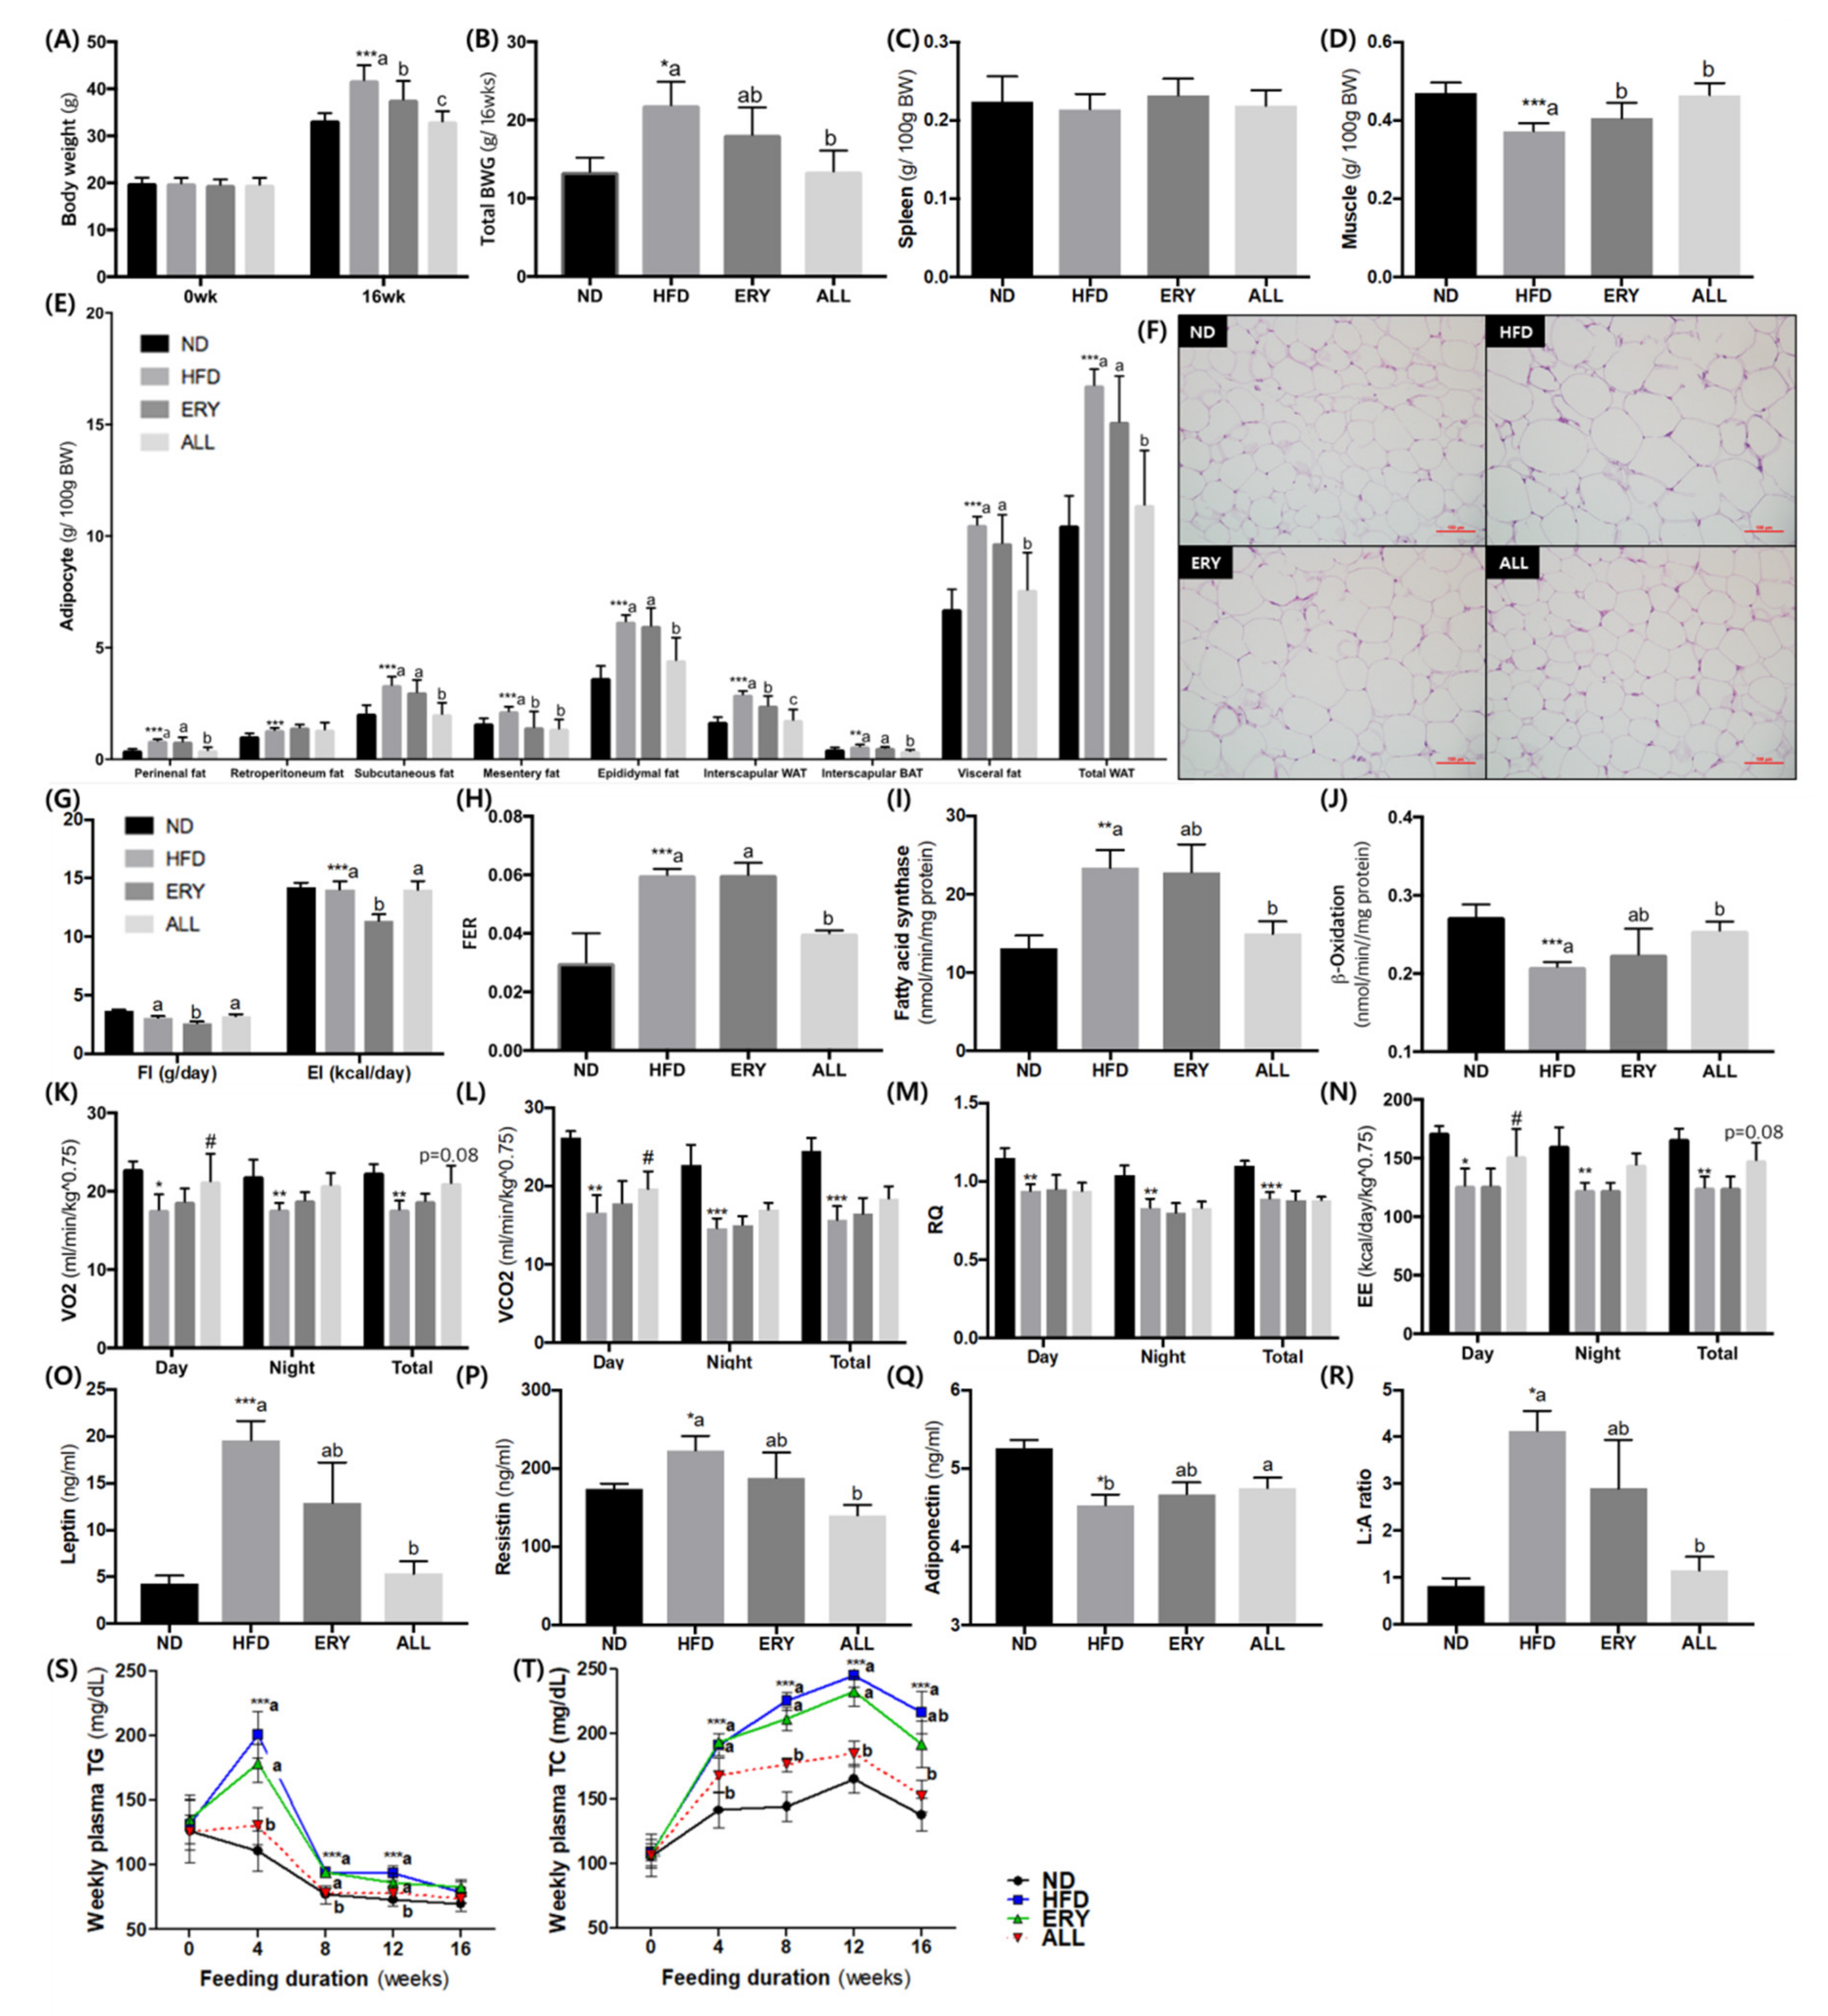
3.1. Anti-obesity Effects of D-Allulose Supplement in DIO Mice

At the end of the experimental period, HFD-fed mice were drastically increased in body weight relative to the ND group (Figure 1A). However, the ALL-fed animals had a lower body weight than the HFD and ERY groups due to the suppression of the total body weight gain (Figure 1A,B), which was similar among the animals fed HFD, ERY, and ND. Muscle weight increased after D-allulose supplementation for 16 weeks, whereas the spleen weight was comparable before and after the ALL diet (Figure 1C,D). In the comparison of fat mass, all types of adipocyte tissue in the HFD group weighed significantly more than in the ND group (Figure 1E) and, except for mesenteric fat, were dramatically lower in the ALL group than HFD group. These results are consistent with the epididymal morphology (Figure 1F).
The food intake and energy intake were significantly lower in the ERY group than the HFD and ALL groups, while the food efficiency ratio in the ALL group was significantly lower compared with the HFD and ERY groups (Figure 1G,H). Regarding the plasma lipid profiles among the groups of animals, the HFD group presented markedly elevated total-C, HDL-C, and non-HDL-C. In contrast, these three variables, as well as ApoA-1, were significantly decreased in the ALL group (Table 2). In eWAT, the activity of fatty acid synthase and β-oxidation activity was significantly decreased and increased, respectively, in the ALL group (Figure 1J). The metabolic rate measurements of VO2, VCO2, and EE per day were significantly increased in the ALL group relative to the HFD group (Figure 1K–N). While the adiponectin level was significantly higher in the ALL group, the leptin and resistin levels and the leptin–adiponectin ratio were significantly decreased compared with the HFD group.
We measured the concentration of TG and TC in collected plasma from the tail vein every 4 weeks during the experiment, and these results are shown in Figure 2S–T. From the fourth week to the 12th week of the D-allulose supplement, plasma TG concentration was significantly decreased in the ALL group compared to the other HFD groups. From the fourth week of the D-allulose supplement to the end of the experiment, plasma TC concentration was significantly decreased in ALL group compared to HFD group. The lipid profiles with plasma obtained after a 24-hour fast at sacrifice was showed in Table 2. Total-C, HDL-C, nonHDL-C and apo A-I levels were significantly decreased in ALL group compared to HFD group. Also, the FFA, TG and apo B levels and HTR showed a decreasing tendency in the ALL group.

3.2. Suppression of Fatty Liver by D-Allulose Supplement in DIO Mice

The increased liver weight and hepatic lipid levels, including TG, fatty acids, and cholesterol, caused by HFD feeding, were significantly suppressed by ALL supplementation (Figure 2A). Moreover, the enzyme activities related to lipid metabolism, such as fatty acid synthase, β-oxidation, cholesterol acyltransferase, and 3-hydroxy-3-methylglutaryl-CoA reductase, were significantly decreased by D-allulose supplementation (Figure 2E–H). Consistent with these results, the ALL treatment reduced the accumulation of lipid droplets in the hepatic tissue (Figure 2I). MT staining of liver tissue revealed fibrotic stained a blue color in the HFD and ERY group, whereas it was absent in the ND and the ALL group. In particular, the ALL group showed a similar appearance to that of the ND group.

3.3. Effects of D-Allulose on SCFA Production in DIO Mice

The results of SCFA production are presented in Figure 3. Although the production of butyrate showed an increasing tendency in the ALL group, there was no significant difference in the SCFA production between the ALL and HFD groups.

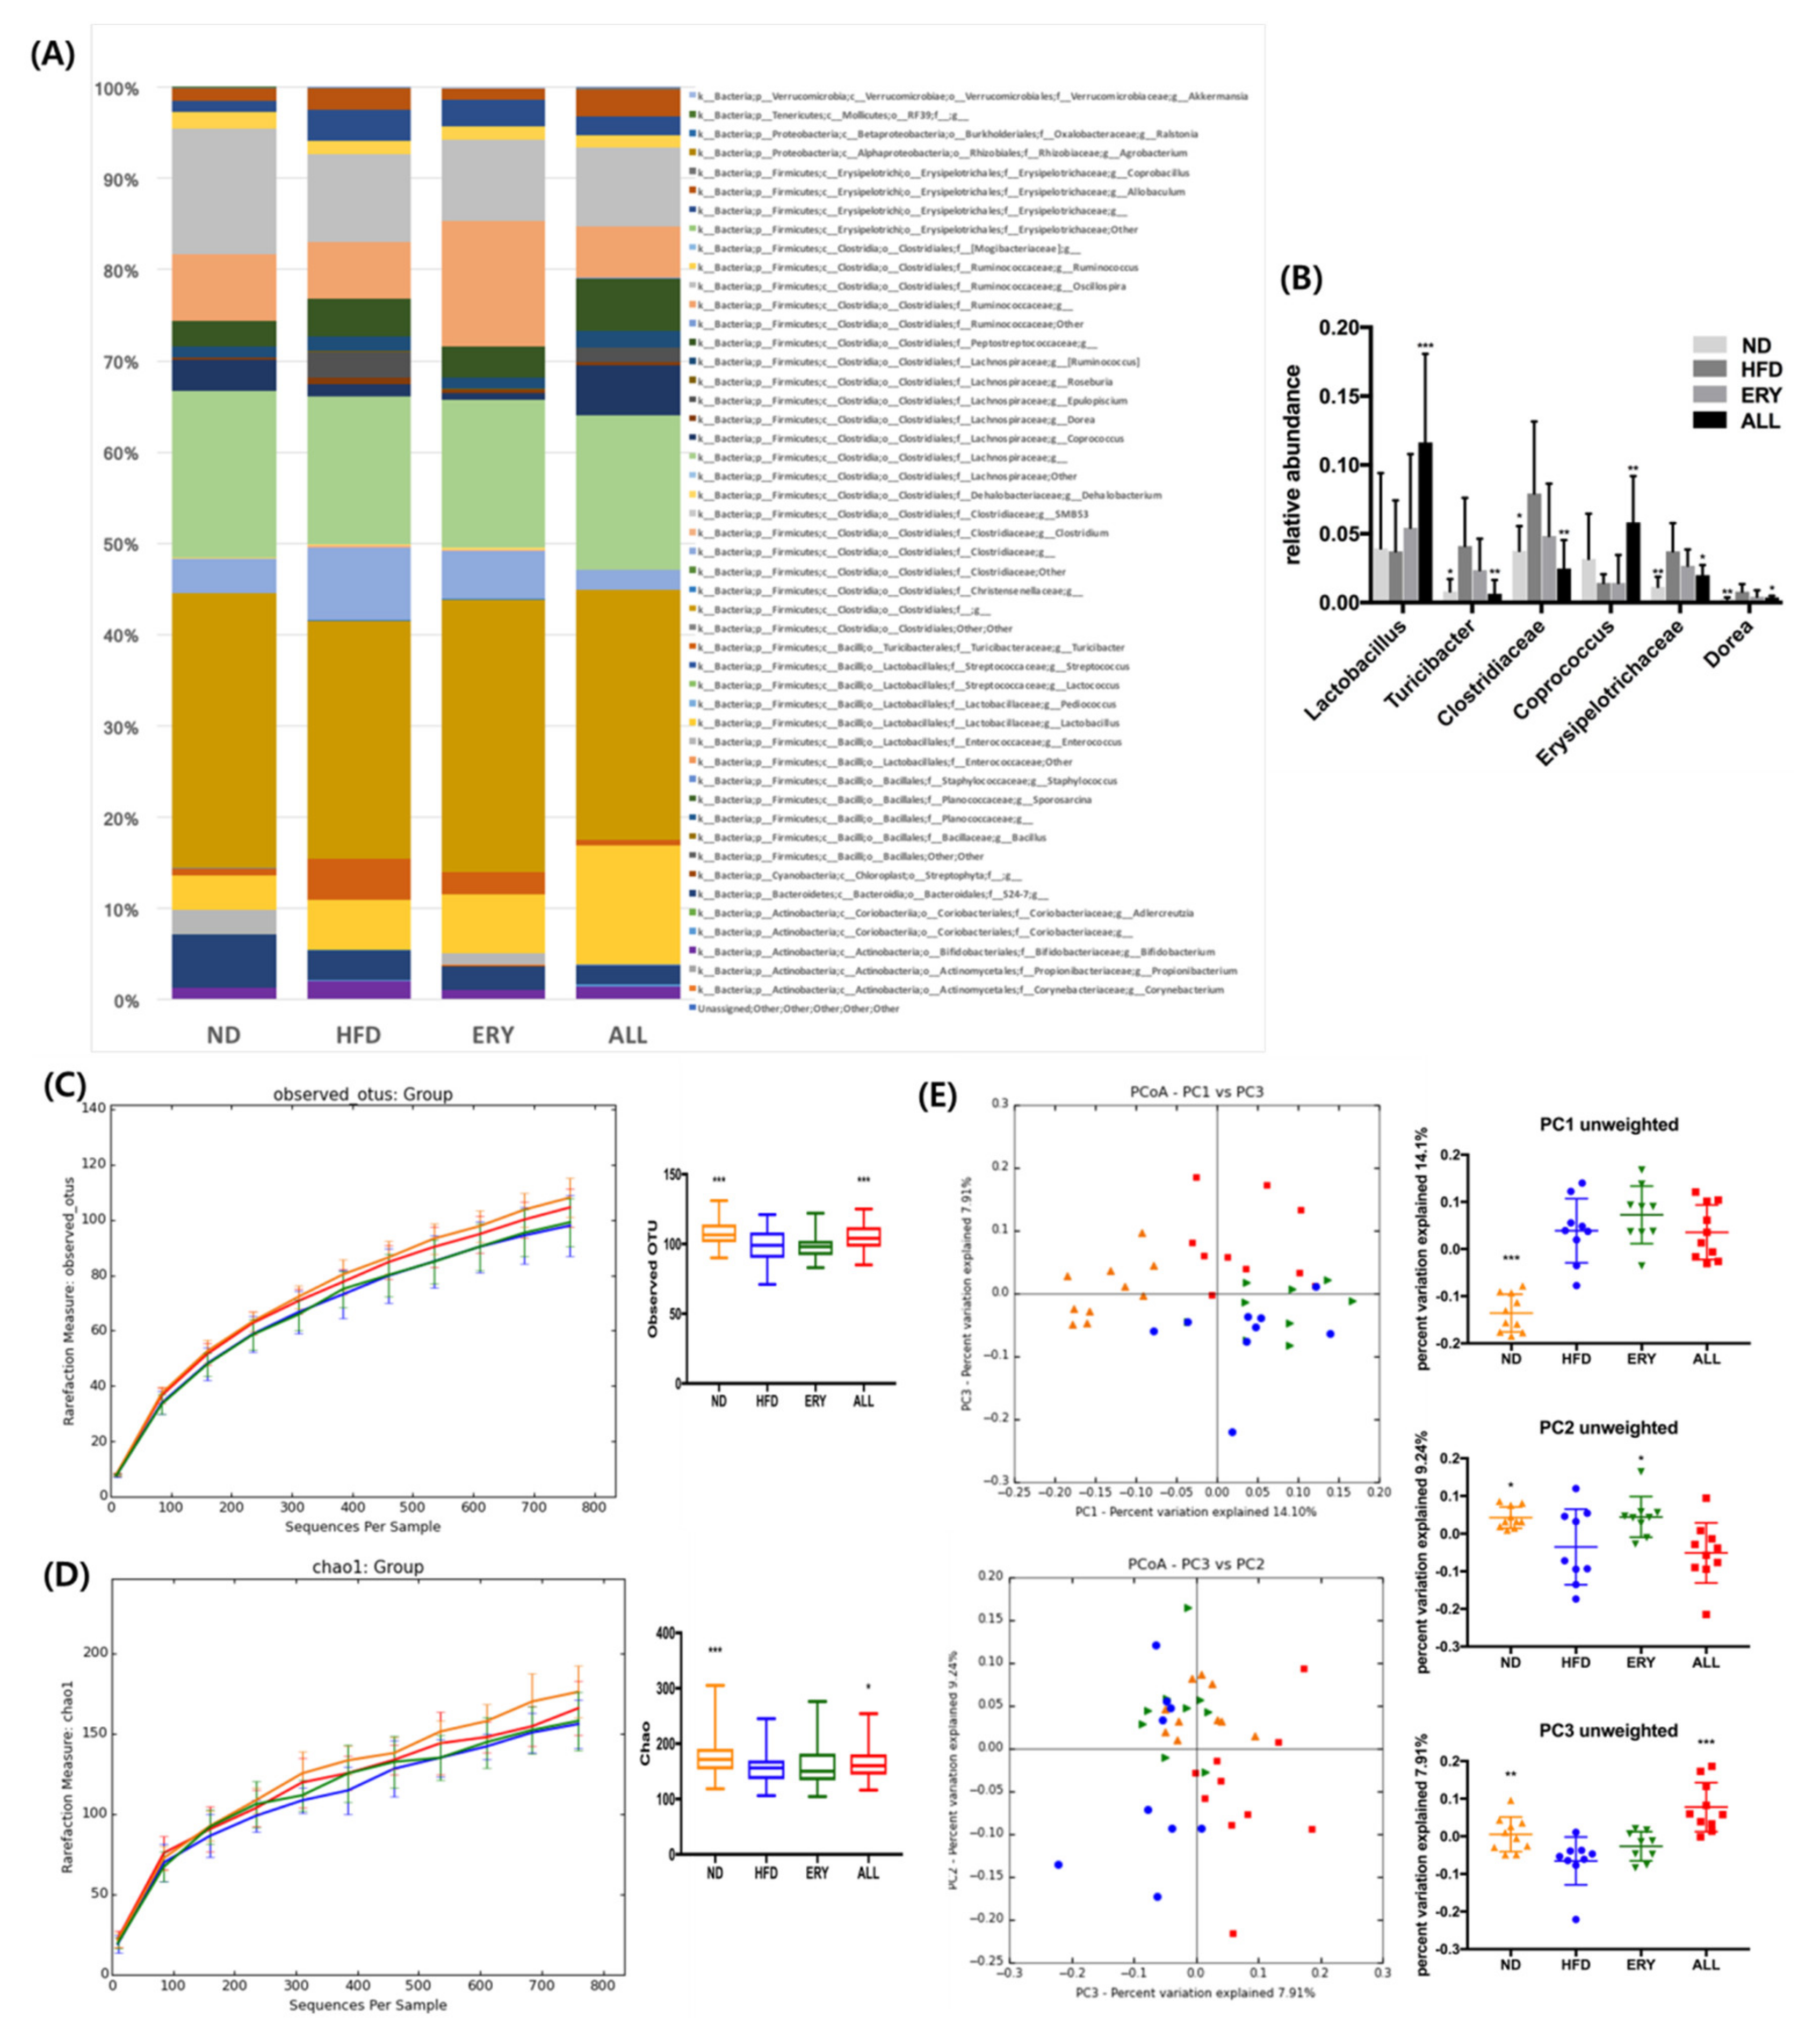
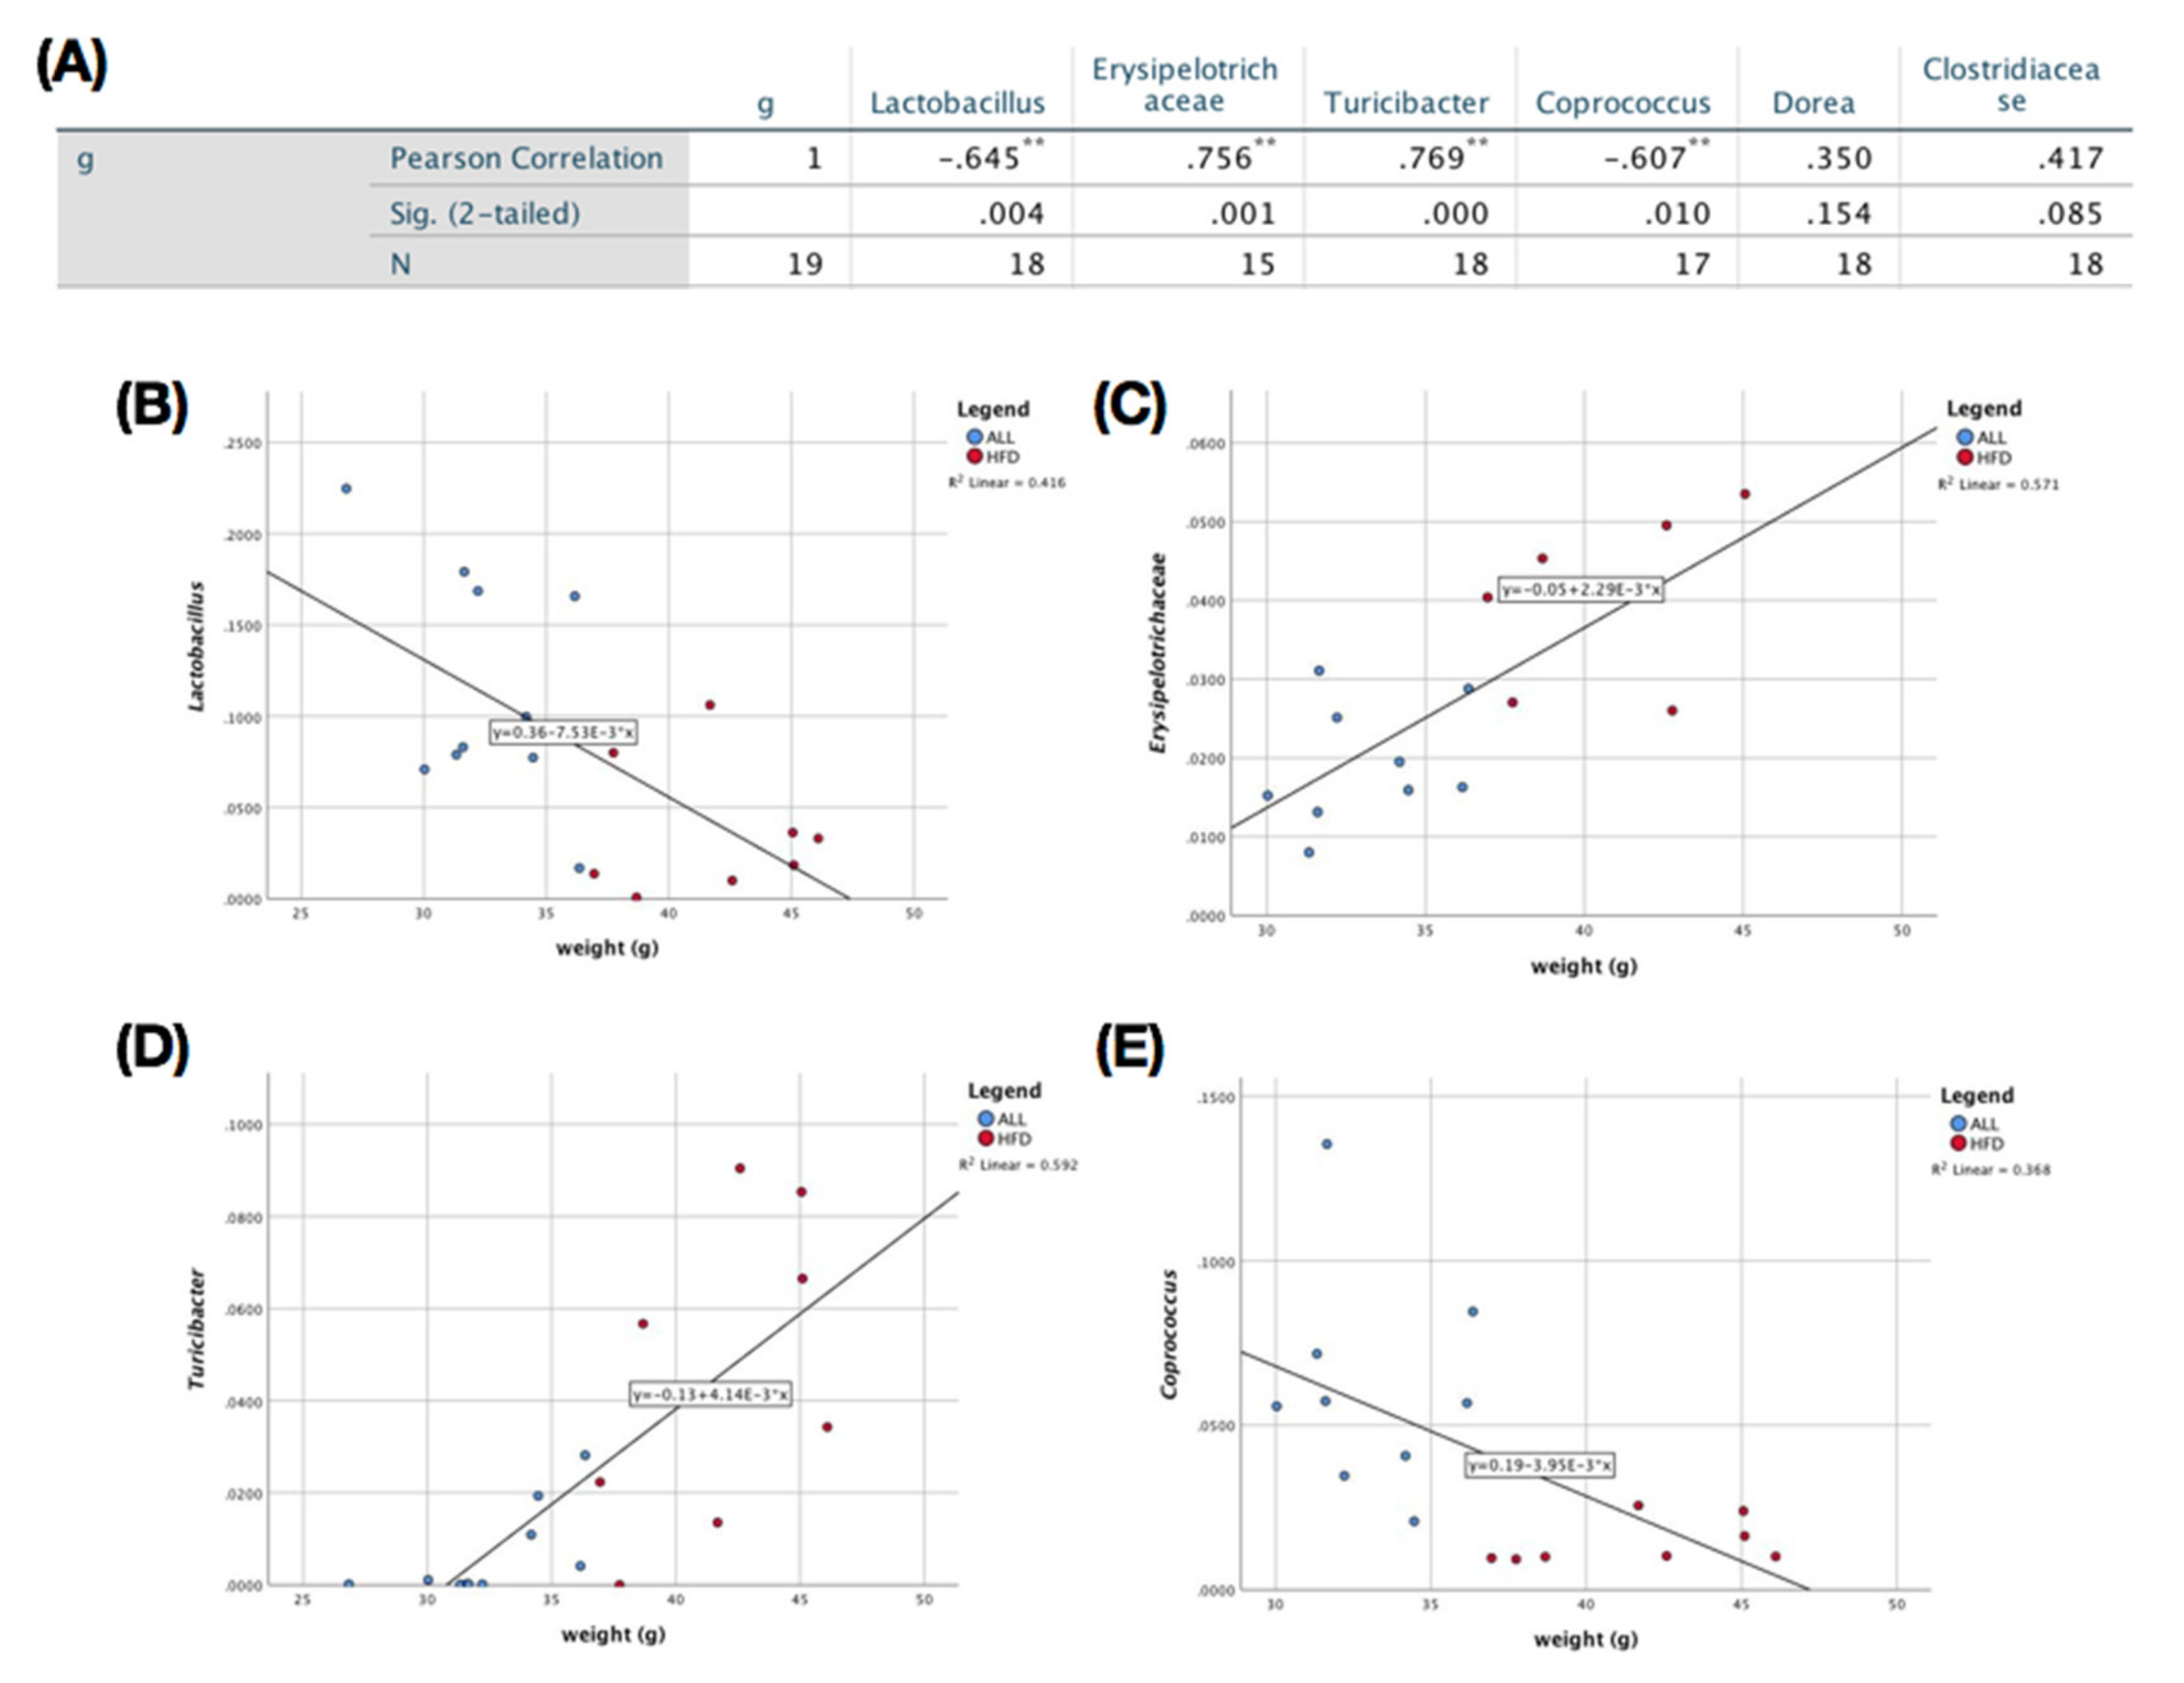
3.4. Effects of D-Allulose on Microbiome Modulation in DIO Mice

The microbiome taxonomy result is shown in Figure 4A, B. At the genus level, there was a significant increase in Lactobacillus, Coprococcus, and Coprobacillus, in addition to a significant reduction in Turicibacter, Clostridiaceae, Dorea, and Erysipelotrichaceae in the ALL group compared with the HFD control (Figure 4A,B). Animals fed ALL and ND had a significantly higher alpha-diversity relative to HFD in both the Chao 1 (estimated OTU (operational taxonomic unit) richness and evenness) and observed OTU (diversity richness), as seen in Figure 4C,D. Both the ALL and the ND group had a significantly different beta-diversity from HFD, according to PC3 of the coordinate plot (Figure 4E). All of the significantly changed bacteria in the ALL group compared with the HFD group were checked for Pearson’s correlation with the body weight difference in the mice. Body weight had a significantly positive correlation with the Turicibacter and Erysipelotrichaceae genera (Figure 5C,D) and a significantly negative correlation with Lactobacillus and Coprococcus (Figure 5B,E). Changes in Dorea and Clostridiaceae did not show any significant correlation with body weight (Figure 5A).

4. Discussion

Previous studies have suggested that D-allulose can reduce body fat by regulating lipid metabolism [15,16]. In the same manner, the present study showed that D-allulose supplementation drastically decreased the body weight (Figure 1A,B) and body fat mass, without any change in food intake (Figure 1G,H)). D-allulose significantly increased FA oxidation and significantly decreased FA synthesis in eWAT (Figure 1J). To support these results, we measured the metabolic rate, which showed that VO2 and EE were significantly increased in the D-allulose group (Figure 1K–N). Our results are in accordance with part of a past study, in which D-allulose significantly increased the β-oxidation activity and its related mRNA expression (CPT1α, CPT2) [22]. The acyl CoA, the metabolite of β-oxidation, can used as a fuel for energy expenditure [27]. Taken together, D-allulose may increase the energy expenditure via the regulation of the mRNA expression and enzyme activity of β-oxidation in eWAT.
SCFAs are produced through the complex interactions of diet and the gut microbiome [28]. The interaction of SCFAs can regulate the host energy homeostasis and be evaluated as novel therapeutic targets for DIO [29]. According to previous studies, SCFAs has diverse roles in DIO, such as enhancing FFA oxidation and promoting beige adipogenesis and mitochondrial biogenesis. In particular, SCFAs led to significant increases in the expressions of G-protein coupled receptor (GPR)43 and GPR41 in the adipose tissue, which may further result in body weight reduction by enhancing TG hydrolysis and FA oxidation. In our study, the SCFAs production per 50 mg of feces had an increasing tendency in the ALL group compared to the HFD groups. However, as the D-allulose supplement significantly increased the daily fecal weight, the total absolute amount of SCFA production, when adjusted with daily fecal weight, can be more than that of other groups. Thus, the increased SCFA production by D-allulose supplement may result in FA oxidation, which is in accordance with increased enzyme activity in FA oxidation in the ALL group.
An increased richness in the gut’s microbial diversity has been negatively correlated with obesity and various disease states [30,31]. Furthermore, animal studies have indicated that treatment with probiotics or prebiotics can be a promising approach to alleviate these pathophysiological symptoms, by modulating the gut microbial ecology [28,29]. Firstly, we could observe the increase in the absolute total SCFA amount, a subset of key gut microbial metabolite, in the ALL group and the difference in relative total SCFAs among the groups in feces. Secondly, through the treatment of HFD feeding with D-allulose, there was an increase in both the alpha- and the beta-diversity in the gut microbiota when compared with the HFD control group (Figure 4E). Our study also found a significant increase in the relative abundance of Lactobacillus, which is known to improve gut barrier integrity, and Coprococcus, a known butyrate and propionate producer [32,33]. The abundance of both of these genera decreased with HFD-only consumption and increased in the D-allulose-consuming group compared to all the other groups (Figure 4A,B). Furthermore, some genera and families that were found to be at greater levels in obesity, such as Dorea and Erysipelotrichaceae [34,35], were significantly decreased in the D-allulose-fed animals relative to the HFD group. In addition, we observed a significant positive correlation between the abundance of Erysipelotrichaceae and body weight (Figure 5C).
Excessive cholesterol can build up in the arteries, which can lead to coronary heart disease and many other serious conditions such as stroke, insulin resistance and so on [1,36,37]. A high-cholesterol diet is a one of the predisposing factors for high cholesterol levels in blood [38]. The present study showed that HFD-fed mice increased the plasma and hepatic cholesterol and HMG-CoA reductase and ACAT activities compared to ND-fed mice;however, D-allulose supplement drastically decreased those values. Also, fecal cholesterol concentration was drastically increased by HFD with D-allulose. According to our previous study, D-allulose inhibits the dietary lipid absorption by the suppression of the CD36 expression, which is an important factor in the uptake of cholesterol and FA. In comparison of plasma TG levels with D-allulose, there was no significant difference in plasma collected after sacrifice; however, from the fourth week to the 12th week of the D-allulose supplement, the plasma TG concentration was significantly decreased in the ALL group compared to the other HFD groups. Although D-allulose could reduce the plasma TG levels, plasma TG concentration in HFD groups at the endpoint of the experiment was decreased overall, which may be due to various factors. In order to elucidate the exact mechanism of its action, an additional study is required for the correlation among D-allulose, HFD and TG metabolism. Our findings suggest that D-allulose ameliorated the HFD induced dyslipidemia by altering the lipid metabolism and increasing the excretion of fecal lipids.
High-fructose-fed animal studies have suggested that an increase in hepatic insulin resistance and increased glucose tolerance lead to non-alcoholic fatty liver disease (NAFLD) and the loss of tight junction proteins [39,40,41]. The loss of integrity of the tight junctions allows the leakage of endotoxins, induction of hepatic inflammation, and is associated with decreased levels of Lactobacillus and Bacteroides in the gut microbiota [40,41,42,43,44]. Several studies have also proved that the administration of Lactobacillus species protected the host against the onset of fructose-induced NAFLD [42,43,44]. In our study, the decrease in hepatic steatosis coincides with the increasing Lactobacillus population in the D-allulose-fed mice (Figure 2J, Figure 4B). It may have contributed to the amelioration of fatty liver disease and weight loss, by strengthening the epithelial barrier, inhibiting endotoxin translocation, and alleviating overall systemic and hepatic inflammation. Accordingly, a future experiment will be performed to find out whether the increasing Lactobacillus population associated with D-allulose supplementation can improve the inflammation.

5. Conclusions

In the present study, D-allulose supplementation was markedly effective in protecting the host against HFD-induced obesity and hepatic steatosis. It is plausible that these pathologies are mediated by the alteration of the gut microbiome profile and enhanced energy expenditure. Our findings suggest that D-allulose can exert its biological effects through modulating the gut microbiome.

Supplementary Materials

The following are available online at https://www.mdpi.com/2072-6643/12/2/352/s1.

Author Contributions

Y.H. and H.P. performed the experiments, analyzed the data, and wrote/edited the manuscript. B.-R.C. performed the experiments. E.-Y.K. and Y.J. reviewed the manuscript. M.-S.C. supervised this work and had full access to all the data and therefore takes full responsibility for the integrity of the results and accuracy of the data analysis. All authors have read and agreed to the published version of the manuscript.

Funding

This study was supported by a grant from the National Research Foundation of Korea(NRF), funded by the Korean government(NRF-2016R1A2B4011329) and the BK21 Plus Program (Department of Food Science and Nutrition, Kyungpook National University, 22A20130000161) funded by the Ministry of Education (MOE, Korea) and National Research Foundation of Korea(NRF). Also, Kyungpook National University supported this study (201911530000).

Acknowledgments

The authors sincerely thank Wilhelm H. Holzapfel who is a professor of Advanced Green Energy and Environment Institute (AGEE) at Handong Global University, Republic of Korea for him excellent technical support.

Conflicts of Interest

The authors declare no conflict of interest.

References

  1. Yoon, K.-H.; Lee, J.-H.; Kim, J.-W.; Cho, J.H.; Choi, Y.-H.; Ko, S.-H.; Zimmet, P.; Son, H.-Y. Epidemic obesity and type 2 diabetes in Asia. Lancet 2006, 368, 1681–1688. [Google Scholar] [CrossRef]
  2. Mitchell, N.S.; Catenacci, V.A.; Wyatt, H.R.; Hill, J.O. Obesity: Overview of an epidemic. Psychiatr. Clin. 2011, 34, 717–732. [Google Scholar] [CrossRef] [PubMed]
  3. Ha, K.H.; Kim, D.J. Trends in the diabetes epidemic in Korea. Endocrinol. Metab. 2015, 30, 142–146. [Google Scholar] [CrossRef] [PubMed]
  4. Siervo, M.; Montagnese, C.; Mathers, J.C.; Soroka, K.R.; Stephan, B.C.; Wells, J.C. Sugar consumption and global prevalence of obesity and hypertension: an ecological analysis. Public Health Nutr. 2014, 17, 587–596. [Google Scholar] [CrossRef] [PubMed] [Green Version]
  5. Bray, G.A.; Popkin, B.M. Dietary sugar and body weight: Have we reached a crisis in the epidemic of obesity and diabetes? health be damned! Pour on the sugar. Diabetes Care 2014, 37, 950–956. [Google Scholar] [CrossRef] [PubMed] [Green Version]
  6. Teff, K.L.; Elliott, S.S.; Tschöp, M.; Kieffer, T.J.; Rader, D.; Heiman, M.; Townsend, R.R.; Keim, N.L.; D’Alessio, D.; Havel, P.J. Dietary fructose reduces circulating insulin and leptin, attenuates postprandial suppression of ghrelin, and increases triglycerides in women. J. Clin. Endocrinol. Metab. 2004, 89, 2963–2972. [Google Scholar] [CrossRef] [PubMed]
  7. Johnson, R.J.; Segal, M.S.; Sautin, Y.; Nakagawa, T.; Feig, D.I.; Kang, D.-H.; Gersch, M.S.; Benner, S.; Sánchez-Lozada, L.G. Potential role of sugar (fructose) in the epidemic of hypertension, obesity and the metabolic syndrome, diabetes, kidney disease, and cardiovascular disease. Am. J. Clin. Nutr. 2007, 86, 899–906. [Google Scholar]
  8. Basciano, H.; Federico, L.; Adeli, K. Fructose, insulin resistance, and metabolic dyslipidemia. Nutr. Metab. 2005, 2, 5. [Google Scholar] [CrossRef] [Green Version]
  9. Havel, P.J. Dietary fructose: Implications for dysregulation of energy homeostasis and lipid/carbohydrate metabolism. Nutr. Rev. 2005, 63, 133–157. [Google Scholar] [CrossRef]
  10. Pandey, K.R.; Naik, S.R.; Vakil, B.V. Probiotics, prebiotics and synbiotics-a review. J. Food Sci. Technol. 2015, 52, 7577–7587. [Google Scholar] [CrossRef]
  11. Molinaro, F.; Paschetta, E.; Cassader, M.; Gambino, R.; Musso, G. Probiotics, prebiotics, energy balance, and obesity: mechanistic insights and therapeutic implications. Gastroenterol. Clin. 2012, 41, 843–854. [Google Scholar] [CrossRef] [PubMed]
  12. Turnbaugh, P.J.; Ley, R.E.; Mahowald, M.A.; Magrini, V.; Mardis, E.R.; Gordon, J.I. An obesity-associated gut microbiome with increased capacity for energy harvest. Nature 2006, 444, 1027. [Google Scholar] [CrossRef] [PubMed]
  13. Ji, Y.; Park, S.; Park, H.; Hwang, E.; Shin, H.; Pot, B.; Holzapfel, W.H. Modulation of active gut microbiota by Lactobacillus rhamnosus GG in a diet induced obesity murine model. Front. Microbiol. 2018, 9, 710. [Google Scholar] [CrossRef] [PubMed]
  14. Delzenne, N.M.; Neyrinck, A.M.; Bäckhed, F.; Cani, P.D. Targeting gut microbiota in obesity: effects of prebiotics and probiotics. Nat. Rev. Endocrinol. 2011, 7, 639. [Google Scholar] [CrossRef]
  15. Murphy, E.; Cotter, P.; Healy, S.; Marques, T.M.; O’sullivan, O.; Fouhy, F.; Clarke, S.; O’toole, P.; Quigley, E.M.; Stanton, C. Composition and energy harvesting capacity of the gut microbiota: relationship to diet, obesity and time in mouse models. Gut 2010, 59, 1635–1642. [Google Scholar] [CrossRef]
  16. Kootte, R.; Vrieze, A.; Holleman, F.; Dallinga-Thie, G.M.; Zoetendal, E.G.; de Vos, W.M.; Groen, A.; Hoekstra, J.B.; Stroes, E.S.; Nieuwdorp, M. The therapeutic potential of manipulating gut microbiota in obesity and type 2 diabetes mellitus. Diabetes Obes. Metab. 2012, 14, 112–120. [Google Scholar] [CrossRef]
  17. Gao, Z.; Yin, J.; Zhang, J.; Ward, R.E.; Martin, R.J.; Lefevre, M.; Cefalu, W.T.; Ye, J. Butyrate improves insulin sensitivity and increases energy expenditure in mice. Diabetes 2009, 58, 1509–1517. [Google Scholar] [CrossRef] [Green Version]
  18. Canfora, E.E.; Jocken, J.W.; Blaak, E.E. Short-chain fatty acids in control of body weight and insulin sensitivity. Nat. Rev. Endocrinol. 2015, 11, 577. [Google Scholar] [CrossRef]
  19. Matsuo, T.; Suzuki, H.; Hashiguchi, M.; Izumori, K. D-Psicose is a rare sugar that provides no energy to growing rats. J. Nutr. Sci. Vitaminol. 2002, 48, 77–80. [Google Scholar] [CrossRef] [Green Version]
  20. Hossain, A.; Yamaguchi, F.; Matsuo, T.; Tsukamoto, I.; Toyoda, Y.; Ogawa, M.; Nagata, Y.; Tokuda, M. Rare sugar D-allulose: Potential role and therapeutic monitoring in maintaining obesity and type 2 diabetes mellitus. Pharmacol. Ther. 2015, 155, 49–59. [Google Scholar] [CrossRef]
  21. Han, Y.; Kwon, E.-Y.; Yu, M.; Lee, S.; Kim, H.-J.; Kim, S.-B.; Kim, Y.; Choi, M.-S. A preliminary study for evaluating the dose-dependent effect of D-allulose for fat mass reduction in adult humans: A randomized, double-blind, placebo-controlled trial. Nutrients 2018, 10, 160. [Google Scholar] [CrossRef] [Green Version]
  22. Han, Y.; Han, H.J.; Kim, A.H.; Choi, J.Y.; Cho, S.J.; Park, Y.B.; Jung, U.J.; Choi, M.S. d-Allulose supplementation normalized the body weight and fat-pad mass in diet-induced obese mice via the regulation of lipid metabolism under isocaloric fed condition. Mol. Nutr. Food Res. 2016, 60, 1695–1706. [Google Scholar] [CrossRef]
  23. Xu, Z.; Knight, R. Dietary effects on human gut microbiome diversity. Br. J. Nutr. 2015, 113, S1–S5. [Google Scholar] [CrossRef] [Green Version]
  24. Turnbaugh, P.J.; Ridaura, V.K.; Faith, J.J.; Rey, F.E.; Knight, R.; Gordon, J.I. The effect of diet on the human gut microbiome: A metagenomic analysis in humanized gnotobiotic mice. Sci. Transl. Med. 2009, 1, 6ra14. [Google Scholar] [CrossRef] [Green Version]
  25. Noble, E.E.; Hsu, T.M.; Jones, R.B.; Fodor, A.A.; Goran, M.I.; Kanoski, S.E. Early-life sugar consumption affects the rat microbiome independently of obesity. J. Nutr. 2016, 147, 20–28. [Google Scholar] [CrossRef] [Green Version]
  26. Kuczynski, J.; Stombaugh, J.; Walters, W.A.; González, A.; Caporaso, J.G.; Knight, R. Using QIIME to analyze 16S rRNA gene sequences from microbial communities. Curr. Protoc. Bioinform. 2011, 36, 10.7.1–10.7.20. [Google Scholar] [CrossRef] [Green Version]
  27. Redinger, R.N. Fat storage and the biology of energy expenditure. Transl. Res. 2009, 154, 52–60. [Google Scholar] [CrossRef]
  28. Morrison, D.J.; Preston, T. Formation of short chain fatty acids by the gut microbiota and their impact on human metabolism. Gut Microbes 2016, 7, 189–200. [Google Scholar] [CrossRef] [Green Version]
  29. Li, X.; Shimizu, Y.; Kimura, I. Gut microbial metabolite short-chain fatty acids and obesity. Biosci. Microbiota Food Health 2017, 36, 135–140. [Google Scholar] [CrossRef] [Green Version]
  30. Sánchez, B.; Delgado, S.; Blanco-Míguez, A.; Lourenço, A.; Gueimonde, M.; Margolles, A. Probiotics, gut microbiota, and their influence on host health and disease. Mol. Nutr. Food Res. 2017, 61, 1600240. [Google Scholar] [CrossRef] [Green Version]
  31. Ji, Y.; Park, S.; Chung, Y.; Kim, B.; Park, H.; Huang, E.; Jeong, D.; Jung, H.-Y.; Kim, B.; Hyun, C.-K. Amelioration of obesity-related biomarkers by Lactobacillus sakei CJLS03 in a high-fat diet-induced obese murine model. Sci. Rep. 2019, 9, 6821. [Google Scholar] [CrossRef] [Green Version]
  32. Ríos-Covián, D.; Ruas-Madiedo, P.; Margolles, A.; Gueimonde, M.; de los Reyes-Gavilán, C.G.; Salazar, N. Intestinal short chain fatty acids and their link with diet and human health. Front. Microbiol. 2016, 7, 185. [Google Scholar] [CrossRef] [Green Version]
  33. Lam, Y.Y.; Ha, C.W.; Campbell, C.R.; Mitchell, A.J.; Dinudom, A.; Oscarsson, J.; Cook, D.I.; Hunt, N.H.; Caterson, I.D.; Holmes, A.J. Increased gut permeability and microbiota change associate with mesenteric fat inflammation and metabolic dysfunction in diet-induced obese mice. PLoS ONE 2012, 7, e34233. [Google Scholar] [CrossRef] [Green Version]
  34. Ottosson, F.; Brunkwall, L.; Ericson, U.; Nilsson, P.M.; Almgren, P.; Fernandez, C.; Melander, O.; Orho-Melander, M. Connection between BMI-related plasma metabolite profile and gut microbiota. J. Clin. Endocrinol. Metab. 2018, 103, 1491–1501. [Google Scholar] [CrossRef] [Green Version]
  35. Kaakoush, N.O. Insights into the role of Erysipelotrichaceae in the human host. Front. Cell. Infect. Microbiol. 2015, 5, 84. [Google Scholar] [CrossRef] [Green Version]
  36. Kannel, W.B.; Castelli, W.P.; Gordon, T.; McNamara, P.M. Serum cholesterol, lipoproteins, and the risk of coronary heart disease. Ann Intern Med 1971, 74, 1–12. [Google Scholar] [CrossRef]
  37. Ansell, B.J. Cholesterol, stroke risk, and stroke prevention. Curr. Atheroscler. Rep. 2000, 2, 92–96. [Google Scholar] [CrossRef]
  38. Drolet, M.-C.; Roussel, E.; Deshaies, Y.; Couet, J.; Arsenault, M. A high fat/high carbohydrate diet induces aortic valve disease in C57BL/6J mice. J. Am. Coll. Cardiol. 2006, 47, 850–855. [Google Scholar] [CrossRef] [Green Version]
  39. Spruss, A.; Kanuri, G.; Wagnerberger, S.; Haub, S.; Bischoff, S.C.; Bergheim, I. Toll-like receptor 4 is involved in the development of fructose-induced hepatic steatosis in mice. Hepatology 2009, 50, 1094–1104. [Google Scholar] [CrossRef]
  40. Lambertz, J.; Weiskirchen, S.; Landert, S.; Weiskirchen, R. Fructose: a dietary sugar in crosstalk with microbiota contributing to the development and progression of non-alcoholic liver disease. Front. Immunol. 2017, 8, 1159. [Google Scholar] [CrossRef] [Green Version]
  41. Crescenzo, R.; Mazzoli, A.; Di Luccia, B.; Bianco, F.; Cancelliere, R.; Cigliano, L.; Liverini, G.; Baccigalupi, L.; Iossa, S. Dietary fructose causes defective insulin signalling and ceramide accumulation in the liver that can be reversed by gut microbiota modulation. Food Nutr. Res. 2017, 61, 1331657. [Google Scholar] [CrossRef] [PubMed] [Green Version]
  42. Wagnerberger, S.; Spruss, A.; Kanuri, G.; Volynets, V.; Stahl, C.; Bischoff, S.C.; Bergheim, I. Toll-like receptors 1–9 are elevated in livers with fructose-induced hepatic steatosis. Br. J. Nutr. 2012, 107, 1727–1738. [Google Scholar] [CrossRef] [PubMed] [Green Version]
  43. Sohn, W.; Jun, D.W.; Lee, K.N.; Lee, H.L.; Lee, O.Y.; Choi, H.S.; Yoon, B.C. Lactobacillus paracasei induces M2-dominant Kupffer cell polarization in a mouse model of nonalcoholic steatohepatitis. Dig. Dis. Sci. 2015, 60, 3340–3350. [Google Scholar] [CrossRef]
  44. Ritze, Y.; Bárdos, G.; Claus, A.; Ehrmann, V.; Bergheim, I.; Schwiertz, A.; Bischoff, S.C. Lactobacillus rhamnosus GG protects against non-alcoholic fatty liver disease in mice. PLoS ONE 2014, 9, e80169. [Google Scholar] [CrossRef] [Green Version]
Figure 1. Effects of D-allulose supplementation for 16 weeks on; (A) Body weight; (B) Body weight gain; (C,D) Spleen weight and muscle weight; (E,F) Adipocyte weight and morphology; (G) Food intake and energy intake; (H) Food efficiency ratio; (I,J) Adipocyte enzyme activity-related lipid metabolism; (KN) Metabolic rate, (OR) adipokine levels and weekly plasma (S) TG and (T) TC. Data are mean ± SE; ND, normal diet (AIN-76); HFD, high-fat diet (AIN-76, 20% fat, 1% cholesterol); ALL, (HFD + 5% D-allulose). Mean values are significantly different for ND vs HFD, *** p < 0.001; Mean values are significantly different for HFD vs ALL, ## p < 0.01, ### p < 0.001. (B) BWG, body weight gain; (C) FI, food intake; EI, energy intake; (D) FER, food efficiency ratio = body weight gain/food intake; (E) WAT, white adipose tissue; BAT, brown adipose tissue; (F) hematoxylin and eosin (H&E)-stained transverse section of epididymal fat and liver; Representative photomicrographs of the liver are shown at ×200 magnification; (G) FI, food intake; EI, energy intake; (K) VO2, oxygen consumption, (L), VCO2, carbon dioxide production, (M) RQ, respiratory quotient, (N)EE, energy expenditure, (R) L:A ratio, Leptin:adiponectin ratio, (S) TG, triglyceride, (T) TC, total cholesterol.
Nutrients 12 00352 g001
Figure 2. Effects of D-allulose supplementation for 16 weeks on; (A) Liver weight; (BD) Hepatic lipid profiles; (E,F) Enzyme activities related to lipid metabolism; and (I) morphology. Data are mean ± SE; ND, normal diet (AIN-76); HFD, high-fat diet (AIN-76, 20% fat, 1% cholesterol); ALL, (HFD + 5% D-allulose). Mean values are significantly different for ND vs HFD, * p < 0.05, ** p < 0.01, *** p < 0.001; a, b Mean not sharing a common letter are significantly different among the groups at p < 0.05. (H) L: A ratio, leptin:adiponectin ratio; (I) Hematoxylin and eosin (H&E)-stained transverse section of epididymal fat and liver; Representative photomicrographs of the liver are shown at ×200 magnification; (J) Fibrillar collagens, primarily collagen I and III, are stained blue, as indicated by arrowheads; Representative photomicrographs of the liver are shown at ×200 magnification.
Nutrients 12 00352 g002
Figure 3. Effects of D-allulose on SCFA production. (A) Total SCFA production (B) Acetate; (C) Propionate; (D) Butyrate; (E) Daily fecal weight; (F) Absolute total SCFA adjusted with daily fecal weight (G) Relative total SCFA. Data are mean ± SE; ND, normal diet (AIN-76); HFD, high-fat diet (AIN-76, 20% fat, 1% cholesterol); ALL, (HFD + 5% D-allulose); SCFA, short-chain fatty acid.
Nutrients 12 00352 g003
Figure 4. Effects of D-allulose on microbiota modulation. (A) Relative taxonomic abundance at the genus level. (B) Relative abundance of Lactobacillus, Coprococcus, Coprobacillus, Turicibacter, Clostridiaceae, Dorea, and Erysipelotrichaceae. (C) Observed operational taxonomic unit (OTU). (D) Chao 1. (E) Unweighted principal coordinates analysis and value of each principle coordinate dimension. Data are mean ± SE; ND, normal diet (AIN-76); HFD, high-fat diet (AIN-76, 20% fat, 1% cholesterol); ALL, (HFD + 5% D-allulose). Mean values are significantly different for HFD vs ALL, * p < 0.05, ** p < 0.01, *** p < 0.001.
Nutrients 12 00352 g004
Figure 5. Correlation of microbiota with body weight. (A) Significance chart for Pearson’s correlation between microbiota and body weight. Correlation between body weight and the relative abundance of (B) Lactobacillus; (C) Erysipelotrichaceae; (D) Turicibacter, and (E) Coprococcus. HFD, high-fat diet (AIN-76, 20% fat, 1% cholesterol); ALL, (HFD + 5% D-allulose). Significance calculated through bivariate Pearson’s correlation analysis with body weight, * p < 0.05, ** p < 0.01.
Nutrients 12 00352 g005
Table 1. Composition of experimental diets (% of diet, w/w).
Ingredient (g)NDHFDERYALL
Casein200.00200.00200.00200.00
D,L-Methionine3.003.003.003.00
Corn Starch150.00111.00111.00111.00
Sucrose500.00370.00320.00320.00
Cellulose Powder50.0050.0050.0050.00
Corn Oil50.0030.0030.0030.00
Lard-170.00170.00170.00
Mineral Mix (AIN-76) 135.0042.0042.0042.00
Vitamin Mix (AIN-76) 210.0012.0012.0012.00
Choline Bitartrate2.002.002.002.00
Cholesterol-10.0010.0010.00
tert-Butylhydroquinone0.010.040.040.04
D-Allulose 50.00
Erythritol 50.00
Total (g)1000.01000.01000.01000.0
Calorie (kcal/kg)3902458443844384
Calorie (kcal/g)3.9024.5844.3844.384
ND, normal diet (AIN-76); HFD, high-fat diet (AIN-76, 20% fat, 1% cholesterol); ERY (HFD + 5% erythritol); ALL, (HFD + 5% D-allulose). 1 Mineral mix (AIN-76) (g/kg): calcium phosphate, 500; sodium chloride, 74; potassium citrate, 2220; potassium sulfate, 52; magnesium oxide, 24; manganous carbonate, 3.5; ferric citrate, 6; zinc carbonate, 1.6; cupric carbonate, 0.3; potassium iodate, 0.01; sodium selenite, 0.01; chromium potassium sulfate, 0.55; sucrose 118.03. 2 Vitamin mix (AIN-76) (g/kg): thiamin HCL, 0.6; riboflavin, 0.6; pyridoxine HCL, 0.7; nicotinic acid, 0.003; D-calcium pantothenate, 0.0016; folate, 0.2; D-biotin, 0.02; cyanocobalamin (vitamin B12), 0.001; retinyl palmitate premix, 0.8; DL-α-tocopheryl acetate, premix, 20; cholecalciferol (vitamin D3), 0.0025; menaquinone (vitamin K), 0.05; antioxidant, 0.01; sucrose, finely powdered, 972.8.
Table 2. Effect of D-allulose supplementations for 16 weeks on plasma lipid profiles in C57BL/6J mice fed a high-fat diet.
NDHFDERYALL
FFA (mmol/L)0.20 ± 0.000.20 ± 0.000.19 ± 0.000.16 ± 0.00
TG (mg/dL)0.86 ± 0.310.86 ± 0.090.93 ± 0.310.81 ± 0.16
Total-C (mmol/L)3.56 ± 0.325.17 ± 1.21 ***a4.48 ± 0.80 ab3.94 ± 0.32 b
HDL-C (mmol/L)0.95 ± 0.151.46 ± 0.34 ***a1.15 ± 0.21 a0.88 ± 0.13 b
Non-HDL-C (mmol/L)2.61 ± 0.383.72 ± 0.93 ***a3.33 ± 0.69 a2.65 ± 0.39 b
ApoA-I (mg/dL)31.52 ± 1.8830.25 ± 0.90 a26.97 ± 1.18 ab25.53 ± 1.56 b
ApoB (mg/dL)6.03 ± 2.818.04 ± 2.926.51 ± 3.055.87 ± 2.64
ApoA-I/ApoB6.54 ± 3.594.41 ± 2.185.02 ± 2.526.09 ± 4.71
HTR 125.75 ± 4.3928.32 ± 3.5825.92 ± 4.4622.30 ± 2.48
AI 22.84 ± 0.722.58 ± 0.452.96 ± 0.693.54 ± 0.52
Data are mean ± SD. Significant differences between HFD vs ND are indicated; *** p < 0.001; a, b Mean not sharing a common letter are significantly different among the groups at p < 0.05. ND, normal diet (AIN-76); HFD, high-fat diet (AIN-76, 20% fat, 1% cholesterol); ALL, (HFD + 5% D-allulose). FFA, free fatty acid; TG, triglyceride; C, cholesterol; ApoA-I, apolipoprotein A-I; ApoB, apolipoprotein B; non-HDL-C = (Total-C) − (HDL-C); HTR 1, (HDL-C/Total-C) × 100; AI 2, atherogenic index = [(Total-C) − (HDL-C)]/HDL-C.

