Article

Meal Patterns and Changes in Cardiometabolic Risk Factors in Children: A Longitudinal Analysis

1
School of Behavioural and Health Sciences, Australian Catholic University, East Melbourne, VIC 3002, Australia
2
Department of Medicine (Royal Melbourne Hospital), University of Melbourne, Parkville, VIC 3010, Australia
3
Department of Nutrition, Harvard T. H. Chan School of Public Health, 655 Huntington Ave, Boston, MA 02115, USA
4
Institute of food and nutrition development, Ministry of Agriculture and Rural Affairs, Beijing 100081, China
5
National Institute for Nutrition and Health, Chinese Center for Disease Control and Prevention, Beijing 100050, China
6
Chinese Nutrition Society, Beijing 100022, China
7
Department of Nutrition and Food Hygiene, School of Public Health, Peking University, Beijing 100191, China
*
Author to whom correspondence should be addressed.
Nutrients 2020, 12(3), 799; https://doi.org/10.3390/nu12030799
Submission received: 26 February 2020 / Revised: 12 March 2020 / Accepted: 16 March 2020 / Published: 18 March 2020
(This article belongs to the Special Issue A Good Time to Eat: The Impact of Time of Day on Health Outcomes)

Abstract

:
We examined whether energy and macronutrient intake from different meals was associated with changes in cardiometabolic risk (CMR) factors in children. CMR score (CMRS) was computed by summing Z-scores of waist circumference, the average of systolic and diastolic blood pressure, fasting glucose, high-density lipoprotein cholesterol (multiplying by −1), and triglycerides. We included 5517 children aged 6–13 years from six major cities in China. Five meal patterns were identified according to energy intake: balanced, breakfast dominant, lunch dominant, dinner dominant, and snack dominant patterns. These patterns were not significantly associated with changes in CMR factors. Carbohydrate intake (% energy) at lunch was positively associated with the change in CMRS (beta coefficient (95% CI): (0.777 (0.509, 1.046) in quintile 5 versus quintile 1). A positive association between carbohydrate intake at dinner and change in CMRS was observed. High protein intake at both lunch and dinner was associated with a favorable change in CMRS. Moderate fat intake at lunch was associated with a lower increase in CMRS. Meal patterns driven by energy were not significantly associated with CMR factors; however, a low carbohydrate-high protein-moderate fat lunch and low carbohydrate-high protein dinner were associated with favorable changes in CMRS in children.

1. Introduction

There is a high prevalence of cardiometabolic risk (CMR) factors in both children and adults globally [1,2,3], which imposes tremendous burdens on health care and economic systems. It is imperative to prevent these CMR factors in children since childhood CMR factors are highly likely to persist into adulthood and are associated with numerous implications, including hypertension, diabetes, and cardiovascular disease in the future [4,5,6,7,8]. Dietary quality is of paramount importance for the reduction and prevention of CMR factors [9,10,11].
Evidence from recent studies in adults has shown that meal patterns play an important role in the development of CMR factors [12,13]. Eating three meals (breakfast, lunch, and dinner) plus snacks per day is a norm and may be an optimal choice for health [14]. Previous studies have shown that skipping meals, especially breakfast, was associated with a higher prevalence of CMR factors [15,16,17], whereas a higher meal frequency was associated with a lower risk of obesity, high cholesterol, and diabetes in adults [18,19,20]. More recent research in adults has shown that three to four meals per day were associated with lower CMR, compared with one to two, or six or more meals per day [13]. Some studies have demonstrated that a late-night meal is associated with poorer diet quality and adiposity among adults [21,22]. The meal composition of macronutrients may also play an important role in metabolic health, given that diets high in protein and low in carbohydrates are associated with lower CMR in adults [23,24]. However, data on whether meal timing and composition are predictive of changes in CMR factors in children are limited.
The present study examined the association of different meal patterns, driven by energy intake, with changes in CMR factors in a large sample of Chinese children. We also examined whether energy, carbohydrate, protein, and fat consumed at breakfast, lunch, dinner, and as a snack was associated with the change in CMR.

2. Materials and Methods

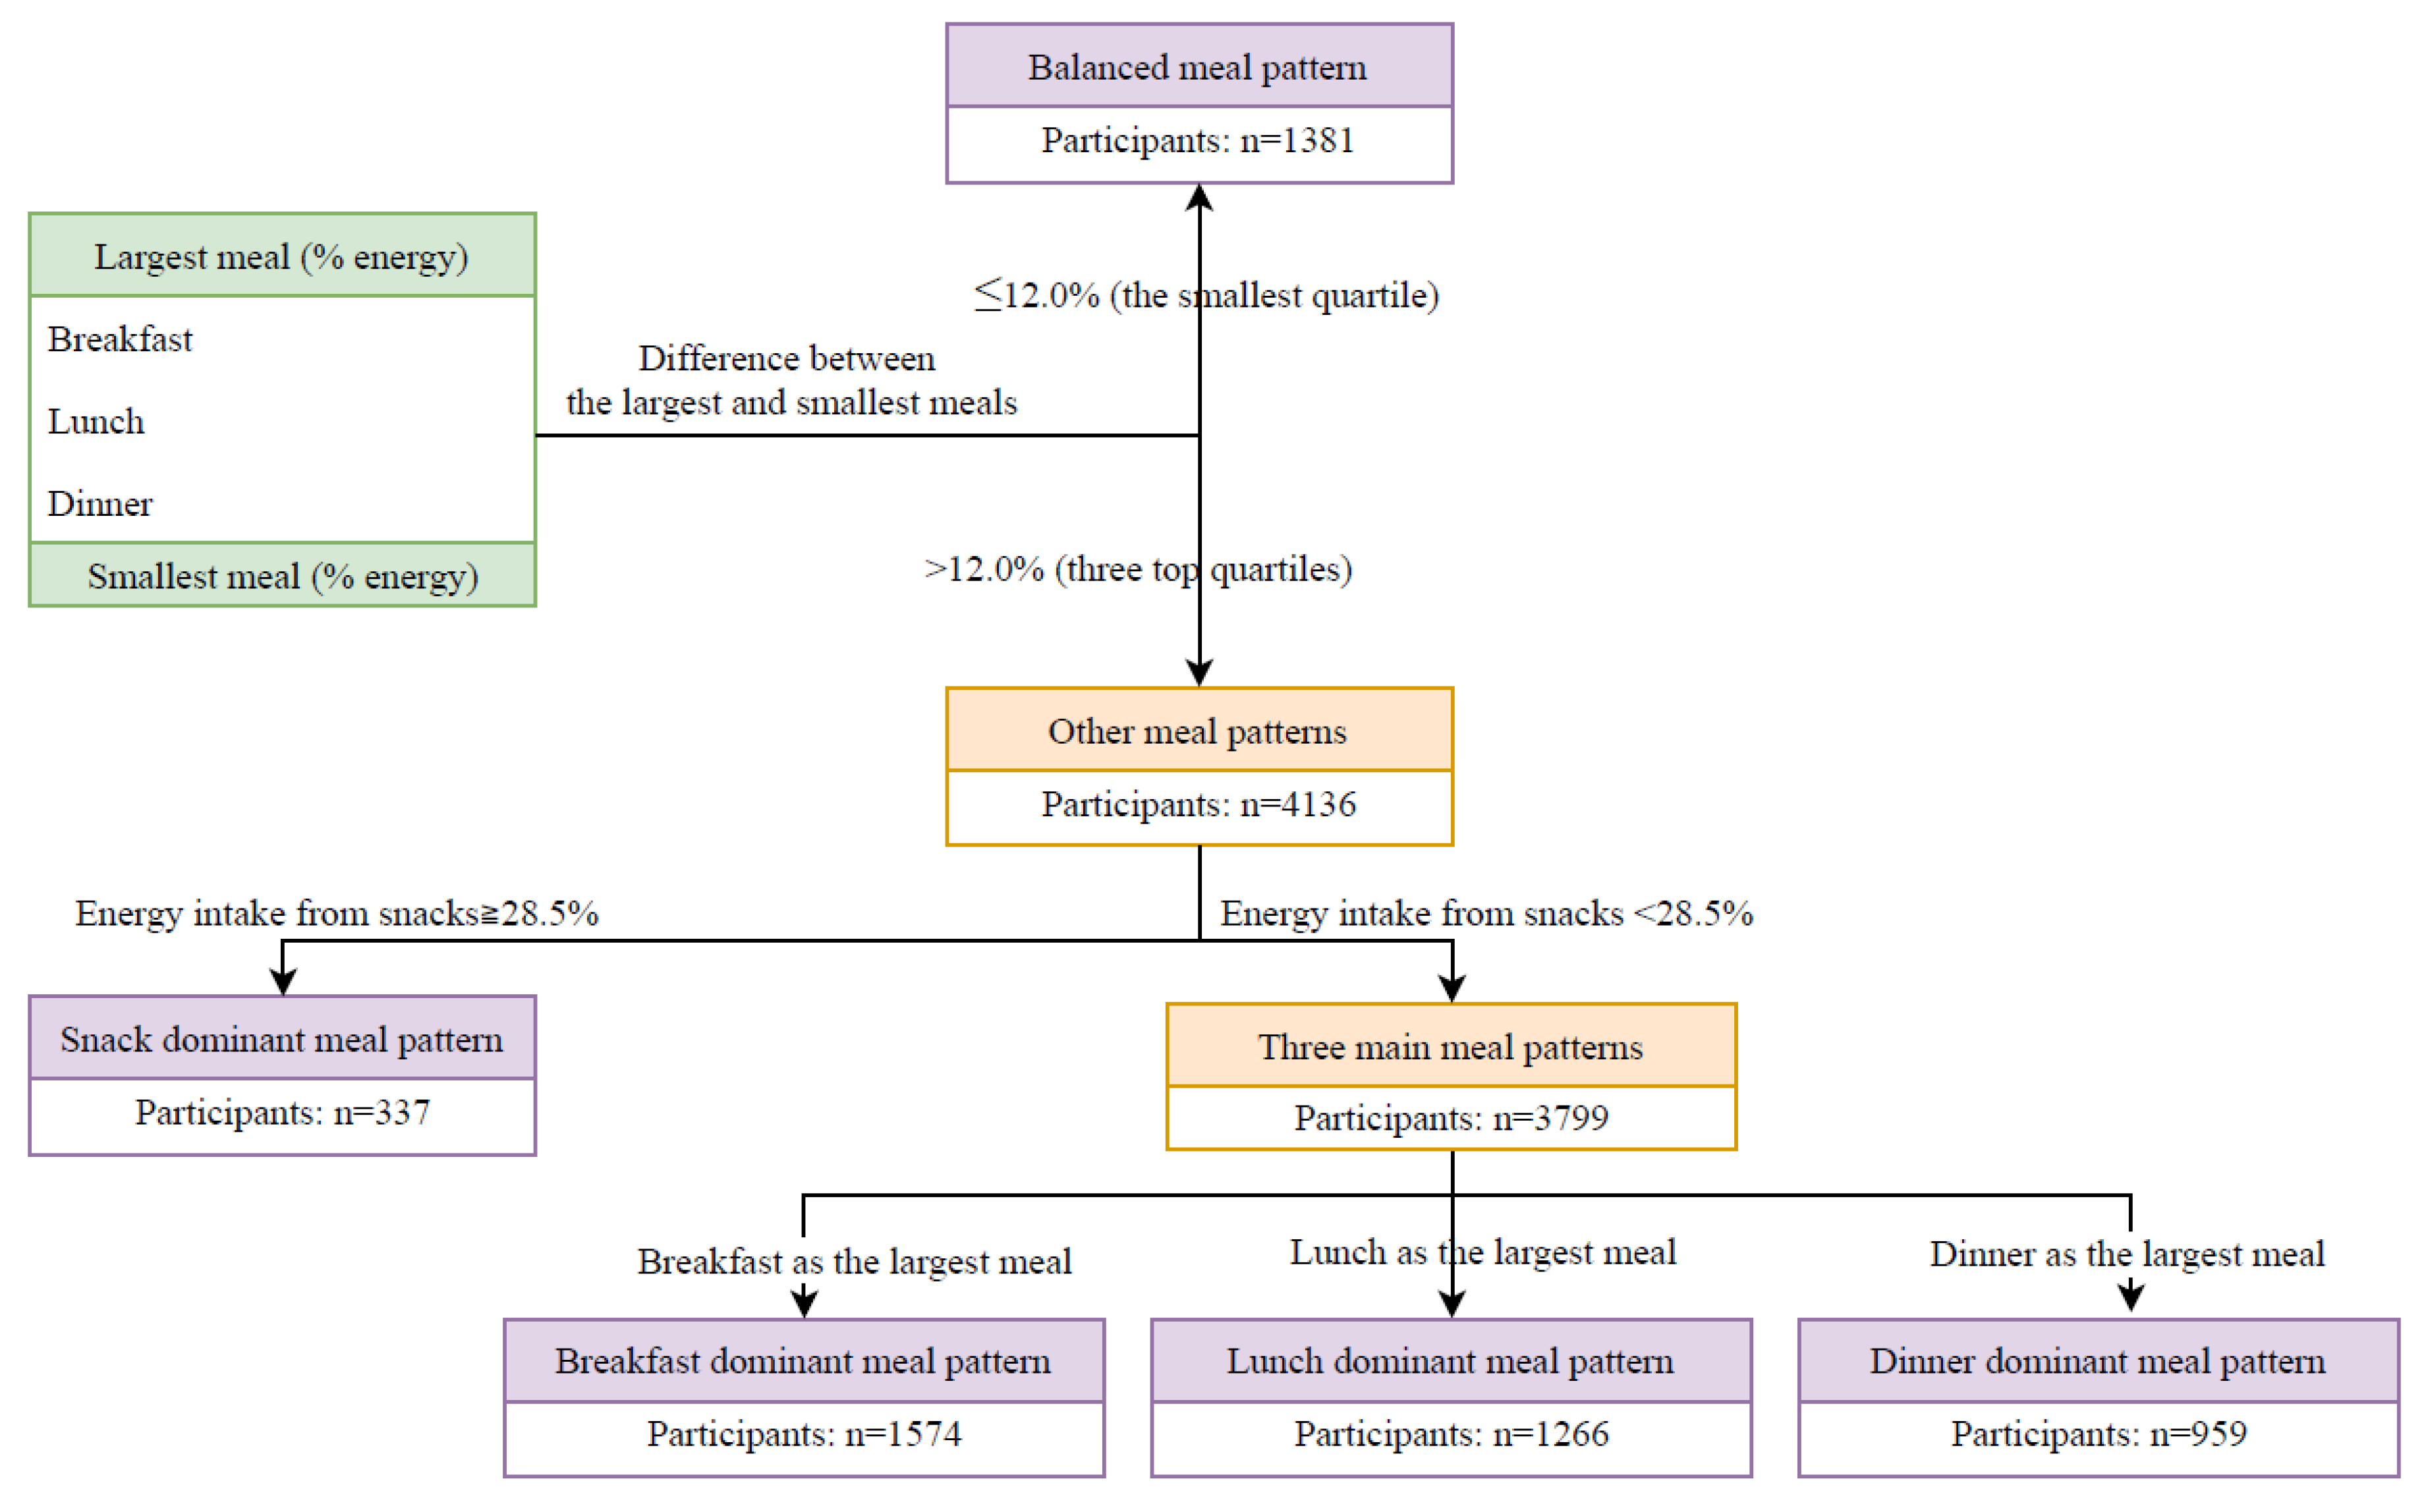
2.1. Participant Selection

The nutrition-based comprehensive intervention study on childhood obesity in China is a multicenter, randomized cluster controlled trial, and the study has been detailed elsewhere [25]. Briefly, the study was conducted in six capital or province capital cities, including Beijing, Shanghai, Chongqing, Jinan, Harbin, and Guangzhou. A total of 9901 children from 390 classes within 38 schools were screened for eligibility. Among the 9867 children who were assessed at baseline (May 2009), 8572 were reassessed at follow-up (May 2010). 5517 children who had dietary intake and CMR markers assessed were included in the final analysis (Figure S1).
The study protocol was approved by the Ethical Review Committee of the National Institute for Nutrition and Food Safety, Chinese Centre for Disease Control and Prevention. Oral assent was collected from children, while written informed consent was obtained from the next of kin, carers, or guardians of all participants.

2.2. Dietary Assessment

Dietary intake was assessed using 24 h diet recalls for three consecutive days (two weekdays and one weekend day) in children in grades 2–5. During the interview, samples of local household dishes and utensils (different sizes of bowls, plates, and spoons) were displayed to the children. They were then shown pictures of common foods eaten in these dishes or utensils to indicate portion size consumed. Diet intake was recalled immediately after each meal to make sure of the accuracy of the assessment. The trained interviewer and the tutor would help children recall food intake at school, while parents would help recall foods consumed at home.
Nutrients and energy intake were calculated based on the China food composition [26]. The average amount of energy and macronutrient intake at breakfast, lunch, dinner, and snack per day was computed. Energy adjusted nutrient consumption per day was computed as 100 × weight (gm)/total energy intake (Kcal).
We defined a balanced meal pattern as ≤12.0% (smallest quartile) difference between the largest and smallest meals of total energy intake. Among the remaining participants, energy intake from snacks greater than 28.5% of total energy intake (largest decile) was defined as a snack dominant meal pattern. We then defined the largest meal, being breakfast, as a breakfast dominant meal pattern, and so on for lunch dominant and dinner dominant meal patterns (Figure 1).

2.3. Confounders

Physical activity was assessed using a validated physical activity questionnaire, from which metabolic equivalent (MET) was calculated [27]. Birthweight, household income, parental education, and parental height and weight were reported by parents using a self-administered questionnaire.

2.4. Physical Examinations and Blood Tests

Measurements of physical examinations and blood tests (10–14 h fasting beforehand) were performed at both baseline and follow-up, following standardized procedures by trained staff.
Height was measured to the nearest 0.1 cm using a freestanding audiometer, and weight was measured to the nearest 0.1 kg using a balance-beam scale. Body mass index (BMI) was computed as weight in kilograms divided by the square of height in meters. Waist circumference (WC) was measured midway between the lowest rib and the superior border of the iliac crest on expiration to the nearest 0.1 cm, and the average of the two measurements was used.
Blood pressure was measured in the seated position using a mercury sphygmomanometer (XJ300/40-1, Made in Shanghai) by trained nurses, with at least a 10 min rest before the measurement. The first and fifth Korotkoff sounds were used to represent the systolic and diastolic blood pressure (SBP and DBP). Three measurements were taken to the nearest 2 mmHg, and the average of the last two measurements was used.
A single frequency (50 Hz) hand to foot bioelectrical impendence device (ImpDF50, Impedimed Pty Ltd., Qld, Australia), with subjects in a calm state, was used to assess body composition. Body fat mass was computed using the prediction formula developed by Deurenberg et al. [28], and percent body fat (PBF) was calculated as fat mass divided by body weight.
Fasting glucose was measured using the glucose–oxidize method (Daiichi Pharmaceutical Co., Ltd., Tokyo, Japan) within four hours after the fasting blood sample was obtained. Fasting insulin was measured using the immunoenzymatic method (analyzer AXSYM, Abbott Co., Ltd., Japan). The homeostatic model assessment of insulin resistance (HOMA-IR) was computed as fasting insulin (µU/L) × fasting glucose (mg/dL)/405.
Conventional enzymatic assays were used to measure levels of serum triglycerides, total cholesterol (TC), high-density lipoprotein cholesterol (HDL-C) and low-density lipoprotein cholesterol (LDL-C) with a 7080 automatic analyzer (Daiichi Pharmaceutical Co., Ltd., Tokyo, Japan).

2.5. Statistical Analysis

BMI, WC, PBF, SBP, DBP, TC, HDL-C, LDL-C, TG, insulin, and HOMA-IR at baseline and follow-up were standardized, i.e., Z scores were calculated as Z = (value − mean)/SD, using sex and age-specific means, and SDs. CMR score (CMRS) was calculated by summing Z scores of WC, the average of SBP and DBP, fasting glucose, HDL-C (multiplying by −1), and TG [29].
ANOVA for continuous variables and chi-square tests for categorical variables were performed to compare the difference of baseline characteristics across meal patterns. ANOVA for continuous variables, and chi-square tests for categorical variables, were also conducted to test the difference of baseline characteristics between individuals included in the analysis and excluded from the analysis (due to missing or abnormal diet data).
Since the interaction between sex/intervention and energy and macronutrient intake at different meals for the change in CMRS was not significant (Tables S1 and S2), we analyzed the whole population. The general linear regression model (GLM) was used to test the difference in changes in CMR factors between participants with different meal patterns. We tested the following models: (1) age, sex, corresponding CMR factor at baseline as a fixed effect, and clustering effect of classes in schools as a random effect; (2) model 1 plus intervention group, puberty, grade, BMI, physical activity, and energy intake at baseline; (3) model 2 plus birth weight, breastfeeding, household income, or parental BMI and education. Missing values for categorical confounders were assigned as a single category, while means were given to missing values for continuous confounders.
We then analyzed the association between quintiles of energy and macronutrient intake at breakfast, lunch, dinner, and snack; and the change in CMRS using GLM. To control the heterogeneity of foods within the groups of macronutrient intake, major food groups including grains, fried foods, vegetables, fruit, nuts, pork, red meat rather than pork, poultry, eggs, milk, and sugar-sweetened beverages were adjusted for in the multivariable analysis. We used the Benjamin–Hochberg procedure to control the false discovery rate at level 5% for multiple comparisons [30]. Bonferroni P value adjustments were performed for all pairwise comparisons. The association of change in macronutrient intake at each meal, with the change in CMRS, was also analyzed.
Sensitivity analysis was performed for the association between meal patterns and changes in CMR factors in children in the control group. Data analyses were conducted using SAS 9.4 for Windows (SAS Institute Inc.), and all P values were two-sided.

3. Results

3.1. Baseline Characteristics of Participants

A sample of 5517 children (50.7% boys) aged 6–13 years (mean ± SD; 9.54 ± 1.18) were included in the final analysis. Children excluded from the analysis because of missing or abnormal diet data were more likely to be boys and have higher BMI, WC, fasting glucose, insulin, and lower SBP and DBP compared with those included in the analysis. No significant difference in CMRS was observed between the two groups (Table S3).
Dinner dominant meal pattern was associated with higher BMI, SBP, LDL-C, and TG compared with a balanced meal pattern (all p values <0.05). No significant difference in energy intake, physical activity, and socioeconomic status was observed between different meal patterns (Table 1 and Table S4).

3.2. Energy and Macronutrients from Meals

Energy consumed from breakfast, lunch, dinner, and snacks was 31.69%, 30.49%, 27.48%, and 10.34%, respectively. Protein intake (% energy of the corresponding meal) from breakfast, lunch, and dinner was 15.30%, 18.69%, and 20.18%, respectively, whereas the number for carbohydrates was 59.03%, 56.39%, and 53.87%, respectively. The energy intake for a balanced meal pattern ranged from 28.49% at dinner to 29.18% at lunch. Children with a breakfast dominant meal pattern consumed 47.01% of their total energy from breakfast, those with a lunch dominant meal pattern consumed 45.58% of their total energy from lunch, those with a dinner dominant meal pattern consumed 44.11% of their total energy from dinner, and those with a snack dominant meal pattern consumed 38.42% of their total energy from snacks (Figure 2).

3.3. Meal Patterns and Changes in CMR Factors

The snack dominant meal pattern was associated with a higher increase in HDL-C compared with the balanced meal pattern. Meal patterns driven by energy intake were not significantly associated with changes in other CMR factors examined before or after adjustment for covariates (Table 2).

3.4. Energy Intake from Different Meals and Changes in CMRS

Energy intake from lunch was positively associated with the change in CMRS (β (95% CI): 0.248 (0.044, 0.452) in quintile 5) before but not after adjustment for confounders (0.173 (–0.021, 0.367)). Energy intake from breakfast, dinner, or snacks was not associated with the change in CMRS (Table 3).

3.5. Macronutrients Intake at Different Meals and Changes in CMRS

Carbohydrate intake at breakfast was inversely associated with the change in CMRS (Table S5). This association was attenuated to be nonsignificant after adjustment for the intake of major foods. Children in quintiles 4 (β (95% CI): 0.603 (0.368, 0.837)) and 5 (0.777 (0.509, 1.046)) of carbohydrate intake at lunch had a higher increase in CMRS than those in quintile 1 in the multivariable-analysis. A positive association between carbohydrate intake at dinner and change in CMRS was observed. Carbohydrate intake from snacks was not significantly associated with the change in CMRS.
The multivariable-adjusted β (95% CI) for quintile 5 of protein intake at lunch with the change in CMRS was –0.463 (–0.710, –0.217) (p-trend <0.0001). The corresponding number for protein intake at dinner was –0.360 (–0.602, –0.117) (P-trend <0.0001). No significant association between protein intake at breakfast or from snack and change in CMRS was observed.
The positive association between fat intake at breakfast and change in CMRS was significant before but not after adjustment for intake of major food groups. Moderate fat intake at lunch (quintile 4) was associated with a lower increase in CMRS. Fat intake at dinner or from snacks was not associated with the change in CMRS (Table 4).

3.6. Change in Macronutrients Intake at Different Meals and Changes in CMRS

Increased carbohydrate intake at lunch was associated with a higher increase in CMRS. Increased protein intake at lunch and dinner was each associated with a higher decrease in CMRS. Increased fat intake at breakfast was associated with a lower decrease in CMRS before, but not after, adjustment for confounders (Table S6).

3.7. Sensitivity Analysis

Similar results for the association of meal patterns with changes in most CMR factors were found in children in the control group (Table S7).

4. Discussion

In this longitudinal analysis with a large sample size of Chinese children, we found meal patterns driven by energy were not associated with changes in CMR factors. Energy intake at lunch was positively associated with the change in CMRS. A low carbohydrate-high protein-moderate fat lunch was inversely associated with the change in CMRS, while a low carbohydrate-high protein dinner was associated with a favorable change in CMRS.
In China, balanced meal patterns with breakfast, lunch, and dinner contributing 30%, 40%, and 30% of total energy, respectively, were recommended for health. Our study showed that a balanced meal pattern was associated with lower BMI, SBP, LDL-C, and TG compared with a dinner dominant meal pattern in the cross-sectional analysis; this is consistent with previous studies showing that a large dinner was associated with high CMR [21,31]. However, this association was not confirmed in our longitudinal analysis. We found that higher energy intake in different meals was not associated with a higher increase in CMRS. The snack dominant meal pattern was associated with a higher increase in HDL-C, which may be partly attributed to the fact that the majority of snacks were fruits and dairy in our study (data not shown).
Macronutrients such as protein, fat, and carbohydrate contribute to almost all the energy intake, given most children in China do not drink alcohol at all, such that metabolism of macronutrients plays an essential role in cardiometabolic health. Our study supports some previous studies showing that meal composition was associated with a change in CMRS [23,24,32]. We found that high carbohydrate and low fat intake at breakfast were associated with a favorable change in CMRS. This is consistent with a prospective cohort study in adults showing that increasing carbohydrate intake, while simultaneously reducing fat intake at breakfast, was associated with a lower likelihood of metabolic syndrome [33]. Our further analysis demonstrated that this association was not significant after adjustment for the intake of major food groups; this suggests the importance of food intake that consists of macronutrients for metabolic health in children.
A low-carbohydrate, high-protein, and moderate-fat lunch was associated with a lower increase in CMRS in our study. Evidence has highlighted the importance of protein intake for children’s growth and development, and sufficient protein intake is recommended for each meal [32]. Meanwhile, high protein intake may help enhance satiety and reduce total energy intake [34,35], which may be associated with lower metabolic risks. Previous studies have demonstrated that the replacement of carbohydrates with protein is associated with better metabolic health [36]. Our findings suggest it may result in a larger effect if this replacement occurs at lunch rather than breakfast. Meanwhile, we found that moderate fat intake (26.28%–35.87% of energy) at lunch was associated with a lower increase in CMRS. This indicates that children need to consume sufficient essential fats, which are important for children’s metabolic health, growth, and development [37]. Lunch high in fish, chicken, eggs, unprocessed meat, beans, and nuts; and low in refined grains, fried foods, and sugar-sweetened beverages to provide an optimal composition of macronutrients for both growth and metabolic health in children.
We also found that a dinner low in carbohydrate and high in protein was associated with a lower increase in CMRS, highlighting the importance of high protein intake on metabolic health. Since carbohydrates are less functional in the formation and regulation of the body’s tissues than protein and fat, diets that are relatively low in carbohydrates and high in protein have been recommended for the prevention of CMR [36]. However, dietary guidelines recommended that carbohydrates provide 45%–65% of total energy intake [38], given that excess protein and fat intake may result in harmful effects for health. Our findings suggest that the consumption of more carbohydrates at breakfast and fewer carbohydrates at lunch and dinner may be a better option to meet the minimum requirement, and prevent CMR. The macronutrient composition of snacks was not significantly associated with the change in CMRS in our study, which might be partly due to the low contribution of snacks to the total energy (10%). Our study, with a large sample size, demonstrates that a low-carbohydrate, high-protein and moderate-fat lunch; and a low-carbohydrate and high-protein dinner were associated with better metabolic health.
The strengths of the present study included the large sample size and the measurement of multiple CMR factors at both baseline and follow-up. To our knowledge, this is the first longitudinal study to comprehensively examine the association between meal patterns and change in CMRS in children. This study also had several limitations. The relative short-term follow-up (1 year) of our study may not be a long enough duration to judge the association between meal patterns and changes in CMR factors in children. Furthermore, because of the observational nature of the design of the present study, causal relations could not be established based on our findings. Thirdly, 24 h food records failed to account for seasonal variation of dietary intake, especially in fruits and vegetables; however, the dietary intakes were comparable between individuals given that all data were collected in May of the same year.

5. Conclusions

Meal patterns driven by energy are not significantly associated with changes in CMR factors, however, a low carbohydrate-high protein-moderate fat lunch and a low carbohydrate-high protein dinner are associated with a favorable change in CMRS in children.

Supplementary Materials

The following are available online at https://www.mdpi.com/2072-6643/12/3/799/s1, Figure S1, Flowchart for the population section.; Table S1, p values for the interaction between sex and the energy/macronutrients intake at different meals for the changes in cardiometabolic risk score.; Table S2, p values for the interaction between the intervention and the energy/macronutrients intake at different meals for changes in the cardiometabolic risk score.; Table S3, Differences in the baseline characteristics between children who were included in the analysis and those who had missing or abnormal diet data.; Table S4, Characteristics by meal patterns.; Table S5, Meal patterns and changes in the cardiometabolic risk factors in children.; Table S6, Changes in the macronutrients intake at different meals and the change in cardiometabolic risk score.; Table S7, Meal patterns and changes in the cardiometabolic risk factors in children in the control group.

Author Contributions

Conceptualization, X.S. and G.M.; data curation, H.X.; formal analysis, X.S. and Y.L.; Ffunding acquisition, G.M.; investigation, Q.Z., A.L., and S.D.; methodology, X.S., Y.L., Q.Z., A.L., S.D., and G.M.; software, X.S.; writing—original draft, X.S.; writing—review and editing, X.S., Y.L., H.X., and G.M. All authors have read and agreed to the published version of the manuscript.

Funding

This project was funded by the China Ministry of Science and Technology as Key Projects in the National Science and Technology Pillar Program during the Eleventh Five-Year Plan Period (2008BAI58B05).

Acknowledgments

The authors would like to acknowledge the support of other team members and the participating students, teachers, parents, and local education and health staff members.

Conflicts of Interest

The authors declare no conflict of interest.

References

  1. Adair, L.S.; Gordon-Larsen, P.; Du, S.F.; Zhang, B.; Popkin, B.M. The emergence of cardiometabolic disease risk in Chinese children and adults: Consequences of changes in diet, physical activity and obesity. Obes. Rev. 2014, 15, 49–59. [Google Scholar] [CrossRef]
  2. Haffner, S.M. Relationship of metabolic risk factors and development of cardiovascular disease and diabetes. Obesity 2006, 14, 121–127. [Google Scholar] [CrossRef]
  3. O’Neill, S.; O’Driscoll, L. Metabolic syndrome: A closer look at the growing epidemic and its associated pathologies. Obes. Rev. 2015, 16, 1–12. [Google Scholar] [CrossRef] [PubMed] [Green Version]
  4. Laitinen, T.T.; Pahkala, K.; Magnussen, C.G.; Viikari, J.S.; Oikonen, M.; Taittonen, L.; Mikkila, V.; Jokinen, E.; Hutri-Kahonen, N.; Laitinen, T.; et al. Ideal cardiovascular health in childhood and cardiometabolic outcomes in adulthood: The cardiovascular risk in young finns study. Circulation 2012, 125, 1971–1978. [Google Scholar] [CrossRef] [PubMed] [Green Version]
  5. Bao, W.; Srinivasan, S.R.; Wattigney, W.A.; Berenson, G.S. Persistence of multiple cardiovascular risk clustering related to syndrome X from childhood to young adulthood. The bogalusa heart study. Arch. Intern. Med. 1994, 154, 1842–1847. [Google Scholar] [CrossRef] [PubMed]
  6. Berenson, G.S. Childhood risk factors predict adult risk associated with subclinical cardiovascular disease. The bogalusa heart study. Am. J. Cardiol. 2002, 90, 3l–7l. [Google Scholar] [CrossRef]
  7. Reilly, J.J.; Kelly, J. Long-term impact of overweight and obesity in childhood and adolescence on morbidity and premature mortality in adulthood: Systematic review. Int. J. Obes. 2011, 35, 891–898. [Google Scholar] [CrossRef] [Green Version]
  8. Park, M.H.; Falconer, C.; Viner, R.M.; Kinra, S. The impact of childhood obesity on morbidity and mortality in adulthood: A systematic review. Obes. Rev. 2012, 13, 985–1000. [Google Scholar] [CrossRef]
  9. Ezzati, M.; Riboli, E. Behavioral and dietary risk factors for noncommunicable diseases. N. Engl. J. Med. 2013, 369, 954–964. [Google Scholar] [CrossRef] [Green Version]
  10. Lachat, C.; Otchere, S.; Roberfroid, D.; Abdulai, A.; Seret, F.M.; Milesevic, J.; Xuereb, G.; Candeias, V.; Kolsteren, P. Diet and physical activity for the prevention of noncommunicable diseases in low- and middle-income countries: A systematic policy review. PLoS Med. 2013, 10, e1001465. [Google Scholar] [CrossRef] [Green Version]
  11. Hu, F.B.; Liu, Y.; Willett, W.C. Preventing chronic diseases by promoting healthy diet and lifestyle: Public policy implications for China. Obes. Rev. 2011, 12, 552–559. [Google Scholar] [CrossRef]
  12. St-Onge, M.P.; Ard, J.; Baskin, M.L.; Chiuve, S.E.; Johnson, H.M.; Kris-Etherton, P.; Varady, K. Meal timing and frequency: Implications for cardiovascular disease prevention: A scientific statement from the american heart association. Circulation 2017, 135, 96–121. [Google Scholar] [CrossRef] [PubMed]
  13. Paoli, A.; Tinsley, G.; Bianco, A.; Moro, T. The influence of meal frequency and timing on health in humans: The role of fasting. Nutrients 2019, 11. [Google Scholar] [CrossRef] [PubMed] [Green Version]
  14. Mattson, M.P.; Allison, D.B.; Fontana, L.; Harvie, M.; Longo, V.D.; Malaisse, W.J.; Mosley, M.; Notterpek, L.; Ravussin, E.; Scheer, F.A.; et al. Meal frequency and timing in health and disease. Proc. Natl. Acad. Sci. USA 2014, 111, 16647–16653. [Google Scholar] [CrossRef] [PubMed] [Green Version]
  15. Odegaard, A.O.; Jacobs, D.R., Jr.; Steffen, L.M.; Van Horn, L.; Ludwig, D.S.; Pereira, M.A. Breakfast frequency and development of metabolic risk. Diabetes Care 2013, 36, 3100–3106. [Google Scholar] [CrossRef] [Green Version]
  16. Hallstrom, L.; Labayen, I.; Ruiz, J.R.; Patterson, E.; Vereecken, C.A.; Breidenassel, C.; Gottrand, F.; Huybrechts, I.; Manios, Y.; Mistura, L.; et al. Breakfast consumption and CVD risk factors in European adolescents: The HELENA (Healthy Lifestyle in Europe by Nutrition in Adolescence) study. Public Health Nutr. 2013, 16, 1296–1305. [Google Scholar] [CrossRef] [PubMed] [Green Version]
  17. Smith, K.J.; Gall, S.L.; McNaughton, S.A.; Blizzard, L.; Dwyer, T.; Venn, A.J. Skipping breakfast: Longitudinal associations with cardiometabolic risk factors in the Childhood Determinants of Adult Health Study. Am. J. Clin. Nutr. 2010, 92, 1316–1325. [Google Scholar] [CrossRef]
  18. Titan, S.M.; Bingham, S.; Welch, A.; Luben, R.; Oakes, S.; Day, N.; Khaw, K.T. Frequency of eating and concentrations of serum cholesterol in the Norfolk population of the European prospective investigation into cancer (EPIC-Norfolk): Cross sectional study. BMJ 2001, 323, 1286–1288. [Google Scholar] [CrossRef] [Green Version]
  19. Holmback, I.; Ericson, U.; Gullberg, B.; Wirfalt, E. A high eating frequency is associated with an overall healthy lifestyle in middle-aged men and women and reduced likelihood of general and central obesity in men. Br. J. Nutr. 2010, 104, 1065–1073. [Google Scholar] [CrossRef] [Green Version]
  20. Mekary, R.A.; Giovannucci, E.; Willett, W.C.; van Dam, R.M.; Hu, F.B. Eating patterns and type 2 diabetes risk in men: Breakfast omission, eating frequency, and snacking. Am. J. Clin. Nutr. 2012, 95, 1182–1189. [Google Scholar] [CrossRef] [Green Version]
  21. Leech, R.M.; Timperio, A.; Livingstone, K.M.; Worsley, A.; McNaughton, S.A. Temporal eating patterns: Associations with nutrient intakes, diet quality, and measures of adiposity. Am. J. Clin. Nutr. 2017, 106, 1121–1130. [Google Scholar] [CrossRef] [PubMed] [Green Version]
  22. Kahleova, H.; Lloren, J.I.; Mashchak, A.; Hill, M.; Fraser, G.E. Meal Frequency and timing are associated with changes in body mass index in Adventist Health Study 2. J. Nutr. 2017, 147, 1722–1728. [Google Scholar] [CrossRef] [PubMed] [Green Version]
  23. Chapelot, D. The role of snacking in energy balance: A biobehavioral approach. J. Nutr. 2011, 141, 158–162. [Google Scholar] [CrossRef] [PubMed] [Green Version]
  24. Kanaley, J.A.; Heden, T.D.; Liu, Y.; Fairchild, T.J. Alteration of postprandial glucose and insulin concentrations with meal frequency and composition. Br. J. Nutr. 2014, 112, 1484–1493. [Google Scholar] [CrossRef] [Green Version]
  25. Li, Y.; Hu, X.; Zhang, Q.; Liu, A.; Fang, H.; Hao, L.; Duan, Y.; Xu, H.; Shang, X.; Ma, J.; et al. The nutrition-based comprehensive intervention study on childhood obesity in China (NISCOC): A randomised cluster controlled trial. BMC Public Health 2010, 10, 229. [Google Scholar] [CrossRef] [Green Version]
  26. Yang, Y.; Wang, G.; Pan, X. China Food Composition; Peking Medical University: Beijing, China, 2009. [Google Scholar]
  27. Liu, A.L.; Ma, G.S.; Zhang, Q.; Ma, W.J. Reliability and validity of a 7-day physical activity questionnaire for elementary students. Zhonghua Liu Xing Bing Xue Za Zhi 2003, 24, 901–904. [Google Scholar]
  28. Deurenberg, P.; van der Kooy, K.; Leenen, R.; Weststrate, J.A.; Seidell, J.C. Sex and age specific prediction formulas for estimating body composition from bioelectrical impedance: A cross-validation study. Int. J. Obes. 1991, 15, 17–25. [Google Scholar]
  29. Eisenmann, J.C. On the use of a continuous metabolic syndrome score in pediatric research. Cardiovasc. Diabetol. 2008, 7, 17. [Google Scholar] [CrossRef] [Green Version]
  30. Benjamini, Y.; Hochberg, Y. Controlling the false discovery rate: A practical and powerful approach to multiple testing. J. R. Stat. Soc. Ser. 1995, 57, 289–300. [Google Scholar] [CrossRef]
  31. Almoosawi, S.; Vingeliene, S.; Karagounis, L.G.; Pot, G.K. Chrono-nutrition: A review of current evidence from observational studies on global trends in time-of-day of energy intake and its association with obesity. Proc. Nutr. Soc. 2016, 75, 487–500. [Google Scholar] [CrossRef] [Green Version]
  32. Leidy, H.J.; Clifton, P.M.; Astrup, A.; Wycherley, T.P.; Westerterp-Plantenga, M.S.; Luscombe-Marsh, N.D.; Woods, S.C.; Mattes, R.D. The role of protein in weight loss and maintenance. Am. J. Clin. Nutr. 2015, 101, 1320–1329. [Google Scholar] [CrossRef] [Green Version]
  33. Almoosawi, S.; Prynne, C.J.; Hardy, R.; Stephen, A.M. Time-of-day and nutrient composition of eating occasions: Prospective association with the metabolic syndrome in the 1946 British birth cohort. Int. J. Obes. 2013, 37, 725–731. [Google Scholar] [CrossRef] [PubMed] [Green Version]
  34. Paoli, A.; Bosco, G.; Camporesi, E.M.; Mangar, D. Ketosis, ketogenic diet and food intake control: A complex relationship. Front. Psychol. 2015, 6, 27. [Google Scholar] [CrossRef] [PubMed] [Green Version]
  35. Leidy, H.J.; Armstrong, C.L.; Tang, M.; Mattes, R.D.; Campbell, W.W. The influence of higher protein intake and greater eating frequency on appetite control in overweight and obese men. Obesity 2010, 18, 1725–1732. [Google Scholar] [CrossRef] [PubMed]
  36. Wycherley, T.P.; Moran, L.J.; Clifton, P.M.; Noakes, M.; Brinkworth, G.D. Effects of energy-restricted high-protein, low-fat compared with standard-protein, low-fat diets: A meta-analysis of randomized controlled trials. Am. J. Clin. Nutr. 2012, 96, 1281–1298. [Google Scholar] [CrossRef] [PubMed] [Green Version]
  37. Huffman, S.L.; Harika, R.K.; Eilander, A.; Osendarp, S.J. Essential fats: How do they affect growth and development of infants and young children in developing countries? A literature review. Matern. Child Nutr. 2011, 7, 44–65. [Google Scholar] [CrossRef]
  38. Trumbo, P.; Schlicker, S.; Yates, A.A.; Poos, M. Dietary reference intakes for energy, carbohydrate, fiber, fat, fatty acids, cholesterol, protein and amino acids. J. Am. Diet. Assoc. 2002, 102, 1621–1630. [Google Scholar] [CrossRef]
Figure 1. Diagram for the definition of meal patterns.
Nutrients 12 00799 g001
Figure 2. Energy and macronutrients intake from different meals. Panel A shows energy and macronutrient intake from breakfast, lunch, dinner, and snacks where macronutrient intake represents the percentage of total energy intake accounted for by the corresponding macronutrient. Panel B shows energy intake from breakfast, lunch, dinner, and snacks by meal patterns.
Nutrients 12 00799 g002
Table 1. Baseline characteristics by meal patterns.
Meal Patternp-Value *
BalancedBreakfast DominantLunch DominantDinner DominantSnack Dominant
Age (years)9.54 ± 1.18 9.54 ± 1.199.56 ± 1.189.59 ± 1.199.38 ± 1.170.66
BMI (kg/m2)16.98 ± 3.0917.15 ± 3.1217.44 ± 3.2417.34 ± 3.4016.90 ± 2.940.0413
WC (cm)57.88 ± 8.3958.43 ± 8.8859.23 ± 9.1158.87 ± 9.1456.92 ± 8.290.21
PBF (%)23.65 ± 4.9024.00 ± 4.7024.24 ± 4.9423.82 ± 4.9223.87 ± 4.490.25
SBP (mm Hg)100.04 ± 10.80100.43 ± 10.79100.89 ± 10.49101.25 ± 11.59101.26 ± 10.800.0026
DBP (mm Hg)64.14 ± 8.9564.01 ± 8.8864.10 ± 8.9764.56 ± 9.9164.51 ± 8.400.22
TC (mmol/L)4.11 ± 0.784.00 ± 0.774.12 ± 0.784.18 ± 0.833.92 ± 0.800.62
HDL-C (mmol/L)1.50 ± 0.311.45 ± 0.301.46 ± 0.301.48 ± 0.311.45 ± 0.300.0917
LDL-C (mmol/L)2.13 ± 0.602.04 ± 0.652.18 ± 0.622.21 ± 0.662.06 ± 0.640.0100
TG (mmol/L)0.80 ± 0.450.80 ± 0.420.84 ± 0.430.84 ± 0.510.85 ± 0.460.0045
Fasting glucose (mmol/L)4.55 ± 0.544.50 ± 0.584.52 ± 0.554.56 ± 0.544.36 ± 0.610.0196
Log insulin1.64 ± 0.621.64 ± 0.581.66 ± 0.641.74 ± 0.601.54 ± 0.560.18
Log HOMA-IR−2.86 ± 0.66−2.87 ± 0.62−2.84 ± 0.68−2.75 ± 0.63−2.99 ± 0.620.32
CMRS−0.33 ± 2.37−0.26 ± 2.37−0.04 ± 2.38−0.22 ± 2.45−0.34 ± 2.480.22
Physical activity (MET/week)597.96 ± 537.13665.70 ± 577.08624.26 ± 577.29626.43 ± 605.05613.57 ± 389.780.76
Energy (kcal/day)1387.47 ± 584.221111.51 ± 535.181260.94 ± 570.121360.68 ± 598.811361.39 ± 644.530.11
Protein intake (g/100 Kcal/day)4.31 ± 1.044.30 ± 1.064.39 ± 1.174.54 ± 1.223.90 ± 1.040.62
Fat intake (g/100 Kcal/day)2.93 ± 1.112.93 ± 1.072.86 ± 1.192.99 ± 1.253.36 ± 1.080.0002
Carbohydrate intake (g/100 Kcal/day)14.25 ± 2.8014.28 ± 2.7614.30 ± 3.1313.88 ± 3.1613.70 ± 2.740.0003
Fibre intake (g/100 Kcal/day)0.52 ± 0.300.51 ± 0.300.55 ± 0.370.54 ± 0.380.48 ± 0.240.70
Vitamin C intake (mg/100 Kcal/day)3.21 ± 2.513.16 ± 2.553.24 ± 2.633.43 ± 2.833.36 ± 2.510.0317
Vitamin E intake (mg/100 Kcal/day)0.26 ± 0.170.28 ± 0.190.25 ± 0.160.26 ± 0.170.36 ± 0.350.0034
Carotene intake (ug/100 Kcal/day)76.54 ± 74.6973.63 ± 81.2875.26 ± 86.9881.69 ± 95.1675.02 ± 71.970.31
Magnesium intake (mg/100 Kcal/day)14.78 ± 3.4314.96 ± 3.5415.15 ± 3.9215.09 ± 4.1614.47 ± 3.680.42
Potassium intake (mg/100 Kcal/day)99.25 ± 29.71100.61 ± 30.6798.93 ± 32.49101.62 ± 35.67103.58 ± 31.280.0453
Phosphorus intake (mg/100 Kcal/day)60.66 ± 12.7762.48 ± 13.1461.06 ± 13.4662.58 ± 14.5557.38 ± 13.740.32
Calcium intake (mg/100 Kcal/day)30.29 ± 13.9732.76 ± 16.8327.43 ± 13.4627.95 ± 13.8234.97 ± 18.910.0203
Iron intake (mg/100 Kcal/day)1.22 ± 0.681.12 ± 0.551.29 ± 0.891.21 ± 0.631.05 ± 0.500.50
Sex0.83
Boys668 (48.4) 791 (50.3)628 (49.6)481 (50.2)152 (45.1)
Girls713 (51.6)783 (49.7)638 (50.4)478 (49.8)185 (54.9)
Grade0.60
Two390 (28.2)442 (28.1)363 (28.7)260 (27.1)111 (32.9)
Three373 (27.0)475 (30.2)301 (23.8)253 (26.4)101 (30.0)
Four365 (26.4)422 (26.8)377 (29.8)260 (27.1)90 (26.7)
Five253 (18.3)235 (14.9)225 (17.8)186 (19.4)35 (10.4)
Puberty0.07
Yes1275 (92.3)1470 (93.4)1165 (92.0)862 (89.9)312 (92.6)
No106 (7.7)104 (6.6)101 (8.0)97 (10.1)25 (7.4)
BMI, body mass index; CMRS, cardiometabolic risk score; DBP, diastolic blood pressure; HDL-C, high-density lipoprotein cholesterol; HOMA-IR, homeostatic model assessment of insulin resistance; LDL-C, low-density lipoprotein cholesterol; MAP, mean arterial pressure; PBF, percent body fat; SBP, systolic blood pressure; TC, total cholesterol; TG, triglyceride; WC, waist circumference. * ANOVA was used to test the difference of continuous variables across meal patterns and chi-square test for categorical variables. All such data were mean ± standard deviation. All such data were frequency (%).
Table 2. Meal patterns and changes in cardiometabolic risk factors in children.
Meal Patternp-Value *
BalancedBreakfast DominantLunch DominantDinner DominantSnack Dominant
Change in BMI
 Participants136715531249945334
 β (95% CI) 0.032 (−0.0114, 0.076)0.039 (−0.006, 0.084)0.003 (−0.045, 0.052)0.010 (−0.061, 0.081)0.37
Change in WC
 Participants136015491245945334
 β (95% CI) −0.012 (−0.046, 0.022)0.032 (−0.003, 0.067)−0.006 (−0.044, 0.032)0.012 (−0.043, 0.068)0.13
Change in PBF
 Participants133715101209915326
 β (95% CI) 0.042 (−0.011, 0.095)0.012 (−0.043, 0.067)−0.035 (−0.094, 0.024)−0.069 (−0.156, 0.018)0.0320
Change in SBP
 Participants136115511246942333
 β (95% CI) 0.054 (−0.015, 0.123)0.046 (−0.025, 0.117)0.057 (−0.019, 0.133)−0.060 (−0.173, 0.052)0.17
Change in DBP
 Participants136315521248943334
 β (95% CI) 0.023 (−0.047, 0.094)0.007 (−0.066, 0.079)−0.013 (−0.092, 0.065)−0.057 (−0.172, 0.058)0.68
Change in MAP
 Participants136115501246943334
 β (95% CI) 0.038 (−0.032, 0.108)0.026 (−0.046, 0.098)0.016 (−0.061, 0.094)−0.053 (−0.167, 0.061)0.56
Change in TC
 Participants128314601175892316
 β (95% CI) −0.062 (−0.115, −0.008)0.001 (−0.054, 0.056)−0.025 (−0.084, 0.035)0.043 (−0.044, 0.130)0.0513
Change in HDL-C
 Participants128414591175891314
 β (95% CI) 0.027 (−0.049, 0.103)−0.066 (−0.144, 0.012)−0.027 (−0.1107, 0.057)0.270 (0.146, 0.393)<0.0001
Change in LDL-C
 Participants128414611176891316
 β (95% CI) −0.051 (−0.108, 0.006)−0.063 (−0.122, −0.004)−0.037 (−0.100, 0.026)0.004 (−0.089, 0.096)0.21
Change in TG
 Participants128214611176894317
 β (95% CI) −0.029 (−0.098, 0.039)0.001 (−0.070, 0.071)0.017 (−0.059, 0.093)−0.193 (−0.304, −0.082)0.0075
Change in fasting glucose
 Participants128414601176892317
 β (95% CI) 0.030 (−0.028, 0.088)−0.047 (−0.107, 0.013)0.015 (−0.050, 0.079)0.040 (−0.054, 0.135)0.11
Change in insulin
 Participants113212781035795273
 β (95% CI) −0.048 (−0.156, 0.059)−0.055 (−0.166, 0.055)0.119 (−0.0001, 0.237)−0.125 (−0.300, 0.051)0.0181
Change in HOMA-IR
 Participants113212771034795273
 β (95% CI) −0.036 (−0.142, 0.069)−0.069 (−0.177, 0.039)0.114 (−0.002, 0.230)−0.104 (−0.275, 0.068)0.0199
Change in CMRS
 Participants117913311066798300
 β (95% CI) 0.059 (−0.107, 0.225)0.113 (−0.058, 0.284)0.079 (−0.105, 0.264)−0.324 (−0.590, −0.058)0.031
BMI, body mass index; CI, confidence interval; CMRS, cardiometabolic risk score; DBP, diastolic blood pressure; HOMA-IR, homeostatic model assessment of insulin resistance; HDL-C, high-density lipoprotein cholesterol; LDL-C, low-density lipoprotein cholesterol; MAP, mean arterial pressure; PBF, percent body fat; SBP, systolic blood pressure; TC, total cholesterol; TG, triglyceride; WC, waist circumference. * GLM was used to estimate multivariable-adjusted β (95% CI) of cardiometabolic risk factors between-meal patterns with the balanced meal pattern as the reference. We used the Benjamin–Hochberg procedure to control the false discovery rate at level 5% for multiple comparisons with the P-value cut-off point of significance was 0.0071. Multivariable analysis was adjusted for classes in school as clustering effects and characteristics of individuals including age, sex, corresponding CMR factor at baseline, puberty, grade, intervention, BMI, physical activity, energy intake, protein intake, carbohydrate intake, fat intake, fiber intake, vegetable intake, fruit intake, pork intake, legumes intake, nuts intake, birthweight, household income, mother’s education, father’s education, mother’s BMI, and father’s BMI as fixed effects. CMRS was calculated by summing Z scores of WC, the average of SBP and DBP, fasting glucose, HDL-C (multiplying by –1), and TG.
Table 3. Energy intake from meals and snacks and change in cardiometabolic risk score *.
Consumption Levelp-Trend
Quintile 1Quintile 2Quintile 3Quintile 4Quintile 5
Energy from breakfast
 Range (%)<21.0621.06–27.3927.40–33.4033.41–41.67>41.67
 Participants940930933925946
 β (95% CI), Model 1 0.019 (−0.179, 0.216)0.036 (−0.161, 0.234)0.193 (−0.006, 0.391)0.042 (−0.158, 0.242)0.32
 β (95% CI), Model 2 §0.041 (−0.147, 0.228)0.026 (−0.162, 0.213)0.202 (0.013, 0.391)0.049 (−0.144, 0.241)0.24
 β (95% CI), Model 3 0.044 (−0.143, 0.232)0.023 (−0.164, 0.210)0.189 (0.0002, 0.377)0.043 (−0.149, 0.236)0.31
Energy from lunch
 Range (%)<20.8120.81–27.0727.08–32.5932.60–39.09>39.09
 Participants954942920932926
 β (95% CI), Model 1 0.037 (−0.161, 0.235)0.080 (−0.122, 0.283)0.135 (−0.068, 0.338)0.248 (0.044, 0.452)0.14
 β (95% CI), Model 2 0.016 (−0.172, 0.203)0.100 (−0.091, 0.292)0.138 (−0.054, 0.330)0.194 (0.0002, 0.387)0.24
 β (95% CI), Model 3 0.035 (−0.152, 0.223)0.091 (−0.1001, 0.283)0.143 (−0.049, 0.335)0.173 (−0.021, 0.367)0.38
Energy from dinner
 Range (%)<18.0818.09–24.3124.32–29.8829.89–36.64>36.64
 Participants957943913934927
 β (95% CI), Model 1 0.185 (−0.012, 0.381)0.167 (−0.032, 0.367)−0.027 (−0.225, 0.172)0.015 (−0.184, 0.213)0.10
 β (95% CI), Model 2 0.128 (−0.058, 0.314)0.126 (−0.063, 0.315)−0.049 (−0.237, 0.139)0.010 (−0.179, 0.199)0.23
 β (95% CI), Model 3 0.136 (−0.051, 0.322)0.145 (−0.045, 0.335)−0.029 (−0.218, 0.159)0.016 (−0.173, 0.205)0.22
Energy from snacks
 Range (%)00–2.472.48–8.328.33–19.03>19.03
 Participants1399457923944951
 β (95% CI), Model 1 −0.069 (−0.303, 0.164)−0.037 (−0.219, 0.145)−0.158 (−0.340, 0.024)−0.101 (−0.284, 0.082)0.51
 β (95% CI), Model 2 −0.003 (−0.224, 0.2184)−0.0140 (−0.1872, 0.1593)−0.1305 (−0.3058, 0.0448)−0.0827 (−0.2700, 0.1046)0.61
 β (95% CI), Model 3 0.018 (−0.204, 0.239)−0.010 (−0.183, 0.164)−0.102 (−0.277, 0.074)−0.064 (−0.251, 0.124)0.77
CI, confidence interval. * Cardiometabolic risk score was calculated by summing Z scores of waist circumference, the average of systolic and diastolic blood pressure, fasting glucose, high-density lipoprotein cholesterol (multiplying by –1) and triglyceride. GLM was used to estimate multivariable-adjusted β (95% CI) of cardiometabolic risk score between quintiles of energy intake from different meals with the quintile 1 as the reference. Model 1 was adjusted for classes in school as clustering effects and characteristics of individuals, including age, sex, and corresponding CMR factor at baseline as fixed effects. § Model 2 was adjusted for Model 1 plus puberty, grade, intervention, puberty, BMI, physical activity, and total energy intake. Model 3 was adjusted for Model 2 plus birthweight, household income, mother’s education, father’s education, mother’s BMI, and father’s BMI as fixed effects.
Table 4. Macronutrient intake from meals and snacks and change in cardiometabolic risk score*.
Consumption Levelp-Trend
Quintile 1Quintile 2Quintile 3Quintile 4Quintile 5
Carbohydrate at breakfast
 Range (% energy)<47.5447.54–56.3956.40–63.1963.20–72.05>72.05
 Participants948924920946936
 β (95% CI) −0.032 (−0.228, 0.163)−0.128 (−0.337, 0.080)−0.194 (−0.419, 0.030)−0.054 (−0.310, 0.202)0.31
Carbohydrate at lunch
 Range (% energy)<41.2441.24–52.6352.63–62.1562.16–72.16>72.16
 Participants923920922938971
 β (95% CI) 0.217 (0.018, 0.416)0.315 (0.098, 0.531)0.603 (0.368, 0.837)0.777 (0.509, 1.046)<0.0001
Carbohydrate at dinner
 Range (% energy)<36.6136.61–49.7949.80–60.7060.71–72.70>72.70
 Participants927927939944937
 β (95% CI) 0.345 (0.145, 0.545)0.601 (0.383, 0.818)0.662 (0.428, 0.907)0.663 (0.387, 0.938)<0.0001
Carbohydrate from snacks
 Range (% energy) 0–41.1241.13–63.9263.93–82.98>82.98
 Participants1393469922961929
 β (95% CI) 0.048 (−0.174, 0.269)−0.108 (−0.287, 0.072)−0.117 (−0.294, 0.060)0.077 (−0.097, 0.251)0.18
Protein at breakfast
 Range (% energy)<11.8311.83–13.7713.78–15.7615.77–18.61>18.61
 Participants954919947929925
 β (95% CI) 0.010 (−0.177, 0.196)0.026 (−0.169, 0.220)0.048 (−0.161, 0.257)−0.165 (−0.417, 0.086)0.30
Protein at lunch
 Range (% energy)<12.7812.78–15.8415.85–19.1419.15–23.92>23.92
 Participants959960931921903
 β (95% CI) 0.025 (−0.162, 0.213)0.143 (−0.054, 0.339)−0.263 (−0.474, −0.052)−0.4632 (−0.710, −0.217)<0.0001
Protein at dinner
 Range (% energy)<13.0113.01–16.8616.87–20.7520.76–26.47>26.47
 Participants933934933946928
 β (95% CI) 0.080 (−0.114, 0.273)−0.048 (−0.248, 0.153)0.102 (−0.111, 0.314)−0.360 (−0.602, −0.117)<0.0001
Protein from snacks
 Range (% energy)00–3.953.96–8.148.15–12.40>12.40
 Participants1412457921940944
 β (95% CI) −0.041 (−0.263, 0.180)−0.043 (−0.219, 0.134)−0.144 (−0.320, 0.033)0.064 (−0.113, 0.241)0.27
Fat at breakfast
 Range (% energy)<14.2314.23–21.3521.35–27.5927.60–35.20>35.20
 Participants935940925922952
 β (95% CI) −0.106 (−0.296, 0.085)−0.019 (−0.221, 0.183)−0.030 (−0.243, 0.183)0.086 (−0.158, 0.329)0.39
Fat at lunch
 Range (% energy)<11.1311.13–18.9818.99–26.2726.28–35.87>35.87
 Participants976925923916934
 β (95% CI) −0.260 (−0.453, −0.067)−0.296 (−0.504, −0.089)−0.507 (−0.726, −0.289)−0.441 (−0.685, −0.197)0.0003
Fat at dinner
 Range (% energy)<9.759.75–17.9517.96–26.7226.73–37.30>37.30
 Participants947940930922935
 β (95% CI) 0.169 (−0.027, 0.365)0.110 (−0.101, 0.321)−0.017 (−0.244, 0.210)−0.146 (−0.400, 0.109)0.10
Fat from snacks
 Range (% energy) 0–3.263.27–16.7816.79–33.34>33.34
 Participants1426443926939940
 β (95% CI) 0.040 (−0.184, 0.264)0.006 (−0.168, 0.180)−0.029 (−0.206, 0.149)−0.068 (−0.244, 0.107)0.89
CI, confidence interval; CMRS, cardiometabolic risk score * CMRS was calculated by summing Z scores of waist circumference, the average of systolic and diastolic blood pressure, fasting glucose, high-density lipoprotein cholesterol (multiplying by –1) and triglyceride. GLM was used to estimate multivariable-adjusted β (95% CI) of cardiometabolic risk score between quintiles of macronutrient intake from different meals with the quintile 1 as the reference. We used the Benjamin–Hochberg procedure to control the false discovery rate at level 5% for multiple comparisons with the P-value cut-off point of significance was 0.0208. Multivariable analysis was adjusted for classes in school as clustering effects and characteristics of individuals including age, sex, and CMRS at baseline, puberty, grade, intervention, puberty, BMI, physical activity, and total energy intake, intake of grains, fried foods, vegetable, fruit, nuts, pork, red meat rather than pork, poultry, eggs, milk, and sugar-sweetened beverage, birthweight, household income, mother’s education, father’s education, mother’s BMI, and father’s BMI as fixed effects.

