Article

The Effects of a Supermarket-Based Intervention on the Nutritional Quality of Private-Label Foods: A Prospective Study

1
The George Institute for Global Health, Faculty of Medicine, University of New South Wales, Sydney, NSW 2042, Australia
2
Menzies Centre for Health Policy, Sydney School of Public Health, Faculty of Medicine and Health, Charles Perkins Centre, University of Sydney, Sydney, NSW 2006, Australia
*
Author to whom correspondence should be addressed.
Nutrients 2020, 12(6), 1692; https://doi.org/10.3390/nu12061692
Submission received: 7 May 2020 / Revised: 28 May 2020 / Accepted: 2 June 2020 / Published: 5 June 2020
(This article belongs to the Section Nutrition and Public Health)

Abstract

:
Private-label products, products owned by supermarkets, are a growing area of the food supply. The aim of this study was to assess the effect of an intervention that provided an Australian supermarket (‘intervention supermarket’) with comparative nutrition data to improve the healthiness of their private-label range. Between 2015 and 2016, the intervention supermarket received reports that ranked the nutritional quality of their products against competitors. Changes in the nutrient content (sodium, sugar, saturated fat, energy and Health Star Rating) of products from the intervention supermarket between 2015 and 2018 were compared against changes achieved for three comparators (private-label products from two other supermarkets and branded products). The intervention supermarket achieved a significantly greater reduction in the sodium content of their products relative to all three comparators, which ranged between −104 and −52 mg/100 g (all p < 0.05). Conversely, the three comparators each achieved a greater relative reduction in the sugar content of their products by between −3.5 and −1.6 g/100 g (all p < 0.05). One of the comparators also had a greater relative reduction in the saturated fat and energy content of their products compared to the intervention supermarket (both p < 0.05). There were negligible differences in the Health Star Rating of products between the intervention supermarket and comparators (all p > 0.05). Providing comparative nutrition information to a supermarket may be ineffective in improving the healthiness of their private-label products, likely due to competing factors that play a role in the decision-making process behind product reformulation and product discontinuation/innovation.

1. Introduction

Non-communicable diseases (NCDs), including diabetes and cardiovascular diseases, are the leading cause of death and disability globally [1]. In Australia, NCDs accounted for 89% of all deaths in 2016 [2] and are a major and growing economic burden on the health system [3,4]. Unhealthy diets are a leading modifiable risk factor for NCDs [5,6,7], driven by the availability of processed foods that frequently contain high quantities of added sodium, sugar and saturated fat [8,9]. Supermarkets dominate the retail food sector and, therefore, play an important role in the provision of processed foods in Australia and globally [10,11].
In Australia, supermarket sales accounted for 62% of household food expenditure between 2012 and 2013 [12]. The supermarket sector has been largely dominated by two chains, which have made up ~70% of total grocery sales for the past five years [13]. Supermarkets stock a large and diverse range of processed foods and beverages [6], which can be classified into two groups—(i) branded products and (ii) private-label products. Branded products are those owned by food companies and available for sale across multiple supermarket chains, whereas private-label products are owned by the supermarket and sold exclusively in their own stores, also known as ‘own-brand’ or ‘home-brand’ products [14].
Supermarkets have invested in their private-label range to meet consumer demands for price, value and quality [15]. Today, many supermarkets have segmented their private-label products to provide value, mid-range and premium options [14], and have increased their product range within categories. Consequently, private-label products have experienced increased sales and shifts in consumer perceptions of their products, from ‘low cost, low quality’ to adequate quality [14,15,16]. Australian private-label foods and beverages are predicted to make up 26% of the total share of grocery sales by 2021 [17]—almost double the volume in 2009 [18]. As such, interventions that improve the healthiness of private-label foods and beverages could support consumers to make healthier choices [19,20] with potentially large impacts on population health [21].
This study reports on a co-developed intervention between public health nutrition researchers at The George Institute for Global Health and an Australian supermarket (hereafter, ‘intervention supermarket’). The aim of the intervention was to provide the intervention supermarket with comparative nutrition data to improve the healthiness of their private-label range over a period of 24 months. The objective of this paper was to assess the effect of this co-developed intervention on the healthiness of the supermarkets private-label products as measured by changes in sodium, sugar, saturated fat and energy and Health Star Rating (a voluntary, government-led front-of-pack nutrient profiling system [22]). To gain insight into the changes achieved in the context of the greater retail environment, we compared nutrient differences over time for the intervention supermarket relative to changes achieved for three comparator groups.

2. Materials and Methods

2.1. Intervention

The intervention was co-designed by researchers at The George Institute and the nutrition team at the intervention supermarket to help identify opportunities to improve the nutritional quality of their private-label products over a period of 24 months. Expectations relating to the process of the intervention were established and documented in a project set-up stage and aligned with principles for public–private partnerships [23,24]. This included agreement on roles and responsibilities, pre-defined timelines, project governance, issue management and agreement on product categories included within scope of the intervention. During the course of the intervention, fortnightly meetings of approximately one hour were held between The George Institute and the supermarket nutrition team. Working to a pre-agreed agenda, action items were discussed, documented and shared, and any issues were raised and resolved. In addition to this, there was communication via email and telephone in between meetings and formal presentations at the start and end of the intervention.
A total of 150 product categories were selected on the basis of (i) priority areas for the intervention supermarket, (ii) the stage in the product life-cycle and iii) alignment with public health initiatives [25]. A detailed list of product categories included in the intervention are provided in Table S1. Products were grouped into major product categories (e.g., bread and bakery products), minor categories (e.g., biscuits), and subcategories (e.g., savoury biscuits) using the FoodSwitch categorisation system, which is based on original work of the Global Food Monitoring Group [26]. All value, mid-range and premium options were included.
The intervention was delivered over a nine-month period, from April 2015 to January 2016. Thirty-five comparative benchmark nutrition reports covering 12 major, 30 minor and 150 detailed subcategories of foods and beverages were generated using a co-designed report template. The development of the reports was governed by a project manager and the reports and analysis were provided by public health researchers and Accredited Practising Dietitians at The George Institute. The reports were delivered to the nutrition team lead at the intervention supermarket and due dates for the reports were scheduled in the contract and were sent in batches of around four reports per month.
Each report detailed the number of products per manufacturer and provided a summary of nutritional composition [sodium (mg/100 g), sugar (g/100 g), saturated fat (g/100 g) and energy (kJ/100 g)] and Health Star Rating (stars) including the observed mean, median, and maximum and minimum level for each nutrient for all products available for sale across each manufacturer. The reports also ranked and compared the private-label products of the intervention supermarket against all competitor products according the nutrient content and Health Star Rating. The reports did not provide advice or recommendations for how the intervention supermarket should use or interpret the information provided.

2.2. Data Source for the Intervention—The Product Category Reports

The 2015 FoodSwitch monitoring database [27] was used to generate the product category reports. The entire database holds data for ~100,000 processed foods and beverages from a cross-sectional survey of packaged and barcoded foods that are available for sale each year, from August to October, from four major supermarkets (ALDI, Coles, IGA and Woolworths) in Sydney, Australia [27]. The nutrient information is obtained directly from the mandatory nutritional information panel and includes information regarding the nutrient content per 100 g/mL and per serve for all macro-and micro-nutrients listed. Other variables include the product name, manufacturer name, package size, nutrient claims and the Health Star Rating. The Health Star Rating rates the overall healthiness of a food according to the nutrient profile on a scale of 0.5 (least healthy) to five stars, in increments of 0.5 stars. The number of stars is based on a nutrient profiling algorithm, which has been described elsewhere [22]). The Health Star Rating was taken from the front of pack if displayed and if not, it was calculated in the FoodSwitch system using the Health Star Rating algorithm (using proxy values derived from the database where necessary) [27]. As described previously, data are entered according to rigorous and standardised procedures including screening for outliers and checks for data entry accuracy [27].

2.3. Comparators

Two Australian supermarkets (Comparators A and B) also selling private-label products were assigned as comparators. These supermarkets were selected as comparators as they had the largest number of private-label products in the FoodSwitch database and were largely comparable to the intervention in terms of number of products available for sale. All branded products available in the FoodSwitch database were also included in this study as a comparator (Comparator C).

2.4. Outcomes

As this was a trial, we a priori defined the primary outcome as the mean overall change in the sodium (mg/100 g), sugar (g/100 g), saturated fat (g/100 g) and energy (kJ/100 g) content, and Health Star Rating (stars) between 2015 and 2018.

2.5. Data Source—Intervention Outcomes

Nutrient data were sourced from the FoodSwitch monitoring databases for the years 2015 (n = 20,689) and 2018 (n = 22,165) [26]. Products were excluded if: (i) they were not targeted as part of the intervention (2015 = 12,378; 2018 = 12,895), (ii) they were missing energy, sodium, sugar and/or saturated fat information (2015 = 1037; 2018 = 241) or (iii) they were duplicate products (i.e., same products available in different pack sizes) (2015 = 571; 2018 = 601).
To account for repeated measures for products available in both years, all products were classified as either ‘matched’ or ‘unmatched’. Matched products were those available in both 2015 and 2018 based on barcode and product name. Unmatched products were those available in either 2015 or 2018 only. This disaggregation also allowed us to assess the extent of nutrient changes driven by product reformulation (matched products) versus product discontinuation and product innovation (unmatched products).

2.6. Statistical Analysis

The number and proportion of products available in each year and the percentage change in the number of products available over time were calculated.
The primary analysis involved comparing the mean change in nutrient content (sodium, sugar, saturated fat and energy) and Health Star Rating over time (2015 versus 2018) between the intervention supermarket and each of the three comparators. Dependent t-tests were used to assess mean differences in nutrient content over time (2015 versus 2018) for the matched products and independent t-tests were used to compare changes for unmatched products. Fixed effect meta-analyses were used to assess the change in nutrient content and Health Star Rating over time by pooling results for the matched and unmatched products. This was weighted to reflect the proportions of products available in 2018. Differences between the intervention and each of three comparators were calculated using summary estimates and standard errors from the meta-analyses using 100,000 Monte Carlo simulations to estimate uncertainty intervals for each nutrient and Health Star Rating.
To explore the potential impact of the nutrient content at baseline, we compared the mean nutrient content (sodium, sugar, saturated fat and energy) and Health Star Rating between the intervention supermarket and each of the three comparators for products available in 2015. Differences across groups were estimated using 1-factor ANOVA tests with Tukey’s honest significance difference test post-hoc analyses.
We also explored the nutrient content post-intervention by comparing the mean nutrient content (sodium, sugar, saturated fat and energy) and Health Star Rating between the intervention supermarket and each of the three comparators for products available in 2018. Differences between the intervention supermarket and each of the three comparators were estimated using 1-factor ANOVA tests with Tukey’s honest significance difference test post-hoc analyses.
To investigate the potential mechanisms in which the intervention supermarket achieved changes to the mean nutrient content (sodium, sugar, saturated fat and energy) and Health Star Rating between 2015 and 2018, we explored nutrient changes across both matched and unmatched products. Independent t-tests were used to compare changes over time for unmatched products and dependent t-tests were used for matched products. We also investigated overall change using a summary estimate from a fixed effect meta-analysis that pooled matched and unmatched products (and was weighted to reflect the proportions of products available in 2018). As supplementary analyses, descriptive statistics were used to describe the absolute change and percentage change in nutrient content over time within each group, by product category. Since sample sizes were sufficiently large to not require assumptions of normality, analyses and reporting are based upon mean values and parametric tests [28]. Two-sided p-values of <0.05 were considered statistically significant. To account for multiple testing, we applied the Benjamini–Hochberg procedure to decrease the false discovery rate. All statistical analyses were performed using Stata 15.0 (Stata Corp, College Station, TX, USA).

3. Results

In total, there were 6703 products analysed at baseline in 2015 and 8428 products in 2018. Across the four groups, Comparator C had the largest number of products in both years (2015 = 5026; 2018 = 6042), followed by Comparator B (2015 = 661; 2018 = 922), Comparator A (2015 = 596; 2018 = 899) and the intervention supermarket (2015 = 420; 2018 = 565).
The total number of products in each category for all years ranged from 35 for special foods to 1663 for bread and bakery products (See Table 1). With the exception of non-alcoholic beverages which decreased by 8.2%, the proportion of products in the other 11 categories all increased over time by between 2.9% and 69.6%.

3.1. Mean Nutrient Content in 2015 between the Intervention Supermarket and Comparators

In 2015, products from the intervention supermarket had a substantially lower sodium content compared with products from comparator C (mean difference: −91 mg/100 g; 95% CI: −8, −174; p = 0.03, Figure 1). However, no differences were observed between the intervention and comparators A and B. Products from the intervention supermarket had a lower sugar content in 2015 compared with comparator B (mean difference: −3.3 g/100 g; 95% CI: −1.2, −5.3; p < 0.001) but there were no differences between the intervention and comparators A and C. Similarly, products from the intervention supermarket had a lower saturated fat content compared with comparator B (mean difference: −1.1 g/100 g; 95% CI: −0.1, −2.2; p = 0.01) with no differences between the intervention and comparators A and C. In 2015, products from the intervention supermarket also had a higher Health Star Rating compared with products from comparator B (mean difference: +0.3 stars; 95% CI: +0.1, +0.5; p = 0.01) with no differences between the intervention and comparators A and C. In 2015, there were no differences in the mean energy content between the intervention supermarket and any of the comparators (Figure 1).

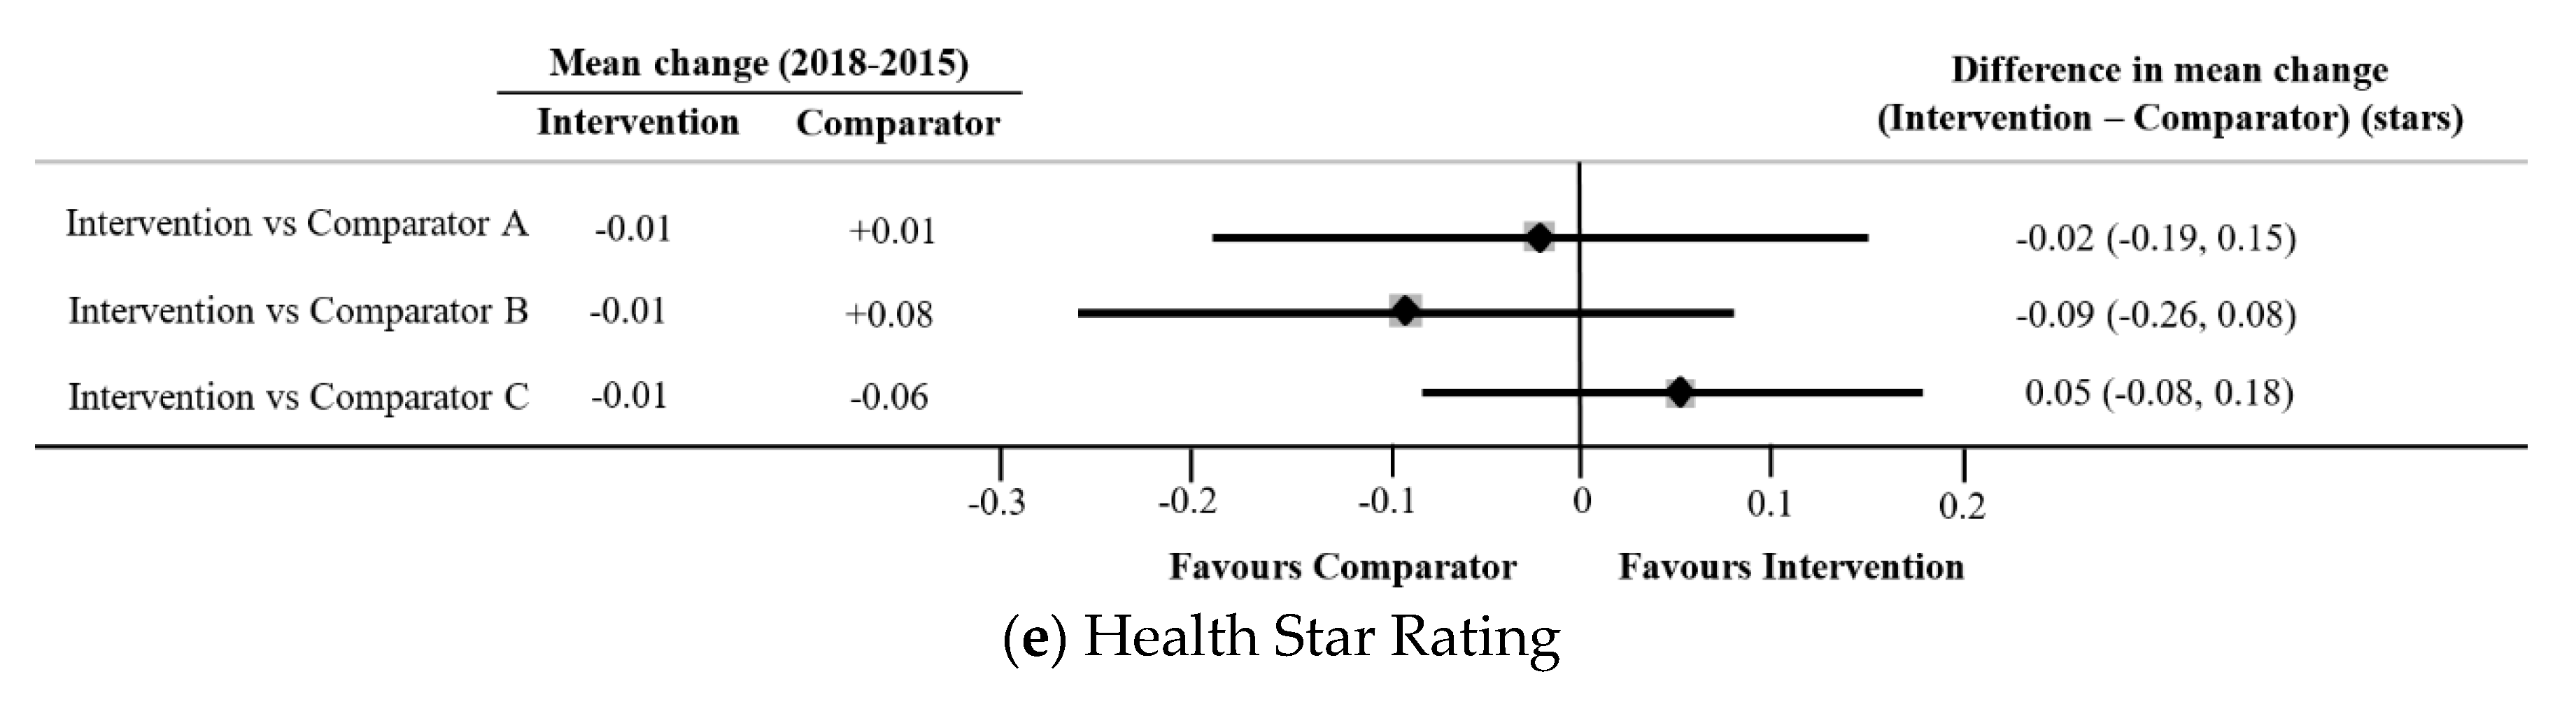
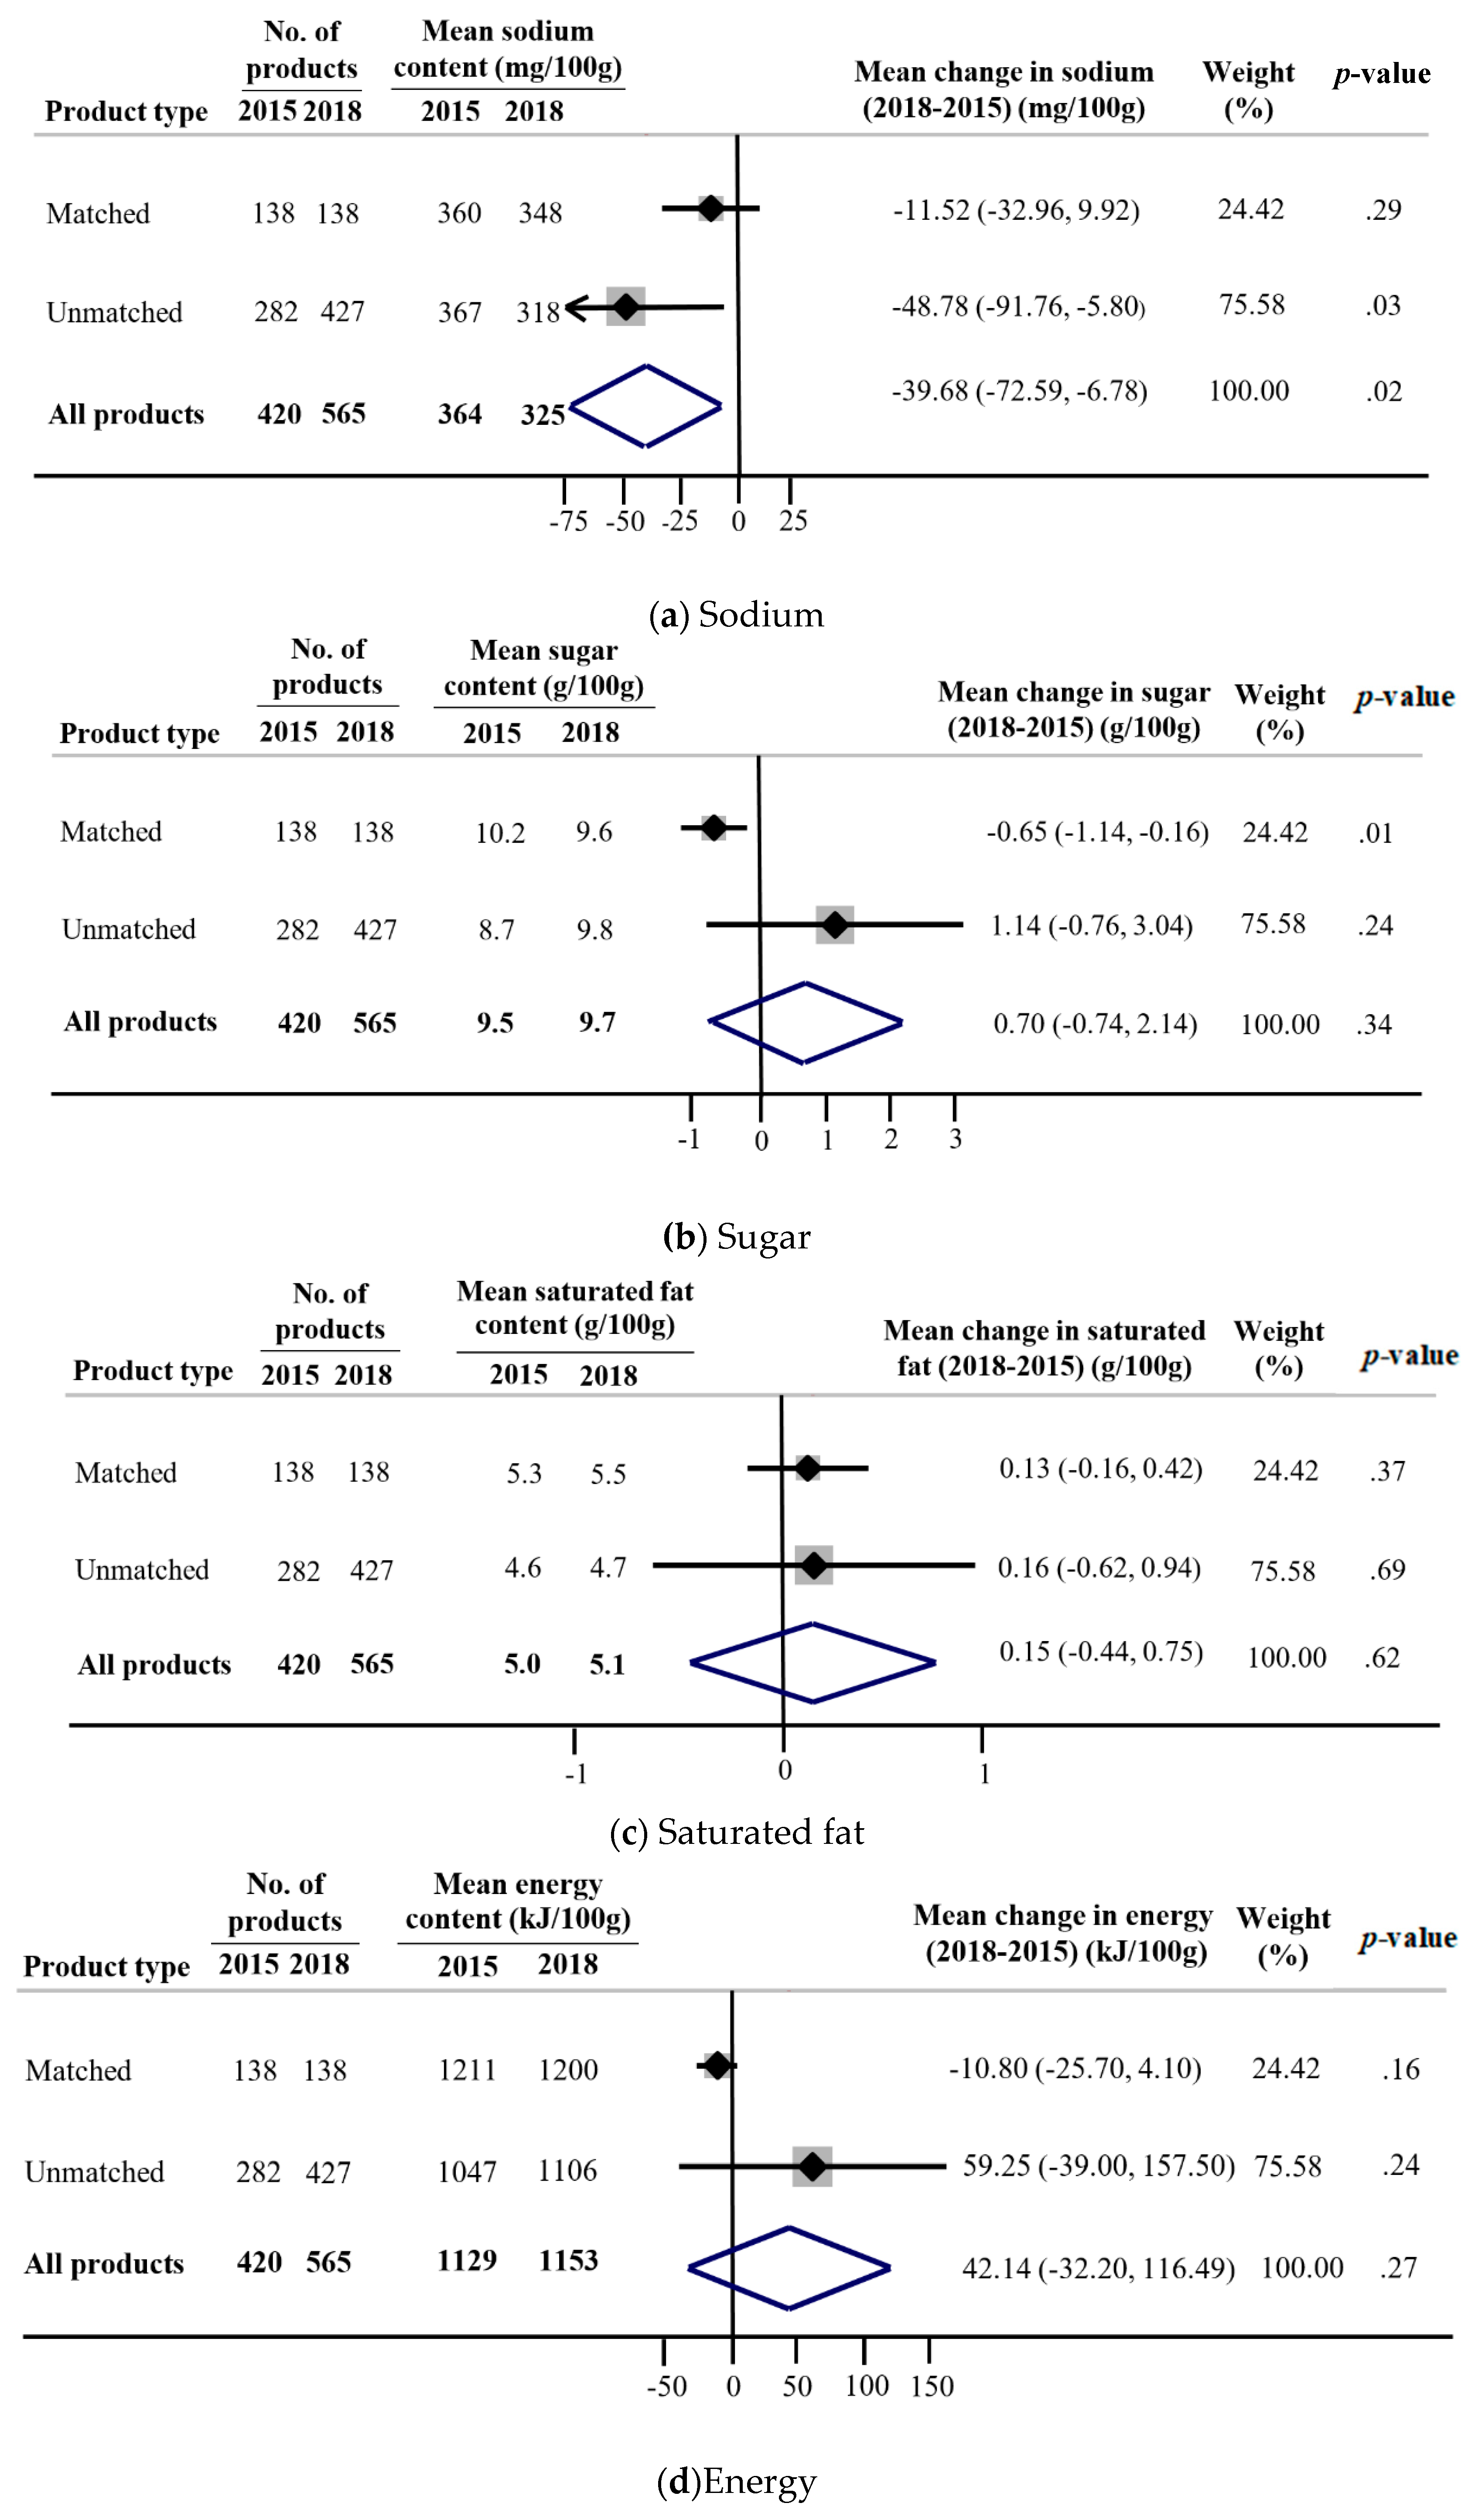
3.2. Differences in the Mean Change in Nutrient Content between 2015 and 2018 between the Intervention Supermarket and Comparators

The intervention supermarket had a greater reduction in the mean sodium content of its products over time relative to each of the three comparators (all p < 0.05) by between −104 and −52 mg/100 g (Figure 2a). Conversely, compared to the intervention supermarket, the three comparators each achieved a greater relative reduction in the mean sugar content of their products by between −3.5 and −1.6 g/100 g (all p < 0.05) (Figure 2b). Compared to the intervention supermarket, comparator B had a greater reduction in the saturated fat content of its products over time (−1.0 g/100 g; 95%CI: 0.1, 1.8) (p < 0.05) (Figure 2c). Similarly, comparator B had a greater relative reduction (p < 0.05) in the energy content of its products over time compared with the intervention supermarket (−121 kJ/100 g; 95% CI: −27, −215) (Figure 2d). There were no differences observed in the mean change in Health Star Rating over time between the intervention and any comparators (all p > 0.05) (Figure 2e).

3.3. Mean Change in Nutrient Content between 2015 and 2018 for Products in the Intervention Supermarket

A total of 985 products were available from the intervention supermarket between 2015 and 2018. Of these, 276 were matched products (138 in each year) and 709 were unmatched products, available only in 2015 (n = 282) or 2018 (n = 427). The overall mean sodium content was 10.7% lower in 2018 compared to 2015 (mean difference: −40 mg/100 g; 95% CI: −73, −7 mg/100 g; p < 0.02). For unmatched products, there was a 13.4% reduction in the mean sodium content (−49 mg/100 g; 95% CI: −92, −6; p = 0.03). No changes over time were observed for matched products (Figure 3a). Across specific product categories, over half (7 out of 12) had a numerical reduction in the mean sodium content (Table S2). The largest absolute reductions were found for meat and meat products (−195 mg/100 g), edible oils and oil emulsions (−133 mg/100 g) and cereal and grain products (−114 mg/100 g). The overall mean sugar content did not differ between 2015 and 2018 (p = 0.62). However, there was evidence to suggest that reformulation of products led to a sugar reduction, as the mean sugar content decreased significantly for matched products by 5.9% (−0.7 g/100 g; 95% CI: −1.1, −0.2; p = 0.01). No changes over time were observed for unmatched products (Figure 3b). Numerical reductions in mean sugar were observed for five of the twelve product categories, with the greatest reductions observed for sauces, dressings, spreads and dips (−1.4 g/100 g), convenience foods (−0.8 g/100 g) and bread and bakery products (−0.7 g/100 g) (Table S3). The overall mean saturated fat content, energy content and Health Star Rating did not change between 2015 and 2018, and no differences were observed for either matched or unmatched products (Figure 3c–e) (Tables S4–S6).

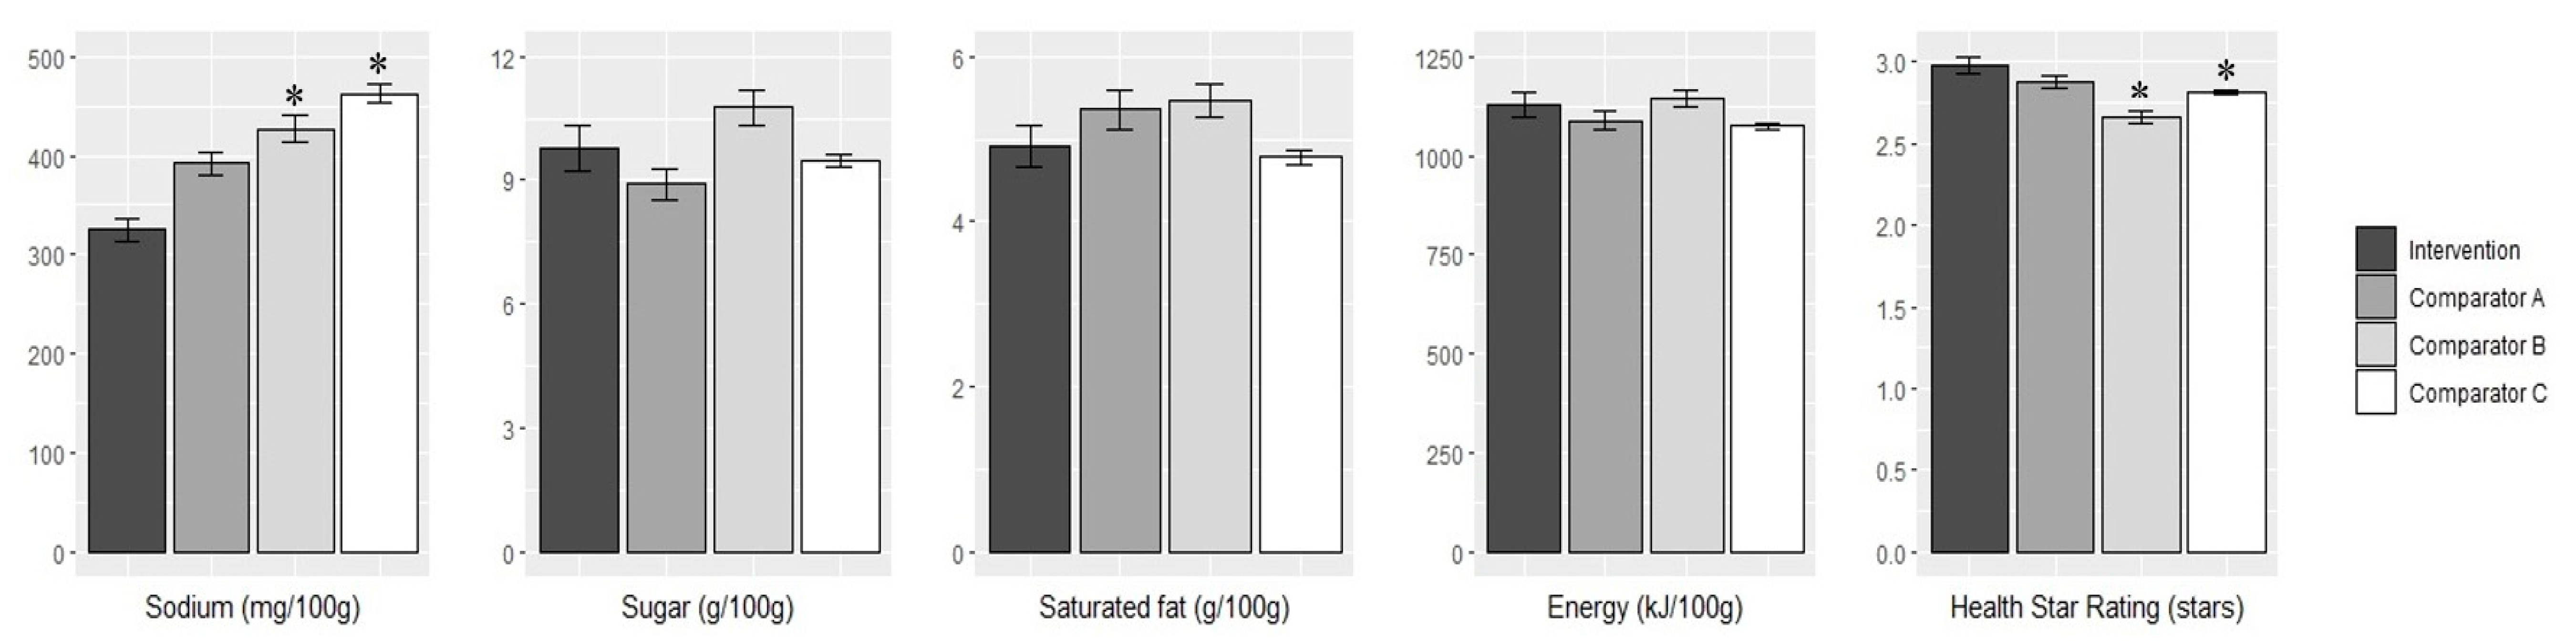
3.4. Comparison of the Mean Nutrient Content in 2018 between the Intervention Supermarket and Comparators

In 2018, the mean sodium content of products from the intervention supermarket was 325 ± 268 mg/100 g. This was significantly lower than products from comparator B (mean difference: −102 mg/100 g; 95% CI: −16, −188; p = 0.01) and comparator C (−137 mg/100 g; 95% CI: −66, 208; p < 0.001) but not comparator A (−67 mg/100 g; 95% CI: −153, +19; p = 0.2) (Figure 4).
Similarly, the mean Health Star Rating of products from the intervention supermarket in 2018 was 2.98 ± 1.18 stars. This was higher than products from comparator B (mean difference: +0.33 stars; 95% CI: +0.16, +0.49; p = 0.01) and comparator C (+0.17 stars; 95% CI: +0.03, +0.31; p < 0.001) but not comparator A (+0.1 stars; 95% CI: −0.1, +0.3; p = 0.4).
There were no differences between the intervention and any of the comparator groups in the mean sugar, saturated fat or energy content of products in 2018 (Figure 4).

3.5. Adjustment for Multiple Testing

After adjustment—by the Benjamini–Hochberg procedure—of all the p-values calculated in this study and keeping a false discovery rate at 10%, we have found no differences in the results in terms of statistical significance.

4. Discussion

Between 2015 and 2018, we identified a significant reduction in the mean sodium content of products in the intervention supermarket. However, no changes were observed for the sugar, saturated fat and energy content, and Health Star Rating. When changes to the nutrient content and Health Star Rating over time were compared against changes made by each of the three comparators, the intervention supermarket had a greater reduction in sodium over time. However, the results for sugar, saturated fat and energy were mostly in favour of the comparators. In 2018, the intervention supermarket had a lower sodium content and a higher Health Star Rating relative to two of the three comparators, with no differences across groups for sugar, saturated fat and energy.
At baseline, products from the intervention supermarket had less potential for improvement compared with comparators given their products generally had a lower sugar and saturated fat content and a higher Health Star Rating. As such, the greater relative reductions in sugar and saturated fat achieved by comparators was largely a consequence of these groups moving these nutrients down towards the levels already achieved by the intervention supermarket. Moreover, the comparative nature of the reports and the fact that the intervention supermarket generally had healthier products at baseline may have only emphasised to the nutrition team that their products were already of a greater nutritional quality thus reducing motivation to create improvements. Potentially different findings would have been observed if the intervention had focused on providing specific goals to improve the absolute quality of their private-label products, rather than in comparison with competitors.
The lack of consistent improvements achieved by the intervention supermarket in terms of the nutritional quality of their products may have also been influenced by a number of other factors. Over recent years, there has been intense competition between supermarket retailers in Australia as they continue to expand their private-label range [13]. This is likely to have generated competing priorities for supermarkets, influencing their decision-making process behind product reformulation, product discontinuation and new product development. This may have included considerations for cost, convenience and product sales as well as the taste and flavour of a product [29,30,31]. As a consequence, this may have reduced their emphasis on the nutritional quality. Moreover, it appears that the intervention supermarket prioritised sodium reduction, which may have been driven by public health initiatives around the time of the intervention. The previous federal government initiative, the Food and Health Dialogue [25,32], which ran from 2009 to 2015, had a specific focus on sodium including voluntary reformulation targets for a range of food categories. Similarly, its successor, the Healthy Food Partnership [33,34], established in late 2015, also has a focus on sodium reduction. However, the Healthy Food Partnership voluntary sodium reformulation targets were only released in 2020. Despite no actionable government policies at the time of the intervention, the long-term focus of sodium as part of government and non-government initiatives [35] may have motivated the intervention supermarket to prioritize this nutrient over others [36].
Previous literature has demonstrated that food companies employ different strategies to change the nutritional composition of their products depending on the nutrient and food category [37]. Our analysis of the nutritional changes achieved by the intervention supermarket according to matched and unmatched products supports this research. The intervention supermarket achieved greater reductions to the sodium content of its products due to formulation of new products and discontinuation of old product lines, rather than due to product reformulation. On the contrary, reductions to the sugar content were largely achieved by reformulation. The difference for matched and unmatched products for these nutrients suggests that both are valid strategies for improving the food supply. As such, it reinforces the importance of promoting both approaches to encourage food companies to improve the nutritional quality of their packaged foods and beverages [38]. As the market share of private-label products continues to grow [18,20] and as negative consumer preconceptions of inferior quality continue to be overturned [36], supermarkets will have increasing potential to play a significant role in improving healthiness of the food supply [39]. It is important that research continues to monitor the nutritional composition of the packaged food supply to track changes to nutrient levels, particularly with the high volume of new private-label products entering the market [40].
Public–private partnerships have been recommended globally, including as part of the United Nation Sustainable Development Goals [41], in order to help address public health challenges [24,42]. Whilst a number of public–private partnerships between large food companies and non-governmental organisations have been undertaken for many years to help tackle global issues [24], there are few examples within the supermarket sector, particularly in the Australian context [43]. This is an important area of research given the potential for supermarkets to have a positive impact on the Australian food supply given their considerable and ever-growing market share via their private-label products [44,45]. The limited overall improvement achieved by the intervention supports previous research suggesting that public–private partnerships with the food industry are largely ineffective without government regulation (or threat of regulation) [46,47].
Our study has several strengths. Firstly, the intervention was underpinned by evidence-based principles of public–private partnerships. This includes clearly defined goals that provide benefit to the public, project governance, clear objectives, defined baseline data to monitor progress and ongoing and transparent communication [23]. Secondly, we compared the results of the intervention against multiple comparators, which allowed us to consider the results of the intervention within the broader context of the food supply at the time of the intervention and post-intervention. We used an annually updated nutrition dataset that utilises a consistent and standardised method for obtaining nutrition information from products available from Australia supermarkets. This provided us with a reliable dataset across a comprehensive range of products, and the large sample size enhanced statistical power to assess differences in the nutrient quality of products over time and within and across groups. Our analysis, which disaggregated products as matched and unmatched, allowed us to examine nutrient changes from both reformulation and from discontinuation of products and introduction of new product lines.
A limitation of the analyses is that the nutrition information of products was only collected for products that were available in store at four supermarket store locations and, therefore, it is unlikely we have complete coverage of all relevant products. Nevertheless, as the data were collected systematically at four large supermarkets, it is likely the dataset is broadly representative of products available for sale at both time points. Secondly, this was not a controlled trial and, therefore, there are other factors such as company characteristics (size, ownership and market share) that may have contributed to the results seen. However, we have compared the intervention supermarket against three comparators which collectively represent a substantial proportion of the Australian food supply from the same economic and political environment as the intervention supermarket, thereby reducing potential bias that may have been introduced by comparing against just one group. As our paper analysed an Australian-based intervention and compared against other packaged foods sold in Australian supermarkets, there is uncertainty about the broader generalisability of our findings to other countries. Due to a small sample size across some food categories, we did not assess the effect of the intervention at the food category level due to risk of potential statistical conclusion errors. Additional research is required to analyse the impact of supermarket-based interventions at the food category level, particularly as some food categories may be easier to reformulate, which may help to identify effective interventions in the future.
Lastly, as the purpose of this study was to assess the nutrient outcomes arising from the intervention, future qualitative research in the form of a process evaluation is required to understand the extent to which the intervention supermarket used the information provided in the product category reports and how helpful these were in informing changes to their product portfolios. Additional research is also required to understand the barriers faced by supermarkets when undertaking reformulation and formulation of new products and the factors that are considered in the process—for example, the impact on product sales.

5. Conclusions

In conclusion, our findings demonstrate that an intervention based on supplying comparative nutrition data to a supermarket retailer was ineffective in achieving consistent improvements to the nutrient content of their private-label products. Relative to comparators, the intervention supermarket achieved a significant reduction in the sodium content of its products over time. However, no improvements were observed for sugar, saturated fat, energy or Health Star Rating. The limited impact of this intervention suggests that there are other factors influencing the decision-making process behind product reformulation, product discontinuation and product innovation such as cost, taste and the impact of product sales. However, additional research is required to explore these factors further.

Supplementary Materials

The following are available online at https://www.mdpi.com/2072-6643/12/6/1692/s1, Table S1: List of food categories selected as part of the intervention, Table S2: Percentage change in sodium content (mg/100 g) over time by product category, Table S3: Percentage change in sugar content (g/100 g) over time by product category, Table S4: Percentage change in saturated fat content (g/100 g) over time by product category, Table S5: Percentage change in energy content (kJ/100 g) over time by product category, and Table S6: Percentage change in Health Star Rating (stars) over time by product category.

Author Contributions

Conceptualization, H.T.; data curation, D.H.C.; formal analysis, D.H.C., G.L.D.T. and M.S.; funding acquisition, J.H.W. and B.N.; investigation, D.H.C.; methodology, J.H.W., G.L.D.T., B.N. and H.T.; project administration, D.H.C. and H.T.; visualization, D.H.C., J.H.W., B.N. and H.T.; writing—original draft, D.H.C.; writing—review and editing, D.H.C., J.H.W., F.T., B.N. and H.T. All authors have read and agreed to the published version of the manuscript.

Funding

This work was supported by a National Health and Medical Research Council Partnership Project (APP1167745) and an NHMRC Centre of Research Excellence (CRE) grant (APP1117300). D.H.C. is supported by Australian Government Research Training Program (RTP) Scholarship and a top-up scholarship from The George Institute for Global Health. H.T. is supported by a National Health and Medical Research Council of Australia, and National Heart Foundation of Australia Early Career Fellowship (APP1130871). B.N. is supported by a National Health and Medical Research Council of Australia Principal Fellowship (APP1106947). J.H.W. is supported by a Scientia Fellowship from the University of New South Wales. The George Institute was paid by the intervention supermarket only for the reports developed as part of the intervention. No funding was received to support any of the authors, nor was funding received for the current analysis. The views expressed in this paper are solely those of the authors.

Acknowledgments

We thank the researchers and dietitians who prepared the reports, and Elizabeth Dunford from The George Institute for Global Health for her early involvement. We also thank the nutrition team from the intervention supermarket for their contribution throughout this project including the development of the reports.

Conflicts of Interest

The authors declare no conflict of interest.

References

  1. GBD 2015 Risk Factors Collaborators. Global, regional, and national comparative risk assessment of 79 behavioural, environmental and occupational, and metabolic risks or clusters of risks, 1990–2015: A systematic analysis for the Global Burden of Disease Study 2015. Lancet 2016, 388, 1659–1724. [Google Scholar] [CrossRef] [Green Version]
  2. World Health Organization. Noncommunicable Diseases (NCD) Country Profiles, Australia. Available online: https://www.who.int/nmh/countries/aus_en.pdf?ua=1 (accessed on 4 October 2019).
  3. Willcox, S. Chronic diseases in Australia: The case for changing course; Australian Health Policy Collaboration Issues paper No. 2014-02; Australian Health Policy Collaboration: Melbourne, Australia, 2014. [Google Scholar]
  4. Australian Institute of Health and Welfare. Australia’s Health 2016; Australia’s health series no. 15. Cat. no. AUS 199; Australian Institute of Health and Welfare: Canberra, ACT, Australia, 2016.
  5. World Health Organization. Noncommunicable Diseases Progress Monitor 2017; World Health Organization: Geneva, Switzerland, 2017. [Google Scholar]
  6. Hawkes, C. Dietary implications of supermarket development: A global perspective. Dev. Policy Rev. 2008, 26, 657–692. [Google Scholar] [CrossRef]
  7. Melaku, Y.; Renzaho, A.; Gill, T.; Taylor, A.; Dal Grande, E.; de Courten, B.; Baye, E.; Gonzalez-Chica, D.; Hyppönen, E.; Shi, Z.; et al. Burden and trend of diet-related non-communicable diseases in Australia and comparison with 34 OECD countries, 1990-2015: findings from the Global Burden of Disease Study 2015. Eur. J. Nutr. 2019, 58, 1299–1313. [Google Scholar] [CrossRef] [PubMed]
  8. Euromonitor International. Packaged Food in Australia; Euromonitor International: London, UK, 2018. [Google Scholar]
  9. Rauber, F.; da Costa Louzada, M.; Steele, E.; Millett, C.; Monteiro, C.; Levy, R. Ultra-processed food consumption and chronic non-communicable diseases-related dietary nutrient profile in the UK (2008–2014). Nutrients 2018, 10, 587. [Google Scholar] [CrossRef] [Green Version]
  10. Pulker, C.; Trapp, G.; Foulkes-Taylor, F.; Scott, J.; Pollard, C. The extent and nature of supermarket own brand foods in Australia: Study protocol for describing the contribution of selected products to the healthfulness of food environments. Nutr. J. 2018, 17, 95. [Google Scholar] [CrossRef] [Green Version]
  11. Pulker, C.; Trapp, G.; Scott, J.; Pollard, C. The nature and quality of Australian supermarkets’ policies that can impact public health nutrition, and evidence of their practical application: A cross-sectional study. Nutrients 2019, 11, 853. [Google Scholar] [CrossRef] [Green Version]
  12. Department of Agriculture. Australian Food Statistics 2012–13; Department of Agriculture, Ed.; Australian Government: Canberra, Australia, 2014.
  13. Cloutman, N. IBISWorld Industry Report G4111: Supermarkets and Grocery Stores in Australia; IBISWorld: Los Angeles, CA, USA, 2018. [Google Scholar]
  14. Nenycz-Thiel, M. Private labels in Australia: A case where retailer concentration does not predicate private labels share. J. Brand Manag. 2010, 18, 624–633. [Google Scholar] [CrossRef]
  15. The Nielsen Company. The State of Private Label Around The World. Available online: https://www.nielsen.com/wp-content/uploads/sites/3/2019/04/Nielsen20Global20Private20Label20Report20November202014.pdf (accessed on 1 September 2019).
  16. The Nielsen Company. Our Penchant For Private Label. Available online: https://www.nielsen.com/au/en/insights/article/2014/our-penchant-for-private-label/ (accessed on 1 September 2019).
  17. The Nielsen Company. Find Your Growth. Available online: http://www.nielsen.com/au/en/insights/reports/2016/find-your-growth.html (accessed on 4 October 2019).
  18. Euromonitor International. Company Shares. Available online: http://www.portal.euromonitor.com (accessed on 24 August 2019).
  19. Glanz, K.; Bader, M.; Iyer, S. Retail grocery store marketing strategies and obesity: An integrative review. Am. J. Prev. Med. 2012, 42, 503–512. [Google Scholar] [CrossRef]
  20. Pulker, C.; Trapp, G.; Scott, J.; Pollard, C. What are the position and power of supermarkets in the Australian food system, and the implications for public health? A systematic scoping review. Obes. Rev. 2018, 19, 198–218. [Google Scholar] [CrossRef]
  21. Trevena, H.; Reeve, B.; Bero, L.; Thow, A. Private food safety standards in the global food supply chain: A scoping review protocol. JBI Evid. Synth. 2020, 18, 97–107. [Google Scholar] [CrossRef] [Green Version]
  22. Peters, S.; Dunford, E.; Jones, A.; Mhurchu, C.N.; Crino, M.; Taylor, F.; Woodward, M.; Neal, B. Incorporating added sugar improves the performance of the health star rating front-of-pack labelling system in Australia. Nutrients 2017, 9, 701. [Google Scholar] [CrossRef] [PubMed] [Green Version]
  23. Alexander, N.; Rowe, S.; Brackett, R.; Burton-Freeman, B.; Hentges, E.; Kretser, A.; Klurfeld, D.; Meyers, L.; Mukherjea, R.; Ohlhorst, S. Achieving a transparent, actionable framework for public-private partnerships for food and nutrition research. Am. J. Clin. Nutr. 2015, 101, 1359–1363. [Google Scholar] [CrossRef] [PubMed] [Green Version]
  24. Kraak, V.; Harrigan, P.; Lawrence, M.; Harrison, P.; Jackson, M.; Swinburn, B. Balancing the benefits and risks of public-private partnerships to address the global double burden of malnutrition. Public Health Nutr. 2012, 15, 503–517. [Google Scholar] [CrossRef] [PubMed] [Green Version]
  25. Elliott, T.; Trevena, T.; Sacks, G.; Dunford, E.; Martin, J.; Webster, J.; Swinburn, B.; Moodie, A.; Neal, B. A systematic interim assessment of the Australian Government’s Food and Health Dialogue. Med. J. Aust. 2014, 200, 92–95. [Google Scholar] [CrossRef] [PubMed] [Green Version]
  26. Dunford, E.; Webster, J.; Metzler, A.; Czernichow, S.; Mhurchu, C.N.; Wolmarans, P.; Snowdon, W.; L’Abbe, M.; Li, N.; Maulik, P.; et al. International collaborative project to compare and monitor the nutritional composition of processed foods. Eur. J. Prev. Cardiol. 2012, 19, 1326–1332. [Google Scholar] [CrossRef]
  27. Dunford, E.; Trevena, H.; Goodsell, C.; Ng, K.; Webster, J.; Millis, A.; Goldstein, S.; Hugueniot, O.; Neal, B. FoodSwitch: A mobile phone app to enable consumers to make healthier food choices and crowdsourcing of national food composition data. JMIR mHealth uHealth 2014, 2, e37. [Google Scholar] [CrossRef]
  28. Lumley, T.; Diehr, P.; Emerson, S.; Chen, L. The importance of the normality assumption in large public health data sets. Annu. Rev. Public Health 2002, 23, 151–169. [Google Scholar] [CrossRef]
  29. Van Gunst, A.; Roodenburg, A.; Steenhuis, I. Reformulation as an integrated approach of four disciplines: A qualitative study with food companies. Foods 2018, 7, 64. [Google Scholar] [CrossRef] [Green Version]
  30. OECD. The Heavy Burden of Obesity: The Economics of Prevention; OECD Publishing: Paris, France, 2019. [Google Scholar]
  31. Yeung, C.; Gohil, P.; Rangan, A.; Flood, V.; Arcot, J.; Gill, T.; Louie, J. Modelling of the impact of universal added sugar reduction through food reformulation. Sci. Rep. 2017, 7, 1–8. [Google Scholar] [CrossRef] [Green Version]
  32. Jones, A.; Magnusson, R.; Swinburn, B.; Webster, J.; Wood, A.; Sacks, G.; Neal, B. Designing a healthy food partnership: Lessons from the Australian Food and Health Dialogue. BMC Public Health 2016, 16, 651. [Google Scholar] [CrossRef] [Green Version]
  33. Healthy Food Partnership. Healthy Food Partnership Reformulation Program: Evidence Informing the Approach, Draft Targets and Modelling Outcomes. Available online: http://www.health.gov.au/internet/main/publishing.nsf/Content/reformulation (accessed on 18 September 2019).
  34. Healthy Food Partnership. Reformulation Working Group. Available online: https://www1.health.gov.au/internet/main/publishing.nsf/Content/reformulation (accessed on 30 September 2019).
  35. WHO. Shake The Salt Habit. Available online: https://apps.who.int/iris/bitstream/handle/10665/250134/WHO-NMH-PND-16.4-eng.pdf?sequence=1 (accessed on 3 June 2019).
  36. Trevena, H.; Neal, B.; Dunford, E.; Haskelberg, H.; Wu, J. A comparison of the sodium content of supermarket private-label and branded foods in Australia. Nutrients 2015, 7, 7027–7041. [Google Scholar] [CrossRef] [PubMed]
  37. Spiteri, M.; Soler, L. Food reformulation and nutritional quality of food consumption: An analysis based on households panel data in France. Eur. J. Clin. Nutr. 2018, 72, 228–235. [Google Scholar] [CrossRef] [PubMed] [Green Version]
  38. Spiteri, S.; Olstad, D.-L.; Woods, J. Nutritional quality of new food products released into the Australian retail food market in 2015—Is the food industry part of the solution? BMC Public Health 2018, 18, 222. [Google Scholar] [CrossRef] [PubMed] [Green Version]
  39. Sacks, G.; Mialon, M.; Vandevijvere, S.; Trevena, H.; Snowdon, W.; Crino, M.; Swinburn, B. Comparison of food industry policies and commitments on marketing to children and product (re)formulation in Australia, New Zealand and Fiji. Crit. Public Health 2014, 25, 299–319. [Google Scholar] [CrossRef]
  40. Crino, M.; Sacks, G.; Dunford, E.; Trieu, K.; Webster, J.; Vandevijvere, S.; Swinburn, B.; Wu, J.; Neal, B. Measuring the healthiness of the packaged food supply in Australia. Nutrients 2018, 10, 702. [Google Scholar] [CrossRef] [Green Version]
  41. Sustainable Development Goals. Sustainable Development Goal 17. Available online: https://sustainabledevelopment.un.org/sdg17 (accessed on 1 October 2019).
  42. Buse, K.; Walt, G. Global public-private partnerships: Part I—A new development in health? Bull. World Health Organ. 2000, 78, 549–561. [Google Scholar]
  43. Deakin University. World-First Trial Puts Healthy Supermarkets to the Taste Test. Available online: https://www.deakin.edu.au/about-deakin/media-releases/articles/world-first-trial-puts-healthy-supermarkets-to-the-taste-test (accessed on 1 October 2019).
  44. Pulker, C.; Trapp, G.; Scott, J.; Pollard, C.M. Global supermarkets’ corporate social responsibility commitments to public health: A content analysis. Global Health 2018, 14, 121. [Google Scholar] [CrossRef] [Green Version]
  45. Sacks, G.; Robinson, E.; Cameron, A. Inside Our Supermarkets: Assessment of Company Policies and Commitments Related to Obesity Prevention and Nutrition, Australia 2018; Deakin University: Melbourne, Australia, 2018. [Google Scholar]
  46. Moodie, R.; Stuckler, D.; Monteiro, C.; Sheron, N.; Neal, B.; Thamarangsi, T.; Lincoln, P.; Casswell, S. Profits and pandemics: Prevention of harmful effects of tobacco, alcohol, and ultra-processed food and drink industries. Lancet 2013, 381, 670–679. [Google Scholar] [CrossRef]
  47. Brownell, K. Thinking forward: The quicksand of appeasing the food industry. PLoS Med. 2012, 9. [Google Scholar] [CrossRef]
Figure 1. Comparison of the mean nutrient content [sodium (mg/100 g), sugar (g/100 g), saturated fat (g/100 g) and energy (kJ/100 g)] and Health Star Rating in 2015 between the intervention supermarket and comparators. Errors bars indicate the standard error (SE). Differences across groups were estimated using 1-factor ANOVA tests with Tukey’s honest significance difference test post-hoc analyses. * indicates significance difference compared to intervention supermarket (p < 0.05).
Nutrients 12 01692 g001
Figure 2. Differences in mean change in nutrient content (sodium (mg/100 g), sugar (g/100 g), saturated fat (g/100 g) and energy (kJ/100 g)) and Health Star Rating (stars) between 2015 and 2018 across the intervention supermarket and comparators Fixed effect meta-analyses were used to assess the change in nutrient content over time within each group. Each meta-analysis was weighted to reflect the proportions of products available in 2018. Differences across groups were then calculated using summary estimates and standard errors from the meta-analyses using 100,000 Monte Carlo simulations for each nutrient content.
Nutrients 12 01692 g002aNutrients 12 01692 g002b
Figure 3. Mean change in nutrient content [sodium (mg/100 g), sugar (g/100 g), saturated fat (g/100 g) and energy (kJ/100 g)] and Health Star Rating between 2015 and 2018 for products in the intervention supermarket. Matched products are products available in both 2015 and 2018 and unmatched products are those available in either 2015 or 2018. Dependent t-tests were used to assess mean differences in nutrient content over time (2015 versus 2018) for the matched products and independent t-tests were used to compare changes over time for unmatched products. Differences in the nutrient content over time were estimated separately for matched and unmatched products and the overall changes were obtained using a summary estimate from a fixed effect meta-analysis. Each meta-analysis was weighted to reflect the proportions of products available in 2018.
Nutrients 12 01692 g003aNutrients 12 01692 g003b
Figure 4. Comparison of the mean nutrient content (sodium (mg/100 g), sugar (g/100 g), saturated fat (g/100 g) and energy (kJ/100 g)) and Health Star Rating (stars) in 2018 between the intervention supermarket and comparators. Errors bars indicate the standard error (SE). Differences across groups were estimated using 1-factor ANOVA tests with Tukey’s honest significance difference test post-hoc analyses. * indicates significance difference compared to intervention supermarket (p < 0.05).
Nutrients 12 01692 g004
Table 1. Number (per cent) of all products and specific product types available in each year.
Product CategoriesAll groups
n (%)Change over Time (%)
20152018
All products6703 (100)8428 (100)+25.7
Bread and bakery products1344 (20.1)1663 (19.7)+23.7
Cereal and grain products699 (10.4)837 (9.9)+19.7
Convenience foods624 (9.3)1058 (12.6)+69.6
Dairy1069 (15.9)1383 (16.4)+29.4
Edible oils and oil emulsions79 (1.2)100 (1.2)+26.6
Fish and fish products289 (4.3)309 (3.7)+6.9
Fruit and vegetables521 (7.8)545 (6.5)+4.6
Meat and meat products577 (8.6)853 (10.1)+47.8
Non-alcoholic beverages256 (3.8)235 (2.8)−8.2
Sauces, dressings, spreads and dips944 (14.1)1111 (13.2)+17.7
Snack foods266 (4.0)298 (3.5)+12.0
Special foods35 (0.5)36 (0.4)+2.9

