The population of the eighth-most populous country of the world, Bangladesh, has been suffering from chronic energy deficiency during the 1960s, 1970s, 1980s, and 1990s, and apparent energy intake was less than 2200 kcal/day/person. Since the late 1990s, Bangladesh has made remarkable progress in raising the apparent energy consumption in the diet. Eventually, apparent energy intake increased by 20.5% in Bangladesh over the last 57 years (1961–2017), reaching almost 2600 kcal/day/person in 2017. During the 57-year time span, apparent energy intake showed a boat-shaped changing pattern that was solely determined and almost similar to the changing trends of carbohydrates; however, carbohydrates continued to remain by far the most over eaten macronutrient in the Bangladeshi diet. Even in 2017, carbohydrates contributed to about 79% of the apparent energy intake in the diet. Apparent intake trends of energy and macronutrients were disrupted (energy and carbohydrate) and stable with an inadequately low base (protein and fat) before, during, and following the Liberation War of 1971. Following 1980, a decreasing trend of carbohydrate energy and an increasing trend of fat energy were observed in the Bangladeshi diet. Since the late 1970s, apparent fat intake in the diet started to increase significantly at a marked rate by 2.16% per year, whereas since the early 1990s, the apparent protein intake increased significantly by 1.33% per year. Plant sources mostly dictated the protein and fat intake trends in the Bangladeshi diet since 1960, whereas animal sources started to contribute significantly since 1990 in protein intake by 3.43% per year and since 2000 in fat intake by 2.88% per year.
4.1. Trends in the Apparent Intake of Energy
Apparent dietary intake, in terms of per capita daily energy (kcal) intake, is the key variable used for measuring and assessing the evaluation of the worldwide food situation [
15]. Moreover, apparent energy intakes can describe the nutrition transition at the most general level [
2]. Our analysis revealed that Bangladesh has experienced a late energy revolution in their dietary history. During the 1960s, 1970s, 1980s, and 1990s, Bangladesh was suffering from substantive calorie deficits, and apparent energy intake was less than 2200 kcal/day/person. Since the late 1990s, Bangladesh gained remarkable momentum in raising the apparent energy consumption in the diet, which slowed down later. At the beginning of the 1960s, the entire developing world, apart from the only a handful of countries, was suffering from substantial calorie deficits, chronic malnutrition, and population-wide famine. During this period, Asia in particular was frequently hit by famine, affecting large segments of its population [
2]. In the case of Bangladesh, during the 1960s and 1970s, food availability was seriously disrupted before, during, and immediately after the Liberation War of 1971, as well as following natural disasters such as cyclones, droughts, and floods [
7]. The population of Bangladesh has been known to be in a state of chronic malnutrition for many decades, and the enormity of this problem was first documented in a benchmark nutrition survey carried out during 1962–1964 [
28]. That benchmark survey quantified the prevalence and effects of widespread malnutrition on the population of Bangladesh during the 1960s, evidenced by physical signs and biochemical markers of deficiency and gaps between intake and requirements. Protein energy malnutrition, vitamin A deficiency, riboflavin deficiency, anemia, goiter, and vitamin C deficiency were reported as specific problems of the population [
11]. The changes in apparent energy intake have influenced the nutrition and health of the population in Bangladesh. In our analysis, the first trend in apparent energy intake spanned from 1960 to just after the liberation war of Bangladesh (1971), being characterized by a decline in the availability of dietary energy. During this period, there had been a detectable decline in per capita food production, with a distinct downward trend in per capita availability of food [
29]. Moreover, domestic food production in Bangladesh has failed to keep up with food demand generated by rapid population growth over this period. As a result, there has been a perceptible decline in per capita food availability and consumption [
7]. The nutrition and health implications of this change were well documented in the benchmark survey during 1962–1964. The survey reported that about 46% of the studied households had inadequate energy intake, which was supported by the skin fold thickness measurements of the population that indicated that the population was thin and had little subcutaneous fat [
11]. In addition, this declining trend in apparent energy intake also affected the child nutrition outcomes during the 1960s. The growth curve of Bangladeshi children aged 0–4 and 5–18 years was well below the 16th percentiles of reference growth curve of children of European descent, and during the growth spurts, the two curves deviated further, which indicated a further deviation of weight and height of Bangladeshi children from the reference children of European descent [
11]. On the other hand, during this period, DR-NCDs were not a major public health problem in Bangladesh; the overall prevalence of diabetes was only 1.5% among the population. Moreover, only 2.7% of males and 1.1% of females over 15 years of age had glucoseuria. Furthermore, 5.3% of the studied population (28 people) had cholesterol levels of 200 mg/100 mL of blood or greater [
11].
In the early 1970s, Bangladesh continued to be considered as a food-deficit country with a population of about 75 million. During 1970–1974, a noticeable decline in per capita calorie consumption was noted (about 6% from 1960–1965) [
29] due to Bangladesh’s War of Independence and its aftermath. An analysis of the pre-war (1970) and post-war (1973) direct cost estimation showed that Bangladesh incurred USD 9.53 billion in direct cost and USD 14.08 billion indirect cost of this war [
30]. Destruction of physical capital and human capital loss due to the brutality of Pakistani armies were considered in the direct cost measurement. During the post-liberation war period (1972), the per capita availability of daily energy was the lowest in the dietary history of Bangladesh (only 1877 kcal/day/capita). In the post-liberation period, during the 1970s and 1980s, apparent energy intake was inadequate in the diet. Since the liberation war until the late 1990s, the available energy increased at a marginal rate by 0.17% per year. The Bangladesh National Nutrition Surveys (in 1975–1976 and 1981–1982) alerted to the growing deterioration of nutritional status, which was accompanied by less and less energy intake in the diet of the Bangladeshi population. Energy intake was 2094 kcal/day/person in 1975–1976, which reduced to 1943 kcal/day/person in 1981–1982 [
10]. Widespread prevalence of protein energy deficiency in rural Bangladesh was also reported in a secondary data analysis of the National Nutrition Survey of Rural Bangladesh in 1975–1976 [
31]. The total prevalence of energy deficiency was around 59% and almost half of the energy-deficient households also had protein deficiency in the diet [
31]. This energy deficiency at the population level increased the prevalence of malnutrition, which was confirmed from the increased level of retarded physical growth of the children during the 1970s and early 1980s. On the basis of Gomez classification, in 1975–1976, about 26% of the under-five children were found severely malnourished, which was reduced to 15% in 1981–1982. Alarmingly, the prevalence of moderate malnutrition in under-five children was 53% in 1975–1976 and around 46% in 1981–1982 [
28]. Malnutrition was more prevalent among the children aged 5–11 years. About 36% of the 5–11-year-old children were found severely malnourished in 1975–1976, which reduced to 29.4% in 1981–1982 [
28].
Since the late 1990s, there was a significant increase in energy availability in the diet of Bangladeshi people. From the second half of the 1990s up to the first half the 2000s, the per capita daily energy availability in the diet increased annually by 60 kcal. During this period, energy availability increased from 2003 kcal/day/capita (in 1994) to 2382 kcal/day/capita (in 2004). This increasing trend of available energy in the 1990s in the Bangladeshi diet can be explained by the advancement and diffusion of new agriculture technology introduced since the second half of the 1980s [
7,
32]. Moreover, unlike most other Asian countries, Bangladesh had a sluggish start in terms of the Green Revolution and in the 1990s saw dramatic changes in the government policy [
33], which eventually caused a remarkable increase in apparent energy intake in Bangladesh since the late 1970s. Since 1990, the government progressively liberalized the agriculture inputs; specifically, small-scale irrigation equipment import policy. This resulted in an outstanding water control afforded by the irrigated
boro crops, wherein there was an accelerated yield in
boro crops [
7,
33]. Since the mid-1960s, the per capita available energy has been steadily increasing on a worldwide basis; available energy from the mid-1960s to the late 1990s increased globally by 450 kcal/day/capita and by over 600 kcal/day/capita in developing countries [
34]. Furthermore, from 1997 to 2015, the per capita food consumption (kcal/day/person) in South Asia increased from 2403 kcal/day/person to 2700 kcal/day/person [
35]. After the year 2000, the per capita daily available energy moved to a slower increasing phase with an increase of 10.0 kcal/year from 2001 to 2013. A re-analysis of the Household (Income and) Expenditure Survey (H(I)ES 2010) data showed that the per capita actual mean energy intake of the Bangladeshi population was 2190 kcal/day [
23]. Moreover, analyzing the same dataset, the Bangladesh Bureau of Statistics (BBS) reported that the per capita actual mean energy intake of the Bangladeshi population was 2308 kcal/day [
27]. The recent and the latest Household (Income and) Expenditure Survey (H(I)ES 2016) report by the BBS showed that per capita per day energy consumption decreased to 2210 kcal in 2016 and decreased by 4.23% from 2010 [
27]. This reduced actual energy consumption was due to the reduction of per capita daily food intake by 2.45% at the national level from 2010. The remarkable progress in apparent energy intake since the late 1990s was mainly achieved due to the high rice yields, which is the product of late Green Revolution in Bangladesh. These rice yields have ample and statistically meaningful associations with child weight gain [
33]. During 1997–2011, the 0.5 metric ton/acre increase in yields predicted a 0.4 SD improvement in the weight-for-height Z score. Moreover, the same increase in yields predicted a 12% decline in mild wasting [
33]. The increasing trend in apparent energy intake might have influenced the nutritional status of children and women in Bangladesh. The prevalence of stunting, underweight, and wasting decreased by around 19% (from 60% to 41.2%), 16% (from 52.2% to 36.2%), and 5% (from 20.6% to 15.5%) between 1996 and 2011, respectively [
36]. In 1997, 52% of women had chronic energy deficiency, which dropped to 45% in 2000, 38% in 2004, 30% in 2007, and 24% in 2011 [
37]. Bangladesh has experienced a considerable social and economic development. The per capita monthly income increased by 208% from 1995–1996 to 2010 and percentage of poor decreased by around 25% between 1991 and 2010. These might have also contributed to the improvement in maternal and child nutritional status in Bangladesh [
38].
4.2. Trends in the Apparent Carbohydrate, Protein, and Fat Intakes
Carbohydrates have been the most important and the bulkiest macronutrient for providing energy in the diet. In the developing countries, staples are the major contributor to carbohydrates in the diet. In case of Bangladesh, a re-analysis of the H(I)ES 2010 data reported that around 40% of the population had more than 75% of their total energy intake from carbohydrate alone [
23]. In line with the re-analysis of this national dataset, our analysis showed that carbohydrate alone had been contributing almost over 78% of the apparent energy share in the diet in Bangladesh during the 57-year time span, since 1961. The structural similarity of energy and carbohydrate intakes revealed that the apparent energy intake was largely determined by the apparent carbohydrate consumption in the diet. This similarity also revealed the lack of sufficient diversity in the diet with low availability of protein and fat over the 57-year period. Cereals, exclusively rice, have been the chief source of carbohydrates in the Bangladeshi diet, like other developing countries, particularly in Asia and parts of Africa [
39]. The likeness of the apparent cereal and carbohydrate intake trend in the Bangladeshi diet revealed the commanding role of cereals in the diet and mostly influenced and explained the trends in carbohydrate availability in the diet [
7].
From the beginning of the 1960s, the agro-industrial revolution in the developed world in the previous century got a foothold in the food and agriculture sectors of the most advanced developing countries [
32]. However, Bangladesh did not experience this agro-industrial revolution until the 1980s, which was reflected in the availability of energy and macronutrients in the diet. A particularly significant pattern that started to rise up in the 1980s was the change in the amount of dietary carbohydrate and fat energy supplies. A decreasing pattern of carbohydrate energy and increasing pattern of fat energy were observed after 1980. The present results show that during the early 1960s the food supply had a very high carbohydrate share and was very low in fat. More than 80% of the total energy (kcal/day/person) came from carbohydrate and less than 10% of the daily energy was from fat. By the early 1980s, the gap between energy from carbohydrate and energy from fat had started to reduce. This period can be treated as a transition period of carbohydrate and fat energy in the available diet of the Bangladeshi population. The re-analysis of the 2010 H(I)ES data showed that around 40% of the population had actual carbohydrate intake more than the recommended energy intake from carbohydrates (75%) and about 21% of the Bangladeshi population had carbohydrate intake more than 400 g/day [
23]. Moreover, 40% of the total population consumed less than 10% of the total energy from protein and 53% of the population took less than 15% of total energy from fat [
23]. Both the apparent and actual intake of macronutrients in the diet showed imbalance and deviation from the recommended intake level. The recommendation for Bangladeshi people is that about 55–75% of dietary energy should come from carbohydrates and 15–30% should come from fat [
23]. Furthermore, in 2002, the Institute of Medicine developed acceptable macronutrient distribution ranges (AMDRs) for carbohydrates, protein, and fat, setting forth an evidence-based range [
40]. These guidelines were designed to ensure an adequate intake of nutrients and to address the relation of macronutrients and DR-NCDs. The balance intake of macronutrients within the acceptable ranges has a role in reducing the DR-NCDs [
41,
42]. The intake values in the diets in the Bangladeshi population are at the far end of the acceptable macronutrient distribution ranges (AMDRs) for carbohydrates, protein, and fat. The shift towards increased energy supply from carbohydrates and low energy supply from protein and fat revealed the imbalance and deviation from AMDRs in the available diet in Bangladesh. Bangladesh experienced a large increase in overweight, and the DR-NCDs now impose a major health burden in Bangladesh; in terms of lives lost due to ill-health, disability, and premature death, DR-NCDs accounts for 61% of the total disease burden [
6]. In addition, the prevalence of overweight among Bangladeshi women increased from 5% in 2000 to 17% in 2011 [
37]. The mean BMI increased from 20.2 in 2004 to 21.4 in 2011, whereas the proportion of women who were overweight or obese increased to almost double (from 9% in 2004 to 17% in 2011) [
37]. In the case of children under five, overweight and obesity incidence increased from 0.7% in 2007 to 1.5% in 2011, signaling that Bangladesh is gradually experiencing a nutritional shift among the children in this age range [
38]. Apparent protein intake in the diet increased by about 15 g/day/person in an absolute amount from 1961 to 2017, and plant sources have been contributing more than 80% of the protein intake. During the 1960s, 1970s, 1980s, and the early 1990s, the apparent protein intake trend in the diet was almost stable with only 0.01% changes (from 45.5 g/day/person in 1961 to 43.5 g/day/person in 1994). This long stable protein intake trend was mostly determined by the protein from the plant sources, which accounted for about 88% of the apparent protein intake. In 1960–1965, per capita daily protein intake averaged 43.4 g and was almost 80% from cereals [
29]. By 1965–1970, protein intake reduced modestly, and the decline accelerated during the early 1970s [
29]. The first nutrition survey in Bangladesh during 1962–1964 reported that 64% of the households had inadequate protein intake. Almost 70% of the dietary protein was cereal protein and only 14% was from animal sources [
11]. In a population existing on a deficient diet, multifaceted deficiencies are more typical than deficiency of any single nutrient. For example, keratomalacia is frequently found to be associated with kwashiorkor, and the medical prognosis of protein deficiency is significantly more detrimental in the presence of keratomalacia [
11]. Foods of animal origin, especially milk and milk products, are the best sources of riboflavin and iron. Almost half of the population had deficient or low levels of urinary riboflavin excretion [
11], suggesting that riboflavin deficiency was widely prevalent among the population during the 1960s. Anemia, mostly iron deficiency anemia, is a general and severe problem in Bangladesh. About 45% of male children and 50% of female children were found to have hemoglobin concentration below 12 mg/100mL of blood. Alarmingly 60% of the pregnant and lactating women had low hemoglobin levels, with 80% of the anemia being caused by iron deficiency [
11].
Since the early 1990s, the apparent protein intake in the Bangladeshi diet increased considerably by 1.33% per year. Both animal and plant protein intakes increased significantly since the early 1990s and the rate of increase was comparatively much higher for animal protein (3.43% per year) than plant protein (0.94% per year). This trend in apparent animal protein intake was influenced and mostly can be explained by the availability of fish in Bangladesh [
7]. Fish is an important animal food in Bangladesh because of its increased availability, as well as its high micronutrient and protein content. The apparent protein intake trend in the Bangladeshi diet is approaching close to the recommended level, but more than 80% of the apparent protein intake is contributed by plant sources. The quality of the protein is poor, as even in cases of actual intake at the population level, around 75% of protein comes from plant sources [
23]. During the 1990s, more than 86% of the available protein was supplied by the plant sources, whereas animal sources contributed only 11–13% of the protein intake. Moreover, since 2015, protein contribution from animal sources increased to 20% of the apparent intake. Cereals, largely rice availability at the national level, influenced the apparent plant protein intake trend, and fish availability at the national level influenced the animal protein intake trend in the population diet in Bangladesh [
7]. The continued and rapid growth of aquaculture over the past 30 years has resulted in a 4.1-fold increase in total fish production in Bangladesh [
43]. Moreover, since 1990, there has been a considerable increase in milk, meat, and egg production in Bangladesh [
32]. The increasing consumption of animal food since 1990 might have acted to reduce the protein energy malnutrition in children under five in Bangladesh. The prevalence of underweight in 1989–1990 was more than 65% and came down to 47% in 2000 and around 36% in 2011.
The rise in the amount and nature of the fats consumed in the diet is a significant component of nutrition transition, with there being huge variations across areas of the world in terms of fat intake levels [
44]. The average global supply of fat increased by 20 g/day/person since 1967 until the last of the previous century, and this increase was most pronounced in the Americas, the European community, and East Asia [
45]. The largest share of dietary fat in the diets of developing countries comes from vegetable oils, which have shown a very high consumption growth in developing countries [
1]. Like other developing countries, Bangladesh experienced a 2.6-fold increase in the apparent consumption of vegetable oils from 1961 to 2013. This increased amount of apparent vegetable oil intake determined the fat availability trend in the diet [
7]. Fat from plant sources, mainly vegetable oils [
7], mostly dictated the fat intake trend, and since the late 1970s has increased by almost 10% (from 70.2% in 1977 to 80.3% in 2017). Fat intake from animal sources increased by only 0.23% per year during the 1960s and 1970s, and during this period, on average about 26% of the fat was sourced from animal foods. Since the early 1980s (average intake of only 3.50 g/day/person), apparent intake of fat from animal sources showed an upward trend, followed by a marked steep increase by 2.88% per year up until 2017 (only 6.68 g/day/person).
The rising consumption in per capita intake in Bangladesh is not always a sheer blessing. The related diet transition usually applies changes towards high energy-dense fat diets, particularly those high in saturated fat, sugar, and salt, and low in unrefined carbohydrates. In combination with unbalanced macronutrient intake and unbalanced proportion of macronutrients in the diet with lifestyle changes, rapid urbanization is often accompanied by a corresponding increase in DR-NCDs. The problem of DR-NCDs and acute and chronic malnutrition co-exist, and these countries are confronted with a double burden of malnutrition. A report from the Global Burden of Disease (GBD) shows that malnutrition was the number one health risk factor and cause of mortality in children aged under five years old in Bangladesh in the 1990s, whereas around 51% reduction of the rate of this health issue was observed in 2017 [
46]. Similarly, prior to the year 2000, which corresponds to the period of calorie deficit in the Bangladeshi diet, unlike DR-NCDs, infectious and diarrheal diseases have been among the major causes of death. However, since 2002–2004, an epidemiological transition has been observed in Bangladesh, with an increase in rates of DR-NCDs (diabetes, cardiovascular diseases) and decrease in the prevalence of diseases that are associated with malnutrition such as infectious diseases (−44.9% for respiratory infectious diseases and −6.5% for diarrheal diseases in 2017) [
46]. In fact, malnutrition causes immunodeficiency and reduces the capacity of the human organism to fight against diseases, infections in particular [
47]. Thus, the decrease in under-five mortality as well as that of rates of infectious diseases could, at least partially, be explained by the improvement of nutritional status (increase in energy intake) in Bangladesh in the last decades.
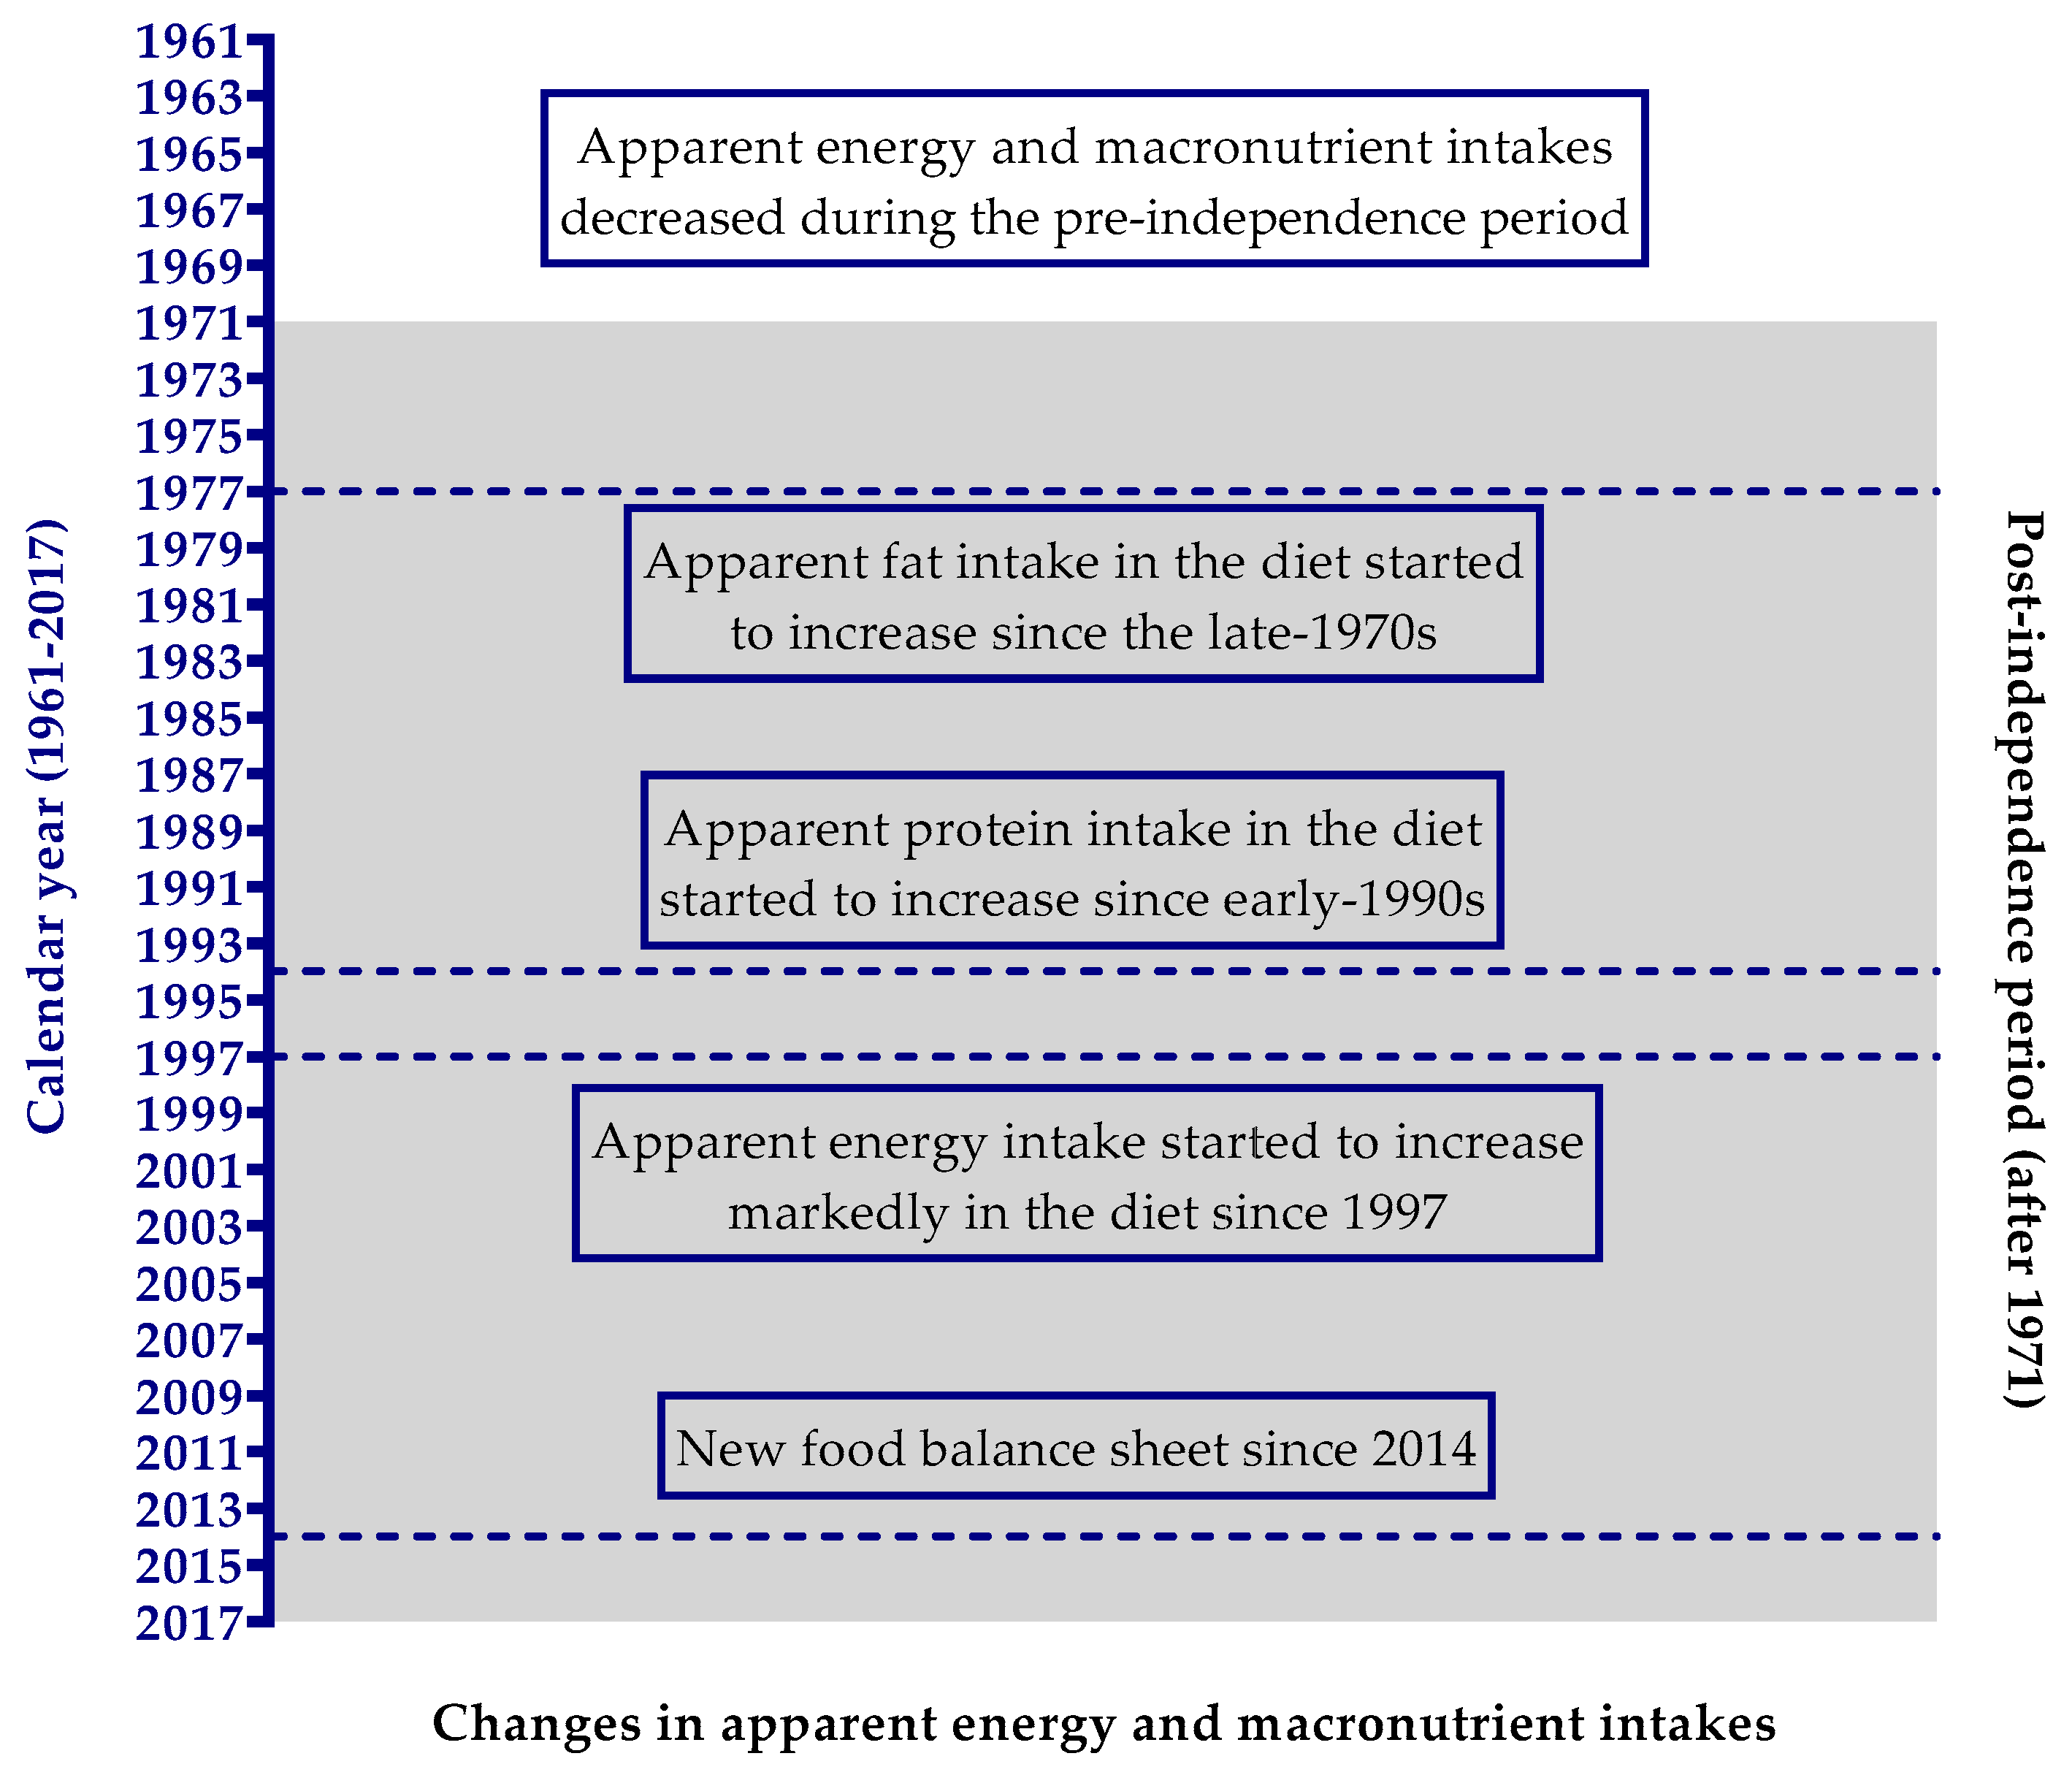
We have summarized the significant changes in apparent energy and macronutrient intakes in the Bangladeshi diet in
Figure 3. Bangladesh has experienced a late energy revolution in its dietary history. From the 1960s to the 1990s, Bangladesh was suffering from dietary energy deficiency as per capita energy availability was less than 2200 kcal/day. Since the late 1990s, Bangladesh has made remarkable progress in raising the apparent energy consumption in the diet. Energy availability increased by 20.5% in the diet from 1961 to 2017. Carbohydrate energy availability decreased by only 6.8%, while available fat energy increased by as much as 72.3% in the diet. Moreover, carbohydrate alone contributed almost more than 78% of the energy share in the diet during this 57-year time span. The carbohydrate energy showed nearly stable downward trends from 1961 to 1980 and, thereafter, significantly decreased at a very slow rate. Since the late 1970s, apparent fat intake in the diet started to increase significantly at a marked rate by 2.16% per annum, whereas from the early 1990s, the apparent protein intake increased significantly by 1.33% per year.
The FAO’s food balance sheet data have some shortcomings that need to be addressed. Energy and macronutrient intake data derived from this source do not indicate the actual consumption of energy, carbohydrate, protein, and fat. This is an average quantity of energy and macronutrients at the national level that was available for consumption at the household or individual level. Therefore, it is unfeasible from our study to make an inference on individual or sub-national level energy, carbohydrate, protein, and fat intake trends and to study the inequalities. Different confinements of this source are some practical issues, for example, coverage and representativeness of the basic data since most of the statistics developed are restricted to commercialized major food crops. Non-commercial or subsistence-level production, normally frequent in poor areas, was excluded. There is a potential issue of overestimating energy, protein, and fat consumption since the FBS does not take into account food losses that happen after the retail level. Food that is spoiled while processing at the household level, e.g., wasted trimmings, and as is regular practice in the rural parts of Bangladesh, food given to domestic animals inside the households, were not accounted for in the computation of the FBS. Another limitation is that there was a large disadvantage in enumerating the fruit and vegetable categories in the FBS, which might affect the energy calculation to some degree. In addition, in the old food balance sheet (reported from 1961 to 2013) inherited most of its statistical error related to the stocks and industrial utilization or feed values, which resulted in the outstanding unbalanced amounts in the FBS. Since 2014, in the new FBS, the advancement in computational quality, with a balancer variable and imputations, has reduced most of the statistical errors in the old FBS. Despite these limitations, the FBS is the only cost-effective tool for analyzing the temporal trend and for long-running comparisons of dietary changes at a national level in Bangladesh. Studies indicate that food balance sheets are useful for temporal trend analysis as the databases are standardized and updated regularly [
48]. Moreover, the use of FBS data to analyze the trends in nutrient availability in a country is more reliable than using absolute values at a single point in time [
48]. Food balance sheets are still a very good available data source for the analysis of energy and macronutrient intake changes during a particular period of time for a given country. Furthermore, with a wider view, FBS data, together with dietary intake data and with a wide range of other facts, can describe the nutrition and disease transition and their connection with agricultural revolution and economic growth [
49].

 ,
, 


