Abstract
Latin American (LA) women have been exposed to demographic and epidemiologic changes that have transformed their lifestyle, with increasing sedentary and unhealthy eating behaviors. We aimed to identify characteristics of LA women to inform public policies that would benefit these women and their future children. The Latin American Study of Nutrition and Health (ELANS) is a multicenter cross-sectional study of representative samples in eight Latin American countries (n = 9218) with a standardized protocol to investigate dietary intake, anthropometric variables, physical activity, and socioeconomic characteristics. Here we included the subsample of all 3254 women of childbearing age (15 to <45 years). The majority of ELANS women had a low socioeconomic status (53.5%), had a basic education level (56.4%), had a mostly sedentary lifestyle (61.1%), and were overweight or obese (58.7%). According to the logistic multiple regression model, living in Peru and Ecuador predicts twice the risk of being obese, and an increased neck circumference is associated with a 12-fold increased obesity risk. An increased obesity risk was also predicted by age <19 years (Relative Risk (RR) 19.8) and adequate consumption of vitamin D (RR 2.12) and iron (RR 1.3). In conclusion, the identification of these risk predictors of obesity among Latin American women may facilitate targeted prevention strategies focusing on high-risk groups to promote the long-term health of women and their children.
1. Introduction
The foundations for a healthy life are laid early, from pre-conception through pregnancy and early childhood. Maternal nutritional status at the time of oocyte implantation is a key determinant factor of embryonic and fetal growth [1,2]. Previous studies indicated that nutritional interventions prior to and during pregnancy can positively influence a newborn’s birthweight and well-being [3,4,5], making early dietary and lifestyle interventions a key strategy for achieving optimal population health. Obese women and their future children also benefit from interventions to achieve optimal weight before pregnancy, since obese childbearing-age women might have impaired fertility and increased risk for excessive weight gain during pregnancy, maternal complications, Cesarean delivery and fetal macrosomia, and ultimately higher mortality [6,7].
Obesity and undernutrition are key relevant factors for women of reproductive age as determinants for higher risks of chronic diseases later in life in the woman and in her offspring [8]. Food is an environmental exposure contributing to epigenetic modifications [9]. Global trends in dietary quality and micronutrient supplies reports 2.1 billion people are overweight or experiencing obesity, 2 billion have micronutrient deficiencies, and 795 million people live in hunger. All of the above include at some point women of reproductive age [10]. A major public health concern is the marked rise of obesity in low- and middle-income countries (LMIC). As an example, 20 million women were obese in India in 2014, in contrast to only 0.8 million in 1975 [11]. In addition, in WHO geographic locations of LMIC the estimated prevalence of obesity in women of fertile age varied according to region: from 39.5% in Egypt (the eastern Mediterranean) to 1% in Ethiopia (Africa) and 7.8% in Haiti (the Americas) [11]. In contrast, the median prevalence of underweight women aged 20–49 years from 36 developing countries was 5.9% and 9.3% for urban and rural areas, respectively [12]. Additionally, in 2016, 32.8% of global women of reproductive age (15–49 years) were affected by iron deficiency anemia [13].
Latin American populations have been exposed to rapid demographic, epidemiologic, and nutritional changes. These include a transformation towards a more sedentary lifestyle, an increased participation in the workforce, and moving towards urban life, yet many must deal with living in poverty and social inequalities that contribute to increased susceptibility to diseases [14].
Epidemiologic studies during the last decades have identified several markers associated with lifestyle factors related to future health risks, among those low socioeconomic status, poor education, limited diet diversity, short stature, low and high weight, and body mass index [1,15,16]. Diet is an important factor in modulating epigenetic markers and appears to link gene regulation to social living conditions [9]. In addition to diet, lack of physical activity, sleep deprivation, or living in poor conditions might influence epigenetic markers and related health outcomes. Thus, many environmental signals impact the development of disease. The consequences on the health of women that may become mothers can impact the health of future generations, and might be an opportunity for applying preventive strategies [17].
The aim of this study was to identify lifestyle and dietary characteristics of women of childbearing age through sociodemographic characteristics; dietary intake of energy, proteins, and micronutrients; physical activity; and anthropometric characteristics.
2. Materials and Methods
The Latin American Study in Nutrition and Health/Estudio Latinoamericano de Nutrición y Salud (ELANS) is a household-based, multicentric cross-sectional survey aimed at describing the nutritional and anthropometric status of Latin American populations, with an assessment of food and nutrient intake and physical activity levels of representative samples from urban populations in eight countries (Argentina, Brazil, Chile, Colombia, Costa Rica, Ecuador, Peru, and Venezuela). The fieldwork for the ELANS study was conducted from 2014 to 2015 [18].
2.1. Sample
The ELANS study enrolled 9218 adolescents and adults aged 15 to 65 years, including 3259 women aged between 15 and 45 years. Sampling was random complex multistage, stratified by geographical location, gender, age, and social economic level (SEL) only for the urban population [18]. For this analysis we selected all participating women of childbearing age from 15 to <45 years [19]. Subjects were stratified into subgroups by age from 15–<19 years (adolescents), 19–<35 years (young women), and 35–<45 years (older women).
All subjects gave their informed consent for inclusion before they participated in the study. The study was conducted in accordance with the Declaration of Helsinki, and the protocol was approved by the Western Institutional Review Board (#20140605). Ethics review boards of participating institutions approved this study, and it was registered in Clinical Trials (#NCT02226627).
2.2. Sociodemographic
Sociodemographic variables were collected through a questionnaire. Information on age (years), gender, years of education, race/ethnicity, and marital status was obtained. Socioeconomic level was categorized as low, middle, and high [18].
2.3. Dietary Assessment
The dietary assessment was conducted during 2 separate household visits on non-consecutive days, with an interval of up to 8 days between them. During both visits, a 24 h dietary recall (24-H) was conducted using the Multiple Pass Method [20] to assess all foods and beverages consumed over the prior day. The 24-H recalls included both weekdays and weekend days. The household’s measures obtained in the 24-H were converted to grams and milliliters by trained nutritionists.
Energy, macronutrient, and micronutrient intakes were calculated from the food and beverage intake with the Nutrition Data System for Research (version 2013 software (NDS-R), University of Minnesota, MN). A food-matching standardized procedure was conducted by professional nutritionists in each country. The complete food standardization procedure has been described in detail [21].
Regional foods, recipes, and commercial foods not available in the NDS-R database were broken down into ingredients and entered in the software as user recipes. These user recipes were created from the available NDS-R database and documented in food-matching control sheets. They were obtained from national publications, recipe books, and culinary websites of each country and checked against actual data from 24-H. When regional foods did not have an exact equivalent or similar food available in the NDS-R database, one or more foods combined were inserted as a recipe, as the software does not accept “new foods.” Local teams were responsible for creating a recipe that represented the same nutritional value as the original version. All food and beverages reported in both 24-H, considering all countries, were coded by the NDS-R software.
2.3.1. Dietary Intake
Two 24-H recalls were used to estimate habitual food consumption and to evaluate intra-individual variability in nutrient intake. The web-based statistical modeling technique Multiple Source Method (MSM) (https://msm.dife.de/tps/en), proposed by the European Prospective Investigation into Cancer and Nutrition (EPIC), was applied to estimate the habitual intake of energy and macronutrients. This method was chosen because of its capability to improve estimates of usual dietary intake of energy, nutrients, foods, and food groups by considering within-person variance in intake, thereby improving the usual intake distribution for the population [20]. Due to differences in eating habits among the Latin American population, an estimation of regular intake was conducted separately for each country. The relative contribution of each macronutrient to total energy intake was subsequently calculated [18].
2.3.2. Micronutrient Intake Analysis
Based on the 24-H recalls, the intake of iron, calcium, and vitamins A, C, and D was analyzed and compared to the US Institute of Medicine estimated required allowances (ERA) to assess adequacy [22].
2.4. Anthropometry
Categorization of body mass index (BMI) values in adolescents (15 to <19 years) was based on cut-offs based on the sex-specific WHO BMI-for-age growth charts [23], with underweight defined as (BMI < –2SD), normal weight (–2SD ≥ BMI ≤ 1 SD), overweight (1SD ≥ BMI ≤ 2 SD), and obese (BMI for age > 2SD). For adult women (19 years and older), BMI was categorized as underweight (<18.5 kg/m²), normal weight (18.5–24.9 kg/m²), overweight (25–29.9 kg/m²), and obese (≥30.0 kg/m²) [24]. The study population was categorized as having excess weight (overweight and obese) or no excess weight (underweight or normal weight). Waist circumference was assessed based on the validated cutoff points of the Latin American Study Group of the Metabolic Syndrome (GLESMO) for Latin American populations [25]. Neck circumference (NC) was categorized as abnormal if the circumference was >34.5 cm for boys and >31.25 for girls [26], whereas for adults the cutoff points for abnormal were >39 cm for men and >35 cm for women. Women’s height was categorized as short (< or equal to 155 cm) or normal (>155 cm), taking into account that the population studied in this project was urban and included all SELs across the countries [27].
2.5. Physical Activity Assessment
Self-Reported Activities
Self-reported physical activity was assessed using the International Physical Activity Questionnaire (IPAQ)—long version, a validated self-report measurement tool for physical activity in Latin America [28]. The Mexican (Spanish language) version of IPAQ [29] was adapted for all countries of the ELANS, using culturally appropriate wording and examples. Only the leisure time and transport physical activity (LTPA and TPA) sections were included, due to the greater importance of these domains in public health and poor validity of occupational and home-based physical activity IPAQ sections in Latin American urban settings. These sections are the most relevant for categorizing population levels of physical activity and for guiding public health policies and programs [28].
A domain-specific activity score was calculated separately for each domain of physical activity (transportation and leisure time). Total times engaged in walking, moderate physical activity, and vigorous physical activity, all expressed in min/week, were scored using established methods posted on the IPAQ website (www.ipaq.ki.se).
Additionally, information not included as part of the summary score of physical activity, such as sedentary activities (reading, television viewing, and sitting at a desk), were analyzed.
2.6. Statistics
Descriptive statistical analysis was carried out in the present study. Categorical variables were expressed as absolute numbers of cases and percentage values. Central tendency and dispersion were summarized using means, standard deviations, and percentiles (P25, median, and P75).
Multiple logistic regression models were performed to evaluate associations between excess weight and covariates while controlling for misreporting of energy intake [30] and socioeconomic level. Independent variables with p-values ≤ 0.20 in univariate analysis were selected for multiple regression analyses and included in the regression model by the stepwise forward procedure. Variables that remained significant in the multiple logistic regression model (p < 0.05) were maintained. A probability value of 0.05 was considered statistically significant. All statistical analyses were performed using STATA 12.0 (Stata Corporation, College Station, TX, USA).
3. Results
We analyzed data from 3259 women of childbearing age, defined as aged between 15 and 44 years. Nutritional status, socioeconomic characteristics, educational level, and marital characteristics are shown in Table 1. The majority of the women were within the low socioeconomic level (53.5%), had a basic educational level (56.4%), and were married or lived with a partner (49.3%). Venezuela and Colombia had the highest values of women within the low socioeconomic level, whereas Peru, Costa Rica, and Ecuador showed a prevalence >10% of high socioeconomical level. The educational level of Venezuela was considerably higher than in other countries. Superior educational level was reported by 20.7% of Venezuelan women, nearly twice the mean proportion in the total ELANS group.

Table 1.
Sociodemographic characteristics by age group and country among childbearing-age women in the Latin American Study of Nutrition and Health (ELANS), 2015.
In general, older women presented higher values in all the anthropometric measures than younger women (Table 2). The majority of women were overweight or obese (58.7%), especially in Costa Rica (60.7%) and Chile (60.0%), which also had the highest proportions of increased waist circumference (65.9% and 59.7%) and neck circumference (38.2% and 47.4%), respectively (Table 3). Venezuela and Brazil had the highest proportions of underweight women (5.3% and 4.8%, respectively). The greatest prevalence for stunting (<155 cm) was identified in Peru (60.30%) and Ecuador (54.55%) (mean: 153.30 ± 5.54 cm and 154.81 ± 6.53 cm, respectively).
Table 2.
Anthropometric measures by age group and country among childbearing-age women in the Latin American Study of Nutrition and Health (ELANS), 2015.
Table 3.
Anthropometric and physical activity level prevalence by country among childbearing-age women in the Latin American Study of Nutrition and Health (ELANS), 2015.
The majority of the studied women in LA reported a predominantly sedentary lifestyle (61.12%), particularly in Venezuela (73.49%) and Brazil (70.66%); the exception was Ecuador, which represented the country with the highest proportion of physically active women (66.07%). With increasing age, energy intake tended to decrease when the proportion of protein increased (Table 4). Proteins provided an average of 15–16% of energy intake, fats 29–30%, and carbohydrates 53–54%. Most of the countries showed mean protein intake matching recommended intake. Argentina, Colombia, Perú, Chile, and Venezuela had more than 20% of their female population with a fat intake higher than the recommended intake range, however, for Peru it should be highlighted that it was the only country with a mean fat intake below recommendations, making it clear that mean values should be cautiously analyzed, as some values might be at extremes, thus making the average not fully demonstrative of the majority (Figure 1). Peru also had the highest proportion of the population with a carbohydrate intake above the recommended range of intake (28.9%).
Table 4.
Energy and macronutrient intake by age group and country among childbearing-age women in the Latin American Study of Nutrition and Health (ELANS), 2015.

Figure 1.
Percentages of individuals in relation to the acceptable percentage ranges of macronutrients among Latin American countries; Latin American Health and Nutrition Study (ELANS), 2015.
Calculated micronutrient intakes are shown in Table 5 by age groups. Figure 2 shows the percentages of individuals with adequate calcium and iron intake. Most women had an inadequate calcium intake, particularly in Peru (97.74%), Costa Rica (95.88%), Brazil (95.16%), and Chile (93.23%). The highest proportion of inadequate iron intake was found in Brazil (40.5% of the population).
Table 5.
Micronutrient intake by age group and country among childbearing-age women in the Latin American Study of Nutrition and Health (ELANS), 2015.
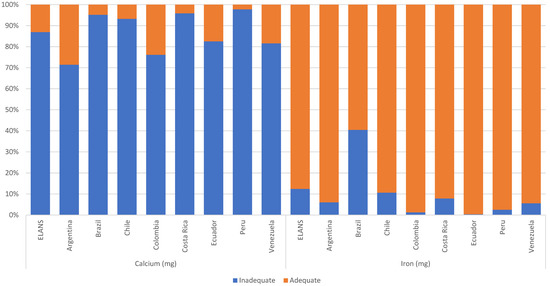
Figure 2.
Percentages of individuals by adequacy level of calcium and iron intake among Latin American countries; Latin American Health and Nutrition Study (ELANS), 2015.
Table 6 presents associations between the risk of excess weight and different predictors. Age group, neck circumference, country of residence, and vitamin D and iron intake were relevant predictors in the final regression model. Women aged 19 to 24.9 years had a 9.87-fold higher risk for excess weight and those aged 35–44.9 years had a 19.80-fold higher risk for excess weight than female adolescents. An increased neck circumference predicted a 12-fold increase of obesity risk.
Table 6.
Association between excess weight and characteristics of childbearing-age women in the Latin American Study of Nutrition and Health (ELANS), 2015.
The country of residence was also important: Living in Ecuador or Peru predicted twice the risk for excess weight when compared to Argentina. Additionally, adequate intakes of vitamin D and iron were associated with a 2.12- and 1.34-fold increased risk for excess weight, respectively.
4. Discussion
In this study we identified a high prevalence of dietary and lifestyle-related risk factors for the health and well-being of women of reproductive age in the eight Latin American countries included. In particular, a high prevalence of being overweight or obese that increases with age, a high prevalence of a sedentary lifestyle, and inadequate intake of essential nutrients were identified, and more than half of the women lived in disadvantaged environments within a low socioeconomic status [31].
Having no access to adequate nutrition and lifestyle conditions compatible with good health violates basic human rights and undermines a women’s ability to achieve well-being and productivity and the health and development of her offspring. In general, women are more vulnerable than men in the Latin American context. According to the Food and Agriculture Organization of the United Nations (FAO) [32] report on food security in Latin America and the Caribbean, obesity affects 27.9% of women <18 years and hence much more than men (20.2%). Accordingly, among the 105 million obese adults in Latin America, 62 million, or 59%, are women. Similarly, data from the ELANS study show a much higher obesity prevalence in women of all age groups (29.5%) than in men (20.6%) [33]. Food insecurity is also more frequently found in women than men, with 69.1 million women living in food insecure conditions (moderate or severe) compared to 54.9 million men [32].
In this study, more than 50% of women of childbearing age had a low socioeconomic status, meaning they were living in poverty, which challenges well-being, as demonstrated, for example, in studies on women of rural communities in south Asian countries [4]. Living in poverty increases the risk for food insecurity and consuming cheap foods with a low density of essential nutrients promotes micronutrient deficiencies (or hidden hunger) [34,35]. This study was conducted in urban settings, which in general showed a similar pattern of loss of quality of life, sedentary habits, limited education, high prevalence of women living in low socioeconomic environments, and poor dietary quality across countries, along with a prevalence of being overweight or obese [36]. Being underweight or obese during pregnancy results in increased maternal morbidity and mortality and represents higher risk for the product of the conception [37], and chances are that women who start pregnancy obese, overweight, or undernourished will remain within these categories, facing all the challenges of surviving pregnancy and making success much more difficult to achieve [38]. In addition, a triple burden of malnutrition with the coexistence of being stunted, overweight, or obese and micronutrient deficiencies is common among children in this region where maternal and child under- and overnutrition coexist [39].
Calcium, iron, and vitamin D are among the essential micronutrients that are important for maternal and child well-being. Iron and calcium deficiencies are associated with increased maternal deaths, and vitamin D has been proposed as a key factor in preserving immunity, particularly to prevent acute respiratory diseases. Thus, in young women adequate intake may contribute to avoiding recurrent illnesses, particularly in vulnerable environments [40].
This study reports frequently inadequate intake of these micronutrients combined with a high prevalence of obesity and being overweight, and higher risks for obesity with adequate intake of calcium and iron. As unequal as the Latin American environment is, we can hypothetically think that some affluent population groups of women with adequate intake of these micronutrients have a trend towards eating better-quality foods, yet live within a setting promoting obesity [41,42]. The ELANS shows short stature in 36% of women, ranging from 23.1% in Brazil to 60.7% in Peru. While genetic factors may contribute to these differences, short height may also result from growth retardation in childhood due to deficient nutrition and recurrent infections [27].
A limitation of this study is that only women in urban areas were considered, thus rural populations were not assessed. The cross-sectional design does not allow causality to be established even with adjustments for covariates. Strengths of the study are the large sample size, the inclusion of nationally representative urban populations of eight countries, the use of two consecutive 24-H recalls, and the inclusion of the analysis of micronutrient intake. Misreporting was included as an adjustment for evaluation of the energy intake, so errors were minimized when evaluating excessive weight.
We wish to emphasize that recent evidence supports a marked impact of maternal nutrition and lifestyle before and during pregnancy on the child’s long-term health, development, and later disease risks, which indicates the need to support adequate living and dietary conditions for women of childbearing age to support the health and opportunities of future generations [43,44]. Public health policies across Latin America should focus more on the health of women of reproductive age to promote achieving the sustainable development goals [45].
5. Conclusions
Latin America is a continent of marked inequalities, with enormous gaps between population groups. Disadvantaged environments constitute a vicious cycle for losing human potential of women and their future children. Better understanding of existing challenges for women of childbearing age may contribute to implementing strategies towards breaking the perpetuation of poverty, under- and overnutrition, and non-communicable diseases. Education, promotion of health and healthy lifestyles, and a dietary intake that meets nutrient and micronutrient necessities with the use of supplementation and food fortification may constitute policies to improve equity, opportunities, and the potential for the next generations.
Author Contributions
Conceptualization, M.H.-C. and M.L.-J.; data curation, A.N.P.; formal analysis, M.H.-C., A.N.P., and P.H.; investigation, G.G., I.K., M.C.Y.G., R.P., L.Y.C., and A.R.; methodology, A.N.P. and M.F.; writing—original draft, M.H.-C., P.H., and M.L.-J.; writing—review and editing, B.K., Y.S., and M.F. All authors have read and agreed to the published version of the manuscript.
Funding
The ELANS was initially supported by a scientific grant from the Coca-Cola Company and support from the Ferrero, Instituto Pensi/Hospital Infantil Sabara, International Life Science Institute of Argentina, Universidad de Costa Rica, Pontificia Universidad Católica de Chile, Pontificia Universidad Javeriana, Universidad Central de Venezuela/Fundación Bengoa, Universidad San Francisco de Quito, and Instituto de Investigación Nutricional de Peru. The founding sponsors had no role in study design; data collection, analyses, or interpretation; writing of the manuscript; or the decision to publish the results. BK is the Else Kröner-Seniorprofessor of Paediatrics at LMU and financially supported by the Else Kröner-Fresenius-Foundation and LMU University Hospitals.
Institutional Review Board Statement
The study was conducted according to the guidelines of the Declaration of Helsinki and approved by the Western Institutional Review Board (#20140605) and is registered at Clinical Trials (#NCT02226627 on August 27, 2014).
Informed Consent Statement
Informed consent was obtained from all subjects involved in the study.
Data Availability Statement
The data presented in this study are available upon request from the corresponding author. The data are not publicly available due to privacy or ethical restrictions.
Acknowledgments
We would like to thank the following individuals at each of the participating sites who made substantial contributions to the ELANS: Luis A. Moreno, Brenda Lynch, Mariela Jauregui, Alejandra Guidi, Luis Costa, Regina Mara Fisberg, Viviana Guajardo, and Gerson Ferrari. The following are members of the ELANS Study Group: Chairs: Mauro Fisberg and Irina Kovalskys; Co-chair: Georgina Gómez Salas; core group members: Attilio Rigotti, Lilia Yadira Cortés Sanabria, Martha Cecilia Yépez García, Rossina Gabriella Pareja Torres, and Marianella Herrera-Cuenca; Steering Committee: Berthold Koletzko, Luis A. Moreno, and Michael Pratt; Project Managers: Viviana Guajardo and Ioná Zalcman Zimberg; International Life Sciences Institute-Argentina: Irina Kovalskys, Viviana Guajardo, María Paz Amigo, Ximena Janezic, and Fernando Cardini; Universidad I Salud: Myriam Echeverry and Martin Langsman; Instituto Pensi-Hospital Infantil Sabara-Brazil and Federal University of Sao Paulo: Mauro Fisberg, Ioná Zalcman Zimberg, and Natasha Aparecida Grande de França; Pontificia Universidad Católica de Chile: Attilio Rigotti, Guadalupe Echeverría, Leslie Landaeta, and Óscar Castillo; Pontificia Universidad Javeriana-Colombia: Lilia Yadira Cortés Sanabria, Luz Nayibe Vargas, Luisa Fernanda Tobar, and Yuri Milena Castillo; Universidad de Costa Rica: Georgina Gómez Salas, Rafael Monge Rojas, and Anne Chinnock; Universidad San Francisco de Quito-Ecuador: Martha Cecilia Yépez García, Mónica Villar Cáceres, and María Belén Ocampo; Instituto de Investigación Nutricional-Peru: Rossina Pareja Torres, María Reyna Liria, Krysty Meza, Mellisa Abad, and Mary Penny; Universidad Central de Venezuela: Marianella Herrera-Cuenca, Maritza Landaeta-Jiménez, Betty Méndez-Pérez, Maura Vásquez, Omaira Rivas, Carmen Meza, Guillermo Ramírez, and Pablo Hernández; accelerometry analysis: Priscila Bezerra Gonçalves and Claudia Alberico; physical activity advisor: Gerson Luis de Moraes Ferrari.
Conflicts of Interest
The authors declare no conflict of interest. The funders had no role in the design of the study; in the collection, analyses, or interpretation of data; in the writing of the manuscript, or in the decision to publish the results.
References
- Feinberg, A.P. The key role of epigenetics in human disease prevention and mitigation. N. Engl. J. Med. 2018, 378, 1323–1334. [Google Scholar] [CrossRef]
- Gillman, M.W.; Ludwig, D.S. How Early Should Obesity Prevention Start? N. Engl. J. Med. 2013, 369, 2173–2175. [Google Scholar] [CrossRef]
- Koletzko, B.; Brands, B.; Grote, V.; Kirchberg, F.F.; Prell, C.; Rzehak, P.; Uhl, O.; Weber, M. Long-Term Health Impact of Early Nutrition: The Power of Programming. Ann. Nutr. Metab. 2017, 70, 161–169. [Google Scholar] [CrossRef] [PubMed]
- Dhaded, S.M.; Hambidge, K.M.; Ali, S.A.; Somannavar, M.; Saleem, S.; Pasha, O.; Khan, U.; Herekar, V.; Vernekar, S.; Kumar, S.Y.; et al. Preconception nutrition intervention improved birth length and reduced stunting and wasting in newborns in South Asia: The Women First Randomized Controlled Trial. PLoS ONE 2020, 15, e0218960. [Google Scholar] [CrossRef] [PubMed]
- Koletzko, B.; Fishbein, M.; Lee, W.S.; Moreno, L.; Mouane, N.; Mouzaki, M.; Verduci, E. Prevention of Childhood Obesity: A Position Paper of the Global Federation of International Societies of Paediatric Gastroenterology, Hepatology and Nutrition (FISPGHAN). J. Pediatr. Gastroenterol. Nutr. 2020, 70, 702–710. [Google Scholar] [CrossRef] [PubMed]
- Broughton, D.E.; Moley, K.H. Obesity and female infertility: Potential mediators of obesity’s impact. Fertil. Steril. 2017, 107, 840–847. [Google Scholar] [CrossRef]
- Goldstein, R.F.; Abell, S.K.; Ranasinha, S.; Misso, M.; Boyle, J.A.; Black, M.H.; Li, N.; Hu, G.; Corrado, F.; Rode, L.; et al. Association of gestational weight gain with maternal and infant outcomes: A systematic review and meta-analysis. JAMA 2017, 317, 2207–2225. [Google Scholar] [CrossRef]
- Perez-Escamilla, R.; Bermudez, O.; Buccini, G.S.; Kumanyika, S.; Lutter, C.; Monsivais, P.; Victora, C. Nutrition disparities and the global burden of malnutrition. BMJ 2018, 361, k2252. [Google Scholar] [CrossRef]
- Landecker, H. Food as exposure: Nutritional epigenetics and the new metabolism. Biosocieties 2011, 6, 167–194. [Google Scholar] [CrossRef]
- Beal, T.; Massiot, E.; Arsenault, J.E.; Smith, M.R.; Hijmans, R.J. Global trends in dietary micronutrient supplies and estimated prevalence of inadequate intakes. PLoS ONE 2017, 12, e0175554. [Google Scholar] [CrossRef]
- Poston, L.; Caleyachetty, R.; Cnattingius, S.; Corvalán, C.; Uauy, R.; Herring, S.; Gillman, M.W. Preconceptional and maternal obesity: Epidemiology and health consequences. Lancet Diabetes Endocrinol. 2016, 4, 1025–1036. [Google Scholar] [CrossRef]
- Mendez, M.A.; Monteiro, C.A.; Popkin, B.M. Overweight exceeds underweight among women in most developing countries. Am. J. Clin. Nutr. 2005, 81, 714–721. [Google Scholar] [CrossRef] [PubMed]
- FAO; IFAD; UNICEF; WFP; WHO. The State of Food Security and Nutrition in the World 2020. Transforming Food Systems for Affordable Healthy Diets; FAO: Rome, Italy, 2020. [Google Scholar] [CrossRef]
- Herrera-Cuenca, M. Mujeres en edad fértil: Etapa crucial en la vida para el desarrollo óptimo de las futuras generaciones. Ann. Venez. Nutr. 2017, 30, 112–119. [Google Scholar]
- Stephenson, J.; Heslehurst, N.; Hall, J.; Schoenaker, D.A.; Hutchinson, J.; Cade, J.E.; Poston, L.; Barrett, G.; Crozier, S.R.; Barker, M.; et al. Before the beginning: Nutrition and lifestyle in the preconception period and its importance for future health. Lancet 2018, 391, 1830–1841. [Google Scholar] [CrossRef]
- Gluckman, P.D.; Hanson, M.A.; Cooper, C.; Thornburg, K.L. Effect of In Utero and Early Life Conditions on Adult Health and Disease. N. Engl. J. Med. 2008, 359, 61–73. [Google Scholar] [CrossRef]
- Tiffon, C. The Impact of Nutrition and Environmental Epigenetics on Human Health and Disease. Int. J. Mol. Sci. 2018, 19, 3425. [Google Scholar] [CrossRef]
- Fisberg, M.; Kovalskys, I.; Gómez, G.; Rigotti, A.; Cortés, L.Y.; Herrera-Cuenca, M.; Yépez, M.C.; Pareja, R.G.; Guajardo, V.; Zimberg, I.Z.; et al. Latin American Study of Nutrition and Health (ELANS): Rationale and study design. BMC Public Health 2016, 16, 93. [Google Scholar] [CrossRef]
- Billari, F.C.; Goisis, A.; Liefbroer, A.C.; Settersten, R.A.; Aassve, A.; Hagestad, G.; Spéder, Z. Social age deadlines for the childbearing of women and men. Hum. Reprod. 2011, 26, 616–622. [Google Scholar] [CrossRef]
- Moshfegh, A.; Rhodes, D.; Baer, D.; Murayi, T.; Clemens, J.; Rumpler, W.; Paul, D.R.; Sebastian, R.S.; Kuczynski, K.J.; Ingwersen, L.A.; et al. The US department of agriculture automated multiple-pass method reduces bias in the collection of energy intakes. Am. J. Clin. Nutr. 2008, 88, 324–332. [Google Scholar] [CrossRef]
- Kovalskys, I.; Fisberg, M.; Gomez, G.; Rigotti, A.; Cortes, L.Y.; Yepez, M.C.; Pareja, R.G.; Herrera-Cuenca, M.; Zimberg, I.Z.; Tucker, K.L.; et al. Standardization of the food composition database used in the Latin American Nutrition and Health Study (ELANS). Nutrients 2015, 7, 7914–7924. [Google Scholar] [CrossRef]
- Institute of Medicine. Child and Adult Care Food Program: Aligning Dietary Guidance for All; The National Academies Press: Washington, WA, USA, 2011. [Google Scholar] [CrossRef]
- World Health Organization (WHO). Multicenter Growth Reference Study Group. WHO Child Growth Standards: Length/Height-for-Age, Weight-for-Age, Weight-for-Length, Weight-for-Height and Body Mass Index-for-Age: Methods and Development; World Health Organization: Geneva, Switzerland, 2006. [Google Scholar]
- Obesity: Preventing and Managing the Global Epidemic; WHO Technical Report Series; World Health Organization: Geneva, Switzerland, 2000; Available online: http://www.who.int/nutrition/publications/obesity/WHO_TRS_894/en/ (accessed on 9 August 2020).
- Aschner, P.; Buendía, R.; Brajkovich, I.; González, A.; Figueredo, R.; Juarez, X.; Uriza, F.; Gomez, A.M.; Ponte, C.I. Determination of the cutoff point for waist circumference that establishes the presence of abdominal obesity in Latin American men and women. Diabetes Res. Clin. Pract. 2011, 93, 243–247. [Google Scholar] [CrossRef] [PubMed]
- Onat, A.; Hergenç, G.; Yüksel, H.; Can, G.; Ayhan, E.; Kaya, Z.; Dursunoğlu, D. Neck circumference as a measure of central obesity: Associations with metabolic syndrome and obstructive sleep apnea syndrome beyond waist circumference. Clin. Nutr. 2009, 28, 46–51. [Google Scholar] [CrossRef] [PubMed]
- Peso Inferior al Normal, Talla baja y Sobrepeso en Adolescentes y Mujeres Jóvenes en América Latina y el Caribe. Available online: https://www.paho.org/hq/dmdocuments/2011/Adolescent-Anthropometric-Spa.pdf (accessed on 9 August 2020).
- Hallal, P.C.; Gomez, L.F.; Parra, D.C.; Lobelo, F.; Mosquera, J.; Florindo, A.A.; Reis, R.S.; Pratt, M.; Sarmiento, O.L. Lessons learned after 10 years of IPAQ use in Brazil and Colombia. J. Phys. Act. Health 2010, 7, S259–S264. [Google Scholar] [CrossRef] [PubMed]
- Salvo, D.; Reis, R.S.; Sarmiento, O.L.; Pratt, M. Overcoming the challenges of conducting physical activity and built environment research in Latin America: IPEN Latin America. Prev. Med. 2014, 69, S86–S92. [Google Scholar] [CrossRef]
- Previdelli, A.N.; Gómez, G.; Kovalskys, I.; Fisberg, M.; Cortés, L.Y.; Pareja, R.; Liria, M.R.; García, M.; Herrera-Cuenca, M.; Rigotti, A.; et al. Prevalence and determinants of misreporting of energy intake among Latin American populations: Results from ELANS study. Nutr. Res. 2019, 68, 9–18. [Google Scholar] [CrossRef] [PubMed]
- International Covenant on Economic, Social and Cultural Rights, International Covenant on Civil and Political Rights and Optional Protocol to the International Covenant on Civil and Political Rights, 16 December 1966, A/RES/2200. Available online: https://www.refworld.org/docid/3b00f47924.html (accessed on 9 August 2020).
- Panorama de la Seguridad Alimentaria y Nutricional en América Latina y el Caribe. 2019. Available online: http://www.fao.org/3/ca5162en/ca5162en.pdf (accessed on 9 July 2020).
- Fisberg, M.; Kovalskys, I.; Gómez-Salas, G.; Nogueira-Previdelli, A.; Rigotti, A.; Cortes, L.Y.; Yepez-Garcia, M.C.; Pareja, R.; Herrera-Cuenca, M. Latin American Population: Mainly Active or Sedentary? Is there an association between lifestyle and diet nutritional composition? Ann. Nutr. Metab. 2017, 71, S41. [Google Scholar] [CrossRef]
- Landry, M.J.; van den Berg, A.E.; Asigbee, F.M.; Vandyousefi, S.; Ghaddar, R.; Davis, J.N. Child-Report of Food Insecurity Is Associated with Diet Quality in Children. Nutrients 2019, 11, 1574. [Google Scholar] [CrossRef]
- Drenowsky, A.; Spencer, S.E. Poverty and Obesity: The role of energy density and energy costs. Am. J. Clin. Nutr. 2004, 79, 6–16. [Google Scholar] [CrossRef]
- Galicia, L.; López de Romaña, D.; Harding, K.B.; De-Regil, L.M.; Grajeda, R. Tackling malnutrition in Latin America and the Caribbean: Challenges and opportunities. Rev. Panam. Salud Publica 2016, 40, 138–146. [Google Scholar]
- Black, R.E.; Victora, C.G.; Walker, S.P.; Bhutta, Z.A.; Christian, P.; De Onis, M.; Ezzati, M.; Grantham-McGregor, S.; Katz, J.; Martorell, R.; et al. Maternal and child undernutrition and overweight in low-income and middle-income countries. Lancet 2013, 382, 427–451. [Google Scholar] [CrossRef]
- Barker, M.; Dombrowski, S.U.; Colbourn, T.; Fall, C.D.; Kriznik, N.M.; Lawrence, W.T.; Norris, S.; Ngaiza, G.; Patel, D.; Skordis-Worrall, J.; et al. Intervention strategies to improve nutrition and health behaviours before conception. Lancet 2018, 391, 1853–1864. [Google Scholar] [CrossRef]
- Labadarios, D. Malnutrition in the developing world: The triple burden. S. Afr. J. Clin. Nutr. 2005, 18, 119–121. [Google Scholar] [CrossRef]
- Charan, J.; Goyal, J.P.; Saxena, D.; Yadav, P. Vitamin D for prevention of respiratory tract infections: A systematic review and meta-analysis. J. Pharmacol. Pharmacother. 2012, 3, 300. [Google Scholar] [CrossRef] [PubMed]
- Herrera-Cuenca, M.; Castro, J.; Mangia, K.; Correa, M.A. Are Social Inequities the Reason for the Increase in Chronic Non Communicable Diseases? A Systematic Review. J. Diabetes Metab. Disord. Control 2014, 1, 81–88. [Google Scholar] [CrossRef]
- Drewnowski, A. Obesity, diets and social inequities. Nutr. Rev. 2009, 67, S36–S39. [Google Scholar] [CrossRef]
- Ruel, M.T.; Alderman, H. Maternal and Child Nutrition Study Group. Nutrition-sensitive interventions and programmes: How can they help to accelerate progress in improving maternal and child nutrition? Lancet 2013, 382, 536–551. [Google Scholar] [CrossRef]
- Hoellen, F.; Hornemann, A.; Haertel, C.; Reh, A.; Rody, A.; Schneider, S.; Tuschy, B.; Bohlmann, M.K. Does maternal underweight prior to conception influence pregnancy risks and outcome? In Vivo 2014, 28, 1165–1170. [Google Scholar]
- Paajanen, T.A.; Oksala, N.K.; Kuukasjarvi, P.; Karhunen, P.J. Short stature is associated with coronary heart disease: A systematic review of the literature and a meta-analysis. Eur. Heart J. 2010, 31, 1802–1809. [Google Scholar] [CrossRef]


Publisher’s Note: MDPI stays neutral with regard to jurisdictional claims in published maps and institutional affiliations. |
© 2020 by the authors. Licensee MDPI, Basel, Switzerland. This article is an open access article distributed under the terms and conditions of the Creative Commons Attribution (CC BY) license (http://creativecommons.org/licenses/by/4.0/).