
The Association between Nutritional Status and In-Hospital Mortality of COVID-19 in Critically-Ill Patients in the ICU

 ,
,  ,
,  ,
,
Abstract
:1. Introduction
2. Materials and Methods
2.1. Study Design and Setting
2.2. Study Population
2.3. Nutritional Screening
- Impaired nutritional status, in which weight loss and BMI are assessed. The same applies to the percentage of food intake compared to its requirements within the last week. The rating scale is 0–3 points, where 0 is lack of deterioration of health status, and 3 is severe deterioration of health status.
- Severity of disease (an increase in requirements), in which, depending on the disease, patients may receive 0–3 points, where 0 is normal nutritional requirements and 3 is high disease severity (e.g., head injury, bone marrow transplant). Moreover, if patients are over 70, they get an additional point. Thus, patients can score 0–7 points. Nutritional therapy is indicated in patients with NRS ≥ 3 [14]. The WHO criteria were used for classifying patients as underweight (BMI < 18.5 kg/m2), with normal weight (BMI: 18.5–24.9 kg/m2), pre-obese (BMI: 25–29.9 kg/m2) and obese (BMI ≥ 30 kg/m2).
2.4. Statistical Analysis
3. Results
3.1. Characteristics of the Group
3.2. Subgroup Analysis According to BMI
3.3. Subgroup Analysis According to NRS
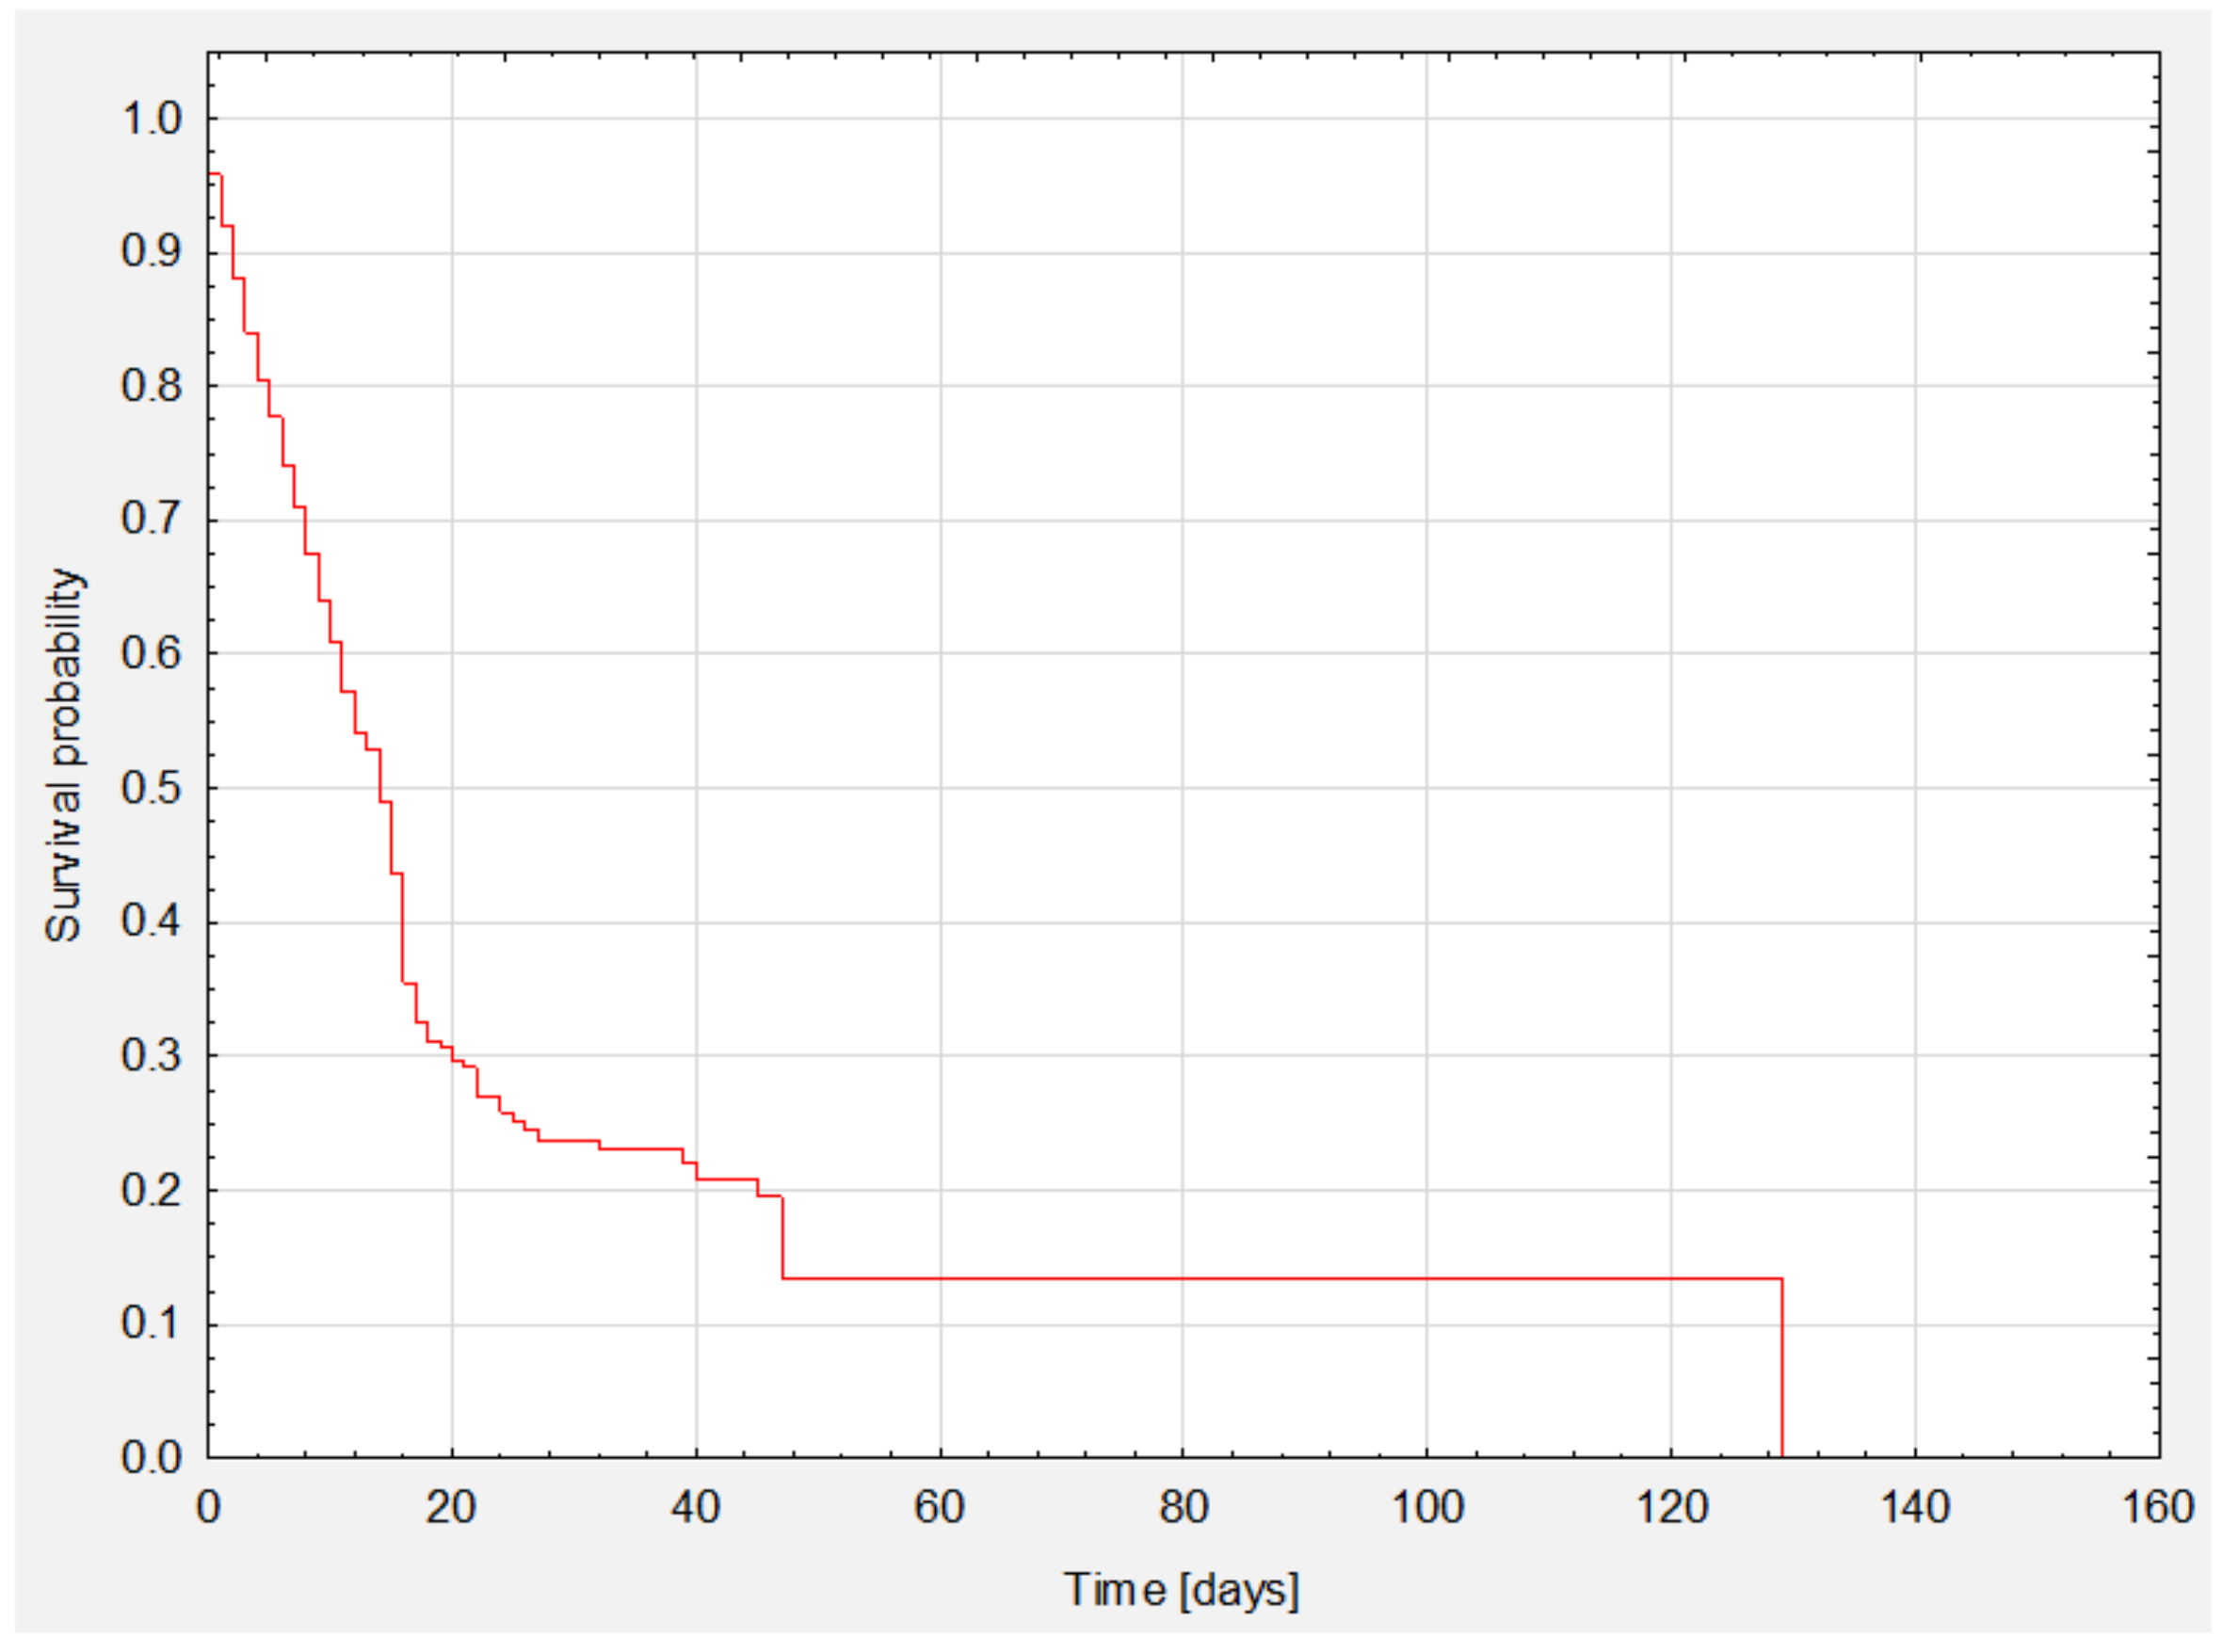
3.4. Survival Analysis
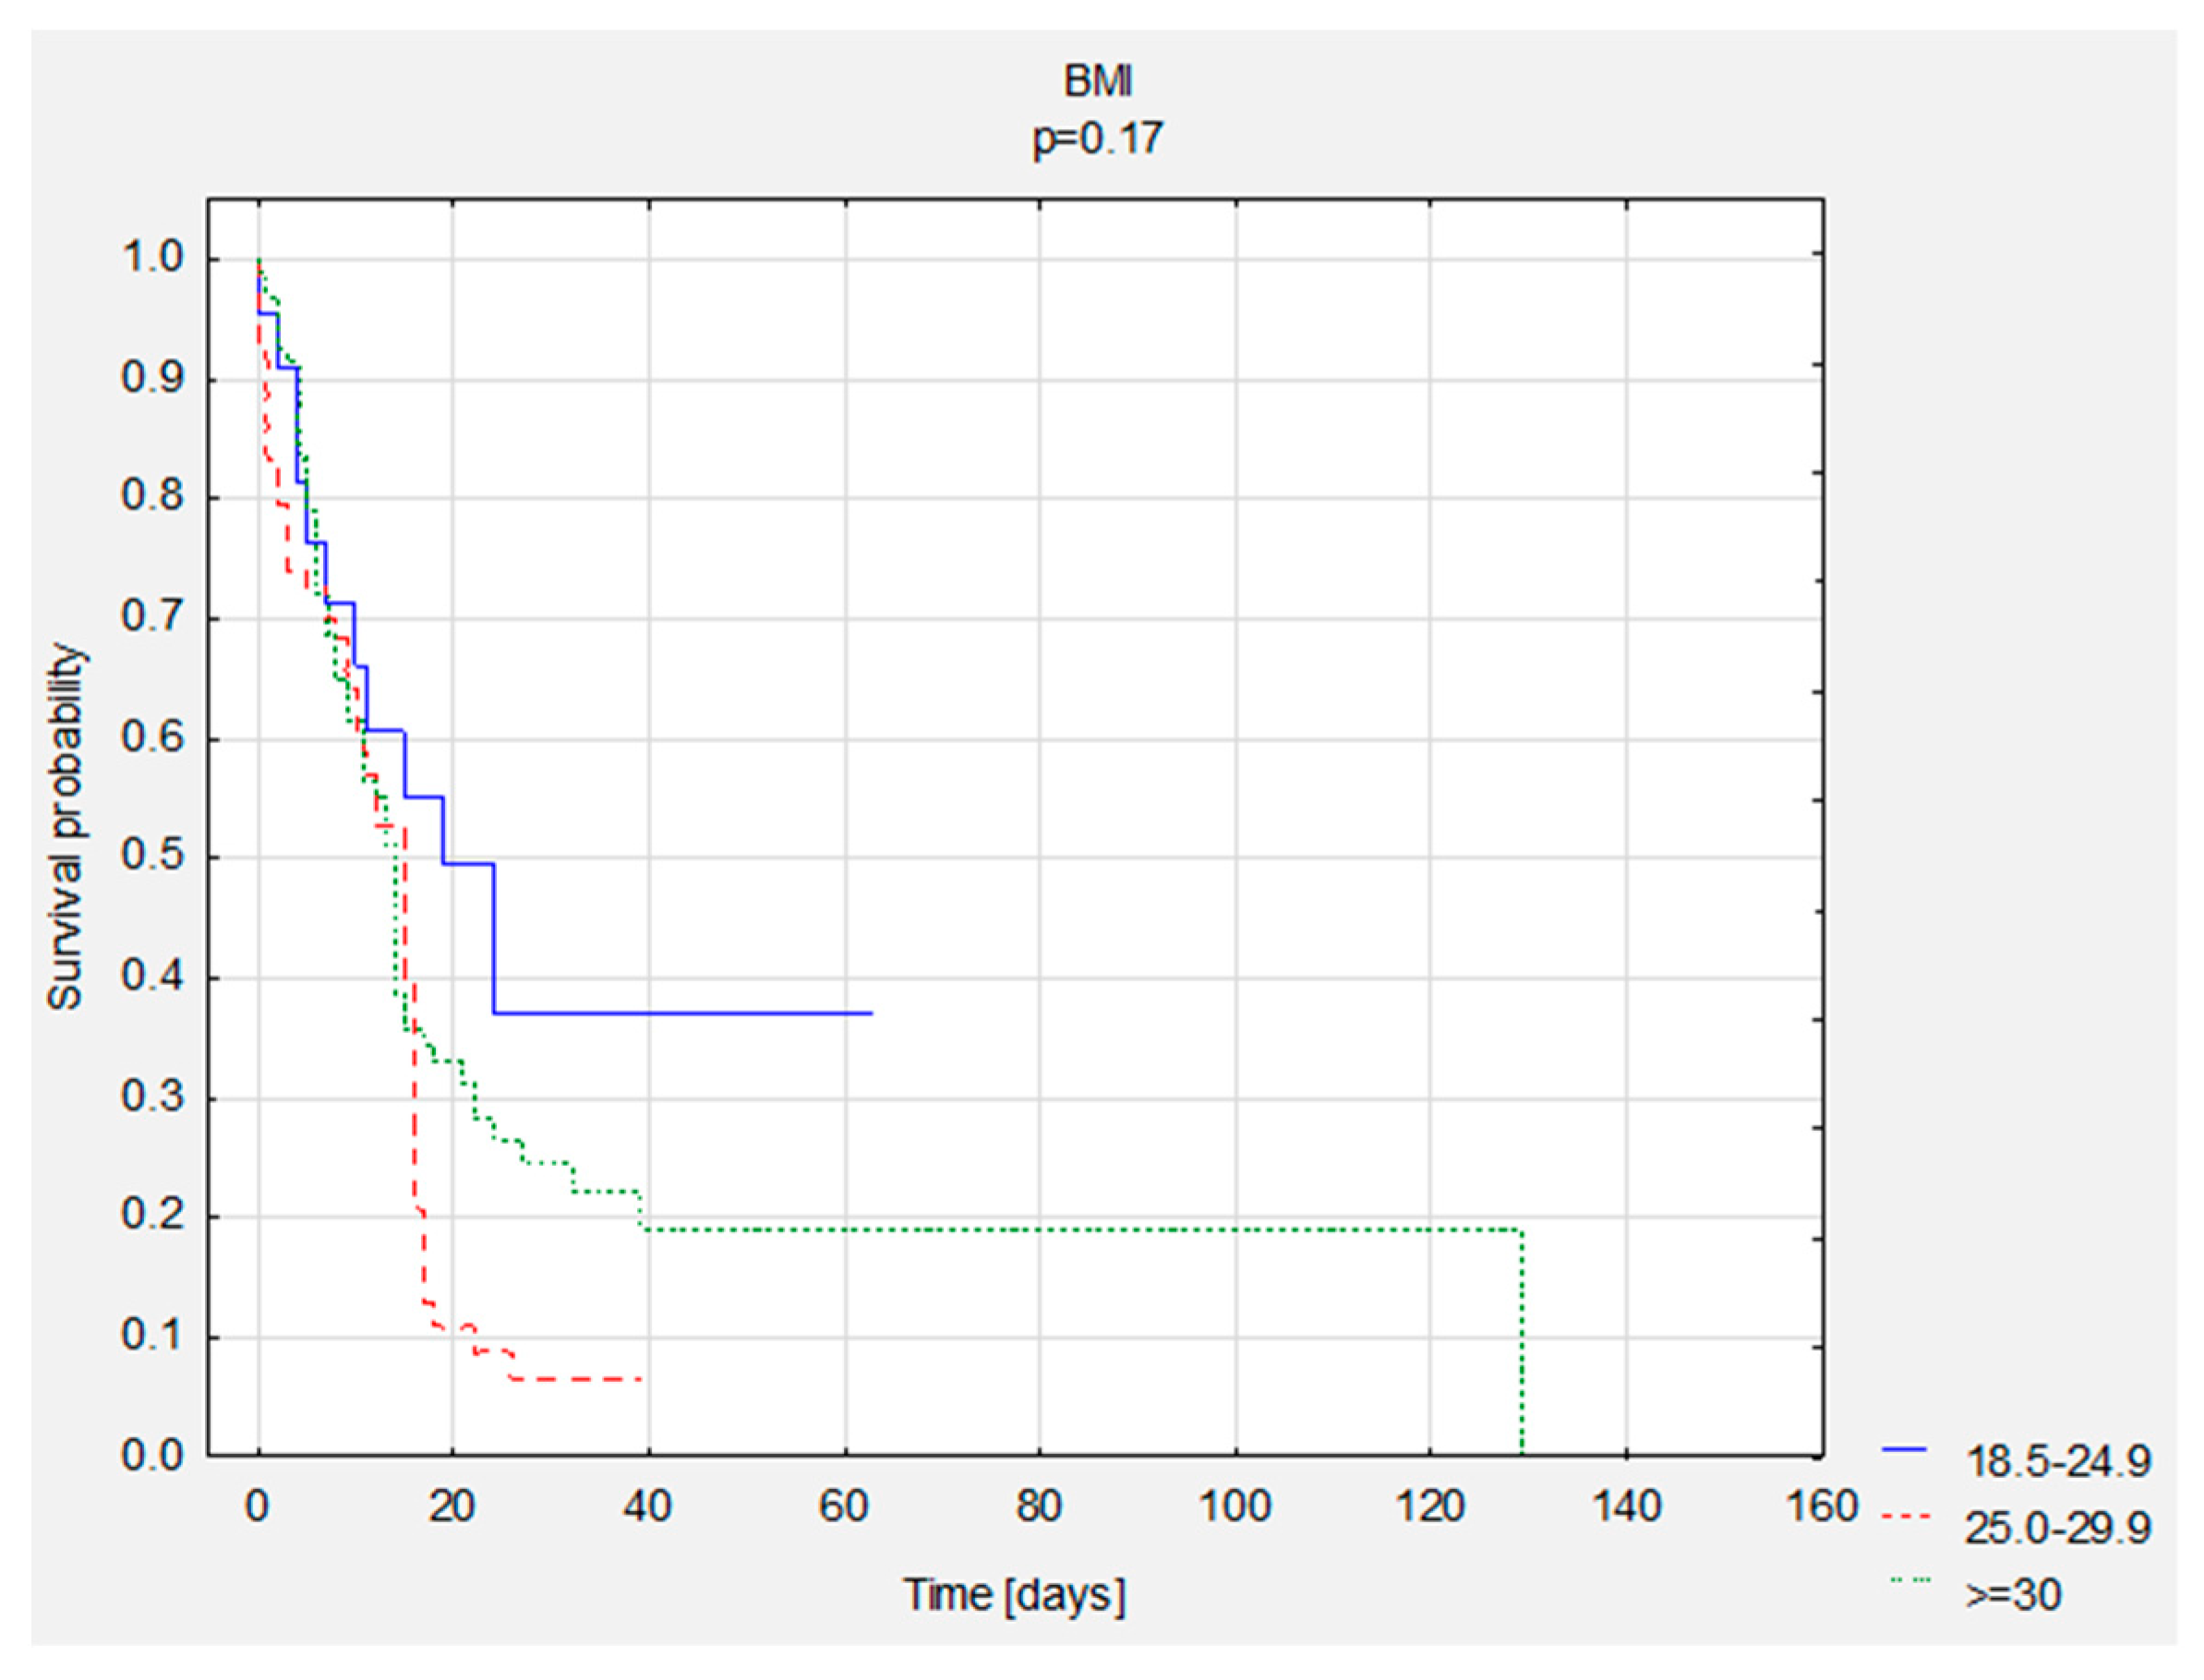
3.5. Survival Analysis—Group Comparisons
4. Discussion
Study Limitations
5. Conclusions
Author Contributions
Funding
Institutional Review Board Statement
Informed Consent Statement
Data Availability Statement
Acknowledgments
Conflicts of Interest
References
- WHO Coronavirus (COVID-19) Dashboard. Available online: https://covid19.who.int (accessed on 30 August 2021).
- Singer, P.; Blaser, A.R.; Berger, M.M.; Alhazzani, W.; Calder, P.C.; Casaer, M.P.; Hiesmayr, M.; Mayer, K.; Montejo, J.C.; Pichard, C.; et al. ESPEN Guideline on Clinical Nutrition in the Intensive Care Unit. Clin. Nutr. 2019, 38, 48–79. [Google Scholar] [CrossRef] [PubMed] [Green Version]
- Wang, D.; Hu, B.; Hu, C.; Zhu, F.; Liu, X.; Zhang, J.; Wang, B.; Xiang, H.; Cheng, Z.; Xiong, Y.; et al. Clinical Characteristics of 138 Hospitalized Patients With 2019 Novel Coronavirus-Infected Pneumonia in Wuhan, China. JAMA 2020, 323, 1061–1069. [Google Scholar] [CrossRef] [PubMed]
- Beck, M.A.; Levander, O.A. Host Nutritional Status and Its Effect on a Viral Pathogen. J. Infect. Dis. 2000, 182 (Suppl. S1), S93–S96. [Google Scholar] [CrossRef] [PubMed] [Green Version]
- James, P.T.; Ali, Z.; E Armitage, A.; Bonell, A.; Cerami, C.; Drakesmith, H.; Jobe, M.; Jones, K.S.; Liew, Z.; E Moore, S.; et al. The Role of Nutrition in COVID-19 Susceptibility and Severity of Disease: A Systematic Review. J. Nutr. 2021, 151, 1854–1878. [Google Scholar] [CrossRef] [PubMed]
- Wei, C.; Liu, Y.; Li, Y.; Zhang, Y.; Zhong, M.; Meng, X. Evaluation of the Nutritional Status in Patients with COVID-19. J. Clin. Biochem. Nutr. 2020, 67, 116–121. [Google Scholar] [CrossRef]
- Pironi, L.; Sasdelli, A.S.; Ravaioli, F.; Baracco, B.; Battaiola, C.; Bocedi, G.; Brodosi, L.; Leoni, L.; Mari, G.A.; Musio, A. Malnutrition and Nutritional Therapy in Patients with SARS-CoV-2 Disease. Clin. Nutr. 2021, 40, 1330–1337. [Google Scholar] [CrossRef]
- Bedock, D.; Couffignal, J.; Lassen, P.B.; Soares, L.; Mathian, A.; Fadlallah, J.; Amoura, Z.; Oppert, J.-M.; Faucher, P. Evolution of Nutritional Status after Early Nutritional Management in COVID-19 Hospitalized Patients. Nutrients 2021, 13, 2276. [Google Scholar] [CrossRef]
- Wolf, M.; Alladina, J.; Navarrete-Welton, A.; Shoults, B.; Brait, K.; Ziehr, D.; Malhotra, A.; Corey Hardin, C.; Hibbert, K.A. Obesity and Critical Illness in COVID-19: Respiratory Pathophysiology. Obesity 2021, 29, 870–878. [Google Scholar] [CrossRef]
- Zhang, L.; Liu, Y. Potential Interventions for Novel Coronavirus in China: A Systematic Review. J. Med Virol. 2020, 92, 479–490. [Google Scholar] [CrossRef] [Green Version]
- Cederholm, T.; Jensen, G.L.; Correia, M.I.T.D.; Gonzalez, M.C.; Fukushima, R.; Higashiguchi, T.; Baptista, G.; Barazzoni, R.; Blaauw, R.; Coats, A.J.; et al. GLIM Criteria for the Diagnosis of Malnutrition—A Consensus Report from the Global Clinical Nutrition Community. Clin. Nutr. 2019, 38, 207–217. [Google Scholar] [CrossRef] [Green Version]
- Lewandowicz-Umyszkiewicz, M.; Wieczorowska-Tobis, K. Nowe kryteria diagnozowania niedożywienia. GERIATRIA 2019, 13, 101–105. [Google Scholar]
- Barazzoni, R.; Bischoff, S.C.; Breda, J.; Wickramasinghe, K.; Krznaric, Z.; Nitzan, D.; Pirlich, M.; Singer, P. ESPEN Expert Statements and Practical Guidance for Nutritional Management of Individuals with SARS-CoV-2 Infection. Clin. Nutr. 2020, 39, 1631–1638, endorsed by the ESPEN Council. [Google Scholar] [CrossRef] [PubMed]
- Kondrup, J.; Allison, S.P.; Elia, M.; Vellas, B.; Plauth, M. ESPEN Guidelines for Nutrition Screening 2002. Clin. Nutr. 2003, 22, 415–421. [Google Scholar] [CrossRef]
- Myers, L.C.; Parodi, S.M.; Escobar, G.J.; Liu, V.C. Characteristics of Hospitalized Adults With COVID-19 in an Integrated Health Care System in California. JAMA 2020, 323, 2195–2198. [Google Scholar] [CrossRef] [PubMed]
- Arentz, M.; Yim, E.; Klaff, L.; Lokhandwala, S.; Riedo, F.X.; Chong, M.; Lee, M. Characteristics and Outcomes of 21 Critically Ill Patients With COVID-19 in Washington State. JAMA 2020, 323, 1612–1614. [Google Scholar] [CrossRef] [Green Version]
- Wang, Y.; Lu, X.; Li, Y.; Chen, H.; Chen, T.; Su, N.; Huang, F.; Zhou, J.; Zhang, B.; Yan, F.; et al. Clinical Course and Outcomes of 344 Intensive Care Patients with COVID-19. Am. J. Respir. Crit. Care Med. 2020, 201, 1430–1434. [Google Scholar] [CrossRef] [PubMed]
- Dixon, A.E.; Peters, U. The Effect of Obesity on Lung Function. Expert Rev. Respir. Med. 2018, 12, 755–767. [Google Scholar] [CrossRef]
- Cercato, C.; Fonseca, F.A. Cardiovascular Risk and Obesity. Diabetol. Metab. Syndr. 2019, 11, 74. [Google Scholar] [CrossRef]
- Sanchis-Gomar, F.; Lavie, C.J.; Mehra, M.R.; Henry, B.M.; Lippi, G. Obesity and Outcomes in COVID-19: When an Epidemic and Pandemic Collide. Mayo Clin. Proc. 2020, 95, 1445–1453. [Google Scholar] [CrossRef]
- Wang, J.; Sato, T.; Sakuraba, A. Worldwide Association of Lifestyle-Related Factors and COVID-19 Mortality. Ann. Med. 2021, 53, 1528–1533. [Google Scholar] [CrossRef]
- Pelosi, P.; Croci, M.; Ravagnan, I.; Vicardi, P.; Gattinoni, L. Total Respiratory System, Lung, and Chest Wall Mechanics in Sedated-Paralyzed Postoperative Morbidly Obese Patients. Chest 1996, 109, 144–151. [Google Scholar] [CrossRef] [PubMed]
- Hibbert, K.; Rice, M.; Malhotra, A. Obesity and ARDS. Chest 2012, 142, 785–790. [Google Scholar] [CrossRef] [PubMed] [Green Version]
- Kompaniyets, L.; Goodman, A.B.; Belay, B.; Freedman, D.S.; Sucosky, M.S.; Lange, S.J.; Gundlapalli, A.V.; Boehmer, T.K.; Blanck, H.M. Body Mass Index and Risk for COVID-19–Related Hospitalization, Intensive Care Unit Admission, Invasive Mechanical Ventilation, and Death—United States, March–December 2020. MMWR. Morb. Mortal. Wkly. Rep. 2021, 70, 355–361. [Google Scholar] [CrossRef] [PubMed]
- Gao, M.; Piernas, C.; Astbury, N.M.; Hippisley-Cox, J.; O’Rahilly, S.; Aveyard, P.; A Jebb, S. Associations between Body-Mass Index and COVID-19 Severity in 6·9 Million People in England: A Prospective, Community-Based, Cohort Study. Lancet Diabetes Endocrinol. 2021, 9, 350–359. [Google Scholar] [CrossRef]
- Dana, R.; Bannay, A.; Bourst, P.; Ziegler, C.; Losser, M.-R.; Gibot, S.; Levy, B.; Audibert, G.; Ziegler, O. Obesity and Mortality in Critically Ill COVID-19 Patients with Respiratory Failure. Int. J. Obes. 2021, 45, 2028–2037. [Google Scholar] [CrossRef]
- Zhu, Z.; Hasegawa, K.; Ma, B.; Fujiogi, M.; Camargo, C.A.; Liang, L. Association of Obesity and Its Genetic Predisposition with the Risk of Severe COVID-19: Analysis of Population-Based Cohort Data. Metabolism 2020, 112, 154345. [Google Scholar] [CrossRef]
- Rottoli, M.; Bernante, P.; Belvedere, A.; Balsamo, F.; Garelli, S.; Giannella, M.; Cascavilla, A.; Tedeschi, S.; Ianniruberto, S.; Del Turco, E.R.; et al. How Important Is Obesity as a Risk Factor for Respiratory Failure, Intensive Care Admission and Death in Hospitalised COVID-19 Patients? Results from a Single Italian Centre. Eur. J. Endocrinol. 2020, 183, 389–397. [Google Scholar] [CrossRef]
- Biscarini, S.; Colaneri, M.; Ludovisi, S.; Seminari, E.; Pieri, T.C.; Valsecchi, P.; Gallazzi, I.; Giusti, E.; Cammà, C.; Zuccaro, V.; et al. The Obesity Paradox: Analysis from the SMAtteo COvid-19 REgistry (SMACORE) Cohort. Nutr.Metab. Cardiovasc. Dis. 2020, 30, 1920–1925. [Google Scholar] [CrossRef]
- Palaiodimos, L.; Kokkinidis, D.G.; Li, W.; Karamanis, D.; Ognibene, J.; Arora, S.; Southern, W.N.; Mantzoros, C.S. Severe Obesity, Increasing Age and Male Sex Are Independently Associated with Worse in-Hospital Outcomes, and Higher in-Hospital Mortality, in a Cohort of Patients with COVID-19 in the Bronx, New York. Metab. Clin. Exp. 2020, 108, 154262. [Google Scholar] [CrossRef]
- Elagizi, A.; Carbone, S.; Lavie, C.J.; Mehra, M.R.; Ventura, H.O. Implications of Obesity across the Heart Failure Continuum. Prog. Cardiovasc. Dis. 2020, 63, 561–569. [Google Scholar] [CrossRef]
- Niedziela, J.; Hudzik, B.; Niedziela, N.; Gąsior, M.; Gierlotka, M.; Wasilewski, J.; Myrda, K.; Lekston, A.; Poloński, L.; Rozentryt, P. The Obesity Paradox in Acute Coronary Syndrome: A Meta-Analysis. Eur. J. Epidemiol. 2014, 29, 801–812. [Google Scholar] [CrossRef] [PubMed]
- Bucholz, E.M.; Beckman, A.L.; Krumholz, H.A.; Krumholz, H.M.; Beckman, A.L.; Krumholz, H.A.; Krumholz, H.M. Excess Weight and Life Expectancy after Acute Myocardial Infarction: The Obesity Paradox Reexamined. Am. Heart J. 2016, 172, 173–181. [Google Scholar] [CrossRef] [PubMed] [Green Version]
- Karampela, I.; Chrysanthopoulou, E.; Christodoulatos, G.S.; Dalamaga, M. Is There an Obesity Paradox in Critical Illness? Epidemiologic and Metabolic Considerations. Curr. Obes. Rep. 2020, 9, 231–244. [Google Scholar] [CrossRef]
- Yousufuddin, M.; Takahashi, P.Y.; Major, B.; Ahmmad, E.; Al-Zubi, H.; Peters, J.; Doyle, T.; Jensen, K.; Al Ward, R.Y.; Sharma, U.; et al. Association between Hyperlipidemia and Mortality after Incident Acute Myocardial Infarction or Acute Decompensated Heart Failure: A Propensity Score Matched Cohort Study and a Meta-Analysis. BMJ Open 2019, 9, e028638. [Google Scholar] [CrossRef] [PubMed] [Green Version]
- Osuna-Padilla, I.A.; Rodríguez-Moguel, N.C.; Aguilar-Vargas, A.; Rodríguez-Llamazares, S. High Nutritional Risk Using NUTRIC-Score Is Associated with Worse Outcomes in COVID-19 Critically Ill Patients. Nutr. Hosp. 2021, 38, 540–544. [Google Scholar] [CrossRef]
- Zhang, P.; He, Z.; Yu, G.; Peng, D.; Feng, Y.; Ling, J.; Wang, Y.; Li, S.; Bian, Y. The Modified NUTRIC Score Can Be Used for Nutritional Risk Assessment as Well as Prognosis Prediction in Critically Ill COVID-19 Patients. Clin. Nutr. 2021, 40, 534–541. [Google Scholar] [CrossRef]
- Ali, A.; Kunugi, H. Approaches to Nutritional Screening in Patients with Coronavirus Disease 2019 (COVID-19). Int. J. Environ. Res. Public Health 2021, 18, 2772. [Google Scholar] [CrossRef]
- Lechien, J.R.; Chiesa-Estomba, C.M.; De Siati, D.R.; Horoi, M.; Le Bon, S.D.; Rodrigues, A.; Dequanter, D.; Blecic, S.; El Afia, F.; Distinguin, L.; et al. Olfactory and Gustatory Dysfunctions as a Clinical Presentation of Mild-to-Moderate Forms of the Coronavirus Disease (COVID-19): A Multicenter European Study. Eur. Arch. Oto-Rhino-Laryngol. 2020, 277, 2251–2261. [Google Scholar] [CrossRef]
- Lechien, J.R.; Chiesa-Estomba, C.M.; Place, S.; Van Laethem, Y.; Cabaraux, P.; Mat, Q.; Huet, K.; Plzak, J.; Horoi, M.; Hans, S.; et al. Clinical and Epidemiological Characteristics of 1420 European Patients with Mild-to-Moderate Coronavirus Disease 2019. J. Intern. Med. 2020, 288, 335–344. [Google Scholar] [CrossRef]
- Li, G.; Zhou, C.-L.; Ba, Y.-M.; Wang, Y.-M.; Song, B.; Cheng, X.-B.; Dong, Q.-F.; Wang, L.-L.; You, S.-S. Nutritional Risk and Therapy for Severe and Critical COVID-19 Patients: A Multicenter Retrospective Observational Study. Clin. Nutr. 2021, 40, 2154–2161. [Google Scholar] [CrossRef]
- Ljungqvist, O.; van Gossum, A.; Sanz, M.L.; de Man, F. The European Fight against Malnutrition. Clin. Nutr. 2010, 29, 149–150. [Google Scholar] [CrossRef]
- Romano, T.G.; Correia, M.D.T.; Mendes, P.V.; Zampieri, F.G.; Maciel, A.T.; Park, M. Metabolic Acid-Base Adaptation Triggered by Acute Persistent Hypercapnia in Mechanically Ventilated Patients with Acute Respiratory Distress Syndrome. Rev. Bras. De Ter. Intensiv. 2016, 28, 19–26. [Google Scholar] [CrossRef] [PubMed]
- McMahon, G.; Mendu, M.L.; Gibbons, F.K.; Christopher, K.B. Association between Hyperkalemia at Critical Care Initiation and Mortality. Intensiv. Care Med. 2012, 38, 1834–1842. [Google Scholar] [CrossRef] [PubMed]
- Liu, S.; Zhang, L.; Weng, H.; Yang, F.; Jin, H.; Fan, F.; Zheng, X.; Yang, H.; Li, H.; Zhang, Y.; et al. Association Between Average Plasma Potassium Levels and 30-Day Mortality During Hospitalization in Patients with COVID-19 in Wuhan, China. Int. J. Med. Sci. 2021, 18, 736–743. [Google Scholar] [CrossRef] [PubMed]
- Moreno-Pérez, O.; Leon-Ramirez, J.-M.; Fuertes-Kenneally, L.; Perdiguero, M.; Andres, M.; Garcia-Navarro, M.; Ruiz-Torregrosa, P.; Boix, V.; Gil, J.; Merino, E.; et al. Hypokalemia as a Sensitive Biomarker of Disease Severity and the Requirement for Invasive Mechanical Ventilation Requirement in COVID-19 Pneumonia: A Case Series of 306 Mediterranean Patients. Int. J. Infect. Dis. 2020, 100, 449–454. [Google Scholar] [CrossRef]
- Hu, R.; Han, C.; Pei, S.; Yin, M.; Chen, X. Procalcitonin Levels in COVID-19 Patients. Int. J. Antimicrob. Agents 2020, 56, 106051. [Google Scholar] [CrossRef]
- Liu, Z.-M.; Li, J.-P.; Wang, S.-P.; Chen, D.-Y.; Zeng, W.; Chen, S.-C.; Huang, Y.-H.; Huang, J.-L.; Long, W.; Li, M.; et al. Association of Procalcitonin Levels with the Progression and Prognosis of Hospitalized Patients with COVID-19. Int. J. Med. Sci. 2020, 17, 2468. [Google Scholar] [CrossRef]
- Lippi, G.; Plebani, M. Procalcitonin in Patients with Severe Coronavirus Disease 2019 (COVID-19): A Meta-Analysis. Clin. Chim. Acta Int. J. Clin. Chem. 2020, 505, 190–191. [Google Scholar] [CrossRef]
- Zhou, F.; Yu, T.; Du, R.; Fan, G.; Liu, Y.; Liu, Z.; Xiang, J.; Wang, Y.; Song, B.; Gu, X.; et al. Clinical Course and Risk Factors for Mortality of Adult Inpatients with COVID-19 in Wuhan, China: A Retrospective Cohort Study. Lancet 2020, 395, 1054–1062. [Google Scholar] [CrossRef]
- Feng, T.; James, A.; Doumlele, K.; White, S.; Twardzik, W.; Zahid, K.; Sattar, Z.; Foronjy, R.; Nakeshbandi, M.; Chow, L. Procalcitonin Levels in COVID-19 Patients Are Strongly Associated with Mortality and ICU Acceptance in an Underserved, Inner City Population. In Proceedings of the American Thoracic Society International Conference, San Francisco, CA, USA, 14–19 May 2021. [Google Scholar]
- Leoni, M.L.G.; Lombardelli, L.; Colombi, D.; Bignami, E.G.; Pergolotti, B.; Repetti, F.; Villani, M.; Bellini, V.; Rossi, T.; Halasz, G.; et al. Prediction of 28-Day Mortality in Critically Ill Patients with COVID-19: Development and Internal Validation of a Clinical Prediction Model. PLoS ONE 2021, 16, e0254550. [Google Scholar] [CrossRef]


| Variables | Total (n = 286) | Death | p-Value * | |||||
|---|---|---|---|---|---|---|---|---|
| No (n = 92) | Yes (n = 194) | |||||||
| n | % | n | % | N | % | |||
| Sex (n = 286) | M | 194 | 67.8 | 52 | 56.5 | 142 | 73.2 | 0.005 |
| BMI (n = 194) | <18.5 | - | - | - | - | - | - | 0.011 |
| 18.5–24.9 | 22 | 11.3 | 11 | 19.3 | 11 | 8.03 | ||
| 25.0–29.9 | 78 | 40.2 | 15 | 26.3 | 63 | 45.9 | ||
| ≥30 | 94 | 48.5 | 31 | 54.4 | 63 | 45.9 | ||
| NRS (n = 286) | <3 | 28 | 9.8 | 9 | 9.8 | 19 | 9.8 | 0.991 |
| ≥3 | 258 | 90.2 | 83 | 90.2 | 175 | 90.2 | ||
| HF (n = 286) | Yes | 19 | 6.64 | 2 | 2.2 | 17 | 8.8 | 0.037 |
| HT (n = 286) | Yes | 145 | 50.7 | 38 | 41.3 | 107 | 55.2 | 0.029 |
| DM (n = 286) | Yes | 92 | 32.2 | 25 | 27.2 | 67 | 34.5 | 0.214 |
| CVD (n = 286) | Yes | 99 | 34.6 | 30 | 32.6 | 69 | 35.6 | 0.622 |
| CRD (n = 286) | Yes | 24 | 9.4 | 6 | 6.52 | 18 | 9.3 | 0.433 |
| CKD (n = 286) | Yes | 8 | 2.8 | 1 | 1.1 | 7 | 3.6 | 0.232 |
| TC (n = 232) | >190 | 49 | 21.1 | 20 | 24.4 | 29 | 19.3 | 0.900 |
| TGs (n = 251) | >150 | 183 | 72.9 | 58 | 73.4 | 125 | 72.7 | 0.372 |
| Variables | x | SD | x | SD | x | SD | p-value ** | |
| Age (n = 286) | 60.5 | 13.2 | 53.8 | 13.5 | 63.6 | 11.8 | <0.001 | |
| ICU length stay (n = 286) | 14.2 | 14.4 | 20.2 | 16.0 | 11.0 | 12.6 | <0.001 | |
| NRS (n = 286) | 3.3 | 1.1 | 3.1 | 1.1 | 3.4 | 1.1 | 0.061 | |
| BMI (n = 194) | 31.0 | 5.7 | 31.6 | 6.4 | 30.7 | 5.4 | 0.291 | |
| TGs [mg/dL] (n = 251) | 250.3 | 148.3 | 236.7 | 160.5 | 256.5 | 142.5 | 0.333 | |
| TC [mg/dL] (n = 232) | 144.2 | 50.7 | 155.8 | 47.9 | 137.9 | 51.2 | 0.010 | |
| Albumins [g/dL] (n = 276) | 2.9 | 0.4 | 2.9 | 0.4 | 2.9 | 0.4 | 0.652 | |
| Lymphocytes [%] (n = 271) | 9.3 | 10.4 | 9.4 | 7.7 | 9.3 | 11.5 | 0.981 | |
| Potassium [mmol/L] (n = 280) | 4.4 | 0.8 | 4.3 | 0.7 | 4.5 | 0.9 | 0.092 | |
| Sodium [mmol/L] (n = 280) | 139.6 | 5.4 | 140.2 | 4.2 | 139.2 | 5.8 | 0.141 | |
| CRP [mg/L] (n = 281) | 140.1 | 100.2 | 132.7 | 87.1 | 143.5 | 105.7 | 0.400 | |
| PCT [ng/mL] (n = 280) | 2.1 | 8.7 | 0.5 | 0.8 | 2.9 | 10.4 | 0.030 | |
| Variables | BMI | p-Value * | ||||||
|---|---|---|---|---|---|---|---|---|
| 18.5–24.9 n = 22 | 25.0–29.9 n = 78 | ≥30 n = 94 | ||||||
| n | % | n | % | n | % | |||
| Sex | M | 21 | 95.5 | 65 | 83.3 | 53 | 56.4 | <0.001 |
| NRS | <3 | 2 | 9.09 | 8 | 10.26 | 4 | 4.26 | 0.300 |
| ≥3 | 20 | 90.91 | 70 | 89.74 | 90 | 95.74 | ||
| Death | Yes | 11 | 50.00 | 63 | 80.77 | 63 | 67.02 | 0.011 |
| HF | Yes | 1 | 4.55 | 6 | 7.69 | 6 | 6.38 | 0.861 |
| HT | Yes | 9 | 40.91 | 41 | 52.56 | 55 | 58.51 | 0.311 |
| DM | Yes | 5 | 22.73 | 28 | 35.90 | 35 | 37.23 | 0.433 |
| CVD | Yes | 6 | 27.27 | 27 | 34.62 | 28 | 29.79 | 0.722 |
| CRD | Yes | 0 | 0.00 | 9 | 11.54 | 10 | 10.64 | 0.261 |
| CKD | Yes | 1 | 4.55 | 2 | 2.56 | 2 | 2.13 | 0.811 |
| TC | >190 | 4 | 21.05 | 10 | 16.13 | 16 | 20.25 | 0.792 |
| TGs | >150 | 11 | 57.89 | 53 | 74.65 | 67 | 81.71 | 0.081 |
| Variables | BMI | p-Value ** | ||||||||
|---|---|---|---|---|---|---|---|---|---|---|
| 18.5–24.9 n = 22 | 25.0–29.9 n = 78 | ≥30 n = 94 | ||||||||
| n | x | SD | n | x | SD | n | x | SD | ||
| Age | 22 | 56.6 | 17.2 | 78 | 62.8 | 10.0 | 94 | 60.2 | 12.2 | 0.081 |
| NRS | 22 | 3.4 | 1.4 | 78 | 3.4 | 1.2 | 94 | 3.4 | 1.0 | 1.001 |
| TGs [mg/dL] | 19 | 215.8 | 160.8 | 71 | 242.9 | 123.7 | 82 | 259.4 | 128.7 | 0.392 |
| TC [mg/dL] | 19 | 143.1 | 46.1 | 62 | 131.2 | 50.7 | 79 | 149.7 | 48.8 | 0.091 |
| Albumins [g/dL] | 21 | 3.0 | 0.4 | 76 | 2.9 | 0.5 | 91 | 3.0 | 0.4 | 0.202 |
| Lymphocytes [%] | 18 | 6.0 | 3.7 | 76 | 10.2 | 14.3 | 90 | 9.3 | 6.7 | 0.322 |
| Potassium [mmol/L] | 21 | 4.4 | 0.9 | 77 | 4.5 | 0.9 | 92 | 4.3 | 0.6 | 0.281 |
| Sodium [mmol/L] | 21 | 138.8 | 4.0 | 77 | 140.6 | 5.4 | 92 | 139.4 | 5.8 | 0.242 |
| CRP [mg/L] | 21 | 183.5 | 115.9 | 77 | 122.3 | 100.8 | 92 | 133.8 | 89.5 | 0.040 |
| PCT [ng/mL] | 21 | 2.5 | 8.6 | 76 | 1.7 | 4.7 | 92 | 1.9 | 9.3 | 0.913 |
| Variables | NRS | p-Value * | ||||
|---|---|---|---|---|---|---|
| <3 n = 28 | ≥3 n = 258 | |||||
| n | % | n | % | |||
| Sex | M | 18 | 64.39 | 176 | 68.22 | 0.671 |
| BMI | <18.5 | 2 | 14.29 | 20 | 11.11 | 0.301 |
| 18.5–24.9 | 8 | 57.14 | 70 | 38.89 | ||
| 25.0–29.9 | 4 | 28.57 | 90 | 50.00 | ||
| Death | Yes | 19 | 67.86 | 175 | 67.83 | 0.994 |
| HF | Yes | 1 | 3.57 | 18 | 6.98 | 0.493 |
| HT | Yes | 11 | 39.29 | 134 | 51.94 | 0.202 |
| DM | Yes | 9 | 32.14 | 83 | 32.17 | 0.992 |
| CVD | Yes | 13 | 46.43 | 86 | 33.33 | 0.171 |
| CRD | Yes | 4 | 14.29 | 20 | 7.75 | 0.244 |
| CKD | Yes | 0 | 0.00 | 8 | 3.10 | 0.343 |
| TC | >190 | 7 | 30.43 | 42 | 20.10 | 0.253 |
| TGs | >150 | 17 | 68.00 | 166 | 73.45 | 0.561 |
| Variables | NRS | p-Value ** | |||||
|---|---|---|---|---|---|---|---|
| <3 n = 28 | ≥3 n = 258 | ||||||
| n | x | SD | n | x | SD | ||
| Age | 28 | 57.3 | 13.2 | 258 | 60.8 | 13.2 | 0.181 |
| BMI | 14 | 29.6 | 6.7 | 180 | 31.1 | 5.7 | 0.362 |
| Height [cm] | 13 | 174.5 | 8.2 | 180 | 174.8 | 9.1 | 0.901 |
| Body Mass [kg] | 13 | 85.6 | 13.1 | 181 | 94.8 | 17.7 | 0.071 |
| TGs [mg/dL] | 25 | 240.1 | 150.0 | 226 | 251.4 | 148.5 | 0.722 |
| TC [mg/dL] | 23 | 148.9 | 61.1 | 209 | 143.7 | 49.6 | 0.644 |
| Albumins [g/dL] | 27 | 2.8 | 0.5 | 249 | 2.9 | 0.4 | 0.071 |
| Lymphocytes [%] | 26 | 8.2 | 3.9 | 245 | 9.5 | 10.9 | 0.551 |
| Potassium [mmol/L] | 27 | 4.6 | 1.1 | 253 | 4.4 | 0.8 | 0.242 |
| Sodium [mmol/L] | 27 | 141.1 | 5.4 | 253 | 139.4 | 5.4 | 0.121 |
| CRP [mg/L] | 28 | 123.5 | 93.7 | 253 | 141.9 | 100.9 | 0.364 |
| PCT [ng/mL] | 28 | 3.6 | 16.0 | 252 | 2.0 | 7.5 | 0.351 |
| Survival Time [Days] | ||
|---|---|---|
| Percentiles | 25 percentiles (lower quartile) | 6.0 |
| 50 percentiles (median) | 14.3 | |
| 75 percentiles (upper quartile) | 25.3 | |
| Descriptive Statistics | ||||||
|---|---|---|---|---|---|---|
| Me | x | SD | n—Death | n—Survivors | ||
| BMI | <18.5 | - | - | - | - | - |
| 18.5–24.9 | 13.0 | 18.0 | 17.8 | 11 | 11 | |
| 25.0–29.9 | 11.5 | 10.8 | 8.2 | 63 | 15 | |
| ≥30 | 11.0 | 14.7 | 16.6 | 63 | 31 | |
| NRS | <3 | 10.0 | 13.2 | 14.8 | 19 | 9 |
| ≥3 | 11.0 | 14.4 | 14.3 | 175 | 83 | |
| p-Value | HR | 95% CI HR (Lower) | 95% CI HR (Upper) | ||
|---|---|---|---|---|---|
| Sex (n = 286) | M | 0.451 | 1.13 | 0.82 | 1.56 |
| BMI (n = 194) | 18.5–24.9 | Ref. | |||
| 25.0–29.9 | 0.010 | 2.18 | 1.14 | 4.16 | |
| ≥30 | 0.662 | 1.62 | 0.85 | 3.07 | |
| NRS (n = 286) | <3 | Ref. | |||
| ≥3 | 0.661 | 0.90 | 0.56 | 1.44 | |
| HF (n = 286) | Yes | 0.281 | 1.32 | 0.79 | 2.21 |
| HT (n = 286) | Yes | 0.733 | 1.05 | 0.79 | 1.40 |
| DM (n = 286) | No | 0.344 | 1.15 | 0.86 | 1.55 |
| CVD (n = 286) | Yes | 0.941 | 1.01 | 0.75 | 1.36 |
| CRD (n = 286) | Yes | 0.080 | 1.55 | 0.95 | 2.52 |
| CKD (n = 286) | Yes | 0.641 | 1.20 | 0.56 | 2.55 |
| TGs (n = 251) | >150 | 0.671 | 1.08 | 0.77 | 1.51 |
| TC (n = 232) | >190 | 0.184 | 0.76 | 0.51 | 1.14 |
| Variables | |||||
| Age (n = 286) | 0.000 | 1.03 | 1.02 | 1.04 | |
| NRS (n = 286) | 0.019 | 1.18 | 1.03 | 1.35 | |
| BMI (n = 194) | 0.522 | 0.99 | 0.96 | 1.02 | |
| Height [cm] (n = 193) | 0.762 | 1.00 | 0.98 | 1.02 | |
| Body Mass [kg] (n = 194) | 0.733 | 1.00 | 0.99 | 1.01 | |
| TGs [mg/dL] (n = 251) | 0.844 | 1.00 | 1.00 | 1.00 | |
| TC [mg/dL] (n = 232) | 0.034 | 1.00 | 0.99 | 1.00 | |
| Albumins [g/dL] (n = 276) | 0.844 | 1.04 | 0.74 | 1.44 | |
| Lymphocytes [%] (n = 271) | 0.811 | 1.00 | 0.99 | 1.02 | |
| Potassium [mmol/L] (n = 280) | 0.002 | 1.34 | 1.11 | 1.61 | |
| Sodium [mmol/L] (n = 280) | 0.033 | 0.97 | 0.95 | 1.00 | |
| CRP [mg/L] (n = 281) | 0.283 | 1.00 | 1.00 | 1.00 | |
| PCT [ng/mL] (n = 280) | 0.000 | 1.04 | 1.03 | 1.05 | |
| n = 153 | Beta | Standard Error | Chi-Square | p-Value | HR | 95% CI HR (Lower) | 95% CI HR (Upper) | |
|---|---|---|---|---|---|---|---|---|
| Age | 0.03 | 0.01 | 11.2 | 0.001 | 1.03 | 1.01 | 1.05 | |
| Potassium [mmol/L] | 0.34 | 0.15 | 5.2 | 0.023 | 1.40 | 1.05 | 1.88 | |
| PCT [ng/mL] | 0.09 | 0.02 | 23.5 | <0.001 | 1.10 | 1.06 | 1.14 | |
| BMI | 25.0–29.9 | 0.33 | 0.16 | 4.3 | 0.038 | 2.13 | 1.03 | 4.40 |
| ≥30 | 0.09 | 0.16 | 0.3 | 0.561 | 1.68 | 0.81 | 3.47 | |
Publisher’s Note: MDPI stays neutral with regard to jurisdictional claims in published maps and institutional affiliations. |
© 2021 by the authors. Licensee MDPI, Basel, Switzerland. This article is an open access article distributed under the terms and conditions of the Creative Commons Attribution (CC BY) license (https://creativecommons.org/licenses/by/4.0/).
Share and Cite
Czapla, M.; Juárez-Vela, R.; Gea-Caballero, V.; Zieliński, S.; Zielińska, M. The Association between Nutritional Status and In-Hospital Mortality of COVID-19 in Critically-Ill Patients in the ICU. Nutrients 2021, 13, 3302. https://doi.org/10.3390/nu13103302
Czapla M, Juárez-Vela R, Gea-Caballero V, Zieliński S, Zielińska M. The Association between Nutritional Status and In-Hospital Mortality of COVID-19 in Critically-Ill Patients in the ICU. Nutrients. 2021; 13(10):3302. https://doi.org/10.3390/nu13103302
Chicago/Turabian StyleCzapla, Michał, Raúl Juárez-Vela, Vicente Gea-Caballero, Stanisław Zieliński, and Marzena Zielińska. 2021. "The Association between Nutritional Status and In-Hospital Mortality of COVID-19 in Critically-Ill Patients in the ICU" Nutrients 13, no. 10: 3302. https://doi.org/10.3390/nu13103302
APA StyleCzapla, M., Juárez-Vela, R., Gea-Caballero, V., Zieliński, S., & Zielińska, M. (2021). The Association between Nutritional Status and In-Hospital Mortality of COVID-19 in Critically-Ill Patients in the ICU. Nutrients, 13(10), 3302. https://doi.org/10.3390/nu13103302