Article

Amino Acid Profile in Malnourished Patients with Liver Cirrhosis and Its Modification with Oral Nutritional Supplements: Implications on Minimal Hepatic Encephalopathy

by
Silvia Espina
1,2,
Yolanda Gonzalez-Irazabal
2,3,
Alejandro Sanz-Paris
2,4,
Marta Lopez-Yus
2,5,
Maria Pilar Garcia-Sobreviela
2,5,
Raquel del Moral-Bergos
2,5,
Beatriz Garcia-Rodriguez
2,3,
Javier Fuentes-Olmo
1,
Vanesa Bernal-Monterde
1,2 and
Jose M. Arbones-Mainar
2,5,6,*
1
Gastroenterology Department, University Hospital Miguel Servet, 50009 Zaragoza, Spain
2
Instituto de Investigación Sanitaria (IIS) Aragon, 50009 Zaragoza, Spain
3
Clinical Biochemistry Department, University Hospital Miguel Servet, 50009 Zaragoza, Spain
4
Nutrition Department, University Hospital Miguel Servet, 50009 Zaragoza, Spain
5
Adipocyte and Fat Biology Laboratory (AdipoFat), Translational Research Unit, Instituto Aragones de Ciencias de la Salud (IACS), University Hospital Miguel Servet, 50009 Zaragoza, Spain
6
Centro de Investigación Biomédica en Red Fisiopatología Obesidad y Nutrición (CIBERObn), 28029 Madrid, Spain
*
Author to whom correspondence should be addressed.
Nutrients 2021, 13(11), 3764; https://doi.org/10.3390/nu13113764
Submission received: 1 October 2021 / Revised: 15 October 2021 / Accepted: 20 October 2021 / Published: 25 October 2021
(This article belongs to the Section Clinical Nutrition)

Abstract

:
Low plasma levels of branched chain amino acids (BCAA) in liver cirrhosis are associated with hepatic encephalopathy (HE). We aimed to identify a metabolic signature of minimal hepatic encephalopathy (MHE) in malnourished cirrhotic patients and evaluate its modification with oral nutritional supplements (ONS) enriched with ß-Hydroxy-ß-methylbutyrate (HMB), a derivative of the BCAA leucine. Post hoc analysis was conducted on a double-blind placebo-controlled trial of 43 individuals with cirrhosis and malnutrition, who were randomized to receive, for 12 weeks, oral supplementation twice a day with either 220 mL of Ensure® Plus Advance (HMB group, n = 22) or with 220 mL of Ensure® Plus High Protein (HP group, n = 21). MHE evaluation was by psychometric hepatic encephalopathy score (PHES). Compared to the HP group, an HMB-specific treatment effect led to a larger increase in Val, Leu, Phe, Trp and BCAA fasting plasma levels. Both treatments increased Fischer’s ratio and urea without an increase in Gln or ammonia fasting plasma levels. MHE was associated with a reduced total plasma amino acid concentration, a reduced BCAA and Fischer´s ratio, and an increased Gln/Glu ratio. HMB-enriched ONS increased Fischer´s ratio without varying Gln or ammonia plasma levels in liver cirrhosis and malnutrition, a protective amino acid profile that can help prevent MHE.

1. Introduction

Malnutrition in cirrhosis is characterized by an increase in fatty acid oxidation, reduced utilization of glucose as energy source, and decreased protein synthesis. All these processes converge into a loss of muscle mass [1]. Gluconeogenesis is increased in early stages of liver cirrhosis and the skeletal muscle is the main source of amino acids by proteolysis. As a result, both aromatic (AAA) and branched chain amino acids (BCAA) are generated [2]. BCAA are catabolized in the skeletal muscle and AAA are primarily metabolized in the liver. As a consequence, plasma BCAA concentrations and Fischer´s ratio (BCAA/AAA) are reduced in cirrhotic patients [2,3,4]. The reduced concentration of amino acids in the muscle cells activates proteolysis via autophagy [2]. Hyperammonemia plays a crucial role in increased BCAA catabolism and decreased plasma BCAA concentrations in liver cirrhosis [5]. Moreover, hyperammonemia in cirrhosis also contributes to the inhibition of protein synthesis and the activation of autophagy [2,6].
Physiologically, glutamate (Glu) serves as an anaplerotic substrate in most tissues to generate α-ketoglutarate, and this reaction is catalyzed bidirectionally by the enzyme glutamate dehydrogenase [2]. However, in cirrhosis due to impaired ureagenesis, the skeletal muscle is the main ammonia-detoxifying system by increasing the activity of glutamine synthetase [2,7]. As consequence, Glu and ammonia form glutamine (Gln) and consume α-ketoglutarate [8]. Most of the Gln produced is released to the blood and catabolized in enterocytes and kidneys to ammonia [9]. This Gln synthesis and Gln breakdown in liver cirrhosis plays a vicious cycle in the development of hyperammonemia and in the decrease in BCAA levels [10]. Ultimately, increased blood ammonia levels causes astroglial swelling leading to neurological or psychiatric alterations known as hepatic encephalopathy (HE) [11]. In sarcopenia, due to low muscle mass, non-hepatic disposal of ammonia is impaired, which may cause HE more frequently [12]. HE is divided into two broad categories based on severity, covert or minimal (MHE) and overt [13]. MHE has a significant impact on a patient´s quality of life, increasing hospitalizations and death [14]. The psychometric hepatic encephalopathy score (PHES) is a validated, gold standard tool to evaluate MHE [15].
Supplementation with leucine (Leu), a BCAA, actives protein synthesis via mTOR (mammalian target of rapamycin) [16]. Moreover, BCAA supplementation promotes ammonia detoxification in skeletal muscle via α-ketoglutarate and serves as an anaplerotic substrate in muscle and brain [17]. Clinically, BCAAs in liver cirrhosis have been associated with symptomatic improvement of hepatic encephalopathy and decreased incidence of ascites and infections [18]. An additional increase in muscle strength has also been observed [18]. From studies of amino acid oxidation [19], it has been advised that BCAA supplementation in liver cirrhosis be carried out in the proportions 2:1:1 (Leu:Ile:Val) [20]. Supplementing with leucine alone could increase the oxidation of other BCAAs, worsening muscle protein balance [21].
ß-Hydroxy-ß-methylbutyrate (HMB) is a naturally occurring and metabolically active derivative of the BCAA Leu [22]. HMB stimulates protein synthesis and inhibits the ubiquitin–proteasome system [23], and is more effective than Leu in increasing protein synthesis through the mTOR system [24]. HMB also increases the activity of branched-chain alpha-keto acid dehydrogenase (BCKD) in muscle-wasting disorders such as liver cirrhosis. This results in the oxidation of Leu as source of energy, increasing acetyl-CoA and impairing HMB production [7].
Recent studies have shown that 12-week HMB supplementation improved muscle performance in compensated cirrhotic patients [25] and increased plasma BCAA in cirrhotic and partially hepatectomized rats [26,27]. However, the effect of oral nutritional supplements (ONS) with HMB on the amino acid profile of patients with decompensated cirrhosis has not been studied. We therefore conducted a pilot randomized clinical trial aimed at analyzing the effect of HMB in the clinical setting of liver cirrhosis and malnutrition (Espina S. Unpublished results). In this post hoc study we aimed to identify a metabolic signature of MHE in malnourished cirrhotic patients and evaluate its modification with ONS.

2. Materials and Methods

2.1. Study Design and Population

This post hoc study is part of a double-blind, parallel-group, randomized controlled trial (NCT03285217 at ClinicalTrials.gov) performed in the University Hospital Miguel Servet (Zaragoza, Spain) that enrolled patients with liver cirrhosis of any etiology, with 1 previous decompensation, and clinical malnutrition screened by SGA (Subjective Global Assessment) [28]. Exclusion criteria were being <18 years old or having diabetes mellitus, corticosteroid treatment, hepatocellular carcinoma, uncontrolled infection, orthotopic liver transplantation, recent (<3 months) overt hepatic encephalopathy, or variceal upper gastrointestinal bleeding.
Participants were randomized into one of two study groups with a 1:1 ratio via permuted-block randomization with random block size using the package blockrand of R. Participants randomly received, twice a day and for 12 weeks, ONS of either 220 mL of Ensure® Plus Advance (HMB group; 1.5 kcal/mL, 24.3% protein, 28.8% fat, and 1.5 g of calcium HMB per service) or 220 mL of Ensure® Plus High Protein (HP group; 1.25 kcal/mL, 25.3% protein, 23.8% fat). Supplementary Table S1 shows the amino acid content of each oral supplement.
This trial was conducted in compliance with the Declaration of Helsinki and was approved by the local ethics committee (CEIC-A, ref. PI17/0258). All study participants provided written informed consent before participating in the trial.
Amino acid profiles, along with sex and age, from otherwise healthy unidentified noncirrhotic individuals were provided by the Clinical Biochemistry Department at the University Hospital Miguel Servet. No informed consent was sought from those individuals due to the use of anonymized data.

2.2. Outcome Measures

Both groups were evaluated at the same time points: baseline (pretreatment), 6 weeks after the start of the ONS, and at the end of the treatment (12 weeks). At each visit, laboratory (fasting venous sampling) and clinical assessments were carried out. MHE was evaluated using the psychometric hepatic encephalopathy score (PHES), a battery of paper-pencil tests evaluating cognitive and psychomotor processing speed as well as visuomotor coordination [15]. Liver status was assessed with (1) Child–Pugh score [29] which uses five clinical measures of liver disease (total bilirrubin, serum albumin, prothrombin time, ascites, and HE). Each measure was scored 1–3 according to well-established cutoffs, with 3 indicating most severe derangement. A further classification into classes A (5–6 points), B (7–9 points), and C (10–15 point) was carried out [30] and (2) MELD score [31], which is used to assess the severity of chronic liver diseases according to a formula that includes values for serum bilirubin, serum creatinine, and the international normalized ratio for prothrombin time (INR).
Amino acids in plasma were identified using cation-exchange chromatography by post-column ninhydrin derivatization on the Biochrom 30+ Amino Acid analyzer (Biochrom Ltd., Cambridge, UK). Five different lithium citrate elution buffers were used to separate the amino acids, and a postcolumn reaction with ninhydrin formed a dye complex with the amino acids. UV detection of amino acids was obtained at two wavelengths, 570 nm and 440 nm, according to the type of the amino acids determined [32,33]. BCAA was calculated as the sum of Leu, Ile and Val. AAA was calculated as the sum of Phe, Tyr and Trp. Fischer´s ratio was calculated as the sum of Leu, Ile and Val divided by the sum of Phe and Tyr. Gln/Glu ratio was calculated as Gln divided by Glu.

2.3. Statistical Analyses

Statistical analysis was carried out in R 3.4.3. and the appropriate packages according to the predefined statistical analysis plan. Categorical data were presented as number of cases and percentages and compared using the Chi-squared tests with Yates correction. Continuous data were described as median and interquartile ranges (IQRs) and comparisons were performed with Mann–Whitney U-tests.
Principal component analysis (PCA) was performed with the FactoMineR and factoextra packages using scaled data. Variable contributions for a given principal component were expressed in percentage.
Longitudinal variations were modeled using linear mixed-effects models (LMM) for repeated measures using the lme function of the nlme package to take into consideration the repeated assessment of each variable. Missing values in outcome variables were not imputed. LMM models produced different p-values that captured the variation over time of each variable for the entire cohort (plong) and treatment-specific longitudinal changes, that is, the interaction between longitudinal changes and treatment (plong*treatment). Values of plong*treatment < 0.1 were considered as hypothesis-generating.

3. Results

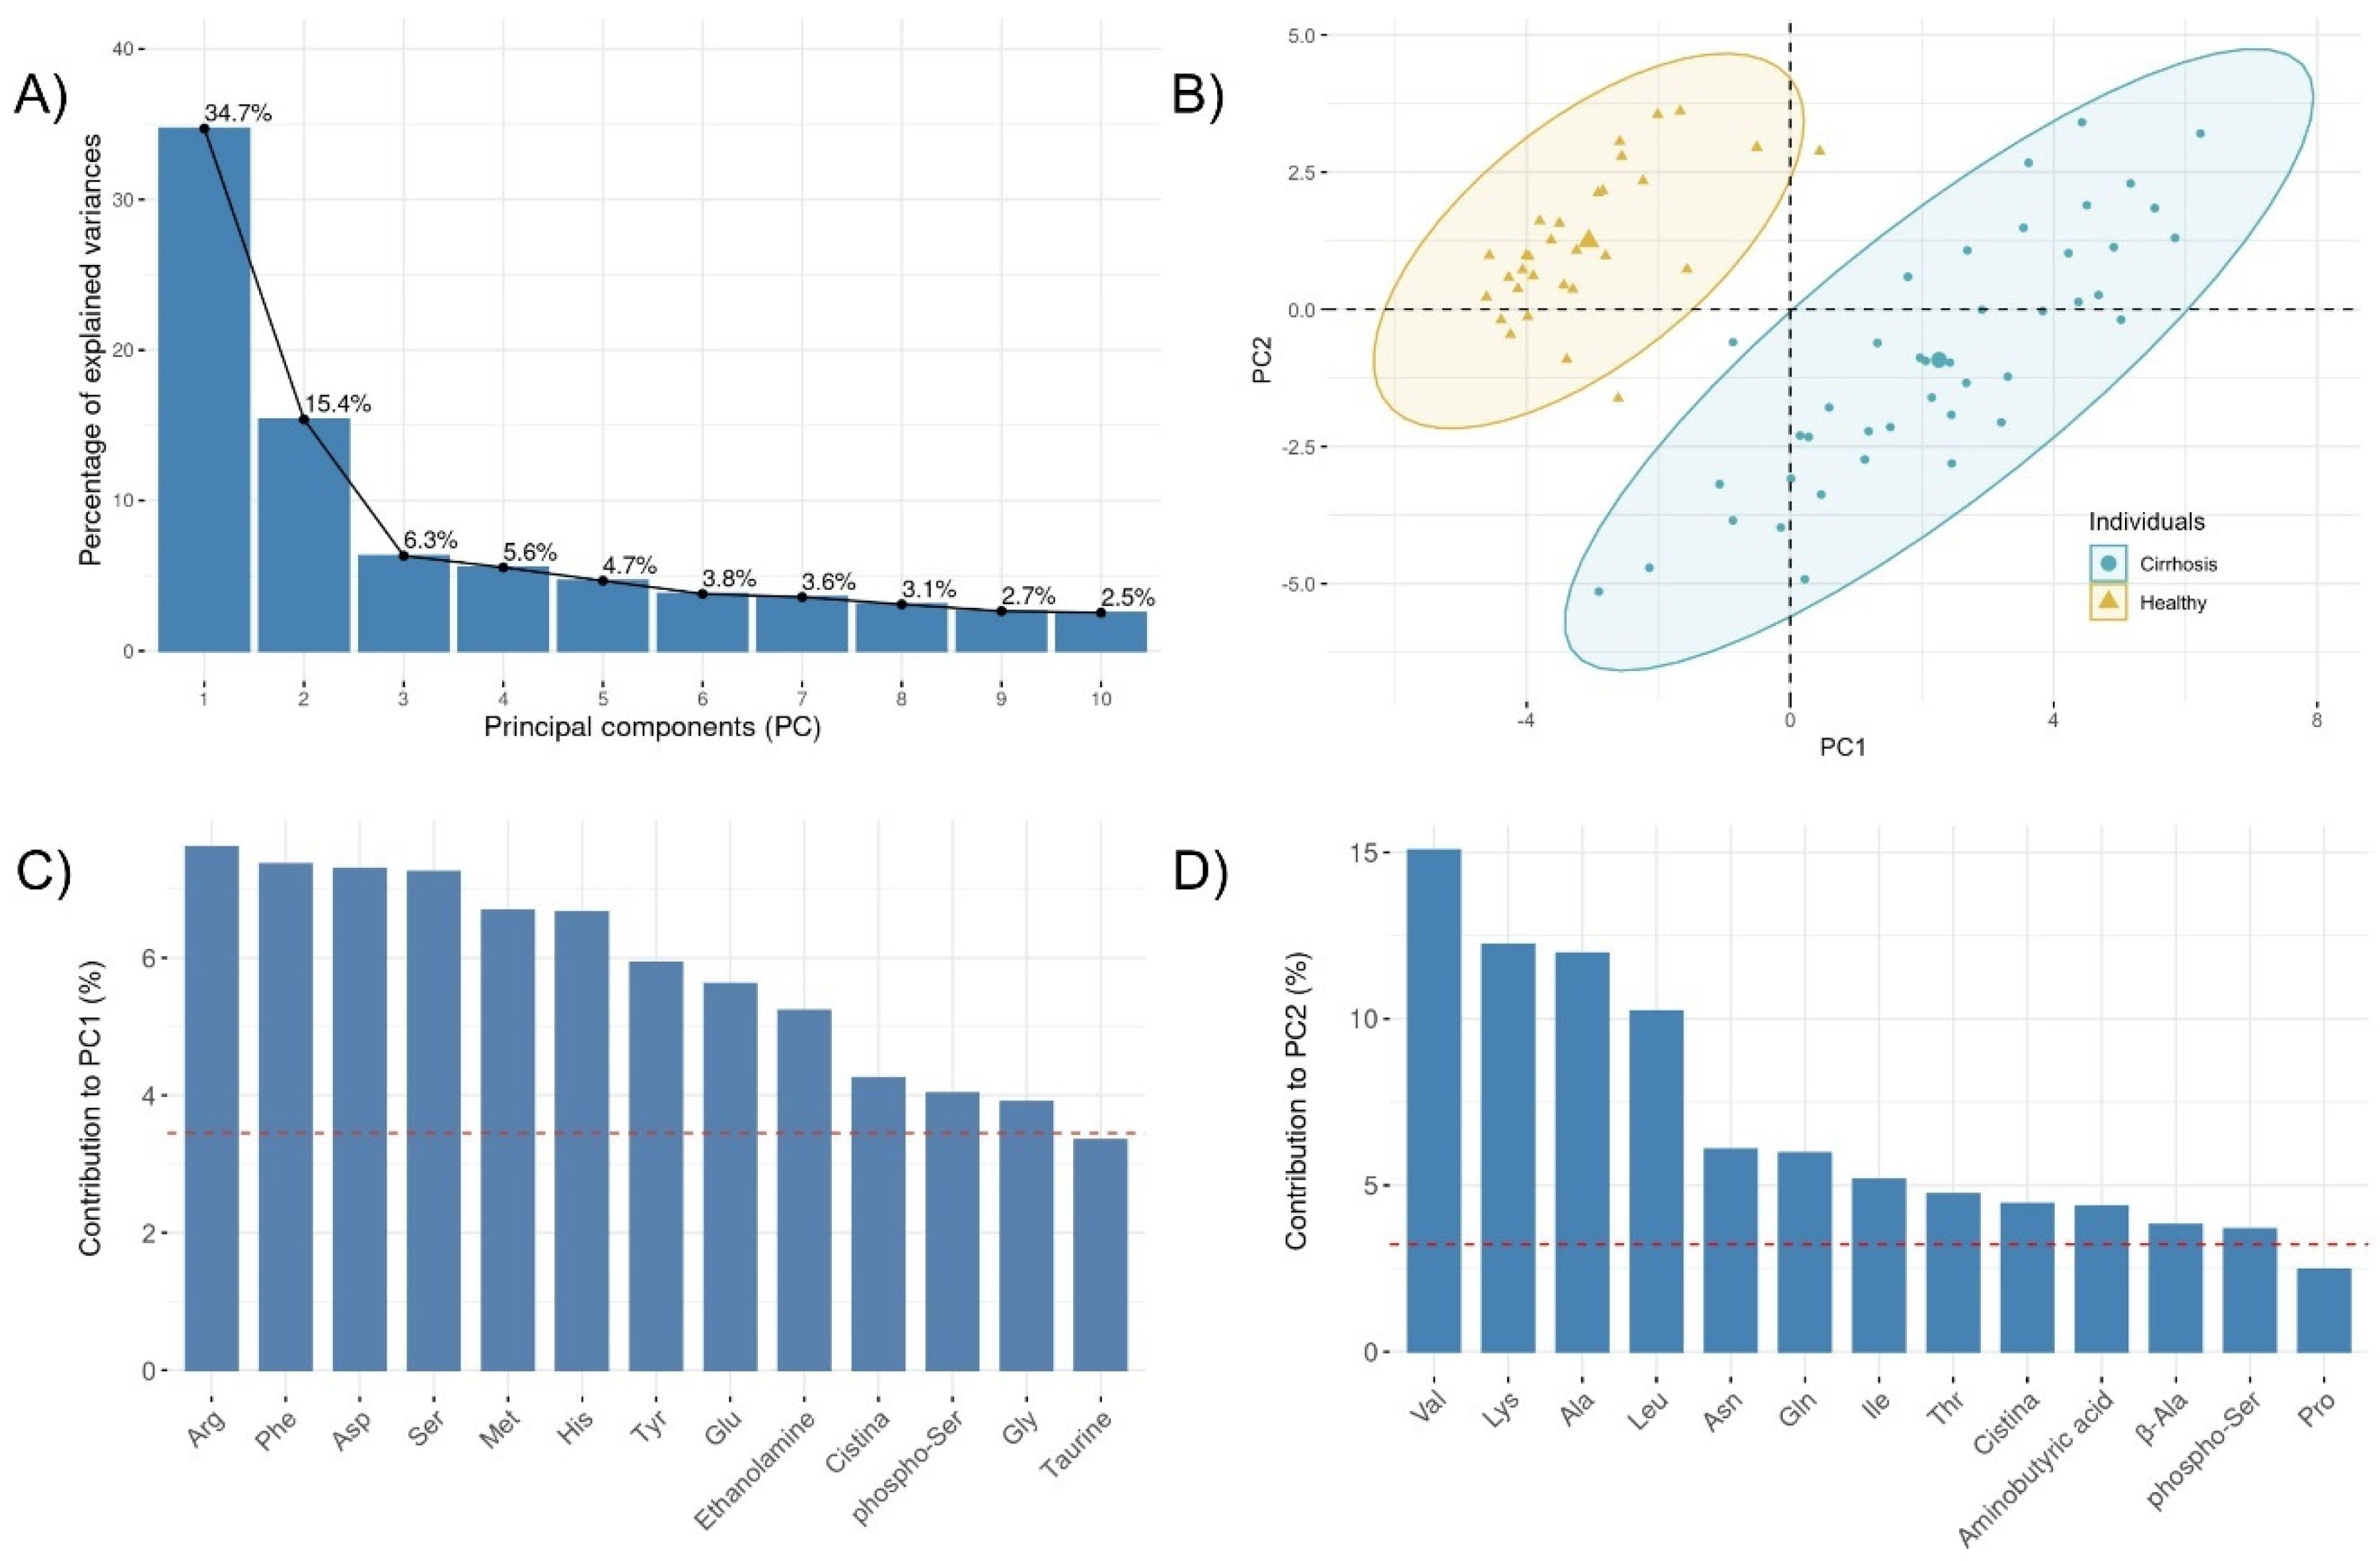
3.1. Specific Plasma Amino Acid Profile in Cirrhotic Patients

Firstly, we sought to investigate the difference in plasma amino acid profile between cirrhotic patients with clinical malnutrition (n = 43) and healthy individuals (n = 31) matched for age and sex.
Patients with cirrhosis had lower plasma concentration of phosphoserine, Asn, Gln, Val, and cystine while those of taurine, Asp, Ser, Glu, aminoadipic acid, Gly, Met, Tyr, beta-alanine, Phe, etanolamine, ornithine, Arg, Trp, His, 3-methylhistidine, and hydroxyproline (Hyp) were significantly higher in cirrhotic patients than in their healthy counterparts (Table 1).
Changes in the balance of the plasma amino acids were next investigated using principal component analysis (PCA). The Kaiser–Meyer–Olkin measure of sampling adequacy was 0.76 and the Bartlett´s test of sphericity rejected the null hypothesis of the test, i.e., that the variables were orthogonal (p < 0.001). Five PCs with eigenvalues >1 were identified and their percentage of explained variance is represented in Figure 1A. To evaluate their performance, the Mann–Whitney U-test was used to compare each PC score between the healthy and cirrhotic individuals. Both PC1 and PC2 showed significant p values (< 0.001) and their score plots showed a clear discrimination between cirrhotic and healthy subjects on the basis of their amino acid profile (Figure 1B). Next, we extracted the contribution of each individual amino acid towards the PCs. The results identified Arg, Phe, Asp, and Ser as the most contributing factors for PC1 (Figure 1C) while Val, Lys, Ala, and Leu were the most important contributors for PC2 (Figure 1D).

3.2. Baseline Characteristics of Cirrhotic Patients before Oral Nutritional Supplementation

Forty-three patients with cirrhosis were randomized to receive ONS twice a day with either 220 mL of Ensure® Plus Advance (HMB group, n = 22) or oral supplementation twice a day with 220 mL of Ensure® Plus High Protein (HP group, n = 21). At the time of enrollment, there were no significant differences between treatment groups with respect to age, sex or prevalence of ascites. Alcohol addiction was the main etiology of cirrhosis in both groups (Table 2).
Median [IQR] values for prognostic assessment in liver cirrhosis for all cirrhotic patients were 12 [8.5; 16.5] for the MELD score and 7 [6.0; 8.5] for the Child–Pugh score with no difference between treatment groups. The patients also underwent a nutritional assessment using the SGA scale without finding differences between the groups. Overall, 72% of the patients were evaluated as moderately malnourished (B) and the other 28% as severely malnourished (C) (Table 2).
A similar amino acid profile was observed in the treatment groups at the baseline with only minor differences in the plasma concentration of Leu and Trp (Supplementary Table S2). Both amino acids appeared slightly decreased at baseline in the HMB group.

3.3. Longitudinal Changes in Metabolic Parameters and Amino Acids during Oral Nutritional Supplementation

A total of 108 amino acid profiles were assayed during the ONS treatment. Both ONS treatments during 12 weeks increased the plasma levels of Asp (plong = 0.001), Ala (plong = 0.004), citruline (plong = 0.03), Val (plong = 0.004), Met (plong = 0.03), Leu (plong = 0.01), Tyr (plong = 0.001), Phe (plong = 0.001), Lys (plong = 0.031), and Trp (plong = 0.008). Compared with the HP group, an HMB-specific treatment effect led to a larger increase in Val (35% vs. 13%, plong*treatment = 0.055), Leu (27% vs. 1%, plong*treatment = 0.035), Phe (36% vs. 0%, plong*treatment = 0.057), and Trp (35% vs. 11%, plong*treatment = 0.066) (Table 3). Changes observed in those amino acids are illustrated in Figure 2.
Plasma BCAA levels (sum of leucine, isoleucine and valine) increased significantly (plong = 0.012) during both treatments. However, this increase was larger in the HMB group compared with the HP group (25% vs. 3%, plong*treatment = 0.046). AAA levels (sum of phenylalanine, tyrosine and tryptophan) increased significantly at the end of both treatments (plong = 0.003) without differences between treatment groups (Table 3). Supplementary Table S3 shows the variations for all plasma amino acid.
During follow-up the plasma urea levels increased significantly at the end of the trial (plong = 0.048), with no differences between treatments. Ammonia plasma levels did not increase significantly at the end of the trial (plong = 0.11).

3.4. Amino Acid Signature of the Minimal Hepatic Encephalopathy

Overall, 29% of the patients presented MHE during the baseline assessment while this percentage decreased to 21% after 12 weeks of ONS (p = 0.32). Interestingly, HMB treatment reduced the MHE prevalence from 38% to 21% (p = 0.16) while no reduction was observed in the HP group (19% in the baseline and 21% after treatment. p = 1).
108 amino acid profiles were obtained and 26 MHE events were documented during follow-up. Table 4 shows the metabolic profiles, closest in time to the MHE event, compared to those analyses that were not associated with any event. MHE events were associated with reduced total plasma amino acid concentration (calculated as the sum of all amino acid levels); 2.9 mM [2.6; 3.2] vs. 3.2 mM [2.9; 3.6] in the absence of MHE (p = 0.011). For the individual amino acids, significant lower plasma levels of taurine, Asp, Ser, Glu, Gly, Ala, Val, Ile, Leu, Phe, and Arg were associated with MHE. In general, a reduced BCAA and Fischer´s ratio and an increased Gln/Glu ratio occurred simultaneously during the MHE events.

4. Discussion

Portosystemic shunt and impaired ornithine cycle activity in cirrhosis lead to skeletal muscle depletion and impaired ammonia detoxification causing hepatic encephalopathy [1]. This condition may be aggravated by malnutrition [12]. We observed that the amino acid signature associated with MHE was characterized by a 24% reduction in BCAA and a 19.5% lower Fischer’s ratio, while the Gln/Glu ratio increased by 38.3% compared to those without MHE. Our study showed that oral nutritional supplementation for 12 weeks with either HMB or HP treatments increased plasma levels of AAA, Ala, and urea without increasing Gln or ammonia. Interestingly, only oral supplementation with HMB increased plasma levels of BCAA.
There is ample evidence of the profound effects of liver disease on amino acid metabolism. Pioneering studies had shown long ago that increased concentrations of methionine and AAA with decreased concentrations BCAA were associated with liver cirrhosis [34,35]. Here, we also found elevated Hyp in cirrhotic patients, formed by post-translational hydroxylation of proline and biomarkers of liver fibrosis [36]. Additionally, by using a multivariate (PCA) analysis we were able to include Arg, Asp, Ser, Lys, and Ala in the metabolic profile to distinguish healthy from malnourished cirrhotic patients.
Hyperammonemia is a consequence of portosystemic shunting and hepatocellular dysfunction, the skeletal muscle being the main system for ammonia detoxification in liver cirrhosis [2]. Hyperammonemia has been shown to be associated with the pathogenesis of complications related to cirrhosis, such as hepatic encephalopathy [37]. Beyond hyperammonemia, our results also agree with other metabolic routes previously described to be associated with HE. Thus, the decreased Fisher´s ratio may cause an imbalance in the synthesis of neurotransmitters [38] while increased Gln correlates with astrocyte swelling [11]. Reduced levels of taurine and Arg may indicate an impairment in the trans-sulphuration pathway which consumes hCys, a well-known risk factor for dementia [39,40,41]. Clinically, BCAA supplementation in liver cirrhosis have been associated with symptomatic improvement of hepatic encephalopathy [42,43]. Most studies indicate that administration of BCAA in cirrhosis has no effect or decreases ammonia [20]. However, Dam et al. observed a significant increase in arterial blood concentrations of ammonia and Gln flux from muscles in cirrhotic patients compared to healthy subjects after the intake of BCAA [44]. However, BCAA supplementation increased plasma BCAA levels to a lesser extent in cirrhosis than in healthy individuals. Holecek et al. described an increase in plasma and muscle levels of BCAA, Ala, and Gln in healthy rats orally supplemented with BCAA [21]. Interestingly, only oral supplementation with HMB increased plasma levels of BCAA although BCAA is also found in the High Protein ONS. We hypothesize that HMB is increasing plasma levels of BCAA via a direct effect on protein synthesis and inhibition of protein breakdown. Alternatively, HMB might also decrease gluconeogenesis [45] and consequently reduce the utilization of BCAA as gluconeogenic precursors.
HMB is a naturally occurring and metabolically active derivative of the BCAA leucine. Mounting evidence supports that ONS with HMB can increase muscle mass and strength and reduce muscle damage during resistance exercises [22,46,47,48], as well as prevent muscle loss in the elderly [49,50]. However, there are few clinical reports of the effects of ONS enriched with HMB on other muscle-wasting diseases [23] and specifically there are no data on the clinical impact of HMB in liver cirrhosis or its effects on plasma amino acid profiles. Holecek et al. conducted a study in healthy rats to examine the role of exogenous HMB on Leu and protein metabolism, and they observed an increase in plasma Leu levels as a result of a decrease in its clearance, as well as a decrease in plasma levels of Ala, Gln, and Glu [51].
We found several trends that can help focus future research. HMB supplementation increased fasting plasma levels of the essential amino acids Val, Leu, Phe, and Trp. We did not observe those changes in the HP group. It can be argued that the HMB group received the Ensure® Plus Advance formula with a slightly higher dose of amino acids than Ensure® Plus High Protein (HP treatment). However, the magnitude of the increases (27–35%) almost doubled the differences in the composition (13–20%). Both ONS increased the plasma levels of AAA (p = 0.003), Ala (p = 0.004) and urea (p = 0.048), without increasing the plasma levels of ammonia (p = 0.11) or Gln (p = 0.932). Fischer´s ratio increased significantly at the end of the study (p = 0.013) without differences between treatments, although an upward trend was observed in the HMB group. We also study the Gln/Glu ratio because an increased ratio has been associated with a deterioration of brain function [52] but no significant differences were found at the end of the trial for either of the two treatments (p = 0.31).
We found that the presence of MHE was associated with (1) reduced total plasma amino acid concentration, likely associated with an impaired nutritional status, (2) reduced BCAA and Fischer´s ratio, and (3) increased Gln/Glu ratio. This amino acid signature may be used to evaluate potential treatments to reduce the incidence of MHE in malnourished patients with liver cirrhosis. In this vein, our study showed that MHE events were nearly halved in individuals supplemented with HMB-enriched ONS after 12 weeks of treatment. Furthermore, HMB-enriched ONS increased Fischer´s ratio by increasing BCAA levels in a greater proportion than AAA levels, which according to previous results is associated with an improvement in the symptoms of hepatic encephalopathy [3].
Our study has several limitations, mainly derived from the complexity of amino acid metabolism in the MHE context. Studying plasma concentrations of amino acids can, at best, reflect only partial aspects of this complexity. We cannot rule out some other effects beyond the observed variation at the metabolomics level. Some HMB effects may occur at the gene expression level (reviewed in [45]) and a recent report has indicated that HMB is an epigenetic regulator in muscle progenitor cells in vitro [53]. The relatively small sample size has surely limited the power to find statistically significant associations. However, we find value in the overall description of these little-studied relationships. Taken together, the findings were consistent and this study will serve as an exploratory analysis for other potential linkages.

5. Conclusions

The main conclusion for this work is that HMB-enriched ONS increased the Fischer´s ratio in patients with liver cirrhosis and malnutrition without varying Gln or ammonia plasma levels, a protective amino acid profile that can help prevent MHE.

Supplementary Materials

The following are available online at https://www.mdpi.com/article/10.3390/nu13113764/s1, Supplementary Table S1. Amino acids nutritional content of each oral supplement, Supplementary Table S2. Amino acid levels and analytical parameters at baseline, Supplementary Table S3. Amino acid levels (median) during follow-up.

Author Contributions

Conceptualization, S.E.; Data curation, J.M.A.-M.; Formal analysis, J.M.A.-M.; Investigation, S.E., Y.G.-I., A.S.-P., M.L.-Y., M.P.G.-S., R.d.M.-B., B.G.-R., J.F.-O. and V.B.-M.; Supervision, J.F.-O., V.B.-M. and J.M.A.-M.; Writing—original draft, S.E.; Writing—review and editing, S.E., A.S.-P., M.L.-Y. and J.M.A.-M. All authors have read and agreed to the published version of the manuscript.

Funding

This study was funded by the Fondo Europeo de Desarrollo Regional (FEDER) via the Trans-Pyrinean cooperation network for biomedical research grants (HEPATIC/Refbio2 Project). J.M.A-M. is supported by a grant (PI17/02268) from the Instituto de Salud Carlos III) and by FEDER: “Una manera de hacer Europa”. J.M.A.-M. also has support from the regional government of Aragón (B03_20R) co-financed with the FEDER Aragón 2014–2020: “Construyendo Europa desde Aragón”.

Institutional Review Board Statement

The study was conducted according to the guidelines of the Declaration of Helsinki, and approved by the Institutional Ethics Committee of Aragón (CEIC-A) (protocol code PI17/0258 and date of approval: 26 July 2017).”

Informed Consent Statement

Informed consent was obtained from all subjects involved in the study.

Data Availability Statement

The data presented in this study are available on request from the corresponding author with prior authorization of our Ethical Committee that can be obtained at https://www.iacs.es/investigacion/comite-de-etica-de-la-investigacion-de-aragon-ceica/ceica-evaluaciones-y-otras-presentaciones accessed on 22 October 2021.

Acknowledgments

We want to acknowledge the contribution of P.P. Risi, T. Martin, and J. Cifuentes to the field of liver disease.

Conflicts of Interest

Silvia Espina has no conflict to disclose. Yolanda Gonzalez-Irazabal has no conflict to disclose. Alejandro Sanz-Paris has received speaker honorarium from Abbott, Nutricia, Nestle, Persan, Vegenat, and Fresenius. Marta Lopez-Yus has no conflict to disclose. Maria Pilar Garcia-Sobreviela has no conflict to disclose. Raquel del Moral-Bergos has no conflict to disclose. Beatriz Garcia-Rodriguez has no conflict to disclose. Javier Fuentes-Olmo has no conflict to disclose. Vanesa Bernal-Monterde has no conflict to disclose. Jose M. Arbones-Mainar has no conflict to disclose.

References

  1. Periyalwar, P.; Dasarathy, S. Malnutrition in Cirrhosis: Contribution and Consequences of Sarcopenia on Metabolic and Clinical Responses. Clin. Liver Dis. 2012, 16, 95–131. [Google Scholar] [CrossRef] [PubMed] [Green Version]
  2. Dasarathy, S.; Merli, M. Sarcopenia from mechanism to diagnosis and treatment in liver disease. J. Hepatol. 2016, 65, 1232–1244. [Google Scholar] [CrossRef] [PubMed] [Green Version]
  3. Fischer, J.E.; Rosen, H.M.; Ebeid, A.M.; James, J.H.; Keane, J.M.; Soeters, P.B. The effect of normalization of plasma amino acids on hepatic encephalopathy in man. Surgery 1976, 80, 77–91. [Google Scholar] [PubMed]
  4. Campollo, O.; Sprengers, D.; McIntyre, N. The BCAA/AAA ratio of plasma amino acids in three different groups of cirrhotics. Rev. Investig. Clin. 1992, 44, 513–518. [Google Scholar]
  5. Holeček, M. The Role of Skeletal Muscle in The Pathogenesis of Altered Concentrations of Branched-Chain Amino Acids (Valine, Leucine, and Isoleucine) in Liver Cirrhosis, Diabetes, and Other Diseases. Physiol. Res. 2021, 70, 293–305. [Google Scholar] [CrossRef] [PubMed]
  6. Lockwood, A.H.; McDonald, J.M.; E Reiman, R.; Gelbard, A.S.; Laughlin, J.S.; Duffy, T.E.; Plum, F. The dynamics of ammonia metabolism in man: Effects of liver disease and hyperammonemia. J. Clin. Investig. 1979, 63, 449–460. [Google Scholar] [CrossRef] [Green Version]
  7. Holecek, M. Branched-chain amino acids and ammonia metabolism in liver disease: Therapeutic implications. Nutrition 2013, 29, 1186–1191. [Google Scholar] [CrossRef] [PubMed]
  8. Dasarathy, S. Cause and management of muscle wasting in chronic liver disease. Curr. Opin. Gastroenterol. 2016, 32, 159–165. [Google Scholar] [CrossRef] [PubMed] [Green Version]
  9. Holecek, M. Evidence of a vicious cycle in glutamine synthesis and breakdown in pathogenesis of hepatic en-cephalopathy–therapeutic perspectives. Metab. Brain Dis. 2014, 29, 9–17. [Google Scholar] [CrossRef] [PubMed] [Green Version]
  10. Holecek, M. Ammonia and amino acid profiles in liver cirrhosis: Effects of variables leading to hepatic encephalopathy. Nutrition 2015, 31, 14–20. [Google Scholar] [CrossRef] [PubMed]
  11. Zhou, Y.; Eid, T.; Hassel, B.; Danbolt, N.C. Novel aspects of glutamine synthetase in ammonia homeostasis. Neurochem. Int. 2020, 140, 104809. [Google Scholar] [CrossRef] [PubMed]
  12. Merli, M.; Giusto, M.; Lucidi, C.; Giannelli, V.; Pentassuglio, I.; di Gregorio, V.; Lattanzi, B.; Riggio, O. Muscle depletion increases the risk of overt and minimal hepatic encephalopathy: Results of a prospective study. Metab. Brain Dis. 2012, 28, 281–284. [Google Scholar] [CrossRef]
  13. Patidar, K.R.; Bajaj, J.S. Covert and Overt Hepatic Encephalopathy: Diagnosis and Management. Clin. Gastroenterol. Hepatol. 2015, 13, 2048–2061. [Google Scholar] [CrossRef] [PubMed] [Green Version]
  14. Rose, C.F.; Amodio, P.; Bajaj, J.S.; Dhiman, R.K.; Montagnese, S.; Taylor-Robinson, S.D.; Vilstrup, H.; Jalan, R. Hepatic encephalopathy: Novel insights into classification, pathophysiology and therapy. J. Hepatol. 2020, 73, 1526–1547. [Google Scholar] [CrossRef] [PubMed]
  15. Weissenborn, K.; Ennen, J.C.; Schomerus, H.; Rückert, N.; Hecker, H. Neuropsychological characterization of hepatic encephalopathy. J. Hepatol. 2001, 34, 768–773. [Google Scholar] [CrossRef]
  16. Vasques, J.; Guerreiro, C.S.; Sousa, J.; Pinto, M.; Cortez-Pinto, H. Nutritional support in cirrhotic patients with sarcopenia. Clin. Nutr. ESPEN 2019, 33, 12–17. [Google Scholar] [CrossRef] [PubMed]
  17. Kawaguchi, T.; Taniguchi, E.; Sata, M. Effects of Oral Branched-Chain Amino Acids on Hepatic Encephalopathy and Outcome in Patients with Liver Cirrhosis. Nutr. Clin. Pr. 2013, 28, 580–588. [Google Scholar] [CrossRef] [PubMed]
  18. Ooi, P.; Gilmour, S.; Yap, J.; Mager, D. Effects of branched chain amino acid supplementation on patient care outcomes in adults and children with liver cirrhosis: A systematic review. Clin. Nutr. ESPEN 2018, 28, 41–51. [Google Scholar] [CrossRef] [PubMed]
  19. Kurpad, A.V.; Regan, M.M.; Raj, T.; Gnanou, J.V. Branched-Chain Amino Acid Requirements in Healthy Adult Human Subjects. J. Nutr. 2006, 136, 256S–263S. [Google Scholar] [CrossRef] [Green Version]
  20. Holeček, M. Branched-chain amino acid supplementation in treatment of liver cirrhosis: Updated views on how to attenuate their harmful effects on cataplerosis and ammonia formation. Nutrition 2017, 41, 80–85. [Google Scholar] [CrossRef]
  21. Holeček, M.; Šiman, P.; Vodenicarovova, M.; Kandar, R. Alterations in protein and amino acid metabolism in rats fed a branched-chain amino acid- or leucine-enriched diet during postprandial and postabsorptive states. Nutr. Metab. 2016, 13, 12. [Google Scholar] [CrossRef] [Green Version]
  22. Nissen, S.; Sharp, R.; Ray, M.; A Rathmacher, J.; Rice, D.; Fuller, J.C.; Connelly, A.S.; Abumrad, N. Effect of leucine metabolite beta-hydroxy-beta-methylbutyrate on muscle metabolism during resistance-exercise training. J. Appl. Physiol. 1996, 81, 2095–2104. [Google Scholar] [CrossRef]
  23. Holeček, M. Beta-hydroxy-beta-methylbutyrate supplementation and skeletal muscle in healthy and muscle-wasting conditions. J. Cachexia Sarcopenia Muscle 2017, 8, 529–541. [Google Scholar] [CrossRef]
  24. Girón, M.D.; Vílchez, J.D.; Salto, R.; Manzano, M.; Sevillano, N.; Campos, N.; Argilés, J.M.; Rueda, R.; López-Pedrosa, J.M. Conversion of leucine to β-hydroxy-β-methylbutyrate by α-keto isocaproate dioxygenase is required for a potent stimulation of protein synthesis in L6 rat myotubes. J. Cachexia Sarcopenia Muscle 2015, 7, 68–78. [Google Scholar] [CrossRef] [PubMed]
  25. Lattanzi, B.; Bruni, A.; di Cola, S.; Molfino, A.; de Santis, A.; Muscaritoli, M.; Merli, M. The Effects of 12-Week Beta-Hydroxy-Beta-Methylbutyrate Supplementation in Patients with Liver Cirrhosis: Results from a Randomized Controlled Single-Blind Pilot Study. Nutrients 2021, 13, 2296. [Google Scholar] [CrossRef]
  26. Holeček, M.; Vodeničarovová, M. Effects of beta-hydroxy-beta-methylbutyrate supplementation on skeletal muscle in healthy and cirrhotic rats. Int. J. Exp. Pathol. 2019, 100, 175–183. [Google Scholar] [CrossRef] [PubMed]
  27. Singh, S.S.; Kumar, A.; Welch, N.; Sekar, J.; Mishra, S.; Bellar, A.; Gangadhariah, M.; Attaway, A.; Al Khafaji, H.; Wu, X.; et al. Multiomics-Identified Intervention to Restore Ethanol-Induced Dysregulated Proteostasis and Secondary Sarcopenia in Alcoholic Liver Disease. Cell. Physiol. Biochem. 2021, 55, 91–116. [Google Scholar] [CrossRef] [PubMed]
  28. Detsky, A.S.; McLaughlin, J.R.; Baker, J.P.; Johnston, N.; Whittaker, S.; Mendelson, R.A.; Jeejeebhoy, K.N. What is subjective global assessment of nutritional status? J. Parenter. Enter. Nutr. 1987, 11, 8–13. [Google Scholar] [CrossRef] [PubMed] [Green Version]
  29. Pugh, R.N.; Murray-Lyon, I.M.; Dawson, J.L.; Pietroni, M.C.; Williams, R. Transection of the oesophagus for bleeding oesophageal varices. Br. J. Surg. 1973, 60, 646–649. [Google Scholar] [CrossRef]
  30. Cholongitas, E.; Papatheodoridis, G.; Vangeli, M.; Terreni, N.; Patch, D.; Burroughs, A.K. Systematic review: The model for end-stage liver disease—should it replace Child-Pugh’s classification for assessing prognosis in cirrhosis? Aliment. Pharmacol. Ther. 2005, 22, 1079–1089. [Google Scholar] [CrossRef]
  31. Kamath, P.S.; Wiesner, R.H.; Malinchoc, M.; Kremers, W.; Therneau, T.M.; Kosberg, C.L.; d’Amico, G.; Dickson, F.R.; Kim, W.R. A model to predict survival in patients with end-stage liver disease. Hepatology 2001, 33, 464–470. [Google Scholar] [CrossRef]
  32. Csapó, J.; Albert, C.; Lóki, K.; Csapó-Kiss, Z. Separation and determination of the amino acids by ion exchange column chromatography applying postcolumn derivatization. Acta Univ. Sapientiae Aliment. 2008, 1, 5–29. [Google Scholar]
  33. Sharer, J.D.; de Biase, I.; Matern, D.; Young, S.; Bennett, M.J.; Tolun, A.A. Laboratory analysis of amino acids, 2018 revision: A technical standard of the American College of Medical Genetics and Genomics (ACMG). Genet. Med. 2018, 20, 1499–1507. [Google Scholar] [CrossRef] [Green Version]
  34. Fischer, J.; Yoshimura, N.; Aguirre, A.; James, J.; Cummings, M.; Aybel, R.; Deindoerfer, F. Plasma amino acids in patients with hepatic encephalopathy: Effects of amino acid infusions. Am. J. Surg. 1974, 127, 40–47. [Google Scholar] [CrossRef]
  35. Morgan, M.Y.; Marshall, A.W.; Milsom, J.P.; Sherlock, S. Plasma amino-acid patterns in liver disease. Gut 1982, 23, 362–370. [Google Scholar] [CrossRef] [PubMed] [Green Version]
  36. Gabr, S.A.; Alghadir, A.H.; Sherif, Y.E.; Ghfar, A.A. Hydroxyproline as a Biomarker in Liver Disease. In Biomarkers in Liver Disease; Predy, V.R., Ed.; Springer: Dordrecht, The Netherlands, 2016; pp. 1–21. [Google Scholar] [CrossRef]
  37. Jayakumar, A.; Norenberg, M.D. Hyperammonemia in Hepatic Encephalopathy. J. Clin. Exp. Hepatol. 2018, 8, 272–280. [Google Scholar] [CrossRef]
  38. Fischer, J.; Baldessarini, R. False neurotransmitters and hepatic failure. Lancet 1971, 298, 75–80. [Google Scholar] [CrossRef]
  39. Holeček, M.; Mráz, J.; Tilšer, I. Plasma amino acids in four models of experimental liver injury in rats. Amino Acids 1996, 10, 229–241. [Google Scholar] [CrossRef] [PubMed]
  40. Avila, M.; Berasain, C.; Torres, L.; Martín-Duce, A.; Corrales, F.J.; Yang, H.; Prieto, J.; Lu, S.C.; Caballería, J.; Rodés, J.; et al. Reduced mRNA abundance of the main enzymes involved in methionine metabolism in human liver cirrhosis and hepatocellular carcinoma. J. Hepatol. 2000, 33, 907–914. [Google Scholar] [CrossRef] [Green Version]
  41. Mattson, M.P.; Shea, T.B. Folate and homocysteine metabolism in neural plasticity and neurodegenerative disor-ders. Trends Neurosci. 2003, 26, 137–146. [Google Scholar] [CrossRef]
  42. Koretz, R.L.; Avenell, A.; O Lipman, T. Nutritional support for liver disease. Cochrane Database Syst. Rev. 2012, 5, CD008344. [Google Scholar] [CrossRef] [PubMed]
  43. Gluud, L.L.; Dam, G.; Les, I.; Marchesini, G.; Borre, M.; Aagaard, N.K.; Vilstrup, H. Branched-chain amino acids for people with hepatic encephalopathy. Cochrane Database Syst. Rev. 2017, 5, CD001939. [Google Scholar] [CrossRef] [PubMed]
  44. Dam, G.; Keiding, S.; Munk, O.L.; Ott, P.; Buhl, M.; Vilstrup, H.; Bak, L.K.; Waagepetersen, H.S.; Schousboe, A.; Moller, N.; et al. Branched-chain amino acids increase arterial blood ammonia in spite of enhanced intrinsic muscle ammonia metabolism in patients with cirrhosis and healthy subjects. Am. J. Physiol. Liver Physiol. 2011, 301, G269–G277. [Google Scholar] [CrossRef] [PubMed] [Green Version]
  45. Zanchi, N.E.; Gerlinger-Romero, F.; Guimarães-Ferreira, L.; Filho, M.A.D.S.; Felitti, V.; Lira, F.S.; Seelaender, M.; Lancha, A.H. HMB supplementation: Clinical and athletic performance-related effects and mechanisms of action. Amino Acids 2010, 40, 1015–1025. [Google Scholar] [CrossRef] [PubMed]
  46. Silva, V.R.; Belozo, F.L.; Micheletti, T.O.; Conrado, M.; Stout, J.R.; Pimentel, G.D.; Gonzalez, A.M. β-hydroxy-β-methylbutyrate free acid supplementation may improve recovery and muscle adaptations after resistance training: A systematic review. Nutr. Res. 2017, 45, 1–9. [Google Scholar] [CrossRef] [Green Version]
  47. Sanchez-Martinez, J.; Santos-Lozano, A.; Garcia-Hermoso, A.; Sadarangani, K.P.; Cristi-Montero, C. Effects of beta-hydroxy-beta-methylbutyrate supplementation on strength and body composition in trained and competitive athletes: A meta-analysis of randomized controlled trials. J. Sci. Med. Sport 2018, 21, 727–735. [Google Scholar] [CrossRef]
  48. Gepner, Y.; Varanoske, A.N.; Boffey, D.; Hoffman, J.R. Benefits of β-hydroxy-β-methylbutyrate supplementation in trained and untrained individuals. Res. Sports Med. 2018, 27, 204–218. [Google Scholar] [CrossRef]
  49. Wu, H.; Xia, Y.; Jiang, J.; Du, H.; Guo, X.; Liu, X.; Li, C.; Huang, G.; Niu, K. Effect of beta-hydroxy-beta-methylbutyrate supplementation on muscle loss in older adults: A systematic review and meta-analysis. Arch. Gerontol. Geriatr. 2015, 61, 168–175. [Google Scholar] [CrossRef]
  50. Oktaviana, J.; Zanker, J.; Vogrin, S.; Duque, G. The Effect of β-Hydroxy-β-Methylbutyrate (HMB) on Sarcopenia and Functional Frailty in Older Persons: A Systematic Review. J. Nutr. Health Aging 2018, 23, 145–150. [Google Scholar] [CrossRef]
  51. Holecek, M.; Muthny, T.; Kovarik, M.; Sispera, L. Effect of beta-hydroxy-beta-methylbutyrate (HMB) on protein metabolism in whole body and in selected tissues. Food Chem. Toxicol. 2009, 47, 255–259. [Google Scholar] [CrossRef]
  52. Madeira, C.; Alheira, F.V.; Calcia, M.; Silva, T.C.S.; Tannos, F.M.; Vargas-Lopes, C.; Fisher, M.; Goldenstein, N.; Brasil, M.A.; Vinogradov, S.; et al. Blood Levels of Glutamate and Glutamine in Recent Onset and Chronic Schizophrenia. Front. Psychiatry 2018, 9, 713. [Google Scholar] [CrossRef] [PubMed]
  53. Cavallucci, V.; Pani, G. The Leucine Catabolite and Dietary Supplement β-Hydroxy-β-Methyl Butyrate (HMB) as an Epigenetic Regulator in Muscle Progenitor Cells. Metabolites 2021, 11, 512. [Google Scholar] [CrossRef] [PubMed]
Figure 1. Principal Component Analysis (PCA). Scree plot with the proportion of information retained by each principal component (A). Biplot of individuals (B). The most contributing variables to the principal component 1 (C) and principal component 2 (D). The red dashed line indicates the expected average contribution.
Nutrients 13 03764 g001
Figure 2. Plasma amino acid variations during follow-up in all cirrhotic patients according to treatments. HMB: HMB group, HP: High Protein groups. BCAA: branched chain amino acids. Each point represents a single subject. Boxes are drawn from Q1 to Q3 with a horizontal line drawn in the middle to denote the median.
Nutrients 13 03764 g002
Table 1. Plasma amino acid concentration in patients with cirrhosis compared to healthy controls.
CirrhosisHealthyp
n = 43n = 31
Sex (men/women)27 (62%)/16 (38%)15 (48%)/16 (52%)0.362
Age (years)64.4 [55.3;68.6]57.0 [47.5;66.5]0.054
Amino acid (µM)
phospho-Ser3.10 [2.16;4.44]12.2 [8.75;16.9]<0.001
Taurine64.1 [52.7;83.7]39.8 [35.4;55.5]<0.001
Asp27.2 [21.9;37.0]1.75 [1.27;2.51]<0.001
Thr132 [105;172]120 [110;147]0.429
Ser151 [125;177]92.0 [78.4;102]<0.001
Asn74.6 [58.3;83.2]100 [77.9;112]<0.001
Glu156 [120;221]30.3 [20.1;50.1]<0.001
Gln317 [249;393]631 [557;685]<0.001
Aminoadipic acid3.67 [3.14;4.54]0.73 [0.00;2.85]<0.001
Gly276 [228;322]195 [169;221]<0.001
Ala305 [246;391]333 [288;378]0.354
Citrulline42.3 [30.7;50.8]36.2 [31.1;50.1]0.629
Aminobutyric acid15.2 [11.6;19.4]14.7 [9.99;18.7]0.600
Val166 [128;221]202 [190;255]0.010
Cystine1.77 [0.71;4.92]46.2 [33.3;58.2]<0.001
Met34.1 [25.9;42.6]17.2 [13.9;21.9]<0.001
Ile54.1 [47.2;66.5]47.8 [40.1;59.5]0.072
Leu103 [83.6;123]103 [89.3;121]0.899
Tyr104 [75.6;129]56.4 [47.6;65.3]<0.001
β-Ala2.73 [1.25;4.34]0.00 [0.00;0.00]<0.001
Phe89.7 [72.1;104]44.7 [41.0;50.7]<0.001
Ethanolamine18.5 [13.9;23.4]0.00 [0.00;0.00]<0.001
Ornithine93.0 [74.0;120]77.6 [69.0;87.3]0.009
Lys163 [123;187]173 [155;190]0.159
1-Methylhistidine11.9 [8.04;25.3]10.3 [5.24;15.4]0.060
His89.3 [74.0;97.3]57.6 [47.3;63.6]<0.001
Trp42.7 [30.4;52.8]30.4 [25.0;37.7]0.015
3-Methylhistidine5.58 [3.94;8.07]1.37 [0.00;3.40]<0.001
Arg120 [102;151]54.1 [40.6;69.3]<0.001
Hyp16.4 [10.8;22.9]9.87 [2.46;15.6]0.021
Pro205 [161;259]174 [136;216]0.092
Data are number (%) or median [interquartile range]. Bold in the column with p-values is to highlight statistical significance.
Table 2. Demographics and baseline characteristics.
HMB Group (n = 22)HP Group (n = 21)p
Age (Years)60.4 ± 8.6161.4 ± 9.270.711
Sex (men/women)14 (64%)/8 (36%)13 (62%)/8 (38%)1.000
Etiology n (%)
Alcohol17 (77.3%)11 (52.4%)0.624
HCV2 (9.09%)3 (14.3%)
MAFLD1 (4.55%)3 (14.3%)
Others2 (9.09%)4 (19%)
Active alcoholism4 (18.1%)4 (19%)0.683
Ascites12 (54.5%)9 (42.9%)0.645
Refractory ascites4 (18.3%)0 (0%)0.108
TIPS1 (4.55%)1 (4.76%)1.000
Previous encephalopathy2 (9.09%)3 (14.3%)0.664
MHE (PHES) *8 (36.4%)4 (19%)0.355
Child-Pugh 0.398
Class A9 (40.9%)10 (47.6%)
Class B11 (50%)11 (52.3%)
Class C2 (9.09%)0 (0%)
MELD12.7 ± 5.3113 ± 4.70.835
SGA 0.355
Class B14 (63.6%)17 (81.0%)
Class C8 (36.4%)4 (19.0%)
Ammonia (µM)56.0 [40.0;83.0]54.0 [39.8;78.0]0.923
Data are number (%), mean ±SD or median [IQR]. HCV: Hepatitis C Virus, MAFLD: Metabolic Associated Fatty Liver Disease, TIPS: Transjugular intrahepatic portosystemic shunt, MHE: Minimal Hepatic Encephalopathy, PHES: Psychometric Hepatic Encephalopathy Score, MELD: Model for End stage Liver Disease, SGA: Subjective Global Assessment. * Diagnosis of MHE by PHES.
Table 3. Amino acid and ammonia levels for all subjects during follow-up according to treatment group.
Plasma Amino Acid (µM)HMB GroupHP Groupplongplong*treatment
Baseline6 wk.12 wk.Baseline6 wk.12 wk.
Leu92.4 [76.7;117]120 [105;132]117 [105;130]117 [95.5;137]116 [102;134]118 [93.9;140]0.010.035
Ile53.3 [47.7;59.9]63.1 [56.7;72.8]61.9 [52.8;70.9]62.6 [49.6;71.9]57.9 [50.2;66.2]56.3 [49.3;75.5]0.5320.084
Val144 [109;191]199 [180;245]194 [161;210]191 [160;253]220 [173;244]215 [167;237]0.0040.055
BCAA300 [244;361]382 [348;428]376 [320;404]370 [297;462]385 [325;425]380 [306;456]0.0120.046
Phe81.5 [72.8;94.2]118 [81,4;128]111 [96.6;118]102 [78.2;122]115 [86.9;129]102 [92.6;119]0.0010.057
Tyr101 [73.1;129]119 [74.0;150]118 [80.5;137]104 [91.5;130]131 [110;158]106 [98.3;119]0.0010.408
Trp35.6 [30.8;45.6]47.7 [39.4;59.6]48.2 [34.2;61.8]51.3 [33.2;67.2]59.1 [46.4;62.2]56.7 [40.8;64.8]0.0120.066
AAA234 [188;265]264 [196;342]284 [226;310]270 [190;324]316 [229;344]266 [247;304]0.0030.103
Fischer´s ratio1.59 [1.32;2.43]1.58 [1.37;2.11]1.70 [1.39;2.29]1.80 [1.43;2.21]1.57 [1.25;1.84]1.64 [1.39;2.03]0.0130.586
Glu134 [118;184]223 [170;302]180 [142;235]182 [151;269]190 [118;252]212 [178;249]0.2140.164
Gln317 [224;390]284 [227;348]322 [215;344]308 [262;372]315 [264;400]332 [275;381]0.9320.862
Gln/Glu ratio2.16 [1.15;3.32]1.78 [0.72;2.24]1.69 [1.31;2.46]1.63 [1.10;2.79]2.07 [1.17;2.64]1.52 [1.24;2.18]0.310.272
Ala267 [216;340]371 [268;464]360 [332;427]331 [283;442]392 [332;476]391 [302;428]0.0040.093
Ammonia (µM)56.0 [40.0;83.0]59.0 [50.5;85.2]67.0 [49.8;74.8]54.0 [39.8;78.0]62.0 [53.2;87.2]67.0 [55.5;75.5]0.110.689
Data are number median [IQR]. Wk.: weeks. BCAA: sum of Leu, Ile & Val. AAA: sum of Phe, Tyr, Trp. plong: p-value for the variation over time for the entire cohort. plong*treatment: p-value for treatment-specific longitudinal changes. Bold in the column with p-values is to highlight statistical significance.
Table 4. Association between plasma amino acid levels and minimal hepatic encephalopathy in all cirrhotic patients (MHE).
Plasma Amino Acid Concentration (µM)MHE − n = 82MHE + n = 26p
Phospho-Ser3.37 [2.46;4.33]2.37 [1.83;3.93]0.061
Taurine76.0 [57.0;94.2]56.6 [44.1;66.9]0.004
Asp36.2 [28.3;43.0]20.2 [14.4;26.5]<0.001
Thr143 [117;175]135 [119;174]0.882
Ser167 [146;184]128 [103;160]<0.001
Asn73.6 [64.3;84.8]78.0 [64.1;90.5]0.402
Glu209 [161;270]135 [95.5;177]<0.001
Gln319 [242;382]309 [287;419]0.722
Aminoadipic acid3.96 [2.98;4.77]3.28 [2.65;4.09]0.150
Gly299 [266;331]261 [230;283]0.002
Ala377 [311;468]267 [246;353]<0.001
Citrulline44.7 [37.3;53.8]47.3 [39.0;58.4]0.327
Aminobutyric acid15.5 [12.4;20.4]14.7 [8.06;17.5]0.121
Val202 [171;246]146 [114;181]<0.001
Cystine1.23 [0.00;3.38]1.52 [0.71;4.95]0.267
Met36.1 [27.5;47.6]37.5 [28.9;40.7]0.840
Ile62.1 [52.6;73.6]48.5 [44.1;59.9]0.001
Leu118 [103;139]91.2 [68.0;104]<0.001
Tyr113 [87.8;138]112 [91.5;141]0.735
β-Ala3.85 [0.89;5.94]3.62 [1.21;5.00]0.622
Phe105 [88.9;125]86.7 [76.7;113]0.045
Ethanolamine17.2 [13.8;21.2]20.8 [16.7;28.5]0.121
Ornithine105 [84.6;131]98.1 [81.8;109]0.241
Lys179 [140;201]147 [133;182]0.098
1-Methylhistidine12.4 [8.19;23.0]11.6 [6.24;22.9]0.482
His89.0 [77.8;99.0]87.1 [76.2;92.6]0.216
Trp51.9 [38.2;63.4]45.4 [27.3;56.9]0.089
3-Methylhistidine7.00 [4.31;11.5]6.86 [5.14;9.01]0.758
Arg133 [114;151]113 [85.3;144]0.032
Hyp17.2 [10.5;23.2]16.8 [13.4;24.8]0.639
Pro232 [178;278]239 [174;329]0.591
BCAA383 [325;457]289 [220;336]<0.001
AAA269 [220;320]237 [193;297]0.211
Fischer ratio1.80 [1.38;2.42]1.45 [1.18;1.60]0.001
Gln/Glu ratio1.72 [1.11;2.19]2.38 [1.48;3.93]0.022
Data are number (%) or median [interquartile range]. MHE: minimal hepatic encephalopathy. −: absent, +: present. BCAA: branched chain amino acids, AAA: aromatic amino acids. Bold in the column with p-values is to highlight statistical significance.
Publisher’s Note: MDPI stays neutral with regard to jurisdictional claims in published maps and institutional affiliations.

