
Dietary Intake of Folate and Assessment of the Folate Deficiency Prevalence in Slovenia Using Serum Biomarkers

 ,
,  ,
,  , , ,
, , ,  , ,
, ,  and
and
Abstract
:1. Introduction
2. Material and Methods
2.1. Study Design and Subjects
2.2. SI.Menu Study Data Collection and Analyses
2.3. Assessment of Dietary Folate Intake
2.4. Serum Folate and Homocysteine Concentration
2.5. Data Analyses
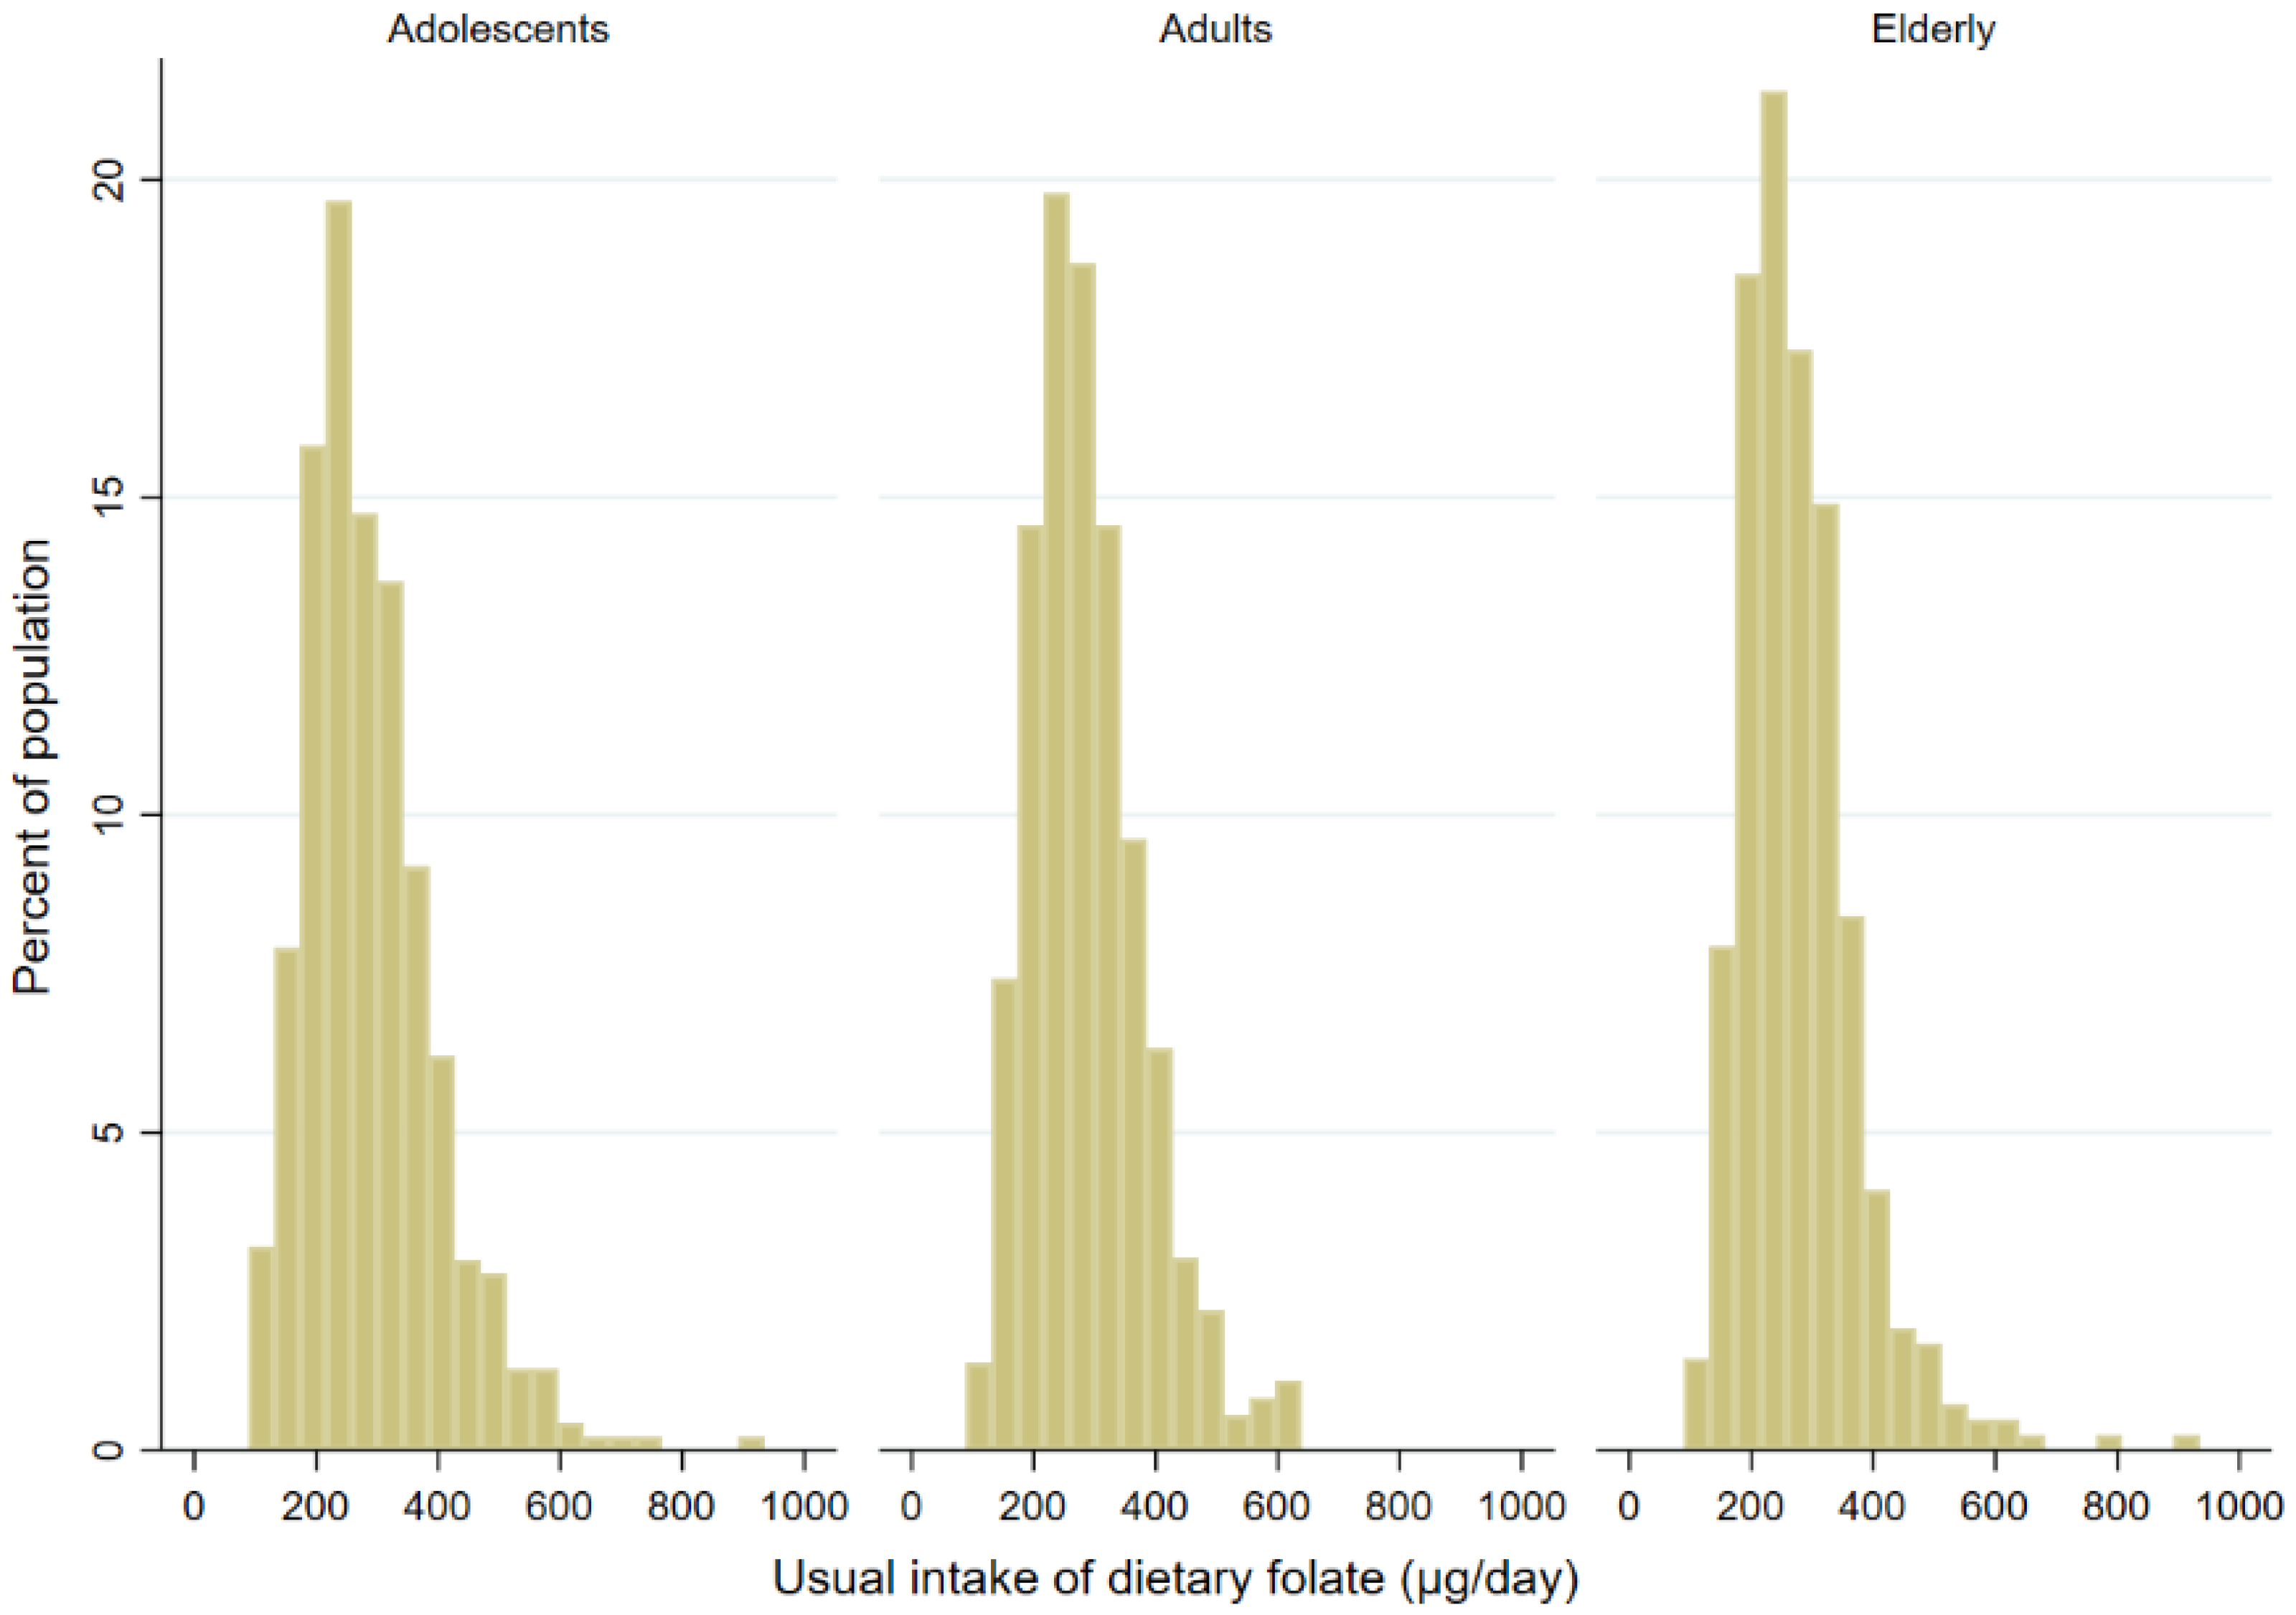
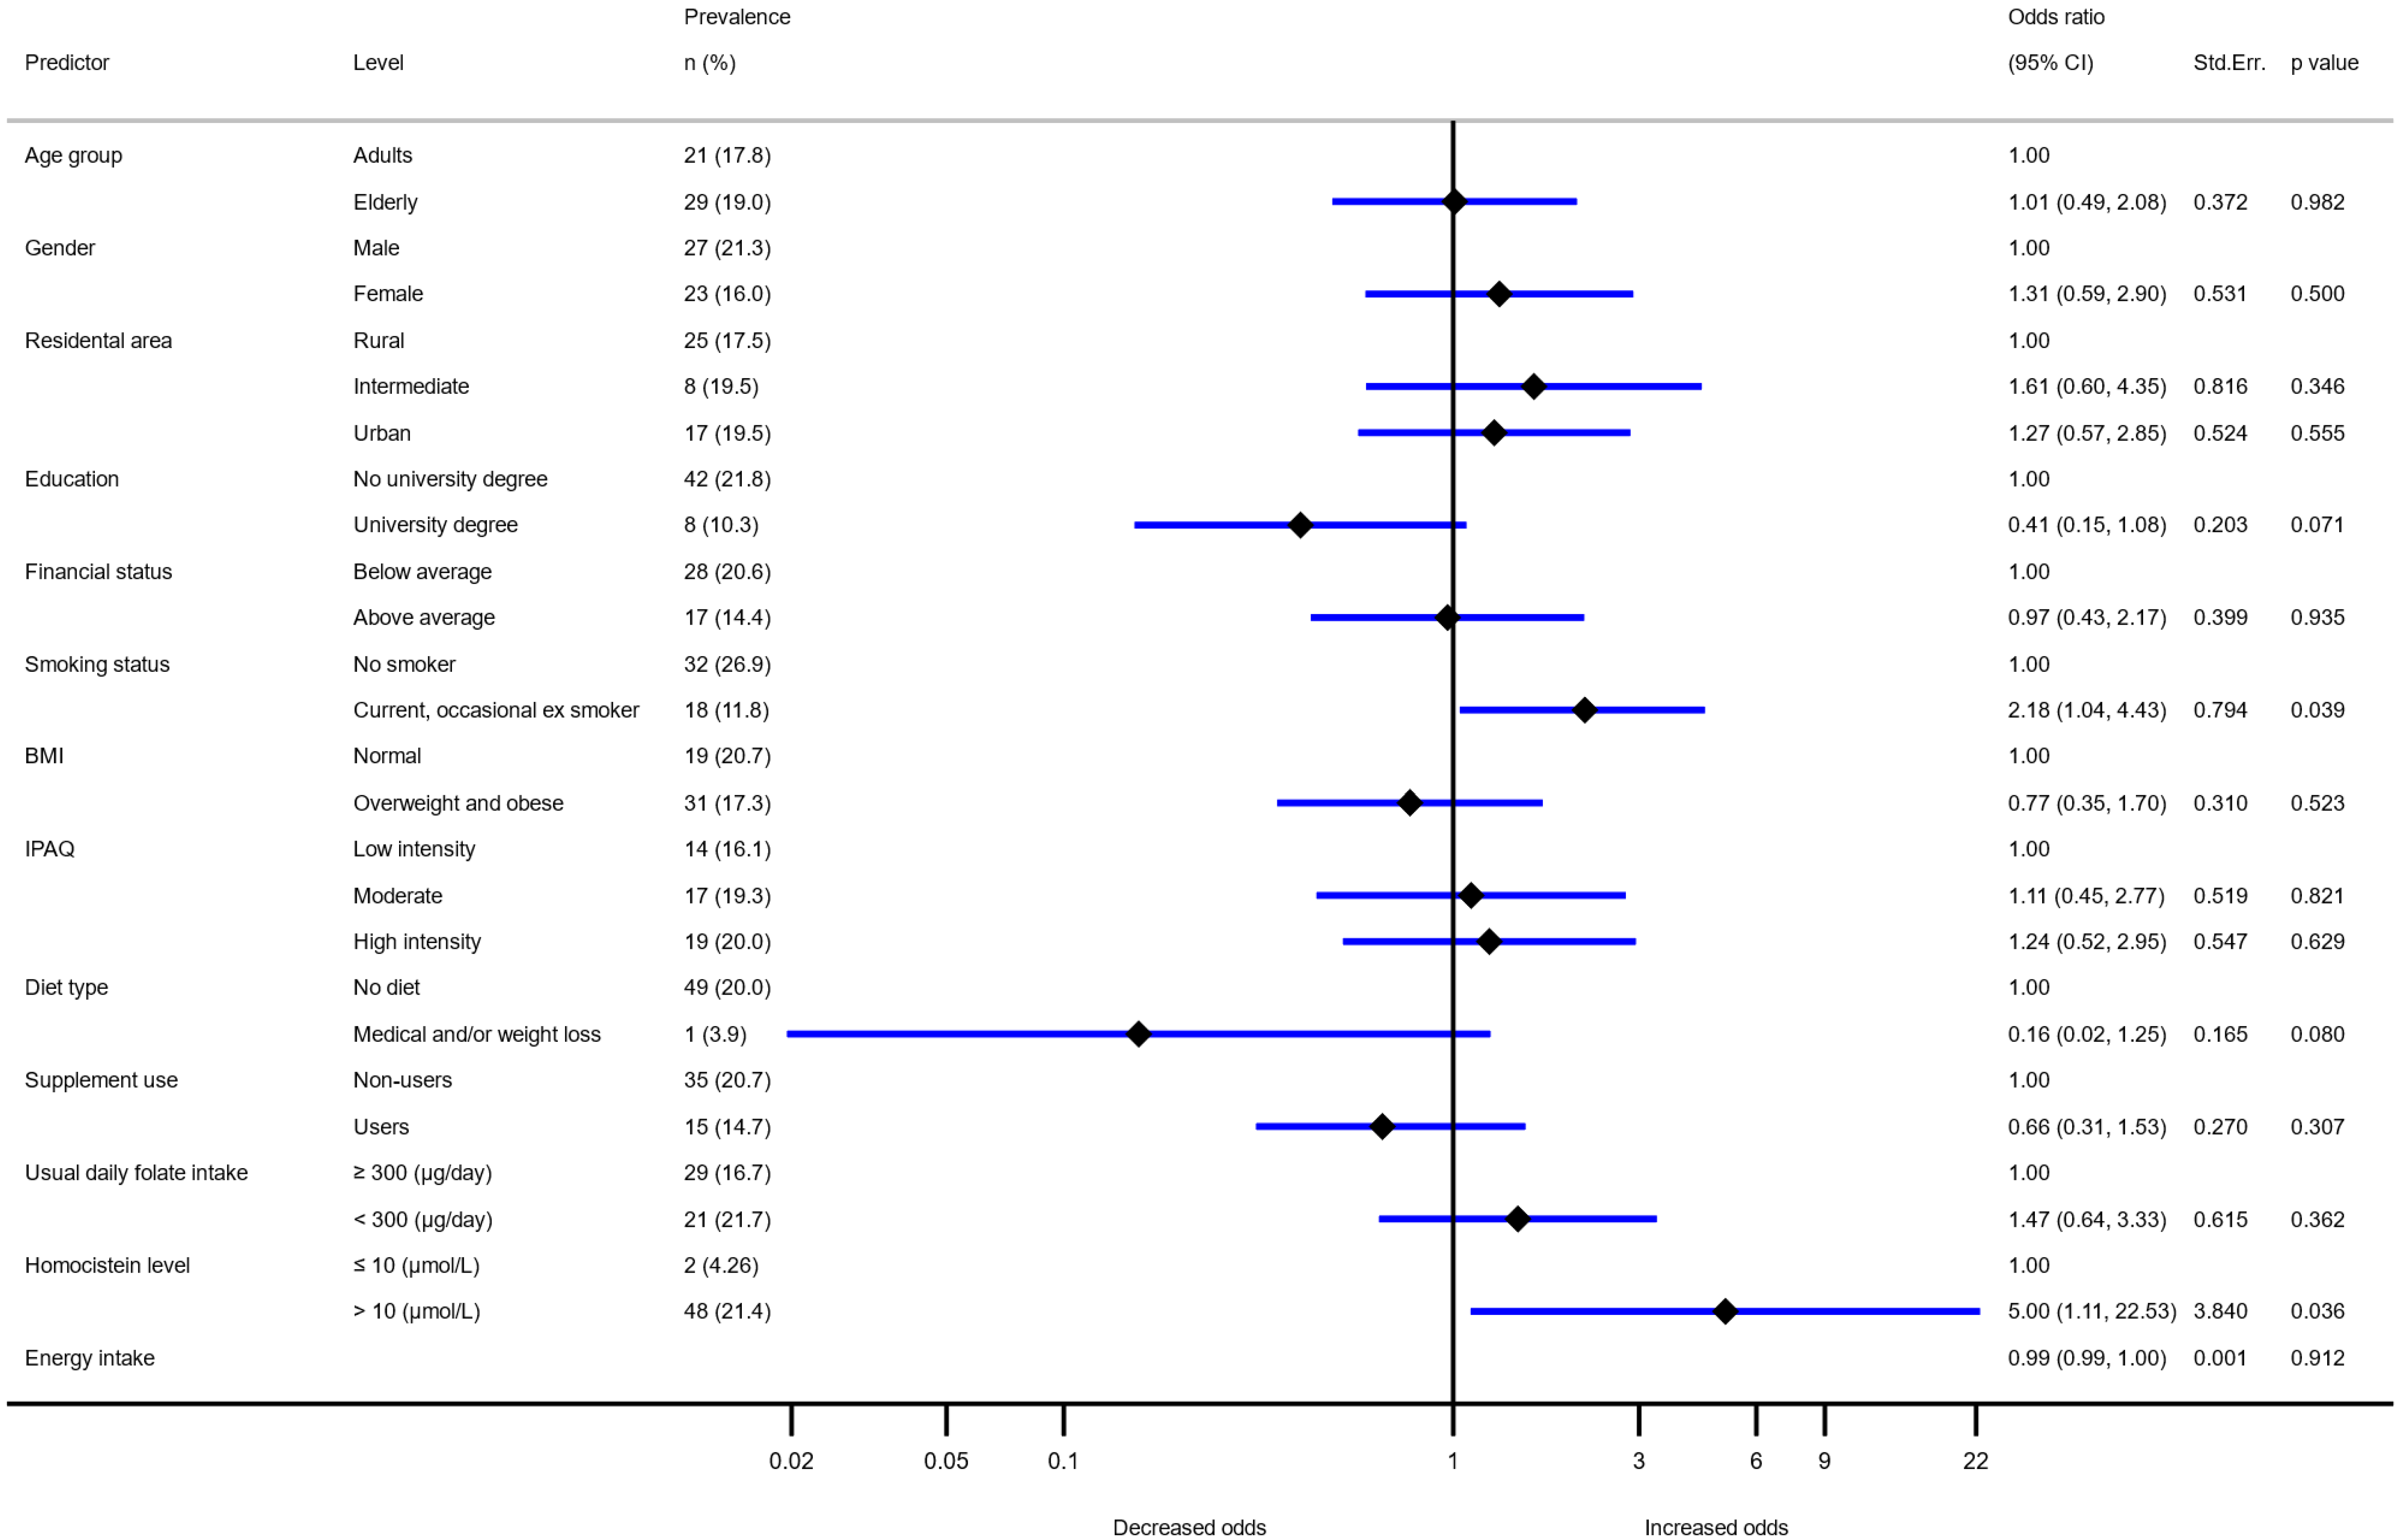
3. Results
4. Discussion
5. Conclusions
Supplementary Materials
Author Contributions
Funding
Institutional Review Board Statement
Informed Consent Statement
Data Availability Statement
Acknowledgments
Conflicts of Interest
References
- Duthie, S.J.; Narayanan, S.; Brand, G.M.; Pirie, L.; Grant, G. Impact of Folate Deficiency on DNA Stability. J. Nutr. 2002, 132, 2444S–2449S. [Google Scholar] [CrossRef]
- Mahmood Al-Sammak, N.; Ibrahim, H. Trends of under-five mortality in Nineveh (2004–2013): A time series analysis. J. Health Res. Rev. 2014, 1, 5–9. [Google Scholar] [CrossRef]
- Greenberg, J.A.; Bell, S.J.; Guan, Y.; Yu, Y.H. Folic Acid supplementation and pregnancy: More than just neural tube defect prevention. Rev. Obstet. Gynecol. 2011, 4, 52–59. [Google Scholar]
- Molloy, A.M.; Kirke, P.N.; Brody, L.C.; Scott, J.M.; Mills, J.L. Effects of folate and vitamin B12 deficiencies during pregnancy on fetal, infant, and child development. Food Nutr. Bull. 2008, 29, S101–S111. [Google Scholar] [CrossRef]
- Eichholzer, M.; Tönz, O.; Zimmermann, R. Folic acid: A public-health challenge. Lancet 2006, 367, 1352–1361. [Google Scholar] [CrossRef]
- Allen, L.H. Causes of vitamin B12 and folate deficiency. Food Nutr. Bull. 2008, 29, S20–S34. [Google Scholar] [CrossRef] [Green Version]
- Crider, K.S.; Zhu, J.-H.; Hao, L.; Yang, Q.-H.; Yang, T.P.; Gindler, J.; Maneval, D.R.; Quinlivan, E.P.; Li, Z.; Bailey, L.B.; et al. MTHFR 677C→T genotype is associated with folate and homocysteine concentrations in a large, population-based, double-blind trial of folic acid supplementation. Am. J. Clin. Nutr. 2011, 93, 1365–1372. [Google Scholar] [CrossRef] [Green Version]
- Calvert, H. Folate status and the safety profile of antifolates. Semin. Oncol. 2002, 29, 3–7. [Google Scholar] [CrossRef]
- Sauberlich, H.E.; Kretsch, M.J.; Skala, J.H.; Johnson, H.L.; Taylor, P.C. Folate requirement and metabolism in nonpregnant women. Am. J. Clin. Nutr. 1987, 46, 1016–1028. [Google Scholar] [CrossRef]
- Tamura, T. Determination of food folate. J. Nutr. Biochem. 1998, 9, 285–293. [Google Scholar] [CrossRef]
- McKillop, D.J.; Pentieva, K.; Daly, D.; McPartlin, J.M.; Hughes, J.; Strain, J.; Scott, J.M.; McNulty, H. The effect of different cooking methods on folate retention in various foods that are amongst the major contributors to folate intake in the UK diet. Br. J. Nutr. 2002, 88, 681–688. [Google Scholar] [CrossRef] [Green Version]
- Castenmiller, J.J.; van de Poll, C.J.; West, C.E.; Brouwer, I.A.; Thomas, C.M.; van Dusseldorp, M. Bioavailability of folate from processed spinach in humans. Effect of food matrix and interaction with carotenoids. Ann. Nutr. Metab. 2000, 44, 163–169. [Google Scholar] [CrossRef]
- Malin, J. Total folate activity in Brussels sprouts: The effects of storage, processing, cooking and ascorbic acid content. Int. J. Food Sci. Technol. 1977, 12, 623–632. [Google Scholar] [CrossRef]
- EC. Community Register on the Addition of Vitamins and Minerals and of Certain Other Substances to Foods. Available online: https://ec.europa.eu/food/system/files/2021-01/labelling_nutrition-vitamins_minerals-comm_reg_en.pdf (accessed on 31 August 2021).
- EC. Directive 2002/46/EC on the Approximation of the Laws of the Member States Relating to Food Supplements. Available online: https://eur-lex.europa.eu/legal-content/EN/TXT/?uri=CELEX:32002L0046 (accessed on 15 February 2021).
- Gregory, J.F., III. Case Study: Folate Bioavailability. J. Nutr. 2001, 131, 1376S–1382S. [Google Scholar] [CrossRef]
- Bailey, L.B.; Stover, P.J.; McNulty, H.; Fenech, M.F.; Gregory, J.F., III.; Mills, J.L.; Pfeiffer, C.M.; Fazili, Z.; Zhang, M.; Ueland, P.M.; et al. Biomarkers of Nutrition for Development—Folate Review. J. Nutr. 2015, 145, 1636S–1680S. [Google Scholar] [CrossRef] [Green Version]
- Sobczyńska-Malefora, A.; Harrington, D.J. Laboratory assessment of folate (vitamin B9) status. J. Clin. Pathol. 2018, 71, 949. [Google Scholar] [CrossRef]
- WHO. Serum and Red Blood Cell Folate Concentrations for Assessing Folate Status in Populations. Available online: http://apps.who.int/iris/bitstream/handle/10665/75584/WHO_NMH_NHD_EPG_12.1_eng.pdf (accessed on 31 August 2021).
- Ueland, P.M.; Refsum, H.; Stabler, S.P.; Malinow, M.R.; Andersson, A.; Allen, R.H. Total homocysteine in plasma or serum: Methods and clinical applications. Clin. Chem. 1993, 39, 1764–1779. [Google Scholar] [CrossRef]
- Green, R. Indicators for assessing folate and vitamin B-12 status and for monitoring the efficacy of intervention strategies. Am. J. Clin. Nutr. 2011, 94, 666s–672s. [Google Scholar] [CrossRef] [PubMed] [Green Version]
- Refsum, H.; Ueland, P.; Nygård, O.; Vollset, S. Homocysteine and cardiovascular disease. Annu. Rev. Med. 1998, 49, 31–62. [Google Scholar] [CrossRef]
- Woo, K.S.; Chook, P.; Lolin, Y.I.; Cheung, A.S.; Chan, L.T.; Sun, Y.Y.; Sanderson, J.E.; Metreweli, C.; Celermajer, D.S. Hyperhomocyst(e)inemia is a risk factor for arterial endothelial dysfunction in humans. Circulation 1997, 96, 2542–2544. [Google Scholar] [CrossRef] [Green Version]
- Welch, G.N.; Loscalzo, J. Homocysteine and atherothrombosis. N. Engl. J. Med. 1998, 338, 1042–1050. [Google Scholar] [CrossRef] [PubMed]
- Leeming, R.J.; Pollock, A.; Melville, L.J.; Hamon, C.G.B. Measurement of 5-methyltetrahydrofolic acid in man by high-performance liquid chromatography. Metabolism 1990, 39, 902–904. [Google Scholar] [CrossRef]
- IOM Dietary Reference Intakes for Thiamin, Riboflavin, Niacin, Vitamin B6, Folate, Vitamin B12, Pantothenic Acid, Biotin, and Choline. Available online: https://www.ncbi.nlm.nih.gov/books/NBK114318/ (accessed on 31 August 2021).
- WHO. Vitamin and Mineral Requirements in Human Nutrition. Available online: https://apps.who.int/iris/bitstream/handle/10665/42716/9241546123.pdf (accessed on 31 August 2021).
- EFSA Panel on Dietetic Products, N. Allergies. Scientific opinion on dietary reference values for folate. EFSA J. 2014, 12, 3893. [Google Scholar]
- NIJZ. Referenčne Vrednosti za Energijski Vnos ter Vnos Hranil. Available online: https://www.nijz.si/sites/www.nijz.si/files/uploaded/referencne_vrednosti_za_energijski_vnos_ter_vnos_hranil_obl.pdf (accessed on 31 August 2021).
- Krawinkel, M.B.; Strohm, D.; Weissenborn, A.; Watzl, B.; Eichholzer, M.; Bärlocher, K.; Elmadfa, I.; Leschik-Bonnet, E.; Heseker, H. Revised D-A-CH intake recommendations for folate: How much is needed? Eur. J. Clin. Nutr. 2014, 68, 719–723. [Google Scholar] [CrossRef]
- D-A-CH. Reference Values DACH. Available online: https://www.sge-ssn.ch/grundlagen/lebensmittel-und-naehrstoffe/naehrstoffempfehlungen/dachreferenzwerte/ (accessed on 31 August 2021).
- Fidler Mis, N.; Kobe, H.; Stimec, M. Dietary Intake of Macro- and Micronutrients in Slovenian Adolescents: Comparison with Reference Values. Ann. Nutr. Metab. 2012, 61, 305–313. [Google Scholar] [CrossRef]
- Mijatov, M.A.; Mičetić-Turk, D. Dietary Intake In Adult Female Coeliac Disease Patients In Slovenia: Prehranski Vnos Odraslih Bolnic S Celiakijo V Sloveniji. Zdr. Varst. 2016, 55, 86–93. [Google Scholar]
- Rippin, H.L.; Hutchinson, J.; Jewell, J.; Breda, J.J.; Cade, J.E. Adult nutrient intakes from current national dietary surveys of European populations. Nutrients 2017, 9, 1288. [Google Scholar] [CrossRef] [Green Version]
- Crider, K.S.; Bailey, L.B.; Berry, R.J. Folic acid food fortification-its history, effect, concerns, and future directions. Nutrients 2011, 3, 370. [Google Scholar] [CrossRef] [Green Version]
- Choumenkovitch, S.F.; Selhub, J.; Wilson, P.W.F.; Rader, J.I.; Rosenberg, I.H.; Jacques, P.F. Folic Acid Intake from Fortification in United States Exceeds Predictions. J. Nutr. 2002, 132, 2792–2798. [Google Scholar] [CrossRef]
- Smith, A.D.; Kim, Y.-I.; Refsum, H. Is folic acid good for everyone? Am. J. Clin. Nutr. 2008, 87, 517–533. [Google Scholar] [CrossRef] [Green Version]
- Žmitek, K.; Krušič, S.; Pravst, I. An Approach to Investigate Content-Related Quality of Nutraceuticals Used by Slovenian Consumers: A Case Study with Folate and Vitamin D Supplements. Foods 2021, 10, 845. [Google Scholar] [CrossRef]
- Ubbink, J.B. Should all elderly people receive folate supplements? Drugs Aging. 1998, 13, 415–420. [Google Scholar] [CrossRef]
- Hooshmand, B.; Solomon, A.; Kåreholt, I.; Rusanen, M.; Hänninen, T.; Leiviskä, J.; Winblad, B.; Laatikainen, T.; Soininen, H.; Kivipelto, M. Associations between serum homocysteine, holotranscobalamin, folate and cognition in the elderly: A longitudinal study. J. Intern. Med. 2012, 271, 204–212. [Google Scholar] [CrossRef] [PubMed]
- König, D.; Bissé, E.; Deibert, P.; Müller, H.M.; Wieland, H.; Berg, A. Influence of Training Volume and Acute Physical Exercise on the Homocysteine Levels in Endurance-Trained Men: Interactions with Plasma Folate and Vitamin B12. Ann. Nutr. Metab. 2003, 47, 114–118. [Google Scholar] [CrossRef] [PubMed]
- EC. Regulation (EC) No 1925/2006 of the European Parliament and of the Council of 20 December 2006 on the Addition of Vitamins and Minerals and of Certain Other Substances to Foods. Available online: https://eur-lex.europa.eu/legal-content/EN/AUTO/?uri=CELEX:02006R1925-20210408 (accessed on 31 August 2021).
- Pravst, I.; Kušar, A. Consumers’ exposure to nutrition and health claims on pre-packed foods: Use of sales weighting for assessing the food supply in Slovenia. Nutrients 2015, 7, 9353–9368. [Google Scholar] [CrossRef] [Green Version]
- Authority, E.F.S. Guidance on the EU Menu methodology. EFSA J. 2014, 12, 39–44. [Google Scholar]
- Zupanič, N.; Hribar, M.; Hristov, H.; Lavriša, Ž.; Kušar, A.; Gregorič, M.; Blaznik, U.; Koroušić Seljak, B.; Golja, P.; Vidrih, R.; et al. Dietary Intake of trans Fatty Acids in the Slovenian Population. Nutrients 2021, 13, 207. [Google Scholar] [CrossRef]
- Zupanič, N.; Hristov, H.; Gregorič, M.; Blaznik, U.; Delfar, N.; Koroušić Seljak, B.; Ding, E.L.; Fidler Mis, N.; Pravst, I. Total and Free Sugars Consumption in a Slovenian Population Representative Sample. Nutrients 2020, 12, 17–29. [Google Scholar] [CrossRef]
- Hribar, M.; Hristov, H.; Gregorič, M.; Blaznik, U.; Zaletel, K.; Oblak, A.; Osredkar, J.; Kušar, A.; Žmitek, K.; Rogelj, I.; et al. Nutrihealth Study: Seasonal Variation in Vitamin D Status Among the Slovenian Adult and Elderly Population. Nutrients 2020, 12, 1838. [Google Scholar] [CrossRef]
- Gregorič, M.; Blaznik, U.; Delfar, N.; Zaletel, M.; Lavtar, D.; Seljak, B.K.; Golja, P.; Kotnik, K.Z.; Pravst, I.; Mis, N.F. Slovenian national food consumption survey in adolescents, adults and elderly. EFSA Supporting Publ. 2019, 16. [Google Scholar] [CrossRef] [Green Version]
- De Onis, M.; Onyango, A.; Borghi, E.; Siyam, A.; Blössner, M.; Lutter, C. Worldwide implementation of the WHO child growth standards. Public Health Nutr. 2012, 15, 1603–1610. [Google Scholar] [CrossRef] [PubMed] [Green Version]
- Onis, M.d.; Onyango, A.W.; Borghi, E.; Siyam, A.; Nishida, C.; Siekmann, J. Development of a WHO growth reference for school-aged children and adolescents. Bull. World Health Organ. 2007, 85, 660–667. [Google Scholar] [CrossRef]
- Lee, P.H.; Macfarlane, D.J.; Lam, T.H.; Stewart, S.M. Validity of the international physical activity questionnaire short form (IPAQ-SF): A systematic review. Int. J. Behav. Nutr. Phys. Act. 2011, 8, 1–11. [Google Scholar] [CrossRef] [Green Version]
- Vede, T. Izdelava in validacija slikovnega gradiva za določanje vnosa živil. In Design and Validation of Food Picture Book; University of Ljubljana, Biotechnical Faculty: Ljubljana, Slovenia, 2016. [Google Scholar]
- Korošec, M.; Golob, T.; Bertoncelj, J.; Stibilj, V.; Seljak, B.K. The Slovenian food composition database. Food Chem. 2013, 140, 495–499. [Google Scholar] [CrossRef]
- Fineli. Finnish Food Composition Database. Available online: https://fineli.fi/fineli/en/index (accessed on 31 August 2021).
- Bodner-Montville, J.; Ahuja, J.K.; Ingwersen, L.A.; Haggerty, E.S.; Enns, C.W.; Perloff, B.P. USDA food and nutrient database for dietary studies: Released on the web. J. Food Compos. Anal. 2006, 19, S100–S107. [Google Scholar] [CrossRef]
- Dunford, E.; Webster, J.; Metzler, A.B.; Czernichow, S.; Ni Mhurchu, C.; Wolmarans, P.; Snowdon, W.; L’Abbe, M.; Li, N.; Maulik, P.K.; et al. International collaborative project to compare and monitor the nutritional composition of processed foods. Eur. J. Prev. Cardiol. 2012, 19, 1326–1332. [Google Scholar] [CrossRef] [PubMed]
- La’ulu, S.L.; Rawlins, M.L.; Pfeiffer, C.M.; Zhang, M.; Roberts, W.L. Performance Characteristics of Six Homocysteine Assays. Am. J. Clin. Pathol. 2008, 130, 969–975. [Google Scholar] [CrossRef] [PubMed]
- Harttig, U.; Haubrock, J.; Knüppel, S.; Boeing, H. The MSM program: Web-based statistics package for estimating usual dietary intake using the Multiple Source Method. Eur. J. Clin. Nutr. 2011, 65 (Suppl. 1), 87–91. [Google Scholar] [CrossRef] [PubMed] [Green Version]
- Hribar, M.; Hristov, H.; Lavriša, Ž.; Koroušić Seljak, B.; Gregorič, M.; Blaznik, U.; Žmitek, K.; Pravst, I. Vitamin D Intake in Slovenian Adolescents, Adults, and the Elderly Population. Nutrients 2021, 13, 3528. [Google Scholar] [CrossRef] [PubMed]
- Haubrock, J.; Nöthlings, U.; Volatier, J.-L.; Dekkers, A.; Ocké, M.; Harttig, U.; Illner, A.-K.; Knüppel, S.; Andersen, L.F.; Boeing, H.; et al. Estimating Usual Food Intake Distributions by Using the Multiple Source Method in the EPIC-Potsdam Calibration Study. J. Nutr. 2011, 141, 914–920. [Google Scholar] [CrossRef] [Green Version]
- Kolenikov, S. Calibrating Survey Data using Iterative Proportional Fitting (Raking). Stata J. 2014, 14, 22–59. [Google Scholar] [CrossRef] [Green Version]
- Quinlivan, E.P.; Gregory, J.F., III. Effect of food fortification on folic acid intake in the United States. Am. J. Clin. Nutr. 2003, 77, 221–225. [Google Scholar] [CrossRef] [PubMed]
- Rampersaud, G.C.; Kauwell, G.P.; Bailey, L.B. Folate: A key to optimizing health and reducing disease risk in the elderly. J. Am. Coll. Nutr. 2003, 22, 1–8. [Google Scholar] [CrossRef] [PubMed]
- Luchsinger, J.A.; Tang, M.-X.; Miller, J.; Green, R.; Mayeux, R. Relation of higher folate intake to lower risk of Alzheimer disease in the elderly. Arch. Neurol. 2007, 64, 86–92. [Google Scholar] [CrossRef] [Green Version]
- Smith, R.L. Evaluation of vitamin B12 and folate status in the nursing home. J. Am. Med Dir. Assoc. 2001, 2, 230–238. [Google Scholar] [CrossRef]
- Fioravanti, M.; Ferrario, E.; Massaia, M.; Cappa, G.; Rivolta, G.; Grossi, E.; Buckley, A. Low folate levels in the cognitive decline of elderly patients and the efficacy of folate as a treatment for improving memory deficits. Arch. Gerontol. Geriatr. 1997, 26, 1–13. [Google Scholar] [CrossRef]
- Dhonukshe-Rutten, R.; De Vries, J.; De Bree, A.; Van Der Put, N.; Van Staveren, W.; De Groot, L. Dietary intake and status of folate and vitamin B12 and their association with homocysteine and cardiovascular disease in European populations. Eur. J. Clin. Nutr. 2009, 63, 18–30. [Google Scholar] [CrossRef] [Green Version]
- de Bree, A.; Verschuren, W.M.; Blom, H.J.; Kromhout, D. Association between B vitamin intake and plasma homocysteine concentration in the general Dutch population aged 20–65 y. Am. J. Clin. Nutr. 2001, 73, 1027–1033. [Google Scholar] [CrossRef] [PubMed] [Green Version]
- O’Brien, M.M.; Kiely, M.; Harrington, K.E.; Robson, P.J.; Strain, J.J.; Flynn, A. The North/South Ireland Food Consumption Survey: Vitamin intakes in 18–64-year-old adults. Public Health Nutr. 2008, 4, 1069–1079. [Google Scholar] [CrossRef] [PubMed]
- Waśkiewicz, A.; Sygnowska, E.; Broda, G. Dietary intake of vitamins B 6, B 12 and folate in relation to homocysteine serum concentration in the adult Polish population-WOBASZ Project. Kardiol. Pol. (Pol. Heart J. ) 2010, 68, 275–282. [Google Scholar]
- Alfthan, G.; Laurinen, M.S.; Valsta, L.M.; Pastinen, T.; Aro, A. Folate intake, plasma folate and homocysteine status in a random Finnish population. Eur. J. Clin. Nutr. 2003, 57, 81–88. [Google Scholar] [CrossRef] [PubMed] [Green Version]
- Schröder, H.; Marrugat, J.; Covas, M.; Elosua, R.; Pena, A.; Weinbrenner, T.; Fito, M.; Vidal, M.; Masia, R. Population dietary habits and physical activity modification with age. Eur. J. Clin. Nutr. 2004, 58, 302–311. [Google Scholar] [CrossRef] [Green Version]
- Tucker, K.L.; Selhub, J.; Wilson, P.W.; Rosenberg, I.H. Dietary intake pattern relates to plasma folate and homocysteine concentrations in the Framingham Heart Study. J. Nutr. 1996, 126, 3025–3031. [Google Scholar] [CrossRef] [PubMed] [Green Version]
- Aranceta, J.; Serra-Majem, L.; Pérez-Rodrigo, C.; Llopis, J.; Mataix, J.; Ribas, L.; Tojo, R.; Tur, J.A. Vitamins in Spanish food patterns: The eVe Study. Public Health Nutr. 2001, 4, 1317–1323. [Google Scholar] [CrossRef] [PubMed] [Green Version]
- Freisling, H.; Elmadfa, I.; Gall, I. The effect of socioeconomic status on dietary intake, physical activity and Body Mass Index in Austrian pregnant women. J. Hum. Nutr. Diet. 2006, 19, 437–445. [Google Scholar] [CrossRef] [PubMed]
- Pounis, G.; Di Castelnuovo, A.F.; de Lorgeril, M.; Krogh, V.; Siani, A.; Arnout, J.; Cappuccio, F.P.; van Dongen, M.; Zappacosta, B.; Donati, M.B. Folate intake and folate serum levels in men and women from two European populations: The IMMIDIET project. Nutrition 2014, 30, 822–830. [Google Scholar] [CrossRef]
- Goodman, E.; Adler, N.E.; Daniels, S.R.; Morrison, J.A.; Slap, G.B.; Dolan, L.M. Impact of objective and subjective social status on obesity in a biracial cohort of adolescents. Obes. Res. 2003, 11, 1018–1026. [Google Scholar] [CrossRef]
- Reidpath, D.D.; Burns, C.; Garrard, J.; Mahoney, M.; Townsend, M. An ecological study of the relationship between social and environmental determinants of obesity. Health Place 2002, 8, 141–145. [Google Scholar] [CrossRef]
- Gregorič, M.; Blaznik, U.; Turk, V. Različni Vidiki Prehranjevanja Prebivalcev Slovenije (V Starosti Od 3 Mesecev Do 74 Let). Available online: https://www.nijz.si/sites/www.nijz.si/files/publikacije-datoteke/razlicni_vidiki_prehranjevanja_prebivalcev_slovenije.pdf (accessed on 31 August 2021).
- Steenhuis, I.H.M.; Waterlander, W.E.; de Mul, A. Consumer food choices: The role of price and pricing strategies. Public Health Nutr. 2011, 14, 2220–2226. [Google Scholar] [CrossRef] [Green Version]
- Waterlander, W.E.; de Haas, W.E.; van Amstel, I.; Schuit, A.J.; Twisk, J.W.R.; Visser, M.; Seidell, J.C.; Steenhuis, I.H.M. Energy density, energy costs and income—How are they related? Public Health Nutr. 2010, 13, 1599–1608. [Google Scholar] [CrossRef] [Green Version]
- Cassady, D.; Jetter, K.M.; Culp, J. Is price a barrier to eating more fruits and vegetables for low-income families? J. Am. Diet. Assoc. 2007, 107, 1909–1915. [Google Scholar] [CrossRef]
- Konings, E.J.; Roomans, H.H.; Dorant, E.; Goldbohm, R.A.; Saris, W.H.; van den Brandt, P.A. Folate intake of the Dutch population according to newly established liquid chromatography data for foods. Am. J. Clin. Nutr. 2001, 73, 765–776. [Google Scholar] [CrossRef] [PubMed] [Green Version]
- McLean, E.; de Benoist, B.; Allen, L.H. Review of the magnitude of folate and vitamin B12 deficiencies worldwide. Food Nutr. Bull. 2008, 29, S38–S51. [Google Scholar] [CrossRef] [PubMed]
- Yates, A.A. Bioavailability of nutrients and other bioactive components from dietary supplements. J. Nutr. 2001, 131, 1331S–1334S. [Google Scholar]
- Saini, R.K.; Nile, S.H.; Keum, Y.S. Folates: Chemistry, analysis, occurrence, biofortification and bioavailability. Food Res. Int. 2016, 89, 1–13. [Google Scholar] [CrossRef] [PubMed]
- Vardavas, C.I.; Linardakis, M.K.; Hatzis, C.M.; Malliaraki, N.; Saris, W.H.M.; Kafatos, A.G. Smoking status in relation to serum folate and dietary vitamin intake. Tob. Induc. Dis. 2008, 4, 8. [Google Scholar] [CrossRef] [PubMed] [Green Version]
- Piyathilake, C.J.; Macaluso, M.; Hine, R.J.; Richards, E.W.; Krumdieck, C.L. Local and systemic effects of cigarette smoking on folate and vitamin B−12. Am. J. Clin. Nutr. 1994, 60, 559–566. [Google Scholar] [CrossRef]
- Selhub, J.; Jacques, P.F.; Wilson, P.W.; Rush, D.; Rosenberg, I.H. Vitamin status and intake as primary determinants of homocysteinemia in an elderly population. JAMA 1993, 270, 2693–2698. [Google Scholar] [CrossRef] [PubMed]
- Ganji, V.; Kafai, M.R. Demographic, Lifestyle, and Health Characteristics and Serum B Vitamin Status Are Determinants of Plasma Total Homocysteine Concentration in the Post-Folic Acid Fortification Period, 1999–2004. J. Nutr. 2008, 139, 345–352. [Google Scholar] [CrossRef] [Green Version]
- BRATTSTRÖM, L.; LINDGREN, A.; ISRAELSSON, B.; ANDERSSON, A.; HULTBERG, B. Homocysteine and cysteine: Determinants of plasma levels in middle-aged and elderly subjects. J. Intern. Med. 1994, 236, 633–641. [Google Scholar] [CrossRef] [PubMed]
- Clarke, R.; Refsum, H.; Birks, J.; Evans, J.G.; Johnston, C.; Sherliker, P.; Ueland, P.M.; Schneede, J.; McPartlin, J.; Nexo, E.; et al. Screening for vitamin B-12 and folate deficiency in older persons. Am. J. Clin. Nutr. 2003, 77, 1241–1247. [Google Scholar] [CrossRef] [PubMed] [Green Version]
- Collaboration, H.L.T. Dose-dependent effects of folic acid on blood concentrations of homocysteine: A meta-analysis of the randomized trials. Am. J. Clin. Nutr. 2005, 82, 806–812. [Google Scholar]
- D’Anci, K.E.; Rosenberg, I.H. Folate and brain function in the elderly. Curr. Opin. Clin. Nutr. Metab. Care 2004, 7, 659–664. [Google Scholar] [CrossRef] [PubMed]
- Forges, T.; Monnier-Barbarino, P.; Alberto, J.M.; Gueant-Rodriguez, R.M.; Daval, J.L.; Gueant, J.L. Impact of folate and homocysteine metabolism on human reproductive health. Hum. Reprod. Update 2007, 13, 225–238. [Google Scholar] [CrossRef]
- EFSA. Scientific Opinion on the substantiation of a health claim related to increasing maternal folate status by supplemental folate intake and reduced risk of neural tube defects pursuant to Article 14 of Regulation (EC) No 1924/2006. EFSA J. 2013, 11, 3328. [Google Scholar]
- Ray, J.G.; Singh, G.; Burrows, R.F. Evidence for suboptimal use of periconceptional folic acid supplements globally. BJOG: Int. J. Obstet. Gynaecol. 2004, 111, 399–408. [Google Scholar] [CrossRef]
- Force, U.P.S.T. Folic Acid Supplementation for the Prevention of Neural Tube Defects: US Preventive Services Task Force Recommendation Statement. JAMA 2017, 317, 183–189. [Google Scholar]
- Morris, J.K.; Addor, M.-C.; Ballardini, E.; Barisic, I.; Barrachina-Bonet, L.; Braz, P.; Cavero-Carbonell, C.; Den Hond, E.; Garne, E.; Gatt, M.; et al. Prevention of Neural Tube Defects in Europe: A Public Health Failure. Front. Pediatr. 2021, 9, 513. [Google Scholar] [CrossRef]
- Zekovic, M.; Djekic-Ivankovic, M.; Nikolic, M.; Gurinovic, M.; Krajnovic, D.; Glibetic, M. Validity of the Food Frequency Questionnaire Assessing the Folate Intake in Women of Reproductive Age Living in a Country without Food Fortification: Application of the Method of Triads. Nutrients 2017, 9, 128. [Google Scholar] [CrossRef] [PubMed] [Green Version]
- Mojtabai, R. Body mass index and serum folate in childbearing age women. Eur. J. Epidemiol. 2004, 19, 1029–1036. [Google Scholar] [CrossRef]
- Rogers, L.M.; Cordero, A.M.; Pfeiffer, C.M.; Hausman, D.B.; Tsang, B.L.; De-Regil, L.M.; Rosenthal, J.; Razzaghi, H.; Wong, E.C.; Weakland, A.P.; et al. Global folate status in women of reproductive age: A systematic review with emphasis on methodological issues. Ann. N. Y. Acad. Sci. 2018, 1431, 35–57. [Google Scholar] [CrossRef] [PubMed]
- Kokalj, T.S.; Rejc, B.; Gersak, K. Incidence and prevention of neural tube defects in Slovenia. Eur. J. Obstet. Gynecol. Reprod. Biol. 2011, 156, 119–120. [Google Scholar] [CrossRef] [PubMed]
- Marchetta, C.M.; Devine, O.J.; Crider, K.S.; Tsang, B.L.; Cordero, A.M.; Qi, Y.P.; Guo, J.; Berry, R.J.; Rosenthal, J.; Mulinare, J.; et al. Assessing the Association between Natural Food Folate Intake and Blood Folate Concentrations: A Systematic Review and Bayesian Meta-Analysis of Trials and Observational Studies. Nutrients 2015, 7, 2663–2686. [Google Scholar] [CrossRef] [PubMed]
- Koch, V.; Pokorn, D. Comparison of nutritional habits among various adult age groups in Slovenia. Nutr. Res. 1999, 19, 1153–1164. [Google Scholar] [CrossRef]
- Food Administration, D. Food standards: Amendment of standards of identity for enriched grain products to require addition of folic acid; final rule (21 CFR Parts 136, 137, and 139). Fed. Regist. 1996, 61, 8781–8797. [Google Scholar]
- Canada, H. Regulations amending the Food and Drug Regulations (1066). Can Gaz Part 1 1997, 131, 3702–3737. [Google Scholar]
- Hertrampf, E.; Cortés, F.; Erickson, J.D.; Cayazzo, M.; Freire, W.; Bailey, L.B.; Howson, C.; Kauwell, G.P.; Pfeiffer, C. Consumption of folic acid–fortified bread improves folate status in women of reproductive age in Chile. J. Nutr. 2003, 133, 3166–3169. [Google Scholar] [CrossRef] [Green Version]
- DHSC. Folic Acid Added to Flour to Prevent Spinal Conditions in Babies. Available online: https://www.gov.uk/government/news/folic-acid-added-to-flour-to-prevent-spinal-conditions-in-babies (accessed on 21 September 2021).
- Dietrich, M.; Brown, C.J.; Block, G. The effect of folate fortification of cereal-grain products on blood folate status, dietary folate intake, and dietary folate sources among adult non-supplement users in the United States. J. Am. Coll. Nutr. 2005, 24, 266–274. [Google Scholar] [CrossRef]
- EC. Fortification with Folic Acid Could help Prevent Severe Birth Defects in at Least 1000 Pregnancies per Year. Available online: https://ec.europa.eu/jrc/en/news/fortification-folic-acid-could-help-prevent-severe-birth-defects-least-1000-pregnancies-year (accessed on 21 September 2021).
- West, A.A.; Caudill, M.A. Genetic variation: Impact on folate (and choline) bioefficacy. Int. J. Vitam. Nutr. Res. 2010, 80, 319. [Google Scholar] [CrossRef]
- Raiten, D.J.; Namasté, S.; Brabin, B.; Combs, G., Jr.; L’Abbe, M.R.; Wasantwisut, E.; Darnton-Hill, I. Executive summary:Biomarkers of Nutrition for Development: Building a Consensus. Am. J. Clin. Nutr. 2011, 94, 633s–650s. [Google Scholar] [CrossRef] [Green Version]


| Variable | Adolescents N (%) | Adults N (%) | Elderly N (%) | |
|---|---|---|---|---|
| Overall (SI.Menu study) | 468 (100) | 364 (100) | 416 (100) | |
| Age (mean ± SD) | 13.4 (2.4) | 43.6 (13.8) | 68.7 (2.7) | |
| Residential area | rural | 270 (57.7) | 202 (55.5) | 229 (55.1) |
| intermediate | 76 (16.2) | 56 (15.4) | 71 (17.1) | |
| urban | 122 (26.1) | 106 (29.1) | 116 (27.9) | |
| Sex | male | 238 (50.9) | 173 (47.5) | 213 (51.2) |
| female | 230 (49.1) | 191 (52.5) | 203 (48.8) | |
| Education | no university degree | n.a. | 249 (68.4) | 342 (82.2) |
| university degree | n.a. | 115 (31.6) | 74 (17.8) | |
| Financial status | below average | n.a. | 118 (38.4) | 269 (71.5) |
| above average | n.a. | 189 (61.6) | 107 (28.5) | |
| Employment | employed | n.a. | 226 (62.1) | n.a. |
| unemployed | n.a. | 42 (11.5) | n.a. | |
| student | n.a. | 32 (8.8) | n.a. | |
| retired | n.a. | 64 (17.6) | n.a. | |
| BMI (mean ± SD) | 21.0 (4.2) | 26.7 (5.2) | 28.4 (5.0) | |
| BMI | normal | 301 (64.6) | 148 (40.7) | 108 (26.0) |
| overweight and obese | 167 (35.7) | 216 (59.3) | 308 (74.0) | |
| Smoking status | current, occasional, ex-smoker | 30 (6.4) | 165 (45.3) | 185 (44.5) |
| non smoker | 438 (93.6) | 199 (54.7) | 231 (55.5) | |
| IPAQ | low level | 108 (23.3) | 127 (35.3) | 137 (33.4) |
| moderate level | 141 (30.5) | 108 (30.0) | 133 (32.4) | |
| high level | 214 (46.2) | 125 (34.7) | 140 (34.2) | |
| Supplement use | folate | 1 (0.2) | 7 (1.9) | 1 (0.2) |
| multivitamins | 128 (27.5) | 133 (36.5) | 94 (22.6) | |
| does not use | 339 (72.3) | 224 (61.6) | 321 (77.2) | |
| Behavioural diet | vegetarian/vegan | 12 (2.6) | 8 (2.2) | 3 (0.7) |
| no diet | 456 (97.4) | 356 (97.8) | 413 (99.3) | |
| Medical diet | medical and/or weight loss | 13 (2.8) | 32 (8.8) | 51 (12.3) |
| no special diet | 455 (97.2) | 332 (91.2) | 465 (87.7) | |
| Subsample of the Nutrihealth study * | 125 (34.3) | 155 (37.3) | ||
| Adolescents N (%) | Adults N (%) | Elderly N (%) | |||||||
|---|---|---|---|---|---|---|---|---|---|
| All | Male | Female | All | Male | Female | All | Male | Female | |
| Si.Menu study; N(%) | 468 (100) | 238 (50.85) | 230 (49.15) | 364 (100) | 173 (47.53) | 191(52.47) | 416 (100) | 213 (51.20) | 203 (48.80) |
| Daily folate intake | |||||||||
| Mean (95%CI) (µg /day) | 289.8 (277.7–301.9) | 308.1 (291.9–324.2) | 270.1 (255.0–285.3) | 294.6 (283.4–305.8) | 311.4 (293.8–329.0) | 277.5 (264.2–290.9) | 295.5 (263.0–327.9) | 278.6 (263.7–293.4) | 311.0 (252.7-369.3) |
| Std. Err. | 6.16 | 8.21 | 7.71 | 5.70 | 8.95 | 6.78 | 16.5 | 7.56 | 29.64 |
| Median (µg /day) | 271.5 | 301.4 | 247.5 | 281.2 | 297.3 | 267.2 | 274.1 | 280.1 | 270.9 |
| Mean (95% CI) (µg/per 1000 kcal/day) * | 127.7 (122.5–132.9) | 119.8 (113.0–126.6) | 136.3 (129.1–143.6) | 138.4 (133.4–143.4) | 132.3 (124.7–140.0) | 144.6 (138.4–150.8) | 140.7 (128.1–153.2) | 125.8 (120.9–130.7) | 154.3 (133.2–175.3) |
| Proportion of population with insufficient daily folate intake ** | |||||||||
| <300 µg/day | 58.7 (51.0–66.1) | 49.9 (39.1–60.7) | 68.3 (60.1–75.4) | 58.1 (52.2–63.8) | 52.9 (44.4–61.1) | 63.5 (55.3–70.9) | 67.8 (58.7–75.7) | 73.5 (62.6–82.1) | 62.6 (49.9–73.8) |
| <400 µg/day | 87.9 (84.0–90.9) | 84.3 (77.8–89.122.2) | 91.8 (86.9–95.0) | 87.8 (83.5–91.1) | 83.5 (76.4–88.7) | 92.1 (86.8–95.4) | 87.6 (76.9–93.7) | 93.3 (88.3–96.2) | 82.4 (63.8–92.5) |
| Nutrihealth study; N (%) | 125 (100) | 52 (41.6) | 73 (58.4) | 155 (100) | 76 (49.0) | 79 (51.0) | |||
| Serum folate level | |||||||||
| Mean (95%CI) (nmol/L) | 10.6 (9.6–11.7) | 10.5 (8.9–12.2) | 10.8 (9.5–12.1) | 11.4 (10.0–12.9) | 11.0 (8.6–13.5) | 11.8 (10.3–13.3) | |||
| Std. Err. | 0.54 | 0.84 | 0.66 | 0.72 | 1.24 | 0.78 | |||
| Median (nmol/L) | 10.0 | 9.0 | 10.0 | 10.0 | 9.0 | 10.0 | |||
| Prevalence of low serum folate (%) (95% CI) | |||||||||
| <7 nmol/L | 16.6 (10.8–24.6) | 16.5 (8.6–29.5) | 16.6 (9.5–27.6) | 18.5 (13.1–25.4) | 22.4 (14.3–33.2) | 15.0 (8.7–24.7) | |||
| <10 nmol/L | 49.0 (39.4–58.6) | 50.4 (35.7–65.0) | 47.5 (35.8–59.4) | 48.6 (40.8–56.5) | 51.3 (40.1–62.4) | 46.3 (35.6–57.3) | |||
| Serum homocysteine level | |||||||||
| Mean (95%CI) (µmol/L) | 12.6 (11.9–13.3) | 13.6 (12.6–14.6) | 14.6 (13.9–15.2) | 14.6 (13.9–15.2) | 16.1 (15.2–17.0) | 13.2 (12.5–13.9) | |||
| Std. Err. | 0.35 | 0.50 | 0.42 | 0.32 | 0.47 | 0.36 | |||
| Median (µmol/L) | 12.1 | 12.6 | 15.7 | 14.2 | 10.9 | 13.0 | |||
| Prevalence of high homocysteine level (%) (95% CI) | |||||||||
| >10 µmol/L | 75.3 (66.4–82.4) | 88.7 (76.5–95.0) | 61.0 (48.6–72.2) | 88.9 (82.7–93.0) | 96.0 (88.3–98.7) | 82.5 (72.5–89.4) | |||
| >15 µmol/L | 20.5 (13.9–29.1) | 26.4 (15.8–40.8) | 14.2 (8.0–23.9) | 39.9 (32.4–47.8 | 56.6 (45.2–67.3) | 25.0 (16.7–35.7) | |||
| Prevalence (%) of folate deficiency using criteria of low serum folate (<7 nmol/L) and high serum homocysteine (15 µmol/L) | |||||||||
| 6.9 (3.5–13.0) | 9.7 (4.3–20.4) | 3.9 (1.8–12.0) | 10.1 (6.3–16.0) | 14.5 (8.1–24.4) | 5.3 (2.6–14.3) | ||||
| Variable | Adolescents (10–17 Years Old) | Adults (18–64 Years Old) | Elderly (65–74 Years Old) | ||||
|---|---|---|---|---|---|---|---|
| (>300 µg/day) n (%) | Odds Ratio * | (>300 µg/day) n (%) | Odds Ratio * | (>300 µg/day) n (%) | Odds Ratio * | ||
| All | 181 (38.7) | 140 (38.5) | 139 (33.4) | ||||
| Sex | Male | 102 (42.9) | 1 | 78 (45.1) | 1 | 74 (34.7) | 1 |
| Female | 79 (34.4) | 0.63 (0.43–0.93) | 62 (32.5) | 0.44 (0.26–0.75) | 65 (32.0) | 0.87 (0.54–1.42) | |
| Residential area | Rural | 104 (38.5) | 1 | 74 (32.3) | 1 | 20 (8.7) | 1 |
| Intermediate | 35 (46.1) | 1.37 (0.81–2.32) | 23 (32.4) | 2.25 (1.79–10.18) | 6 (8.5) | 1.04 (0.57–1.90) | |
| Urban | 42 (34.4) | 0.79 (0.50–1.426) | 42 (36.2) | 1.51 (1.07–4.24) | 9 (7.8) | 1.23 (0.73–2.07) | |
| Education | No university degree | n.a. | n.a. | 83 (33.3) | 1 | 115 (33.6) | 1 |
| University degree | 57 (49.6) | 1.93 (1.07–3.47) | 24 (32.4) | 0.93 (0.50–1.73) | |||
| Financial status | Below average | n.a. | n.a. | 38 (32.2) | 1 | 89 (33.1) | 1 |
| Above average | 82 (43.4) | 1.11 (0.62–2.00) | 38 (35.5) | 1.09 (0.65–1.82) | |||
| BMI | Normal | 126 (41.9) | 1 | 60 (40.5) | 1 | 34 (31.5) | 1 |
| Overweight/obese | 55 (32.9) | 0.65 (0.43–0.98) | 80 (37.0) | 0.71 (0.41–1.21) | 105 (34.1) | 0.98 (0.58–1.64) | |
| IPAQ | Low intensity | 40 (37.0) | 1 | 53 (41.7) | 1 | 42 (30.7) | 1 |
| Moderate | 62 (44.0) | 1.55 (0.91–2.64) | 43 (39.8) | 0.83 (0.45–1.53) | 47 (35.3) | 1.19 (0.70–2.03) | |
| High intensity | 79 (36.9) | 1.01 (0.62–1.64) | 42 (33.6) | 0.56 (0.30–1.03) | 50 (35.7) | 1.12 (0.66–1.90) | |
| Employment status | Employed | n.a. | n.a. | 100 (44.3) | 1 | n.a. | n.a. |
| Unemployed | 10 (23.8) | 0.29 (0.10–0.76) | |||||
| Student | 11 (34.4) | 0.73 (0.26–2.06) | |||||
| Retired | 19 (29.7) | 0.60 (0.28–1.28) | |||||
| Smoking status | Non smoker | 172 (39.3) | 1 | 76 (38.2) | 1 | 75 (32.5) | 1 |
| Current, occasional, ex-smoker | 9 (30.0) | 0.57 (0.25–1.30) | 64 (38.8) | 1.34 (0.79–2.28) | 64 (34.6) | 1.02 (0.63–1.66) | |
| Medical diet | No diet | 176 (38.7) | 1 | 129 (38.9) | 1 | 123 (33.7) | 1 |
| Medical and/or weight loss | 5 (38.5) | 1.17 (0.37–3.74) | 11 (34.4) | 0.75 (0.29–1.96) | 16 (31.4) | 0.95 (0.49–1.84) | |
| Behavioural diet | No diet | 180 (39.5) | n.a | 136 (38.2) | 1 | 138 (33.4) | 1 |
| Veget./vegan | 1 (8.33) | 4 (50.0) | 1.03 (0.22–4.74) | 1 (33.3) | 0.92 (0.07–11.40) | ||
Publisher’s Note: MDPI stays neutral with regard to jurisdictional claims in published maps and institutional affiliations. |
© 2021 by the authors. Licensee MDPI, Basel, Switzerland. This article is an open access article distributed under the terms and conditions of the Creative Commons Attribution (CC BY) license (https://creativecommons.org/licenses/by/4.0/).
Share and Cite
Pravst, I.; Lavriša, Ž.; Hribar, M.; Hristov, H.; Kvarantan, N.; Seljak, B.K.; Gregorič, M.; Blaznik, U.; Gregorič, N.; Zaletel, K.; et al. Dietary Intake of Folate and Assessment of the Folate Deficiency Prevalence in Slovenia Using Serum Biomarkers. Nutrients 2021, 13, 3860. https://doi.org/10.3390/nu13113860
Pravst I, Lavriša Ž, Hribar M, Hristov H, Kvarantan N, Seljak BK, Gregorič M, Blaznik U, Gregorič N, Zaletel K, et al. Dietary Intake of Folate and Assessment of the Folate Deficiency Prevalence in Slovenia Using Serum Biomarkers. Nutrients. 2021; 13(11):3860. https://doi.org/10.3390/nu13113860
Chicago/Turabian StylePravst, Igor, Živa Lavriša, Maša Hribar, Hristo Hristov, Naska Kvarantan, Barbara Koroušić Seljak, Matej Gregorič, Urška Blaznik, Nadan Gregorič, Katja Zaletel, and et al. 2021. "Dietary Intake of Folate and Assessment of the Folate Deficiency Prevalence in Slovenia Using Serum Biomarkers" Nutrients 13, no. 11: 3860. https://doi.org/10.3390/nu13113860