
A Machine Learning-Based Screening Test for Sarcopenic Dysphagia Using Image Recognition

 , ,
, ,  , and
, and
Abstract
:1. Introduction
2. Materials and Methods
2.1. Study Population
2.2. Diagnosis of Sarcopenic Dysphagia
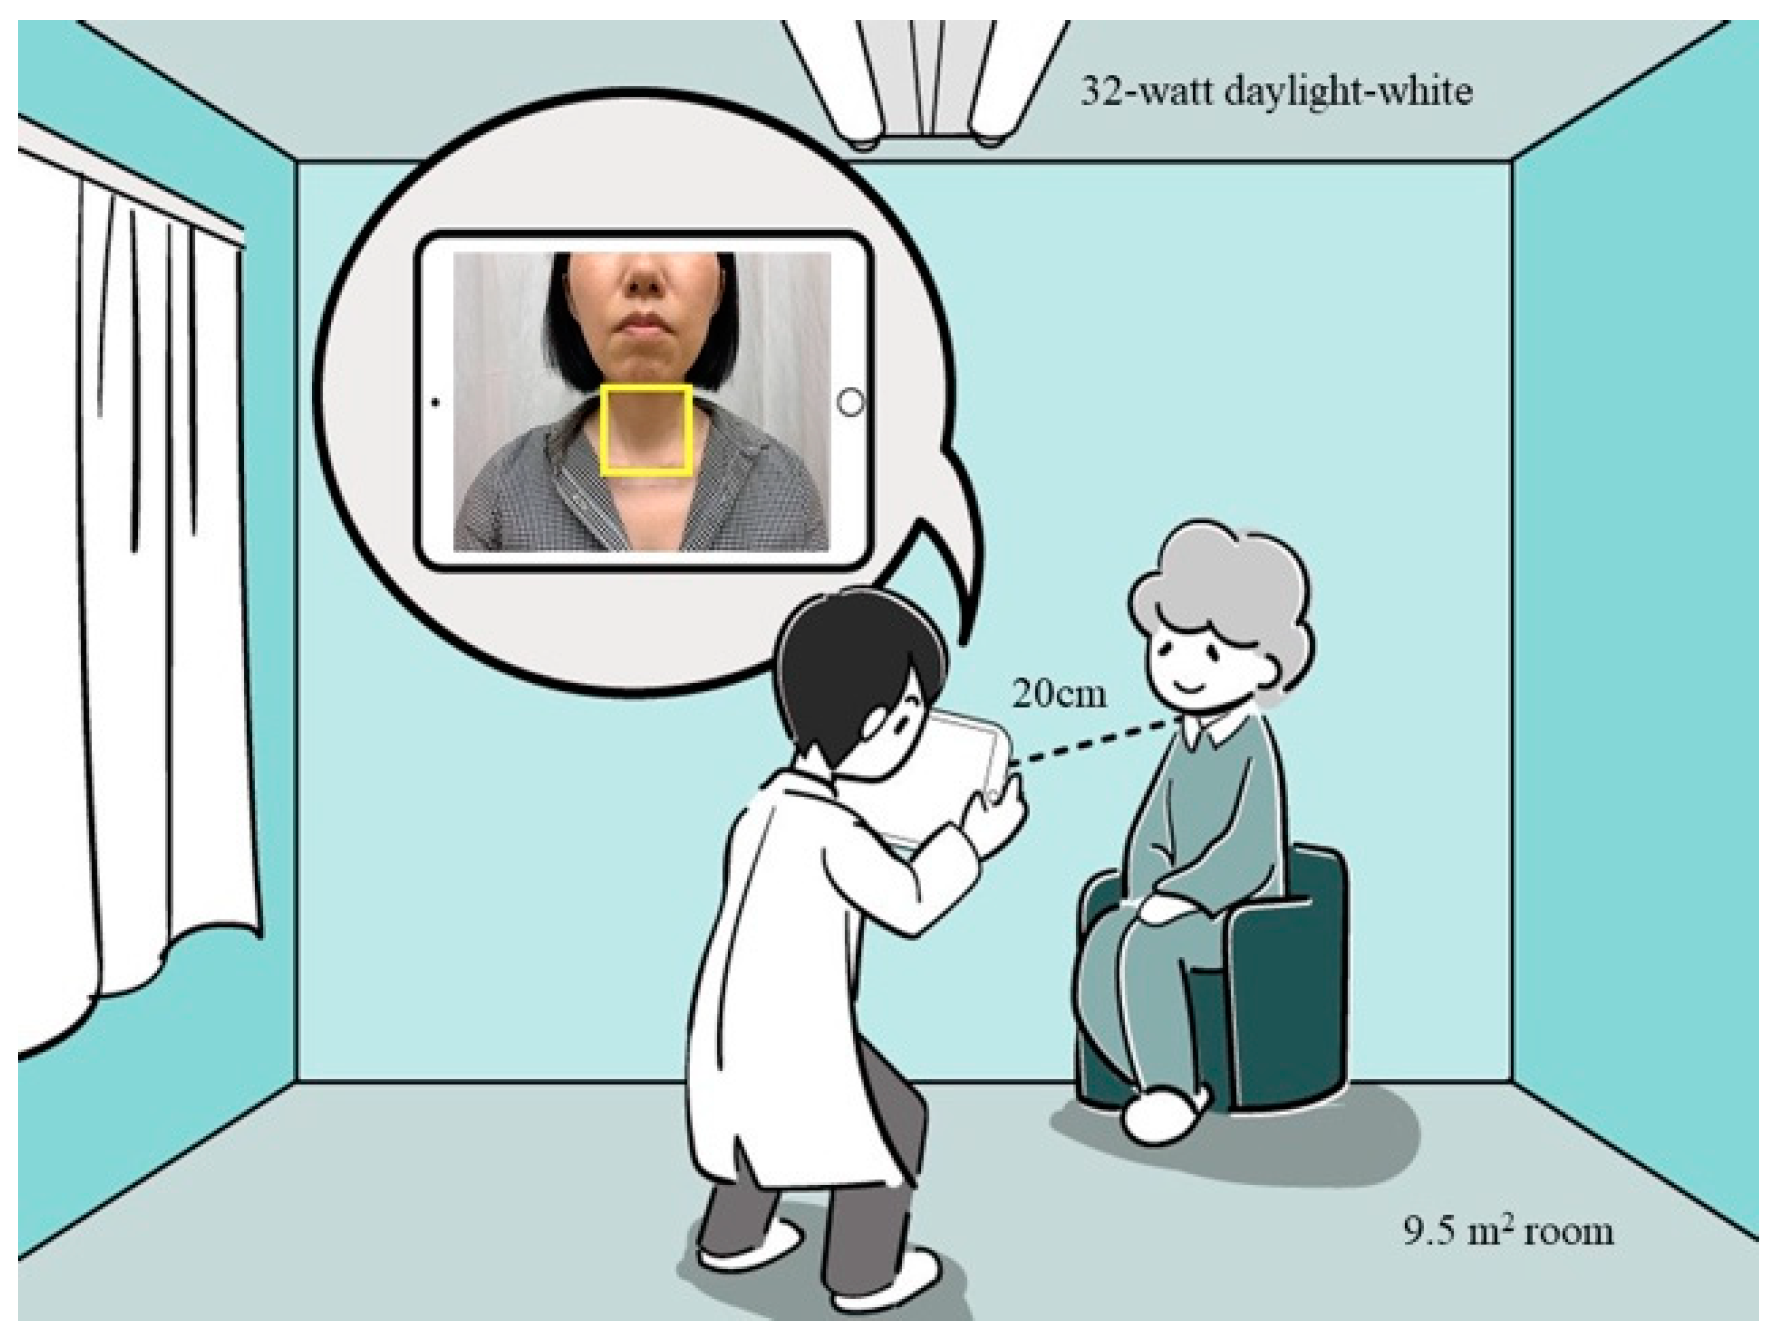
2.3. Neck Imaging
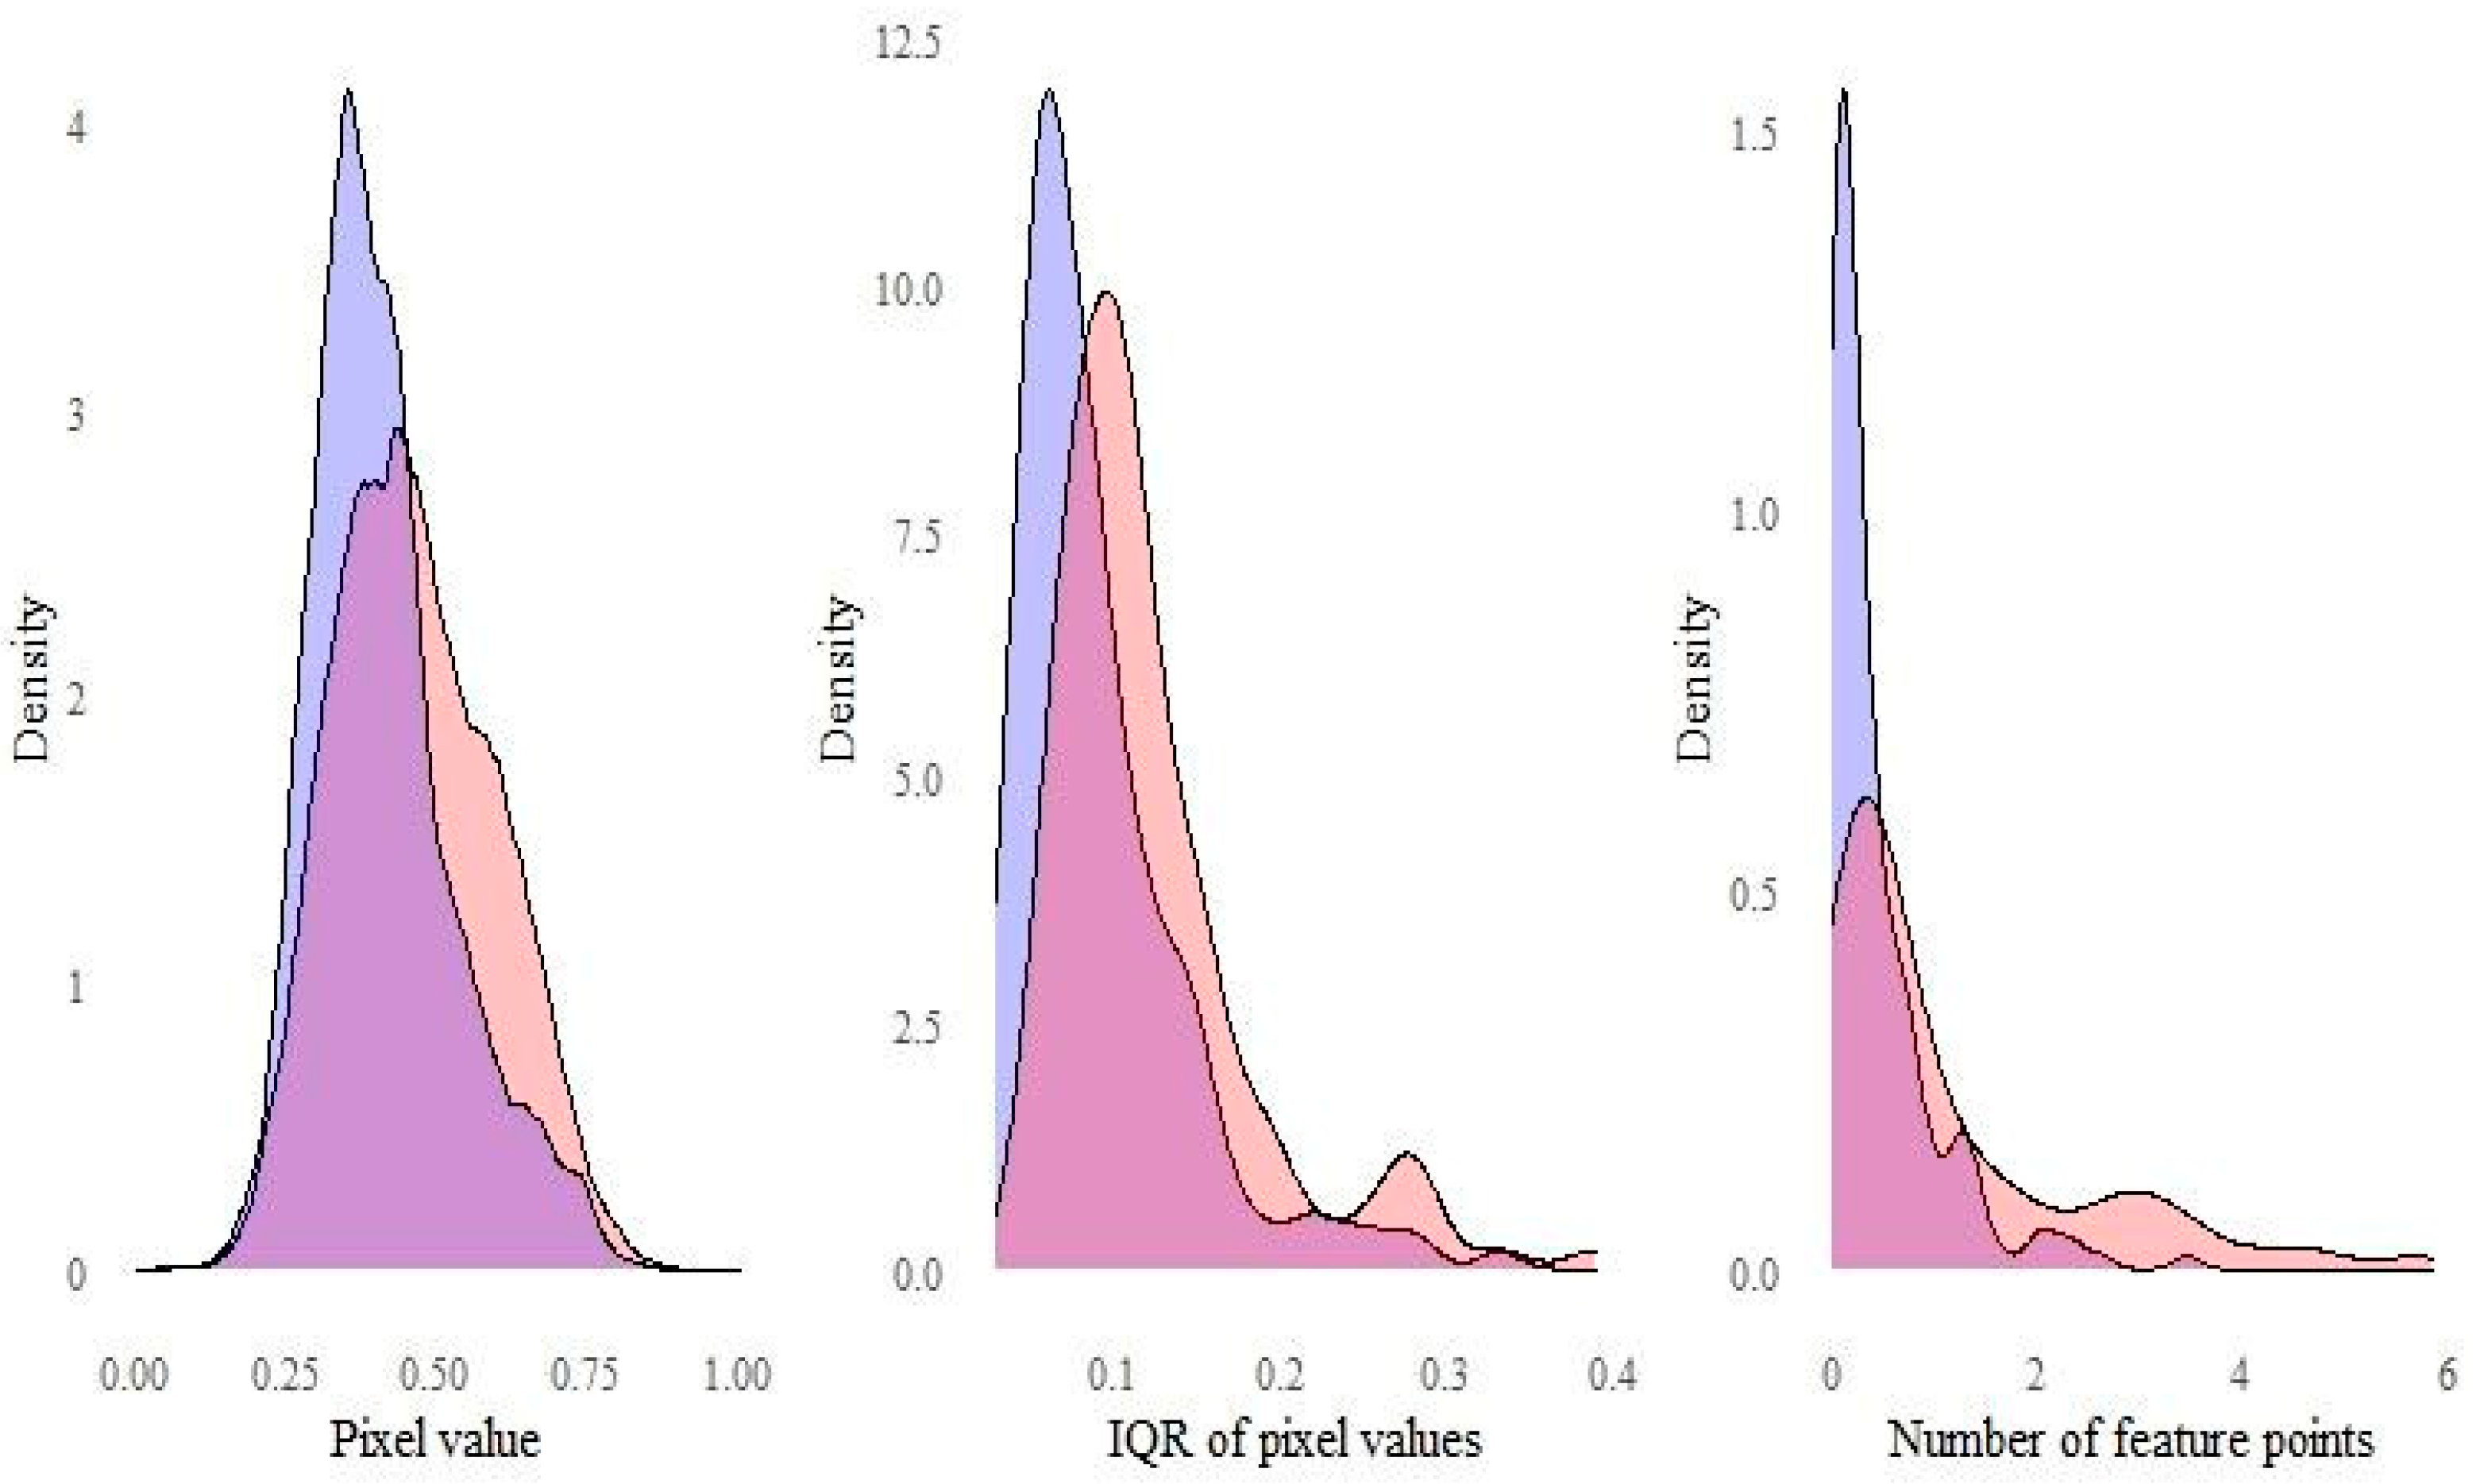
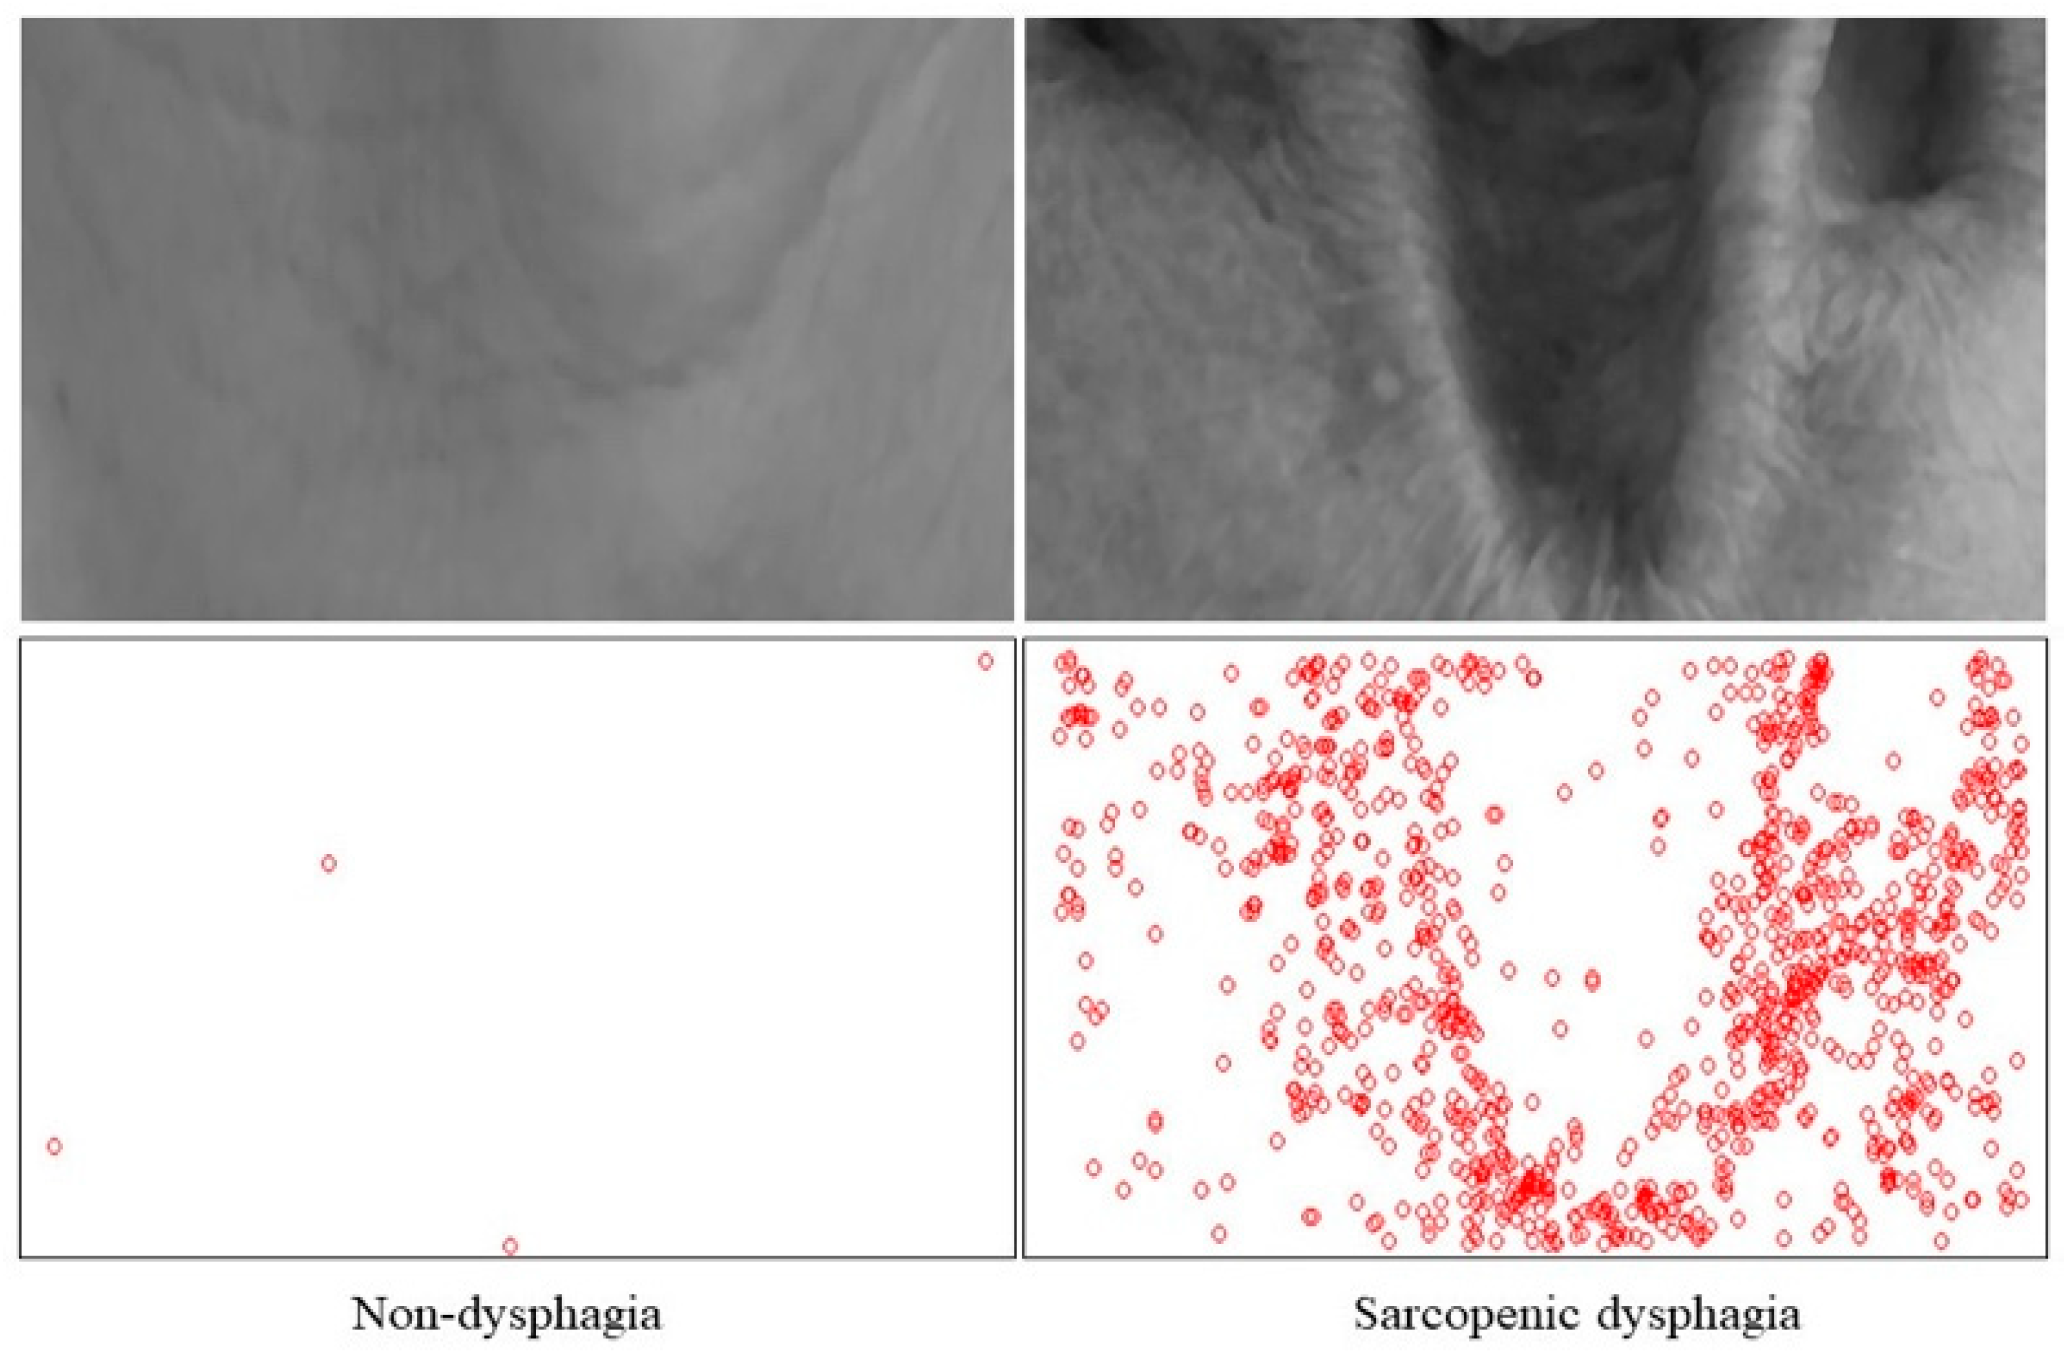
2.4. Image Features
2.5. Participant Characteristics
2.6. Statistical Analysis
3. Results
4. Discussion
5. Conclusions
Author Contributions
Funding
Institutional Review Board Statement
Informed Consent Statement
Data Availability Statement
Conflicts of Interest
References
- United Nations Department of Economic and Social Affairs, Population Division. World Population Ageing 2020 Highlights: Living Arrangements of Older Persons; United Nations: New York, NY, USA, 2020. [Google Scholar]
- dos Santos, L.; Cyrino, E.S.; Antunes, M.; Santos, D.A.; Sardinha, L.B. Sarcopenia and physical independence in older adults: The independent and synergic role of muscle mass and muscle function. J. Cachexia Sarcopenia Muscle 2017, 8, 245–250. [Google Scholar] [CrossRef] [PubMed]
- Brown, J.C.; Harhay, M.O.; Harhay, M.N. Sarcopenia and mortality among a population-based sample of community-dwelling older adults. J. Cachexia Sarcopenia Muscle 2016, 7, 290–298. [Google Scholar] [CrossRef] [PubMed]
- Wakabayashi, H.; Sakuma, K. Rehabilitation nutrition for sarcopenia with disability: A combination of both rehabilitation and nutrition care management. J. Cachexia Sarcopenia Muscle 2014, 5, 269–277. [Google Scholar] [CrossRef] [PubMed]
- Kuroda, Y.; Kuroda, R. Relationship between thinness and swallowing function in Japanese older adults: Implications for sarcopenic dysphagia. J. Am. Geriatr Soc. 2012, 60, 1785–1786. [Google Scholar] [CrossRef] [PubMed]
- Clave, P.; Shaker, R. Dysphagia: Current reality and scope of the problem. Nat. Rev. Gastroenterol. Hepatol. 2015, 12, 259–270. [Google Scholar] [CrossRef] [PubMed]
- Wakabayashi, H.; Takahashi, R.; Murakami, T. The Prevalence and Prognosis of Sarcopenic Dysphagia in Patients Who Require Dysphagia Rehabilitation. J. Nutr. Health Aging 2019, 23, 84–88. [Google Scholar] [CrossRef] [PubMed]
- Sakai, K.; Nakayama, E.; Tohara, H.; Takahashi, O.; Ohnishi, S.; Tsuzuki, H.; Hayata, M.; Takehisa, T.; Takehisa, Y.; Ueda, K. Diagnostic accuracy of lip force and tongue strength for sarcopenic dysphagia in older inpatients: A cross-sectional observational study. Clin. Nutr. 2018, 38, 303–309. [Google Scholar] [CrossRef]
- Ortega, O.; Martín, A.; Clavé, P. Diagnosis and Management of Oropharyngeal Dysphagia Among Older Persons, State of the Art. J. Am. Med. Dir. Assoc. 2017, 18, 576–582. [Google Scholar] [CrossRef] [PubMed]
- Fujishima, I.; Fujiu-Kurachi, M.; Arai, H.; Hyodo, M.; Kagaya, H.; Maeda, K.; Mori, T.; Nishioka, S.; Oshima, F.; Ogawa, S.; et al. Sarcopenia and dysphagia: Position paper by four professional organizations. Geriatr. Gerontol. Int. 2019, 19, 91–97. [Google Scholar] [CrossRef] [PubMed] [Green Version]
- O’Horo, J.C.; Rogus-Pulia, N.; Garcia-Arguello, L.; Robbins, J.; Safdar, N. Bedside diagnosis of dysphagia: A systematic review. J. Hosp. Med. 2015, 10, 256–265. [Google Scholar] [CrossRef] [PubMed] [Green Version]
- Estupiñán Artiles, C.; Regan, J.; Donnellan, C. Dysphagia screening in residential care settings: A scoping review. Int. J. Nurs. Stud. 2020, 114, 103813. [Google Scholar] [CrossRef]
- Speyer, R. Oropharyngeal Dysphagia: Screening and Assessment. Otolaryngol. Clin. N. Am. 2013, 46, 989–1008. [Google Scholar] [CrossRef] [PubMed]
- Ohara, D.G.; Pegorari, M.S.; Oliveira Dos Santos, N.L.; de Fátima Ribeiro Silva, C.; Monteiro, R.L.; Matos, A.P.; Jamami, M. Respiratory Muscle Strength as a Discriminator of Sarcopenia in Community-Dwelling Elderly: A Cross-Sectional Study. J. Nutr. Health Aging 2018, 22, 952–958. [Google Scholar] [CrossRef] [PubMed]
- Wirth, R.; Dziewas, R.; Beck, A.M.; Clavé, P.; Hamdy, S.; Heppner, H.J.; Langmore, S.; Leischker, A.H.; Martino, R.; Pluschinski, P.; et al. Oropharyngeal dysphagia in older persons—From pathophysiology to adequate intervention: A review and summary of an international expert meeting. Clin. Interv. Aging 2016, 11, 189–208. [Google Scholar] [CrossRef] [PubMed] [Green Version]
- Chang, K.V.; Hsu, T.H.; Wu, W.T.; Huang, K.C.; Han, D.S. Association between Sarcopenia and Cognitive Impairment: A Systematic Review and Meta-Analysis. J. Am. Med. Dir. Assoc. 2016, 17, 1164.e7–1164.e15. [Google Scholar] [CrossRef] [PubMed]
- Yoshida, S.; Tohara, H.; Nakagawa, K.; Hara, K.; Yamaguchi, K.; Nakane, A.; Yoshimi, K.; Ariya, C.; Kurosawa, Y.; Minakuchi, S. Relationship between jaw-opening force and neck circumference in healthy older individuals. Geriatr. Gerontol. Int. 2019, 19, 330–334. [Google Scholar] [CrossRef] [PubMed]
- Smithard, D.G.; O’Neill, P.A.; England, R.E.; Park, C.L.; Wyatt, R.; Martin, D.F.; Morris, J. The natural history of dysphagia following a stroke. Dysphagia 1997, 12, 188–193. [Google Scholar] [CrossRef] [PubMed]
- Chen, L.-K.; Woo, J.; Assantachai, P.; Auyeung, T.-W.; Chou, M.-Y.; Iijima, K.; Jang, H.C.; Kang, L.; Kim, M.; Kim, S.; et al. Asian Working Group for Sarcopenia: 2019 Consensus Update on Sarcopenia Diagnosis and Treatment. J. Am. Med. Dir. Assoc. 2020, 21, 300–307.e302. [Google Scholar] [CrossRef] [PubMed]
- Wu, M.-C.; Chang, Y.-C.; Wang, T.-G.; Lin, L.-C. Evaluating Swallowing Dysfunction Using a 100-mL Water Swallowing Test. Dysphagia 2004, 19, 43–47. [Google Scholar] [CrossRef] [PubMed]
- Tohara, H.; Saitoh, E.; Mays, K.A.; Kuhlemeier, K.; Palmer, J.B. Three tests for predicting aspiration without videofluorography. Dysphagia 2003, 18, 126–134. [Google Scholar] [CrossRef]
- Borders, J.C.; Brates, D. Use of the Penetration-Aspiration Scale in Dysphagia Research: A Systematic Review. Dysphagia 2020, 35, 583–597. [Google Scholar] [CrossRef] [PubMed]
- Minakuchi, S.; Tsuga, K.; Ikebe, K.; Ueda, T.; Tamura, F.; Nagao, K.; Furuya, J.; Matsuo, K.; Yamamoto, K.; Kanazawa, M.; et al. Oral hypofunction in the older population: Position paper of the Japanese Society of Gerodontology in 2016. Gerodontology 2018, 35, 317–324. [Google Scholar] [CrossRef] [PubMed]
- Fischer, M.; JeVenn, A.; Hipskind, P. Evaluation of muscle and fat loss as diagnostic criteria for malnutrition. Nutr. Clin. Pract. 2015, 30, 239–248. [Google Scholar] [CrossRef]
- Perreault, S.; Hébert, P. Median filtering in constant time. IEEE Trans. Image Process. 2007, 16, 2389–2394. [Google Scholar] [CrossRef] [PubMed] [Green Version]
- Rosten, E.; Drummond, T. Machine Learning for High-Speed Corner Detection. In European Conference on Computer Vision; Springer: Berlin/Heidelberg, Germany, 2006. [Google Scholar]
- Charlson, M.E.; Pompei, P.; Ales, K.L.; MacKenzie, C.R. A new method of classifying prognostic comorbidity in longitudinal studies: Development and validation. J. Chronic Dis. 1987, 40, 373–383. [Google Scholar] [CrossRef]
- Mahoney, F.I.; Barthel, D.W. Functional Evaluation: The Barthel Index. Md. State Med. J. 1965, 14, 61–65. [Google Scholar] [PubMed]
- Crary, M.A.; Mann, G.D.; Groher, M.E. Initial psychometric assessment of a functional oral intake scale for dysphagia in stroke patients. Arch. Phys. Med. Rehabil. 2005, 86, 1516–1520. [Google Scholar] [CrossRef] [PubMed]
- Folstein, M.F.; Folstein, S.E.; McHugh, P.R. “Mini-mental state”. A practical method for grading the cognitive state of patients for the clinician. J. Psychiatr. Res. 1975, 12, 189–198. [Google Scholar] [CrossRef]
- Cederholm, T.; Jensen, G.L.; Correia, M.; Gonzalez, M.C.; Fukushima, R.; Higashiguchi, T.; Baptista, G.; Barazzoni, R.; Blaauw, R.; Coats, A.; et al. GLIM criteria for the diagnosis of malnutrition—A consensus report from the global clinical nutrition community. Clin. Nutr. 2019, 38, 1–9. [Google Scholar] [CrossRef] [Green Version]
- Steyerberg, E.W. Clinical Prediction Models; Springer: Berlin/Heidelberg, Germany, 2019. [Google Scholar]
- National Institutes of Health. Clinical Guidelines on the Identification, Evaluation, and Treatment of Overweight and Obesity in Adults—The Evidence Report. Obes Res. 1998, 6 (Suppl. S2), 51s–209s. [Google Scholar]
- Evans-Hoeker, E.A.; Calhoun, K.C.; Mersereau, J.E. Healthcare provider accuracy at estimating women’s BMI and intent to provide counseling based on appearance alone. Obesity 2014, 22, 633–637. [Google Scholar] [CrossRef] [PubMed]
- Tibshirani, R. Regression Shrinkage and Selection Via the Lasso. J. R. Stat. Soc. Ser. B Stat. Methodol. 1996, 58, 267–288. [Google Scholar] [CrossRef]
- Youden, W.J. Index for rating diagnostic tests. Cancer 1950, 3, 32–35. [Google Scholar] [CrossRef]
- Wilson, J.M.G.; Jungner, G.; World Health Organization. Principles and Practice of Screening for Disease. 1968. Available online: https://apps.who.int/iris/handle/10665/37650 (accessed on 25 February 2021).
- Brodsky, M.B.; Suiter, D.M.; González-Fernández, M.; Michtalik, H.J.; Frymark, T.B.; Venediktov, R.; Schooling, T. Screening Accuracy for Aspiration Using Bedside Water Swallow Tests: A Systematic Review and Meta-Analysis. Chest 2016, 150, 148–163. [Google Scholar] [CrossRef] [Green Version]
- Hastie, T.; Tibshirani, R.; Wainwright, M. Statistical Learning with Sparsity: The Lasso and Generalizations; CRC Press: Boca Raton, FL, USA, 2015. [Google Scholar]

| Non-Dysphagic Group (n = 175) | Sarcopenic Dysphagic Group (n = 133) | p Value | |
|---|---|---|---|
| Age (years) | 82.57 (8.01) | 86.22 (7.47) | <0.001 |
| Sex; female, No. (%) | 108 (62.43) | 72 (54.15) | 0.20 |
| Sarcopenia, No. (%) | 104 (59.43) | 133 (100.00) | <0.001 |
| C-reactive protein (mg/dL) | 0.40 (0.60) | 0.87 (1.30) | <0.001 |
| Charlson Comorbidity Index | 0.71 (0.74) | 1.26 (0.68) | <0.001 |
| Grip strength (kg) | 17.65 (6.59) | 12.90 (4.85) | <0.001 |
| Barthel Index | 57.28 (24.14) | 22.93 (24.93) | <0.001 |
| Gait speed (m/s) | 0.68 (0.33) | 0.49 (0.28) | <0.001 |
| Unable to walk, No. (%) | 46 (26.59) | 96 (72.18) | <0.001 |
| MMSE | 23.33 (6.07) | 14.60 (7.77) | <0.001 |
| SMI (kg/m2) | 5.79 (1.15) | 4.68 (1.35) | <0.001 |
| BMI (kg/m2) | 21.01 (3.38) | 16.90 (2.79) | <0.001 |
| Lingual pressure (kPa) | 27.99 (6.33) | 21.53 (6.15) | <0.001 |
| Malnutrition, No. (%) | 81 (46.29) | 125 (93.98) | <0.001 |
| History of stroke, No. (%) | 23 (13.29) | 34 (25.56) | 0.012 |
| FOIS | 6.60 (0.49) | 3.84 (1.60) | <0.001 |
| Primary disease | <0.001 | ||
| Orthopedics, No. (%) | 130 (74.29) | 47 (35.34) | |
| Heart failure, No. (%) | 12 (6.86) | 9 (6.77) | |
| Digestive disorder, No. (%) | 8 (4.57) | 10 (7.52) | |
| Urologic disease, No. (%) | 4 (2.29) | 7 (5.26) | |
| Pneumonia, No. (%) | 6 (3.43) | 34 (25.56) | |
| Others, No. (%) | 15 (8.57) | 26 (19.55) |
| Model 1 | Model 2 | Model 3 | Image-Only Model | |
|---|---|---|---|---|
| Intercept | 0.42 | 0.48 | 0.47 | 0.89 |
| (0.24–0.76) | (0.27–0.88) | (0.26–0.85) | (0.67–1.19) | |
| Median pixel value | 1.08 | 1.08 | — | 1.19 |
| (0.75–1.55) | (0.74–1.56) | (0.86–1.64) | ||
| IQR of pixel values | 1.30 | 1.27 | 1.28 | 1.29 |
| (0.95–1.78) | (0.92–1.76) | (0.93–1.77) | (0.96–1.73) | |
| Number of feature points | 1.65 | 1.55 | 1.61 | 1.86 |
| (1.06–2.56) | (0.99–2.41) | (1.07–2.41) | (1.22–2.86) | |
| Age | — | 1.59 | 1.59 | — |
| (1.14–2.23) | (1.14–2.23) | |||
| Sex: female | 0.69 | 0.55 | 0.57 | — |
| (0.36–1.35) | (0.27–1.12) | (0.28–1.13) | ||
| BMI: not underweight | reference | reference | reference | — |
| BMI: underweight | 6.43 | 6.24 | 6.33 | — |
| (3.37–12.24) | (3.24–12.05) | (3.29–12.18) |
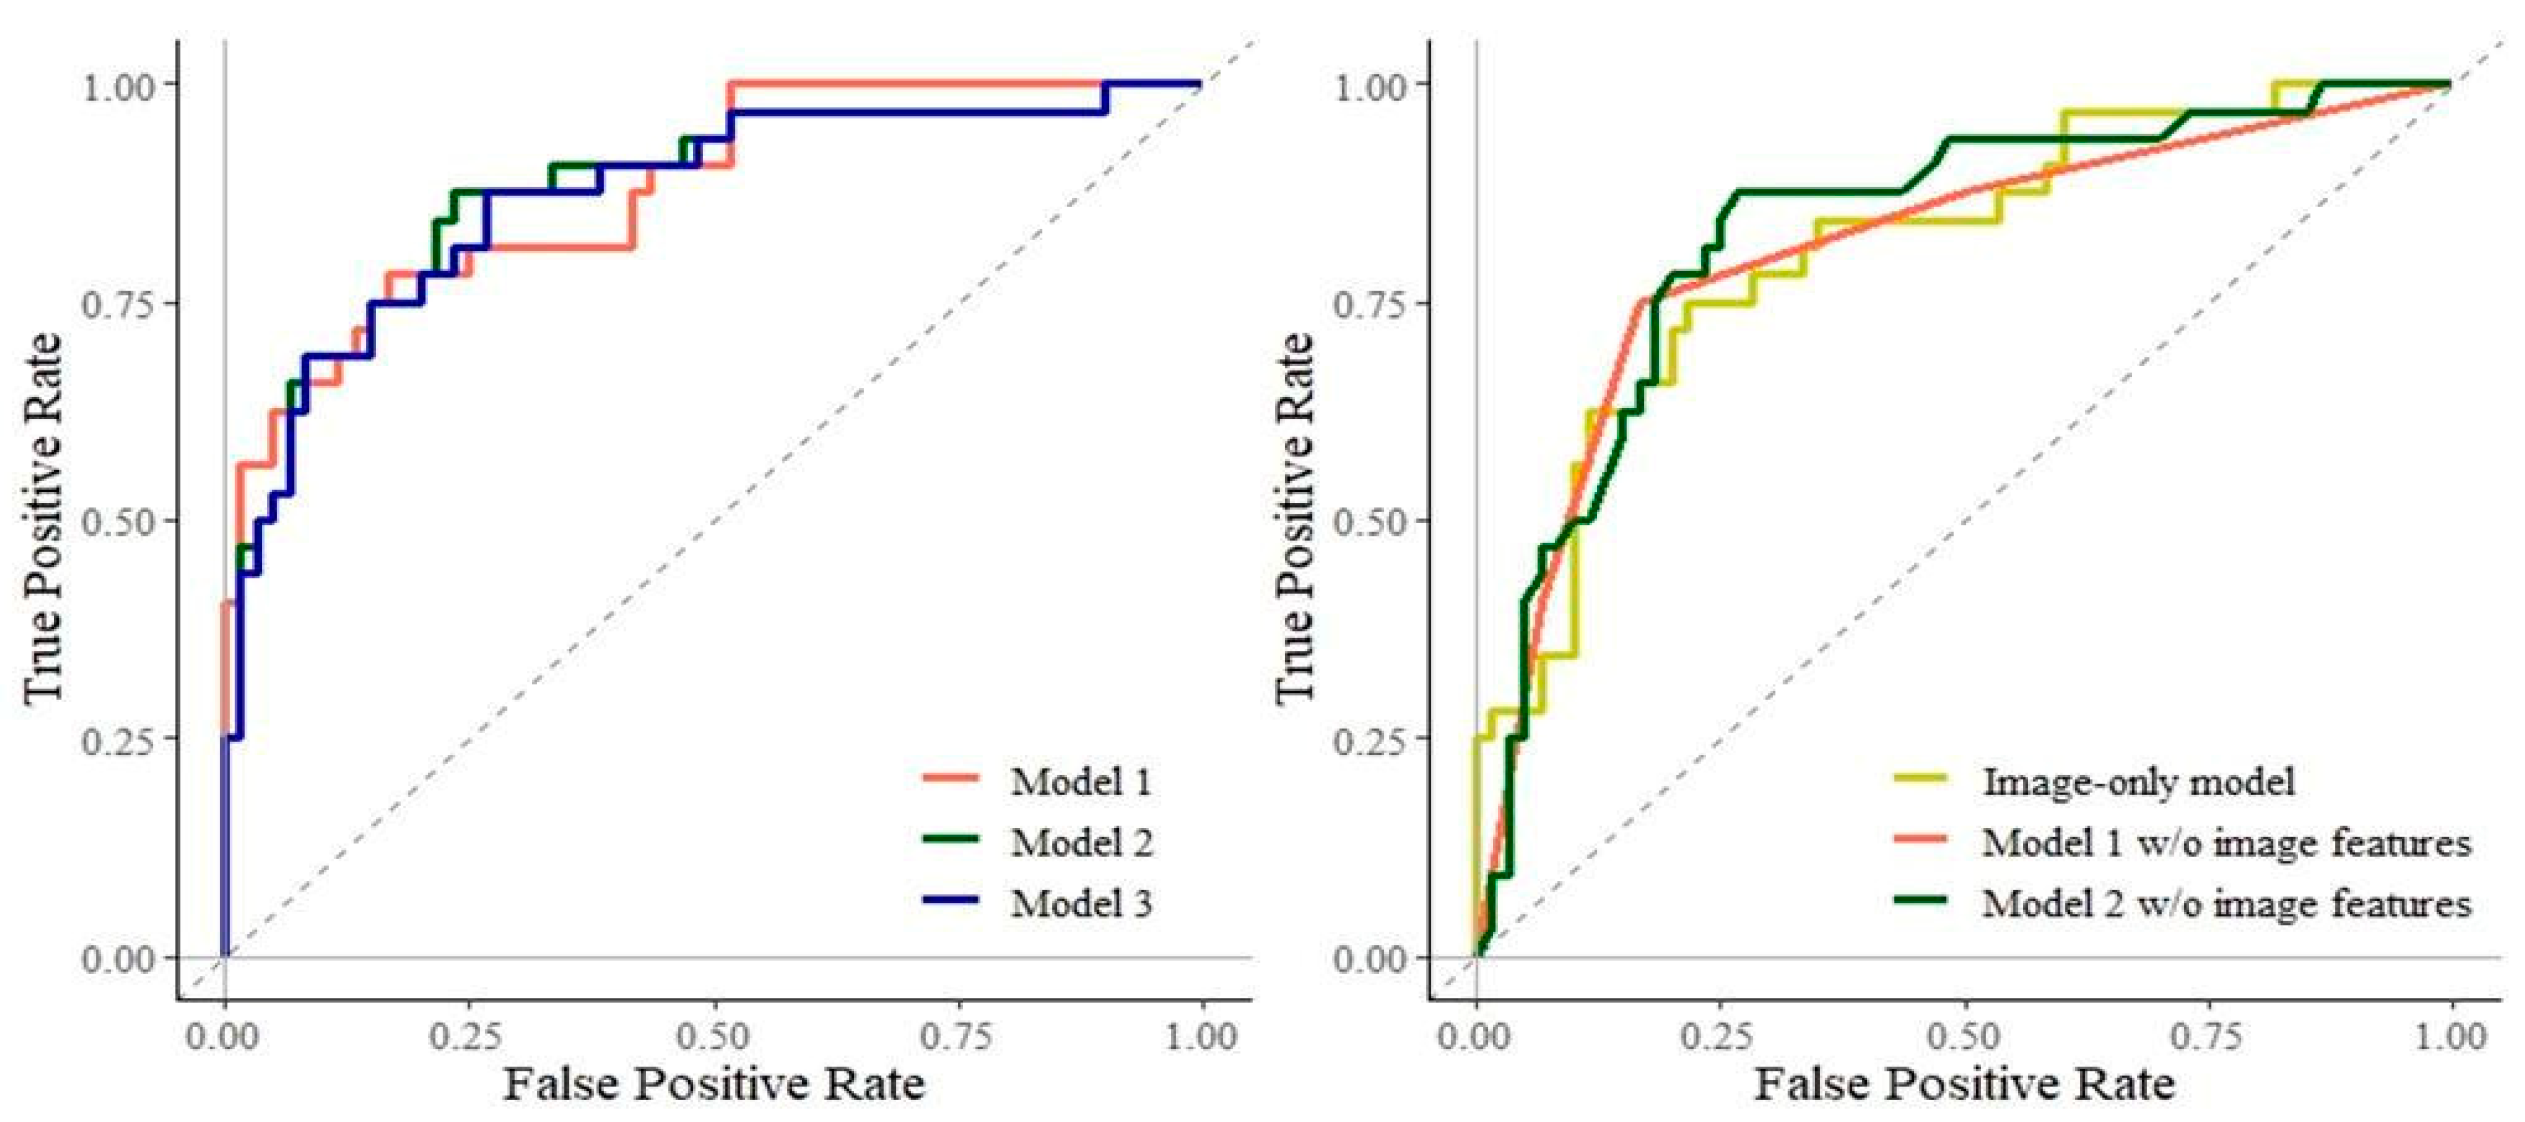
| ROC-AUC | Se (%) | Sp (%) | PPV (%) | NPV (%) | PR-AUC | |
|---|---|---|---|---|---|---|
| Model 1 | 0.876 | 75.00 | 85.00 | 72.73 | 86.44 | 0.838 |
| Model 1 w/o image features | 0.811 | 75.00 | 83.33 | 70.59 | 86.21 | 0.683 |
| Model 2 | 0.877 | 87.50 | 76.67 | 66.67 | 92.00 | 0.838 |
| Model 2 w/o image features | 0.832 | 87.50 | 73.33 | 63.64 | 91.67 | 0.670 |
| Model 3 | 0.871 | 87.50 | 73.33 | 63.64 | 91.67 | 0.816 |
| Image-only model | 0.814 | 71.88 | 80.00 | 65.71 | 84.21 | 0.726 |
Publisher’s Note: MDPI stays neutral with regard to jurisdictional claims in published maps and institutional affiliations. |
© 2021 by the authors. Licensee MDPI, Basel, Switzerland. This article is an open access article distributed under the terms and conditions of the Creative Commons Attribution (CC BY) license (https://creativecommons.org/licenses/by/4.0/).
Share and Cite
Sakai, K.; Gilmour, S.; Hoshino, E.; Nakayama, E.; Momosaki, R.; Sakata, N.; Yoneoka, D. A Machine Learning-Based Screening Test for Sarcopenic Dysphagia Using Image Recognition. Nutrients 2021, 13, 4009. https://doi.org/10.3390/nu13114009
Sakai K, Gilmour S, Hoshino E, Nakayama E, Momosaki R, Sakata N, Yoneoka D. A Machine Learning-Based Screening Test for Sarcopenic Dysphagia Using Image Recognition. Nutrients. 2021; 13(11):4009. https://doi.org/10.3390/nu13114009
Chicago/Turabian StyleSakai, Kotomi, Stuart Gilmour, Eri Hoshino, Enri Nakayama, Ryo Momosaki, Nobuo Sakata, and Daisuke Yoneoka. 2021. "A Machine Learning-Based Screening Test for Sarcopenic Dysphagia Using Image Recognition" Nutrients 13, no. 11: 4009. https://doi.org/10.3390/nu13114009