
Using Dietary Macronutrient Patterns to Predict Sarcopenic Obesity in Older Adults: A Representative Korean Nationwide Population-Based Study


Abstract
:1. Introduction
2. Materials and Methods
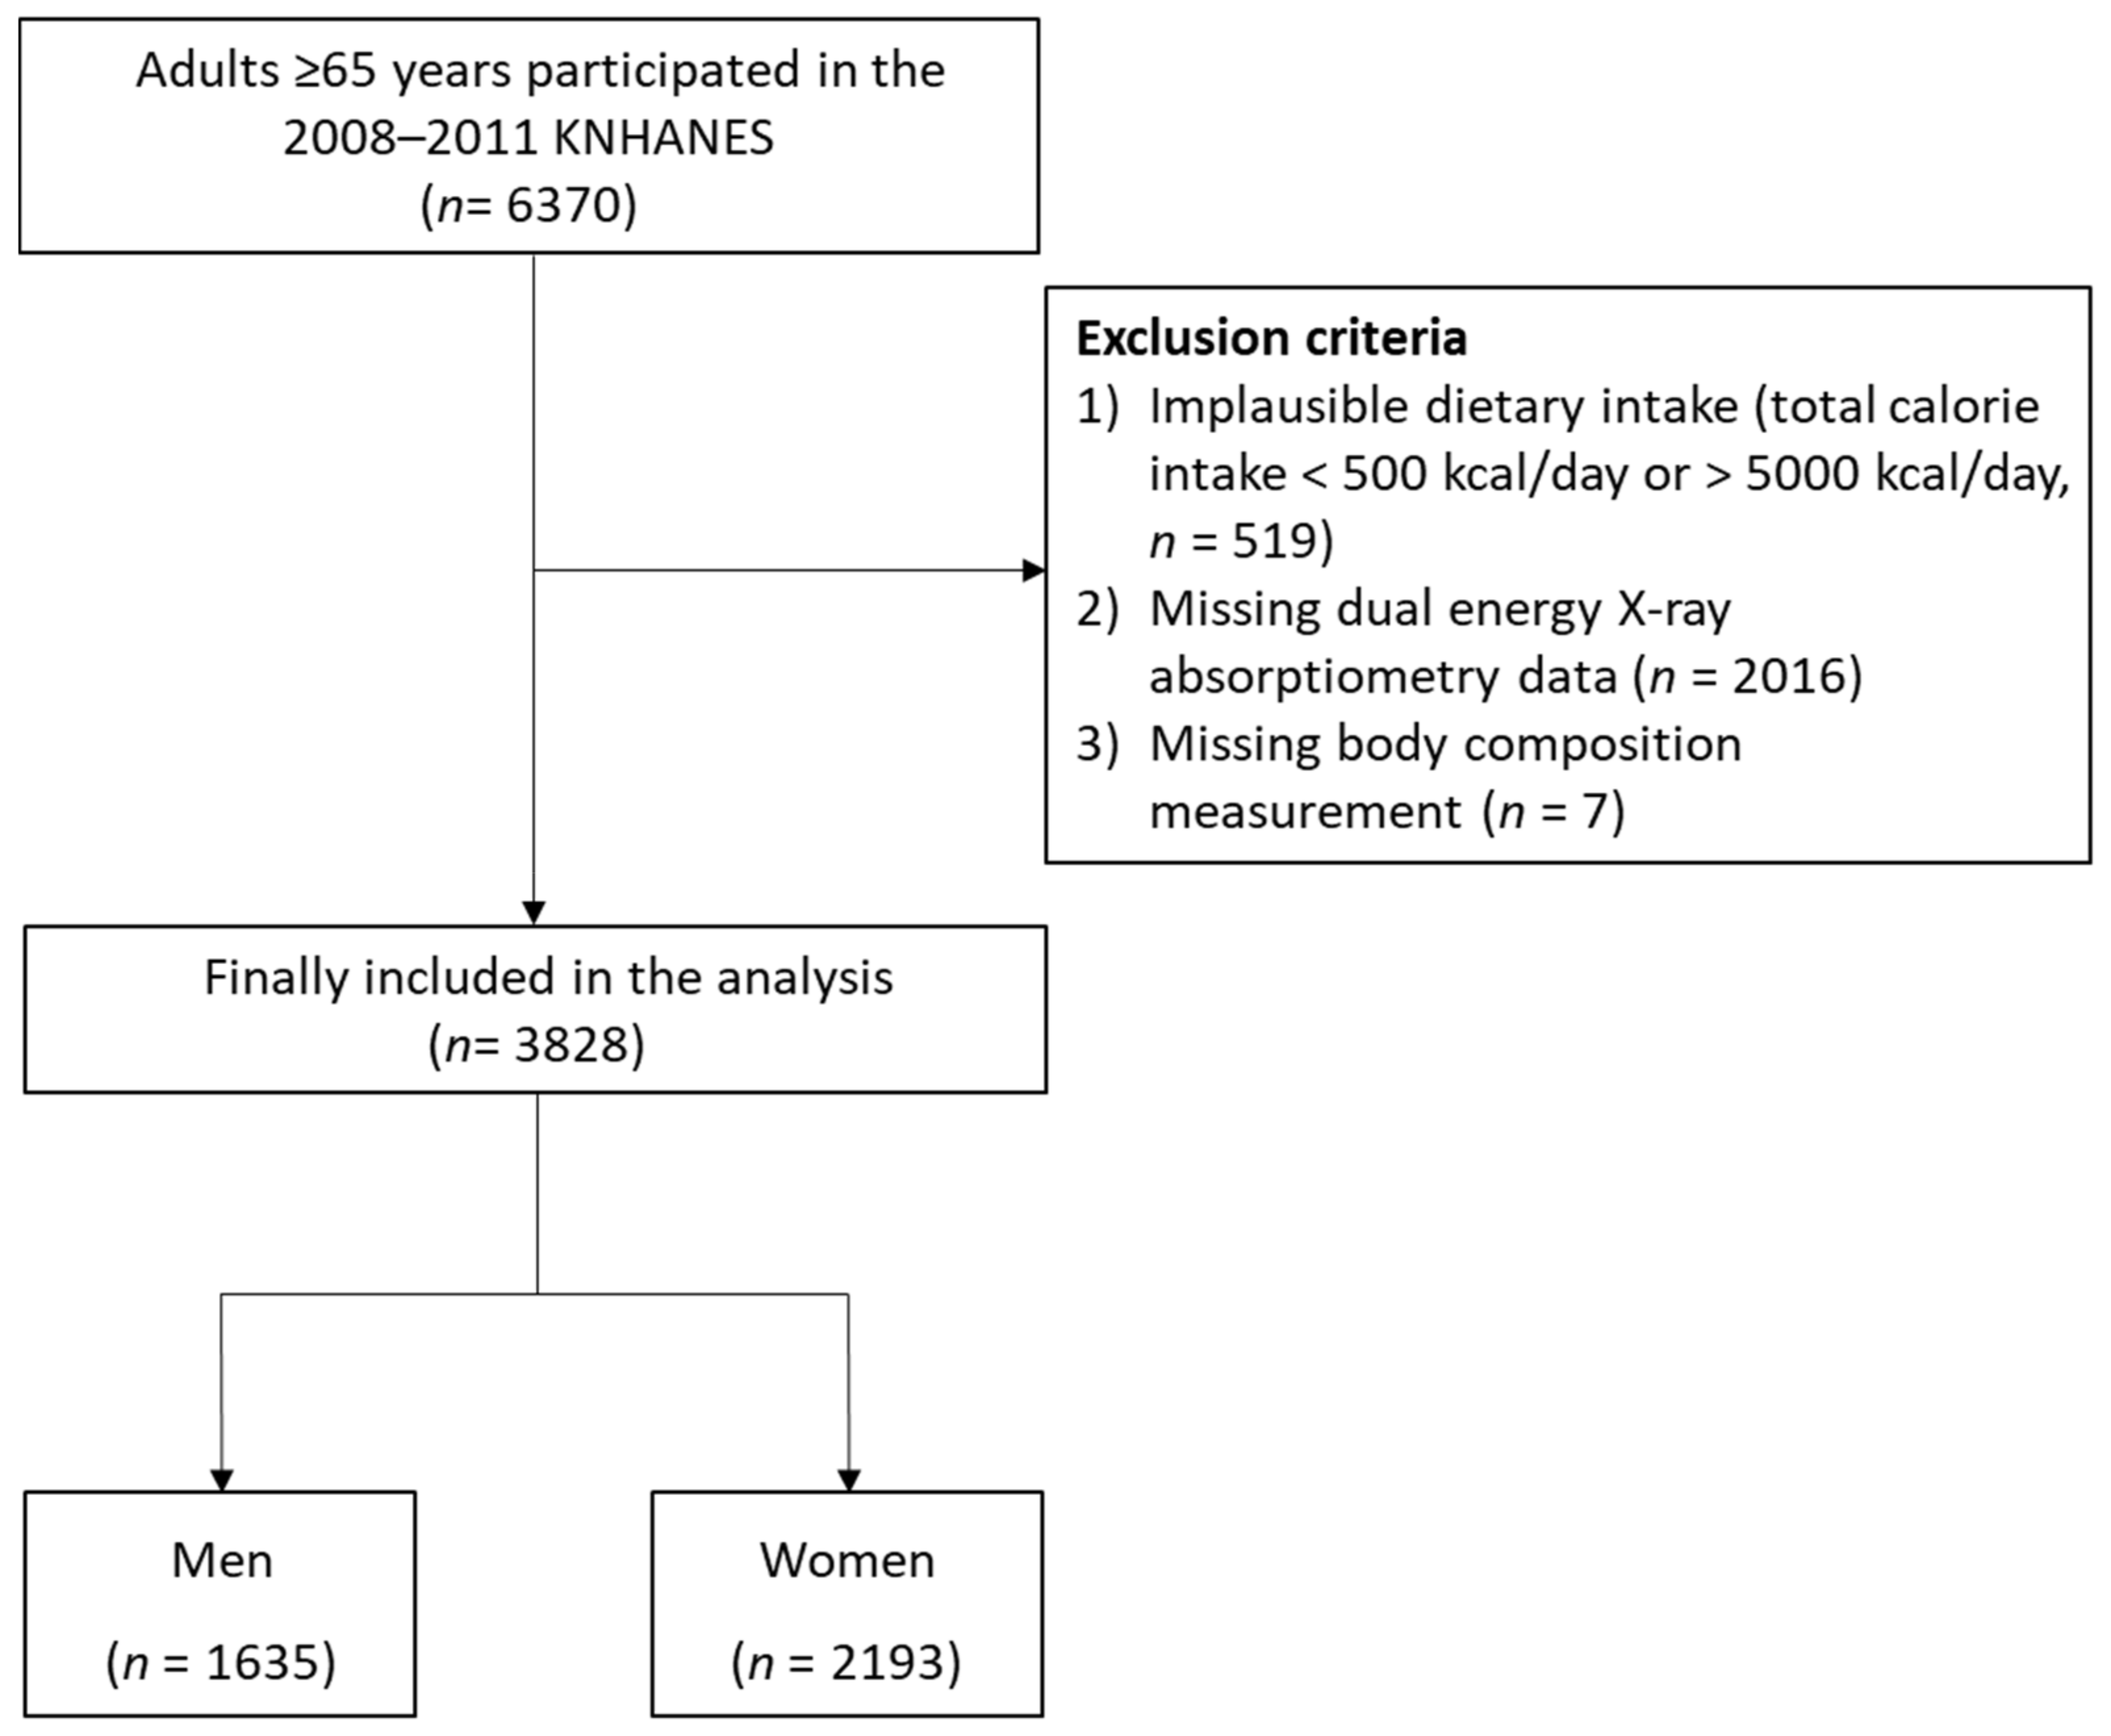
2.1. Study Population
2.2. Patterns of Macronutrient Intake
2.3. Assessment of SO
2.4. Covariates
2.5. Statistical Analysis
3. Results
3.1. Clinical Characteristics of the Study Population
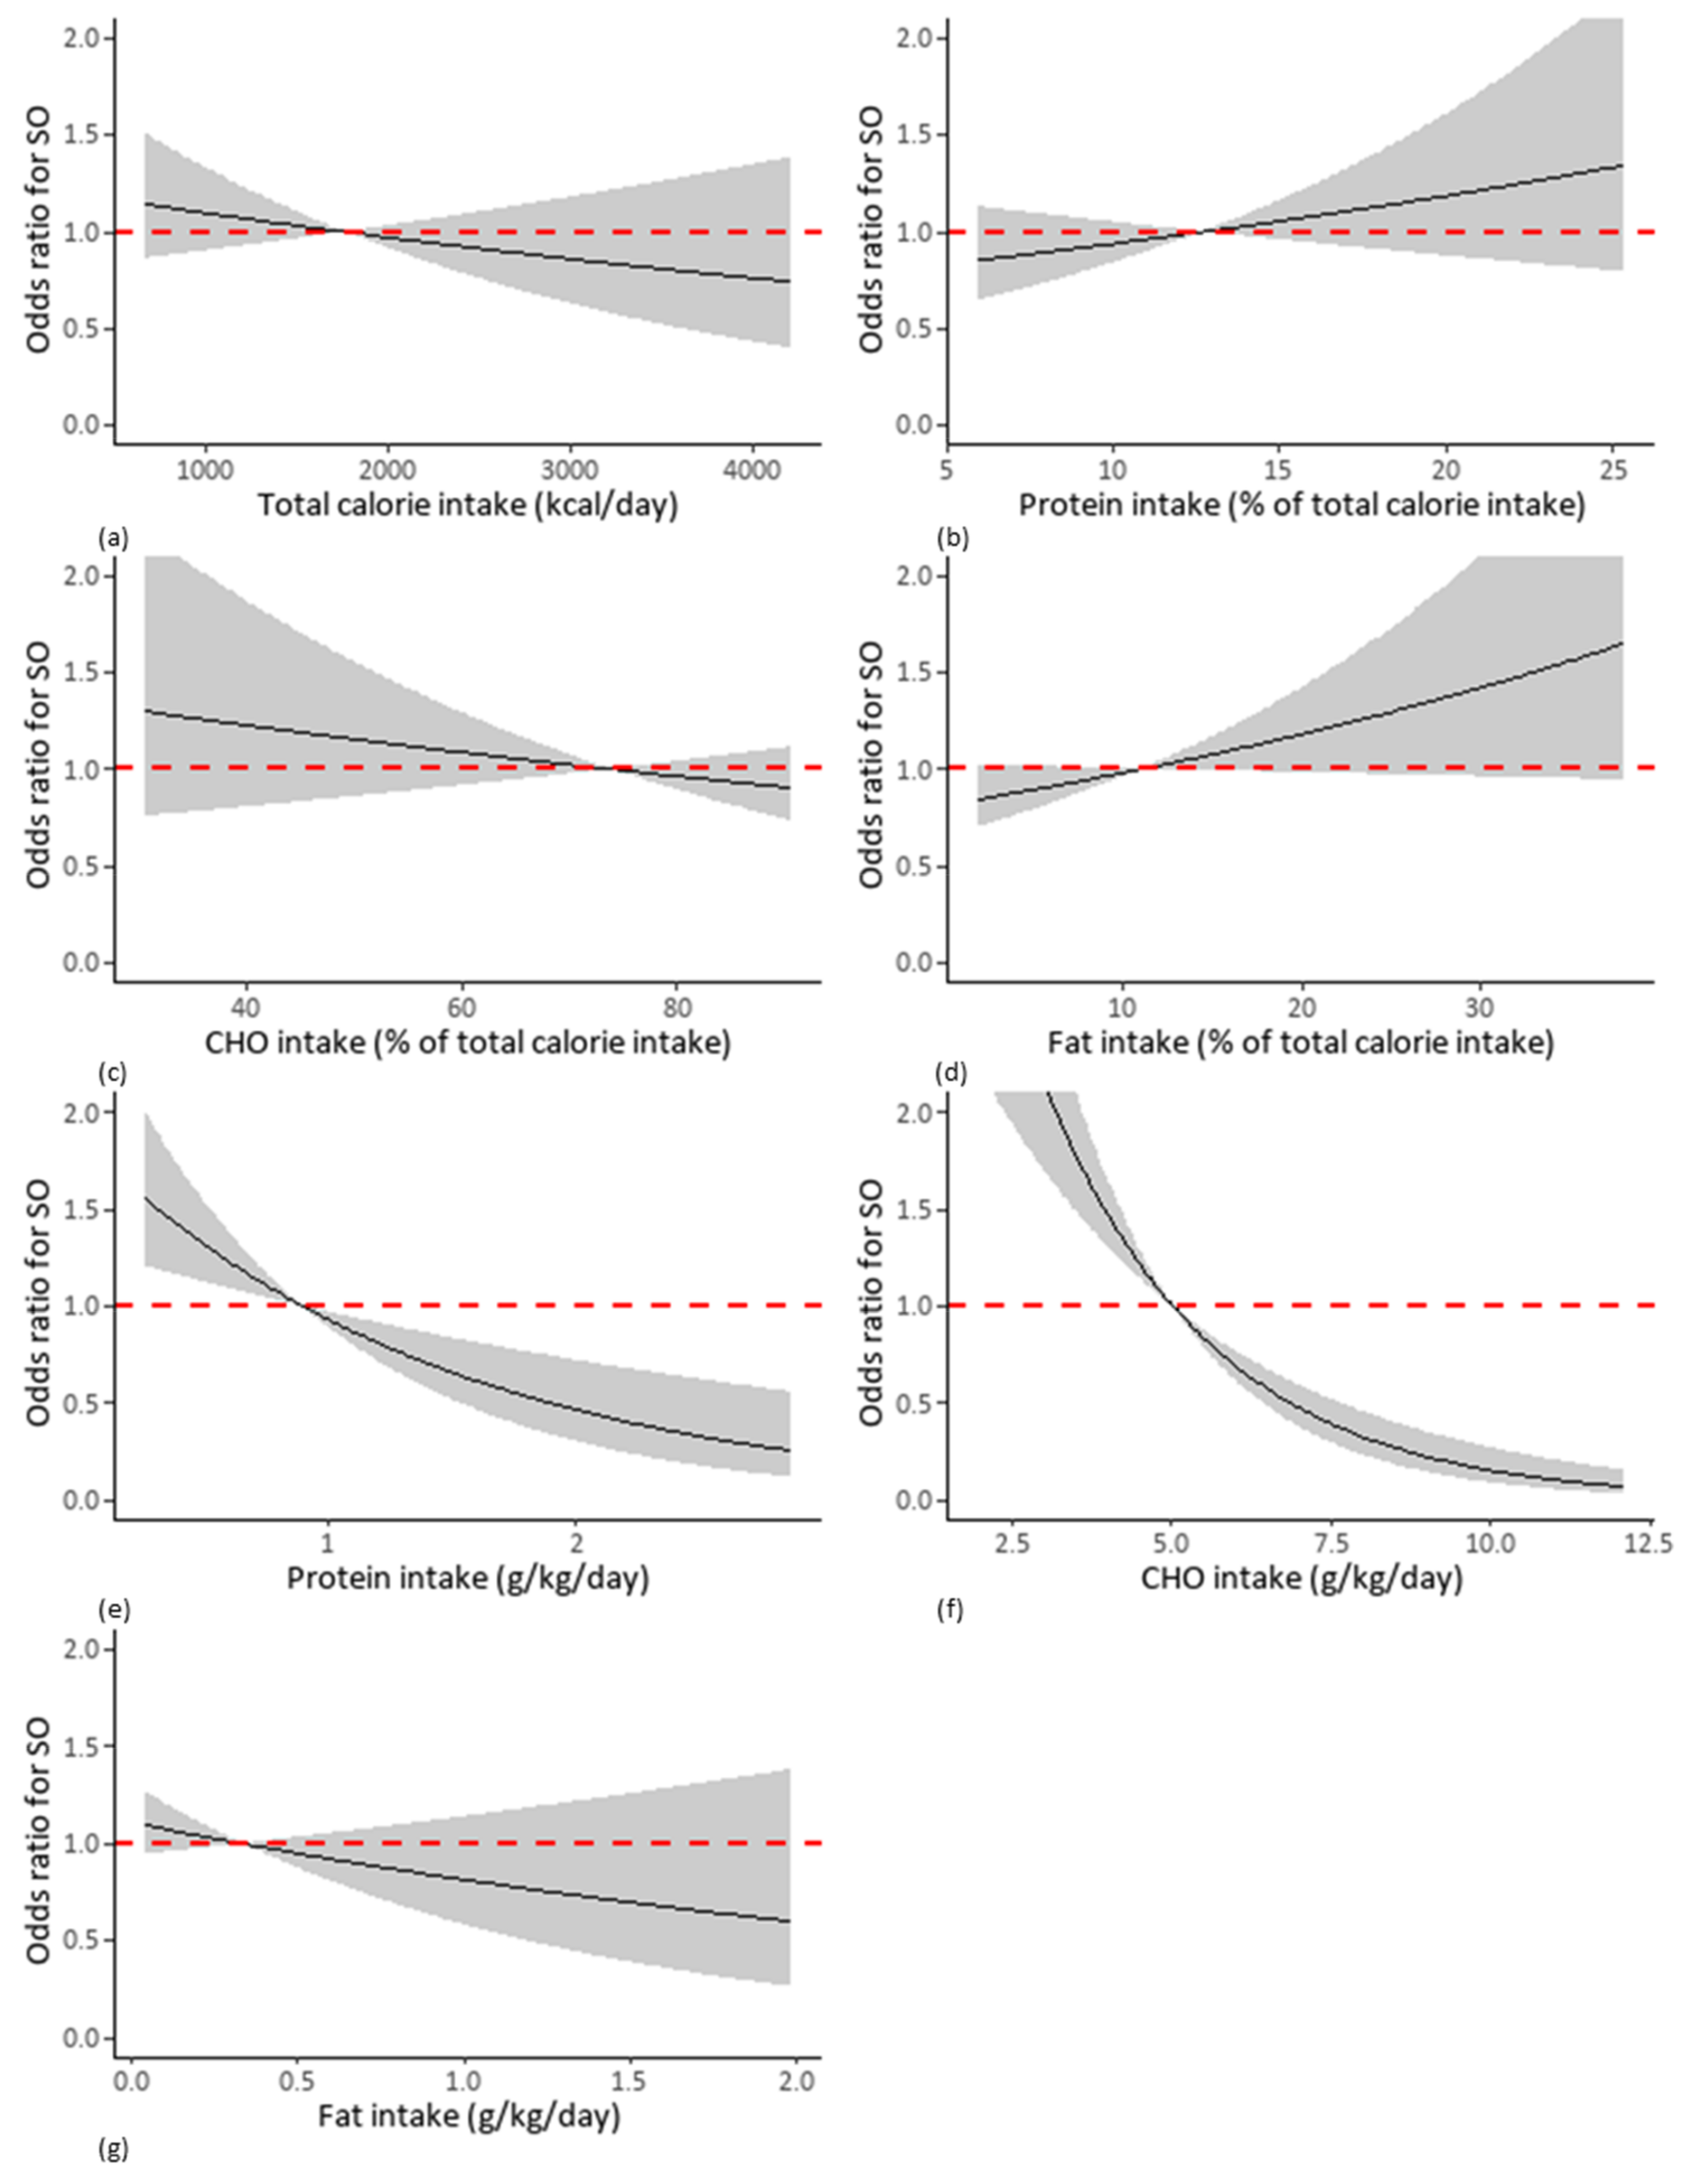
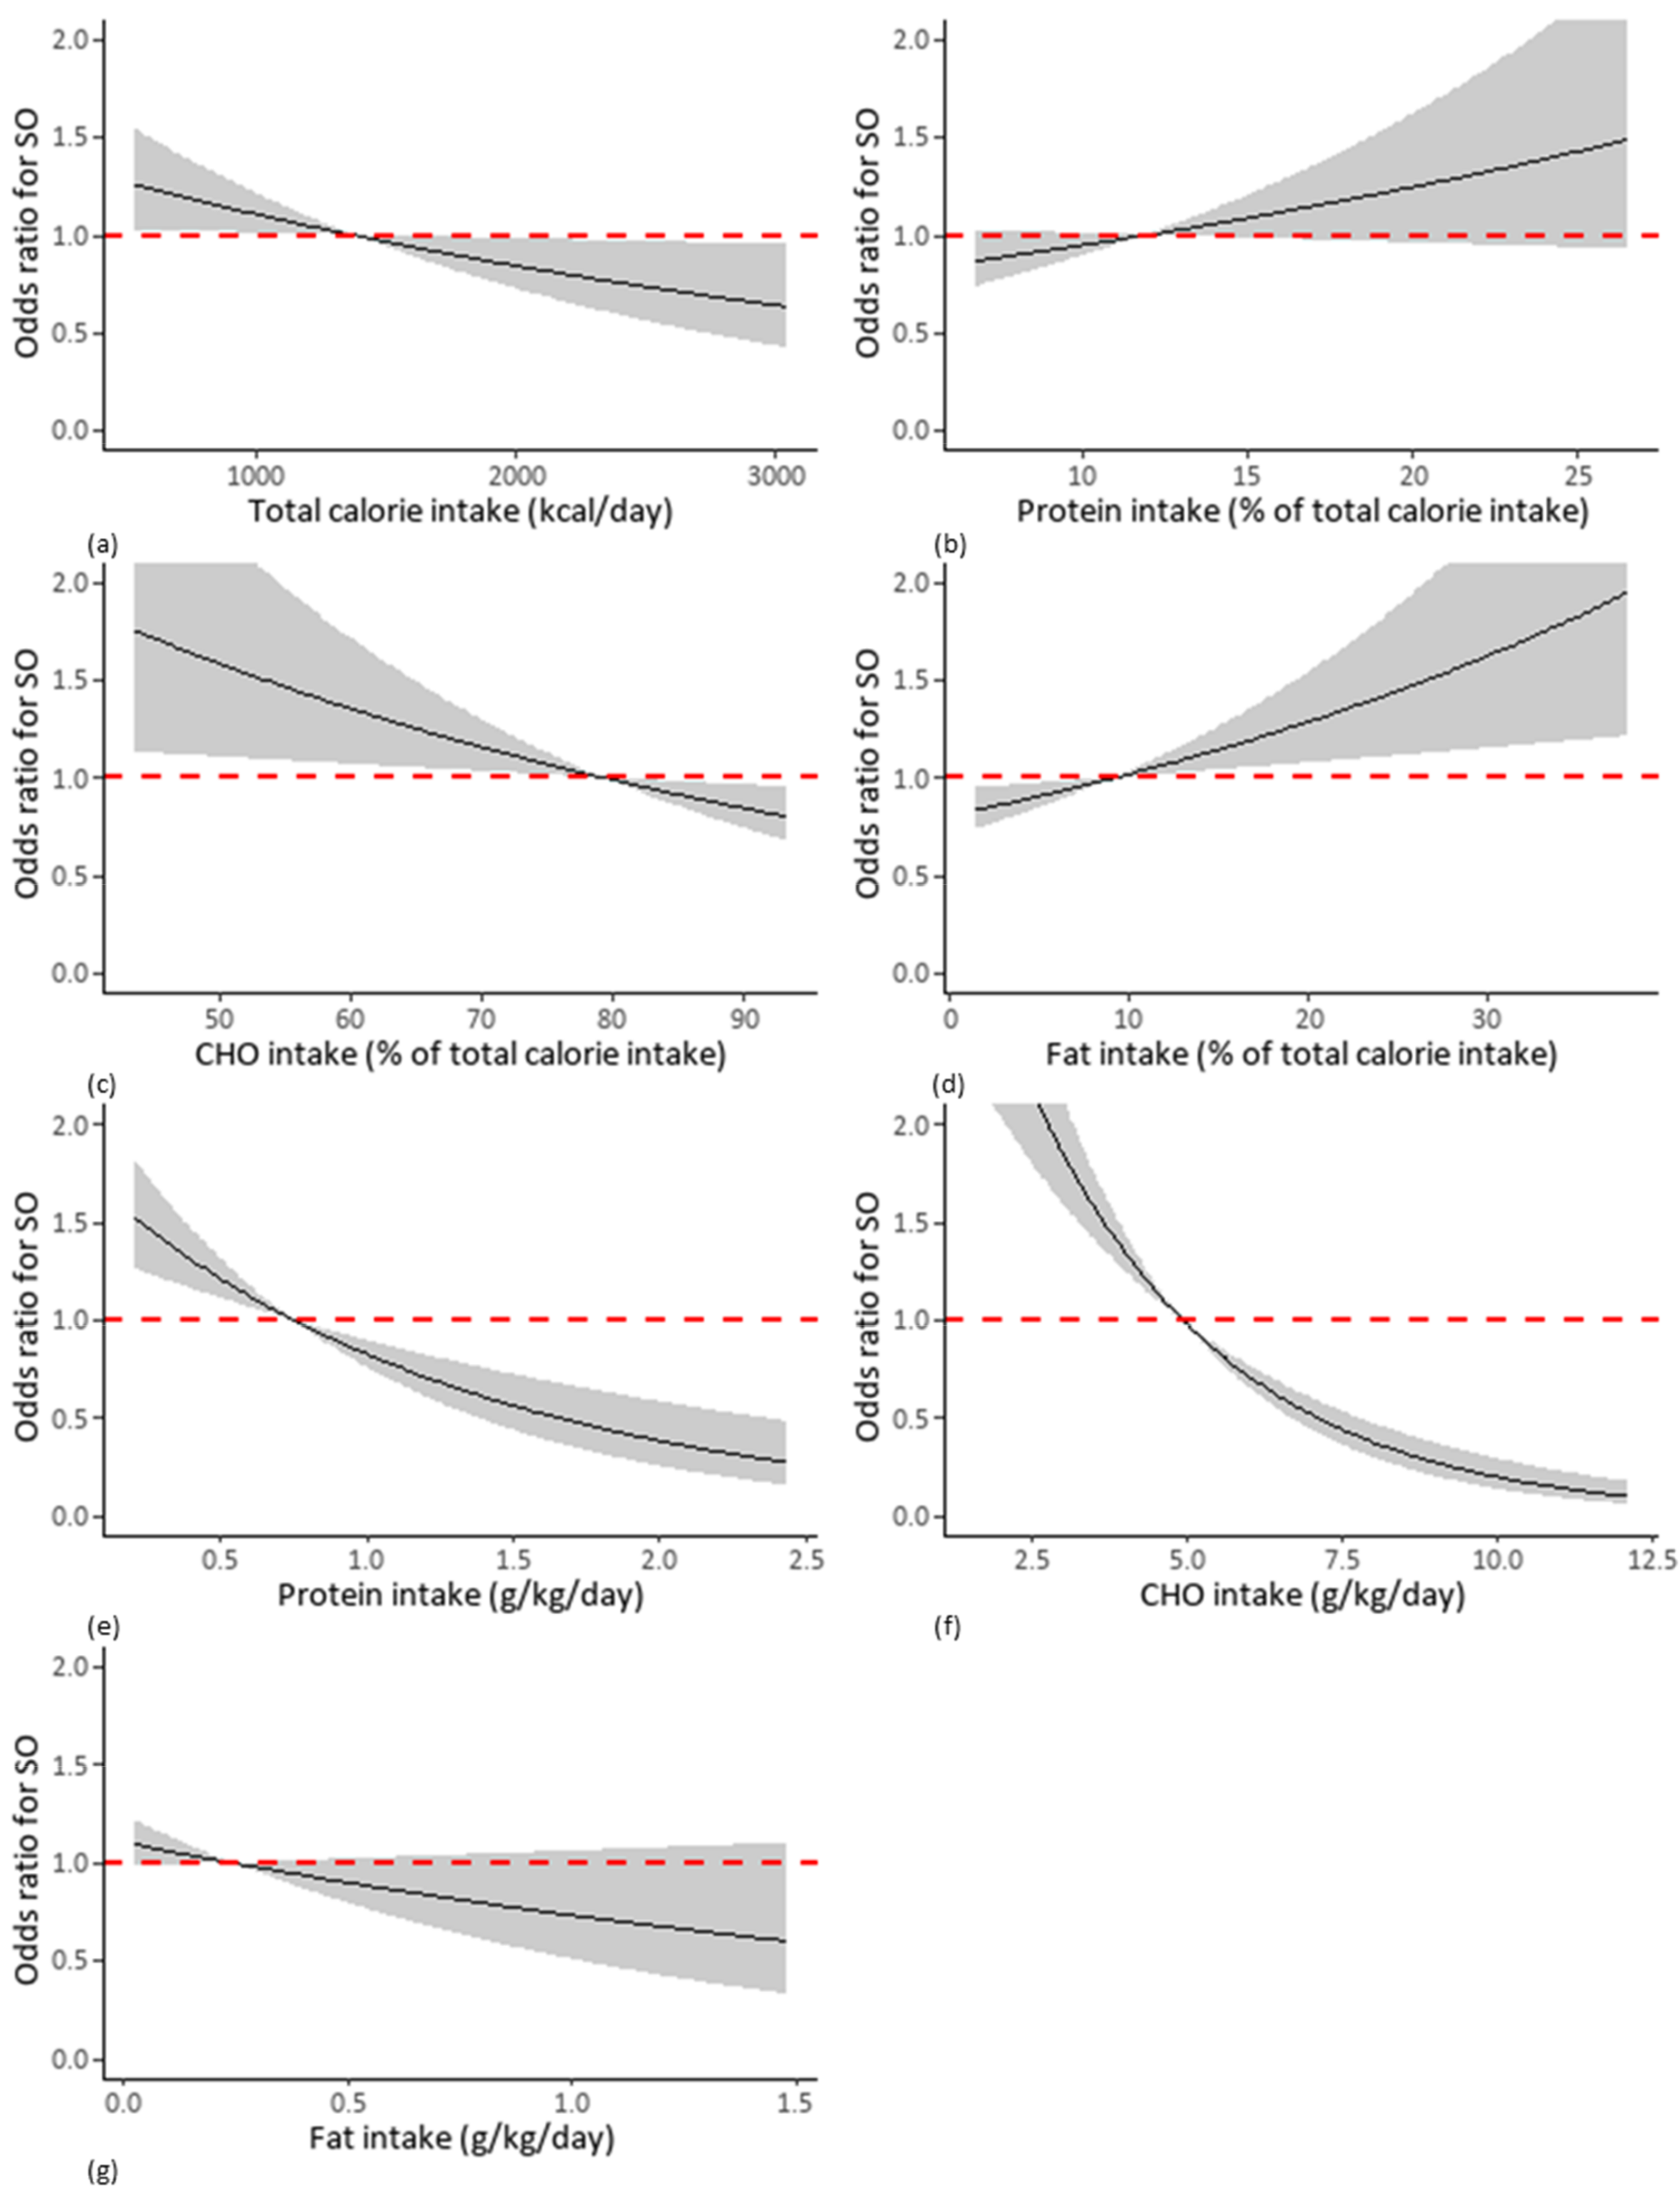
3.2. Relationship between Macronutrient Intake and SO
3.3. Comparison of the Predictive Power for SO of Macronutrient Intake
4. Discussion
5. Conclusions
Supplementary Materials
Author Contributions
Funding
Institutional Review Board Statement
Informed Consent Statement
Data Availability Statement
Acknowledgments
Conflicts of Interest
References
- Population Ageing and Development 2012. Available online: https://www.un.org/en/development/desa/population/publications/ageing/population-ageing-development-2012.asp (accessed on 18 September 2021).
- Population Projections for Korea (2017–2067). Available online: http://kostat.go.kr/portal/eng/pressReleases/8/8/index.board?bmode=download&bSeq=&aSeq=375684&ord=2 (accessed on 18 September 2021).
- Raguso, C.A.; Kyle, U.; Kossovsky, M.P.; Roynette, C.; Paoloni-Giacobino, A.; Hans, D.; Genton, L.; Pichard, C. A 3-year longitudinal study on body composition changes in the elderly: Role of physical exercise. Clin. Nutr. 2006, 25, 573–580. [Google Scholar] [CrossRef] [PubMed]
- Santanasto, A.J.; Goodpaster, B.H.; Kritchevsky, S.B.; Miljkovic, I.; Satterfield, S.; Schwartz, A.V.; Cummings, S.R.; Boudreau, R.M.; Harris, T.B.; Newman, A.B. Body composition remodeling and mortality: The health aging and body composition study. J. Gerontol. A Biol. Sci. Med. Sci. 2017, 72, 513–519. [Google Scholar] [CrossRef] [PubMed] [Green Version]
- Ponti, F.; Santoro, A.; Mercatelli, D.; Gasperini, C.; Conte, M.; Martucci, M.; Sangiorgi, L.; Franceschi, C.; Bazzocchi, A. Aging and imaging assessment of body composition: From fat to facts. Front. Endocrinol. (Lausanne) 2019, 10, 861. [Google Scholar] [CrossRef] [Green Version]
- Choi, K.M. Sarcopenia and sarcopenic obesity. Korean J. Intern. Med. 2016, 31, 1054–1060. [Google Scholar] [CrossRef] [PubMed] [Green Version]
- Huang, P.; Luo, K.; Xu, J.; Huang, W.; Yin, W.; Xiao, M.; Wang, Y.; Ding, M.; Huang, X. Sarcopenia as a risk factor for future hip fracture: A Meta-analysis of prospective cohort studies. J. Nutr. Health Aging 2021, 25, 183–188. [Google Scholar] [CrossRef]
- Chen, H.; Ma, J.; Liu, A.; Cui, Y.; Ma, X. The association between sarcopenia and fracture in middle-aged and elderly people: A systematic review and meta-analysis of cohort studies. Injury 2020, 51, 804–811. [Google Scholar] [CrossRef]
- Dwivedi, A.K.; Dubey, P.; Cistola, D.P.; Reddy, S.Y. Association between obesity and cardiovascular outcomes: Updated evidence from meta-analysis studies. Curr. Cardiol. Rep. 2020, 22, 25. [Google Scholar] [CrossRef] [PubMed]
- Lee, J.J.; Beretvas, S.N.; Freeland-Graves, J.H. Abdominal adiposity distribution in diabetic/prediabetic and nondiabetic populations: A meta-analysis. J. Obes. 2014, 2014, 697264. [Google Scholar] [CrossRef] [PubMed] [Green Version]
- Zhou, W.; Shi, Y.; Li, Y.Q.; Ping, Z.; Wang, C.; Liu, X.; Lu, J.; Mao, Z.X.; Zhao, J.; Yin, L.; et al. Body mass index, abdominal fatness, and hypertension incidence: A dose-response meta-analysis of prospective studies. J. Hum. Hypertens. 2018, 32, 321–333. [Google Scholar] [CrossRef]
- Zamboni, M.; Mazzali, G.; Fantin, F.; Rossi, A.; Di Francesco, V. Sarcopenic obesity: A new category of obesity in the elderly. Nutr. Metab. Cardiovasc. Dis. 2008, 18, 388–395. [Google Scholar] [CrossRef] [PubMed]
- Wang, H.; Hai, S.; Liu, Y.X.; Cao, L.; Liu, Y.; Liu, P.; Yang, Y.; Dong, B.R. Associations between sarcopenic obesity and cognitive impairment in elderly chinese community-dwelling individuals. J. Nutr. Health Aging 2019, 23, 14–20. [Google Scholar] [CrossRef] [PubMed]
- Kokkeler, K.J.E.; van den Berg, K.S.; Comijs, H.C.; Oude Voshaar, R.C.; Marijnissen, R.M. Sarcopenic obesity predicts nonremission of late-life depression. Int. J. Geriatr. Psychiatry 2019, 34, 1226–1234. [Google Scholar] [CrossRef]
- Atkinson, R.L., Jr.; Butterfield, G.; Dietz, W.; Fernstrom, J.; Frank, A.; Hansen, B.; Moore, B. Weight management: State of the science and opportunities for military programs. In Institute of Medicine (US) Subcommittee on Military Weight Management; National Academies Press: Washington, DC, USA, 2004. [Google Scholar] [CrossRef]
- Paddon-Jones, D.; Rasmussen, B.B. Dietary protein recommendations and the prevention of sarcopenia. Curr. Opin. Clin. Nutr. Metab. Care 2009, 12, 86–90. [Google Scholar] [CrossRef] [PubMed] [Green Version]
- Jane, L.; Atkinson, G.; Jaime, V.; Hamilton, S.; Waller, G.; Harrison, S. Intermittent fasting interventions for the treatment of overweight and obesity in adults aged 18 years and over: A systematic review protocol. JBI Database Syst. Rev. Implement. Rep. 2015, 13, 60–68. [Google Scholar] [CrossRef] [PubMed] [Green Version]
- Barnosky, A.R.; Hoddy, K.K.; Unterman, T.G.; Varady, K.A. Intermittent fasting vs daily calorie restriction for type 2 diabetes prevention: A review of human findings. Transl. Res. 2014, 164, 302–311. [Google Scholar] [CrossRef] [PubMed]
- Xiao, Q.; Garaulet, M.; Scheer, F. Meal timing and obesity: Interactions with macronutrient intake and chronotype. Int. J. Obes. 2019, 43, 1701–1711. [Google Scholar] [CrossRef] [PubMed]
- Anderson, J.W.; Baird, P.; Davis, R.H., Jr.; Ferreri, S.; Knudtson, M.; Koraym, A.; Waters, V.; Williams, C.L. Health benefits of dietary fiber. Nutr. Rev. 2009, 67, 188–205. [Google Scholar] [CrossRef] [PubMed]
- Sartorius, K.; Sartorius, B.; Madiba, T.E.; Stefan, C. Does high-carbohydrate intake lead to increased risk of obesity? A systematic review and meta-analysis. BMJ Open 2018, 8, e018449. [Google Scholar] [CrossRef] [Green Version]
- Jung, H.W.; Kim, S.W.; Kim, I.Y.; Lim, J.Y.; Park, H.S.; Song, W.; Yoo, H.J.; Jang, H.C.; Kim, K.; Park, Y.; et al. Protein intake recommendation for korean older adults to prevent sarcopenia: Expert consensus by the Korean Geriatric Society and the Korean Nutrition Society. Ann. Geriatr. Med. Res. 2018, 22, 167–175. [Google Scholar] [CrossRef] [PubMed] [Green Version]
- Porter Starr, K.N.; Pieper, C.F.; Orenduff, M.C.; McDonald, S.R.; McClure, L.B.; Zhou, R.; Payne, M.E.; Bales, C.W. Improved function with enhanced protein intake per meal: A pilot study of weight reduction in frail, obese older adults. J. Gerontol. A Biol. Sci. Med. Sci. 2016, 71, 1369–1375. [Google Scholar] [CrossRef] [PubMed]
- Petroni, M.L.; Caletti, M.T.; Dalle Grave, R.; Bazzocchi, A.; Aparisi Gómez, M.P.; Marchesini, G. Prevention and treatment of sarcopenic obesity in women. Nutrients 2019, 11, 1302. [Google Scholar] [CrossRef] [PubMed] [Green Version]
- Park, Y.; Choi, J.E.; Hwang, H.S. Protein supplementation improves muscle mass and physical performance in undernourished prefrail and frail elderly subjects: A randomized, double-blind, placebo-controlled trial. Am. J. Clin. Nutr. 2018, 108, 1026–1033. [Google Scholar] [CrossRef] [PubMed]
- Kim, B.Y.; Kang, S.M.; Kang, J.H.; Kang, S.Y.; Kim, K.K.; Kim, K.B.; Kim, B.; Kim, S.J.; Kim, Y.H.; Kim, J.H.; et al. 2020 Korean society for the study of obesity guidelines for the management of obesity in Korea. J. Obes. Metab. Syndr. 2021, 30, 81–92. [Google Scholar] [CrossRef] [PubMed]
- Kweon, S.; Kim, Y.; Jang, M.-j.; Kim, Y.; Kim, K.; Choi, S.; Chun, C.; Khang, Y.-H.; Oh, K. Data resource profile: The Korea National Health and Nutrition Examination Survey (KNHANES). Int. J. Epidemiol. 2014, 43, 69–77. [Google Scholar] [CrossRef] [Green Version]
- Kim, Y. The Korea National Health and Nutrition Examination Survey (KNHANES): Current status and challenges. Epidemiol. Health 2014, 36, e2014002. [Google Scholar] [CrossRef] [PubMed] [Green Version]
- Deierlein, A.L.; Morland, K.B.; Scanlin, K.; Wong, S.; Spark, A. Diet quality of urban older adults age 60 to 99 years: The cardiovascular health of seniors and built environment study. J. Acad. Nutr. Diet. 2014, 114, 279–287. [Google Scholar] [CrossRef] [PubMed] [Green Version]
- Madden, J.P.; Goodman, S.J.; Guthrie, H.A. Validity of the 24-hr. recall. Analysis of data obtained from elderly subjects. J. Am. Diet. Assoc. 1976, 68, 143–147. [Google Scholar]
- Kwon, Y.-J.; Lee, H.S.; Park, J.-Y.; Lee, J.-W. Associating intake proportion of carbohydrate, fat, and protein with all-cause mortality in Korean adults. Nutrients 2020, 12, 3208. [Google Scholar] [CrossRef]
- Seo, M.H.; Lee, W.-Y.; Kim, S.S.; Kang, J.-H.; Kang, J.-H.; Kim, K.K.; Kim, B.-Y.; Kim, Y.-H.; Kim, W.-J.; Kim, E.M.; et al. 2018 Korean society for the study of obesity guideline for the management of obesity in Korea. J. Obes. Metab. Syndr. 2019, 28, 40–45. [Google Scholar] [CrossRef] [PubMed]
- Studenski, S.A.; Peters, K.W.; Alley, D.E.; Cawthon, P.M.; McLean, R.R.; Harris, T.B.; Ferrucci, L.; Guralnik, J.M.; Fragala, M.S.; Kenny, A.M.; et al. The FNIH sarcopenia project: Rationale, study description, conference recommendations, and final estimates. J. Gerontol. Ser. A Biol. Sci. Med. Sci. 2014, 69, 547–558. [Google Scholar] [CrossRef]
- Lee, S.Y.; Park, H.S.; Kim, D.J.; Han, J.H.; Kim, S.M.; Cho, G.J.; Kim, D.Y.; Kwon, H.S.; Kim, S.R.; Lee, C.B.; et al. Appropriate waist circumference cutoff points for central obesity in Korean adults. Diabetes Res. Clin. Pract. 2007, 75, 72–80. [Google Scholar] [CrossRef] [PubMed]
- Craig, C.L.; Marshall, A.L.; Sjöström, M.; Bauman, A.E.; Booth, M.L.; Ainsworth, B.E.; Pratt, M.; Ekelund, U.; Yngve, A.; Sallis, J.F.; et al. International physical activity questionnaire: 12-country reliability and validity. Med. Sci. Sports Exerc. 2003, 35, 1381–1395. [Google Scholar] [CrossRef] [Green Version]
- Charlson, M.E.; Pompei, P.; Ales, K.L.; MacKenzie, C.R. A new method of classifying prognostic comorbidity in longitudinal studies: Development and validation. J. Chronic Dis. 1987, 40, 373–383. [Google Scholar] [CrossRef]
- Manore, M.M. Exercise and the Institute of Medicine recommendations for nutrition. Curr. Sports Med. Rep. 2005, 4, 193–198. [Google Scholar] [CrossRef] [PubMed]
- Haizlip, K.M.; Harrison, B.C.; Leinwand, L.A. Sex-based differences in skeletal muscle kinetics and fiber-type composition. Physiology 2015, 30, 30–39. [Google Scholar] [CrossRef]
- Horton, T.J.; Dow, S.; Armstrong, M.; Donahoo, W.T. Greater systemic lipolysis in women compared with men during moderate-dose infusion of epinephrine and/or norepinephrine. J. Appl. Physiol. 2009, 107, 200–210. [Google Scholar] [CrossRef] [PubMed] [Green Version]
- Karastergiou, K.; Smith, S.R.; Greenberg, A.S.; Fried, S.K. Sex differences in human adipose tissues—The biology of pear shape. Biol. Sex Differ. 2012, 3, 13. [Google Scholar] [CrossRef] [PubMed] [Green Version]
- Okamura, T.; Miki, A.; Hashimoto, Y.; Kaji, A.; Sakai, R.; Osaka, T.; Hamaguchi, M.; Yamazaki, M.; Fukui, M. Shortage of energy intake rather than protein intake is associated with sarcopenia in elderly patients with type 2 diabetes: A cross-sectional study of the KAMOGAWA-DM cohort. J Diabetes 2019, 11, 477–483. [Google Scholar] [CrossRef]
- Kye, S.; Kwon, S.O.; Lee, S.Y.; Lee, J.; Kim, B.H.; Suh, H.J.; Moon, H.K. Under-reporting of energy intake from 24-hour dietary recalls in the Korean National Health and Nutrition Examination Survey. Osong Public Health Res. Perspect. 2014, 5, 85–91. [Google Scholar] [CrossRef] [PubMed] [Green Version]
- Kim, S.; Park, H.; Yun, H.; Lee, B.; Park, C.Y. Accuracy of 24-hour diet recalls in older Korean women. Curr. Dev. Nutr. 2020, 4, 1427. [Google Scholar] [CrossRef]
- Zafar, M.I.; Mills, K.E.; Zheng, J.; Peng, M.M.; Ye, X.; Chen, L.L. Low glycaemic index diets as an intervention for obesity: A systematic review and meta-analysis. Obes. Rev. 2019, 20, 290–315. [Google Scholar] [CrossRef] [PubMed]
- Schwingshackl, L.; Hoffmann, G. Long-term effects of low glycemic index/load vs. high glycemic index/load diets on parameters of obesity and obesity-associated risks: A systematic review and meta-analysis. Nutr. Metab. Cardiovasc. Dis. 2013, 23, 699–706. [Google Scholar] [CrossRef] [PubMed]
- Lim, M.T.; Pan, B.J.; Toh, D.W.K.; Sutanto, C.N.; Kim, J.E. Animal protein versus plant protein in supporting lean mass and muscle strength: A systematic review and meta-analysis of randomized controlled trials. Nutrients 2021, 13, 661. [Google Scholar] [CrossRef] [PubMed]


| Men | Women | |||||
|---|---|---|---|---|---|---|
| Without SO | With SO | p | Without SO | With SO | p * | |
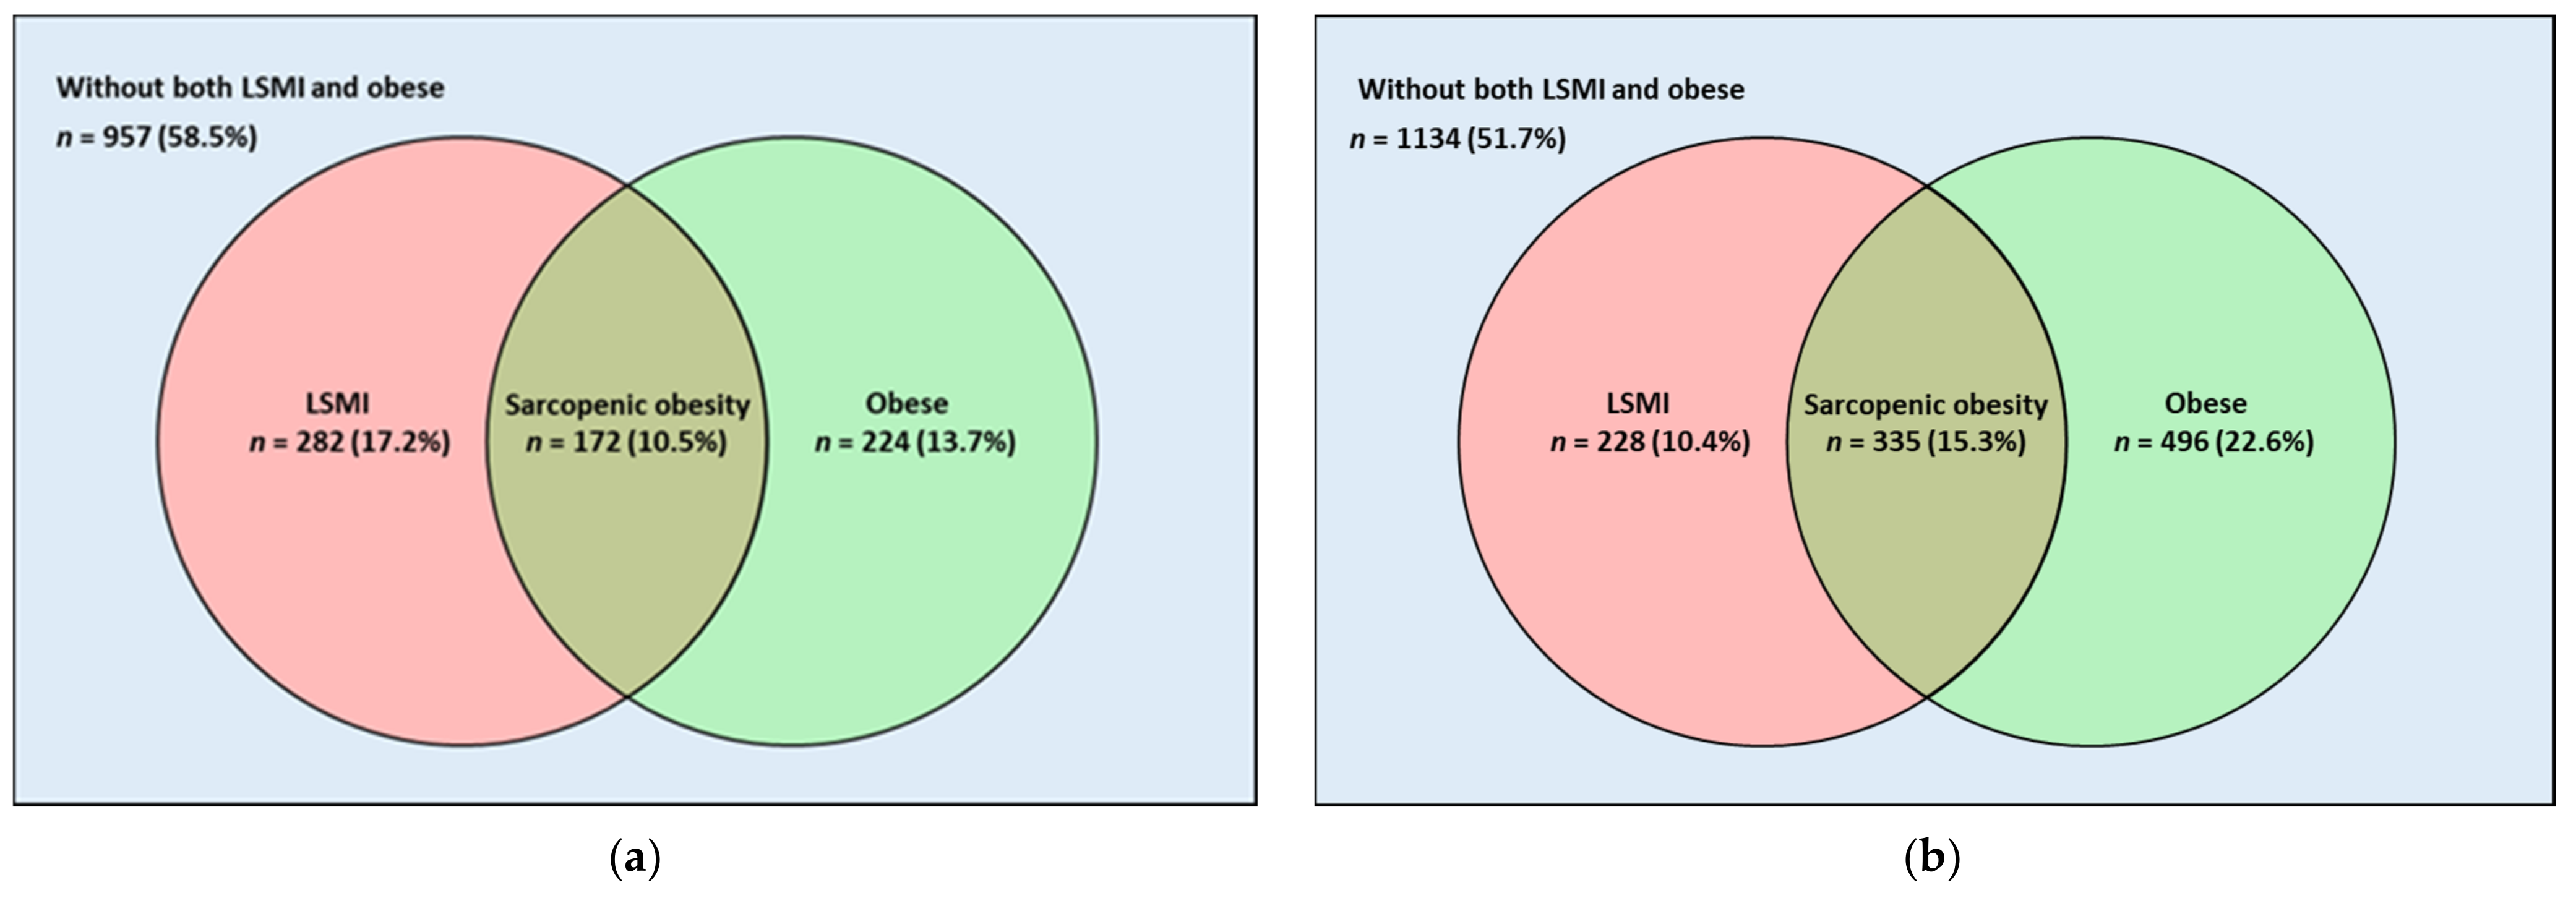
| Unweighted number, n | 1463 | 172 | 1858 | 335 | ||
| Age, years | 72.0 ± 0.2 | 72.9 ± 0.5 | 0.083 | 73.1 ± 0.2 | 73.5 ± 0.4 | 0.432 |
| BMI, kg/m2 | 22.6 ± 0.1 | 27.1 ± 0.1 | <0.001 | 23.4 ± 0.1 | 27.8 ± 0.2 | <0.001 |
| Waist circumference, cm | 83.6 ± 0.3 | 94.8 ± 0.5 | <0.001 | 81.9 ± 0.3 | 91.7 ± 0.5 | <0.001 |
| Abdominal obesity, % (SE) | 23.5 (1.4) | 81.3 (3.7) | <0.001 | 36.7 (1.4) | 81.7 (2.6) | <0.001 |
| MBP, mmHg | 94.4 ± 0.4 | 96.7 ± 0.9 | 0.020 | 95.1 ± 0.3 | 95.8 ± 0.8 | 0.445 |
| Regular exercise, % (SE) | 20.4 (1.6) | 23.5 (4.1) | 0.488 | 16.9 (1.2) | 9.6 (1.7) | 0.002 |
| Smoking status, % (SE) | 0.173 | 0.410 | ||||
| Never smoker | 16.1 (1.2) | 18.3 (3.2) | 88.6 (1.0) | 91.1 (1.8) | ||
| Former smoker | 28.6 (1.5) | 33.6 (4.5) | 2.3 (0.6) | 2.1 (0.8) | ||
| Someday smoker | 30.2 (1.6) | 31.9 (4.5) | 3.2 (0.5) | 3.6 (1.2) | ||
| Every day smoker | 25.1 (1.3) | 16.2 (3.2) | 5.9 (0.7) | 3.3 (1.0) | ||
| Alcohol intake, g/day | 8.8 ± 0.4 | 7.7 ± 1.3 | 0.391 | 0.8 ± 0.1 | 0.5 ± 0.2 | 0.208 |
| Glucose, mg/dL | 104.0 ± 0.8 | 111.2 ± 2.4 | 0.004 | 104.4 ± 0.9 | 109.0 ± 1.5 | 0.010 |
| Total cholesterol, mg/dL | 180.4 ± 1.2 | 185.1 ± 3.4 | 0.183 | 198.2 ± 1.1 | 207.3 ± 2.8 | 0.003 |
| Total calorie intake, kcal/day | 1881.3 ± 26.1 | 1833.1 ± 52.8 | 0.429 | 1428.9 ± 14.8 | 1338.2 ± 32.0 | 0.007 |
| Percent of CHO intake, % | 71.5 ± 0.4 | 70.1 ± 1.0 | 0.201 | 77.7 ± 0.3 | 76.1 ± 0.6 | 0.014 |
| Percent of protein intake, % | 13.2 ± 0.1 | 13.5 ± 0.3 | 0.343 | 12.3 ± 0.1 | 12.8 ± 0.3 | 0.065 |
| Percent of fat intake, % | 12.2 ± 0.2 | 13.4 ± 0.6 | 0.068 | 10.4 ± 0.2 | 11.6 ± 0.4 | 0.015 |
| CHO intake, g/kg/day | 5.4 ± 0.1 | 4.4 ± 0.1 | <0.001 | 5.2 ± 0.1 | 4.2 ± 0.1 | <0.001 |
| Protein intake, g/kg/day | 1.0 ± 0.0 | 0.9 ± 0.0 | 0.001 | 0.8 ± 0.0 | 0.7 ± 0.0 | <0.001 |
| Fat intake, g/kg/day | 0.4 ± 0.0 | 0.4 ± 0.0 | 0.384 | 0.3 ± 0.0 | 0.3 ± 0.0 | 0.213 |
| Skeletal muscle mass index | 0.861 ± 0.003 | 0.723 ± 0.004 | <0.001 | 0.578 ± 0.002 | 0.464 ± 0.003 | <0.001 |
| Number of chronic diseases, % (SE) | <0.001 | <0.001 | ||||
| 0 | 63.1 (1.6) | 41.4 (5.0) | 65.2 (1.5) | 52.2 (3.4) | ||
| 1 | 26.3 (1.4) | 38.4 (5.0) | 28.3 (1.3) | 35.3 (3.3) | ||
| ≥2 | 10.6 (1.0) | 20.2 (4.1) | 6.5 (0.7) | 12.5 (2.1) |
| Sarcopenic Obesity | ||||||
|---|---|---|---|---|---|---|
| Crude Model | Adjusted Model * | |||||
| OR | 95% CI | p | OR | 95% CI | p | |
| Men | ||||||
| Total calorie intake (kcal/day) per 100 increment | 0.99 | 0.96–1.02 | 0.438 | 0.99 | 0.95–1.04 | 0.761 |
| Protein intake (%) per 1 increment | 1.02 | 0.98–1.07 | 0.334 | 1.01 | 0.95–1.07 | 0.790 |
| CHO intake (%) per 1 increment | 0.99 | 0.98–1.00 | 0.183 | 0.99 | 0.97–1.01 | 0.234 |
| Fat intake (%) per 1 increment | 1.02 | 1.00–1.05 | 0.049 | 1.02 | 0.99–1.05 | 0.255 |
| Protein intake per body weight (g/kg/day) per 1 increment | 0.51 | 0.32–0.81 | 0.005 | 1.13 | 0.65–1.99 | 0.660 |
| CHO intake per body weight (g/kg/day) per 1 increment | 0.68 | 0.60–0.78 | <0.001 | 0.93 | 0.80–1.09 | 0.378 |
| Fat intake per body weight (g/kg/day) per 1 increment | 0.79 | 0.45–1.39 | 0.416 | 1.56 | 0.80–3.03 | 0.190 |
| Women | ||||||
| Total calorie intake (kcal/day) per 100 increment | 0.96 | 0.93–0.99 | 0.011 | 0.95 | 0.91–0.99 | 0.007 |
| Protein intake (%) per 1 increment | 1.04 | 1.00–1.08 | 0.049 | 1.04 | 0.99–1.08 | 0.098 |
| CHO intake (%) per 1 increment | 0.98 | 0.67–0.99 | 0.010 | 0.99 | 0.97–1.01 | 0.200 |
| Fat intake (%) per 1 increment | 1.03 | 1.01–1.05 | 0.009 | 1.01 | 0.99–1.04 | 0.277 |
| Protein intake per body weight (g/kg/day) per 1 increment | 0.43 | 0.67–0.70 | 0.001 | 0.78 | 0.47–1.31 | 0.344 |
| CHO intake per body weight (g/kg/day) per 1 increment | 0.70 | 0.64–0.77 | <0.001 | 0.83 | 0.74–0.94 | 0.003 |
| Fat intake per body weight (g/kg/day) per 1 increment | 0.70 | 0.39–1.27 | 0.239 | 0.97 | 0.51–1.86 | 0.933 |
Publisher’s Note: MDPI stays neutral with regard to jurisdictional claims in published maps and institutional affiliations. |
© 2021 by the authors. Licensee MDPI, Basel, Switzerland. This article is an open access article distributed under the terms and conditions of the Creative Commons Attribution (CC BY) license (https://creativecommons.org/licenses/by/4.0/).
Share and Cite
Lee, J.-H.; Park, H.-M.; Lee, Y.-J. Using Dietary Macronutrient Patterns to Predict Sarcopenic Obesity in Older Adults: A Representative Korean Nationwide Population-Based Study. Nutrients 2021, 13, 4031. https://doi.org/10.3390/nu13114031
Lee J-H, Park H-M, Lee Y-J. Using Dietary Macronutrient Patterns to Predict Sarcopenic Obesity in Older Adults: A Representative Korean Nationwide Population-Based Study. Nutrients. 2021; 13(11):4031. https://doi.org/10.3390/nu13114031
Chicago/Turabian StyleLee, Jun-Hyuk, Hye-Min Park, and Yong-Jae Lee. 2021. "Using Dietary Macronutrient Patterns to Predict Sarcopenic Obesity in Older Adults: A Representative Korean Nationwide Population-Based Study" Nutrients 13, no. 11: 4031. https://doi.org/10.3390/nu13114031