Article

Long-Term Effects of a Video-Based Smartphone App (“VIDEA Bewegt”) to Increase the Physical Activity of German Adults: A Single-Armed Observational Follow-Up Study

by
Gesine Reinhardt
1,2,*,
Patrick Timpel
1,2,3,
Peter E. H. Schwarz
1,2,4,5 and
Lorenz Harst
3
1
Department for Prevention and Care of Diabetes, Faculty of Medicine Carl Gustav Carus, Technische Universität Dresden, Fetscherstrasse 74, 01307 Dresden, Germany
2
Department of Medicine III, Faculty of Medicine Carl Gustav Carus, Technische Universität Dresden, Fetscherstrasse 74, 01307 Dresden, Germany
3
Center for Evidence-Based Healthcare, Faculty of Medicine Carl Gustav Carus and University Hospital, Technische Universität Dresden, Fetscherstrasse 74, 01307 Dresden, Germany
4
Paul Langerhans Institute, Faculty of Medicine, Technische Universität Dresden, Tatzberg 47, 01307 Dresden, Germany
5
German Center for Diabetes Research (DZD), Ingolstädter Landstraße 1, 85764 Neuherberg, Germany
*
Author to whom correspondence should be addressed.
Nutrients 2021, 13(12), 4215; https://doi.org/10.3390/nu13124215
Submission received: 11 October 2021 / Revised: 19 November 2021 / Accepted: 23 November 2021 / Published: 24 November 2021

Abstract

:
As physical inactivity is one of the four leading risk factors for mortality, it should be intensively treated. Therefore, this one-year follow-up study aimed to evaluate the long-term effects of a preventive app to increase physical activity in German adults under real-life circumstances. Data collection took place from July 2019 to July 2021 and included six online questionnaires. Physical activity was studied as the primary outcome based on MET-minutes per week (metabolic equivalent). Secondary outcomes included health-related quality of life based on a mental (MCS) and physical health component summary score (PCS). At the time of publication, 46/65 participants completed the study (median 52 years, 81.5% women). A significant increase of physical activity was observed in people with a low/moderate baseline activity during the first four months of follow-up (median increase by 490 MET-minutes per week, p < 0.001, r = 0.649). Both MCS (median increase by 2.8, p = 0.006, r = 0.344) and PCS (median increase by 2.6, p < 0.001, r = 0.521) significantly increased during the first two months and the BMI significantly decreased during the first six months after the intervention (median decrease by 0.96 kg/m2, p < 0.001, r = 0.465). Thus, this study provides evidence for the medium-term impact of the app, since the effects decreased over time. However, due to the chosen study design and a sizeable loss to follow-up, the validity of these findings is limited.

1. Introduction

Physical inactivity is a crucial risk factor for non-communicable diseases such as diabetes, coronary heart disease, and several types of cancer [1] and is therefore listed as one of the four leading risk factors for mortality by the World Health Organization [2]. Due to the linear relationship between physical activity and health status [3] and further positive effects on quality of life and mental health [4], physical activity should be promoted in all age groups [1,3,5].
Health apps have the potential to reach a large target group at low costs [6,7], for therapeutic as well as preventive purposes [8]. Fitness apps are especially popular and therefore potentially useful for the prevention of non-communicable diseases [9,10]. There is modest evidence supporting the effectiveness of health apps promoting physical activity [11,12], with interventions being more effective when containing evidence based content [13] in order to support and maintain behavior change (e.g., to promote motivation, reduce stress, and solve problems) [14]. However, despite the growing number of studies investigating health apps, only limited conclusions can be drawn about their full preventive potential for several reasons. First of all, most health apps promoting physical activity contain neither evidence-based content nor theory-based behavior change strategies [14,15], which reduces the likelihood of their effectiveness [13]. Additionally, most apps studied are not commercially available [16,17], and were predominantly tested in controlled clinical settings [6]. Both of these factors have led to a lack of information about real-world effectiveness. Furthermore, the validity of studies conducted in the past was often limited due to small sample sizes and short periods of data collection [18], leading solely to short-term effects [19]. The latter, in particular, is a considerable problem, since the prevention of non-communicable diseases requires sustained behavior change, which, according to the health behavior change model “Health Action Process Approach” (HAPA) by Schwarzer [20], consists of two phases (motivation and action), the completing of which requires time. One potentially effective strategy to deliver sustained behavior change and, thus, provide guide practice as well as reinforcement over time is the use of videos as visual stimuli [21,22,23].
Still, the full potential of preventive health apps remains unknown at present, resulting in a need for long-term studies investigating the effects of video-based interventions in a real-world setting. Therefore, the purpose of this study was to evaluate the long-term effects of an app-based eight-week prevention program (“VIDEA bewegt”) promoting physical activity in everyday life. It is part of the overall evaluation of the app “VIDEA bewegt”, consisting of a short-term study and this follow-up study [24]. Findings on the short-term effects of the app already confirmed significant changes in MET-minutes per week (metabolic equivalent) and health related quality of life directly after the intervention for those participants having completed the program [25]. This follow-up study focused on the first year after completion of the app.

2. Materials and Methods

2.1. Study Design

This study was designed as a single-armed observational study under real life conditions, designed to assess the long-term effect of the app in the first year after completion of the program. Data collection took place from July 2019 to July 2021, based on online questionnaires. A personal contact was not deemed necessary, considering the scope of the study. A detailed description of the rationale and the overall study design following the recommendations formulated by Eysenbach and the CONSORT-EHEALTH Group [26] has been published elsewhere [24].
In order to control for effects of health behavior not related to “VIDEA bewegt”, the usage of other health apps or participation in any health courses other than the ones provided by the app was included into the questionnaires.
This study was approved by the Ethics Committee of the Technical University Dresden (EK 272062019, 25 May 2019) and was registered in the German Clinical Trials Register (DRKS00017392, 14 June 2019).

2.2. Intervention

The app “VIDEA bewegt” is a certified, digital preventive program which aims to increase the physical activity of its users in everyday life using videos combining educational content and training instructions. Furthermore, the app contains several additional components to develop and maintain motivation and behavior change such as goal setting, documentation of progress, personal messages, and a chat function.
The app components are deeply rooted within theories of behavior change as well as existing evidence on successful behavior change strategies. Goal setting is an essential precondition for manifest behavior change according to the HAPA [20] and has been proven to be essential in the formation of a feeling of self-efficacy [27]. The same is true for any option to autonomously control one’s behavior [28], which is operationalized in “VIDEA bewegt” by including a tracking function for physical activity. Personal messages are essential for the individualization of behavior change strategies, which is a precondition for effective interventions [17,29] The chat function of “VIDEA bewegt” also enables social support, which is an important predictor of behavior change according to the ‘Theory of Planned Behavior’, wherein it is dubbed subjective norm [30]. All in all, the components of “VIDEA bewegt” are intended to enable participants to engage in active behavior change on their own free will (i.e., they trigger intrinsic motivation) [31]. The app therefore serves as a nudging devise promoting intrinsic motivation [32].
Furthermore, “VIDEA bewegt” was developed by an expert panel consisting of doctors, psychologists, sports scientists, nutrition specialists, and app designers, fulfilling the known success factor of an interdisciplinary development team [33].
The program is divided into eight course weeks, following a standardized structure, which can be completed by the users at individual pace. A face-to-face contact is not part of the intervention, but users have the possibility to contact experts in preventative health care and sports at any time via a chat function or connect with other users via a forum.
Apart from the nudging character of the app, intending to enable active and self-guided behavior change, the novelty of “VIDEA bewegt” is the mode of information transmission via video. Using narrative videos with relatable characters and a consistent story line is known to generate transportation effects which, in turn, reduce reactance towards behavior change strategies [34]. Video content tailored to individual preferences is especially effective in that matter [35], which is why the videos within “VIDEA bewegt” can be consumed at any time and as many times as desired. Furthermore, there are several additional videos available on various topics such as sports exercises that use different equipment and medical fun facts about digestion, metabolic types, and diet coke.
The app has been available on the German market for Android and iOS since March 2019. As a certified intervention, its costs are partially covered by statutory health insurance companies. As such it, is a pilot project in Germany since it is the first app of its kind that can be prescribed by a physician. For a detailed description of the structure and process of the intervention and the app components please see Appendix A. Further information about the intervention can be found on the German website of “VIDEA bewegt” [36].

2.3. Participants

The app’s target population was patients at risk for chronic disease, specifically middle-aged or older people with low levels of daily physical activity. The conditions for participating in the app-based program were being of legal age (≥18 years old) and the absence of serious medical conditions such as heart failure. There were no further restrictions to intervention use and all users were invited to take part in the evaluation. However, only study participants who successfully completed the whole intervention could participate in the follow-up study.

2.4. Sample Size

An a priori power analysis was conducted for the primary outcomes of the overall evaluation of “VIDEA bewegt” (intended to apply to the short-term and long-term study alike) predicting a minimum sample size of 27 participants [24]. However, the number of possible participants was not limited, and a larger sample size was aimed for in order to allow for additional (e.g., subgroup) analyses.

2.5. Preliminary Evaluative Measures

Before conducting the evaluation, the items of the questionnaire were validated by means of a think-aloud test (n = 7) and expert opinions. Furthermore, a pre-test of the online questionnaire was carried out with 21 individuals from the target group in order to assess the comprehensibility of the items and the technical performance of the questionnaire. Based on the findings, the wording of several questions was optimized and minor errors in the design of the survey were corrected. Apart from that, a usability test of the “VIDEA bewegt” application was conducted (n = 10) to gain a better understanding of the strengths and weaknesses of the app’s layout. The findings of this test were used to develop an optimized version of the app, which was used in this study.
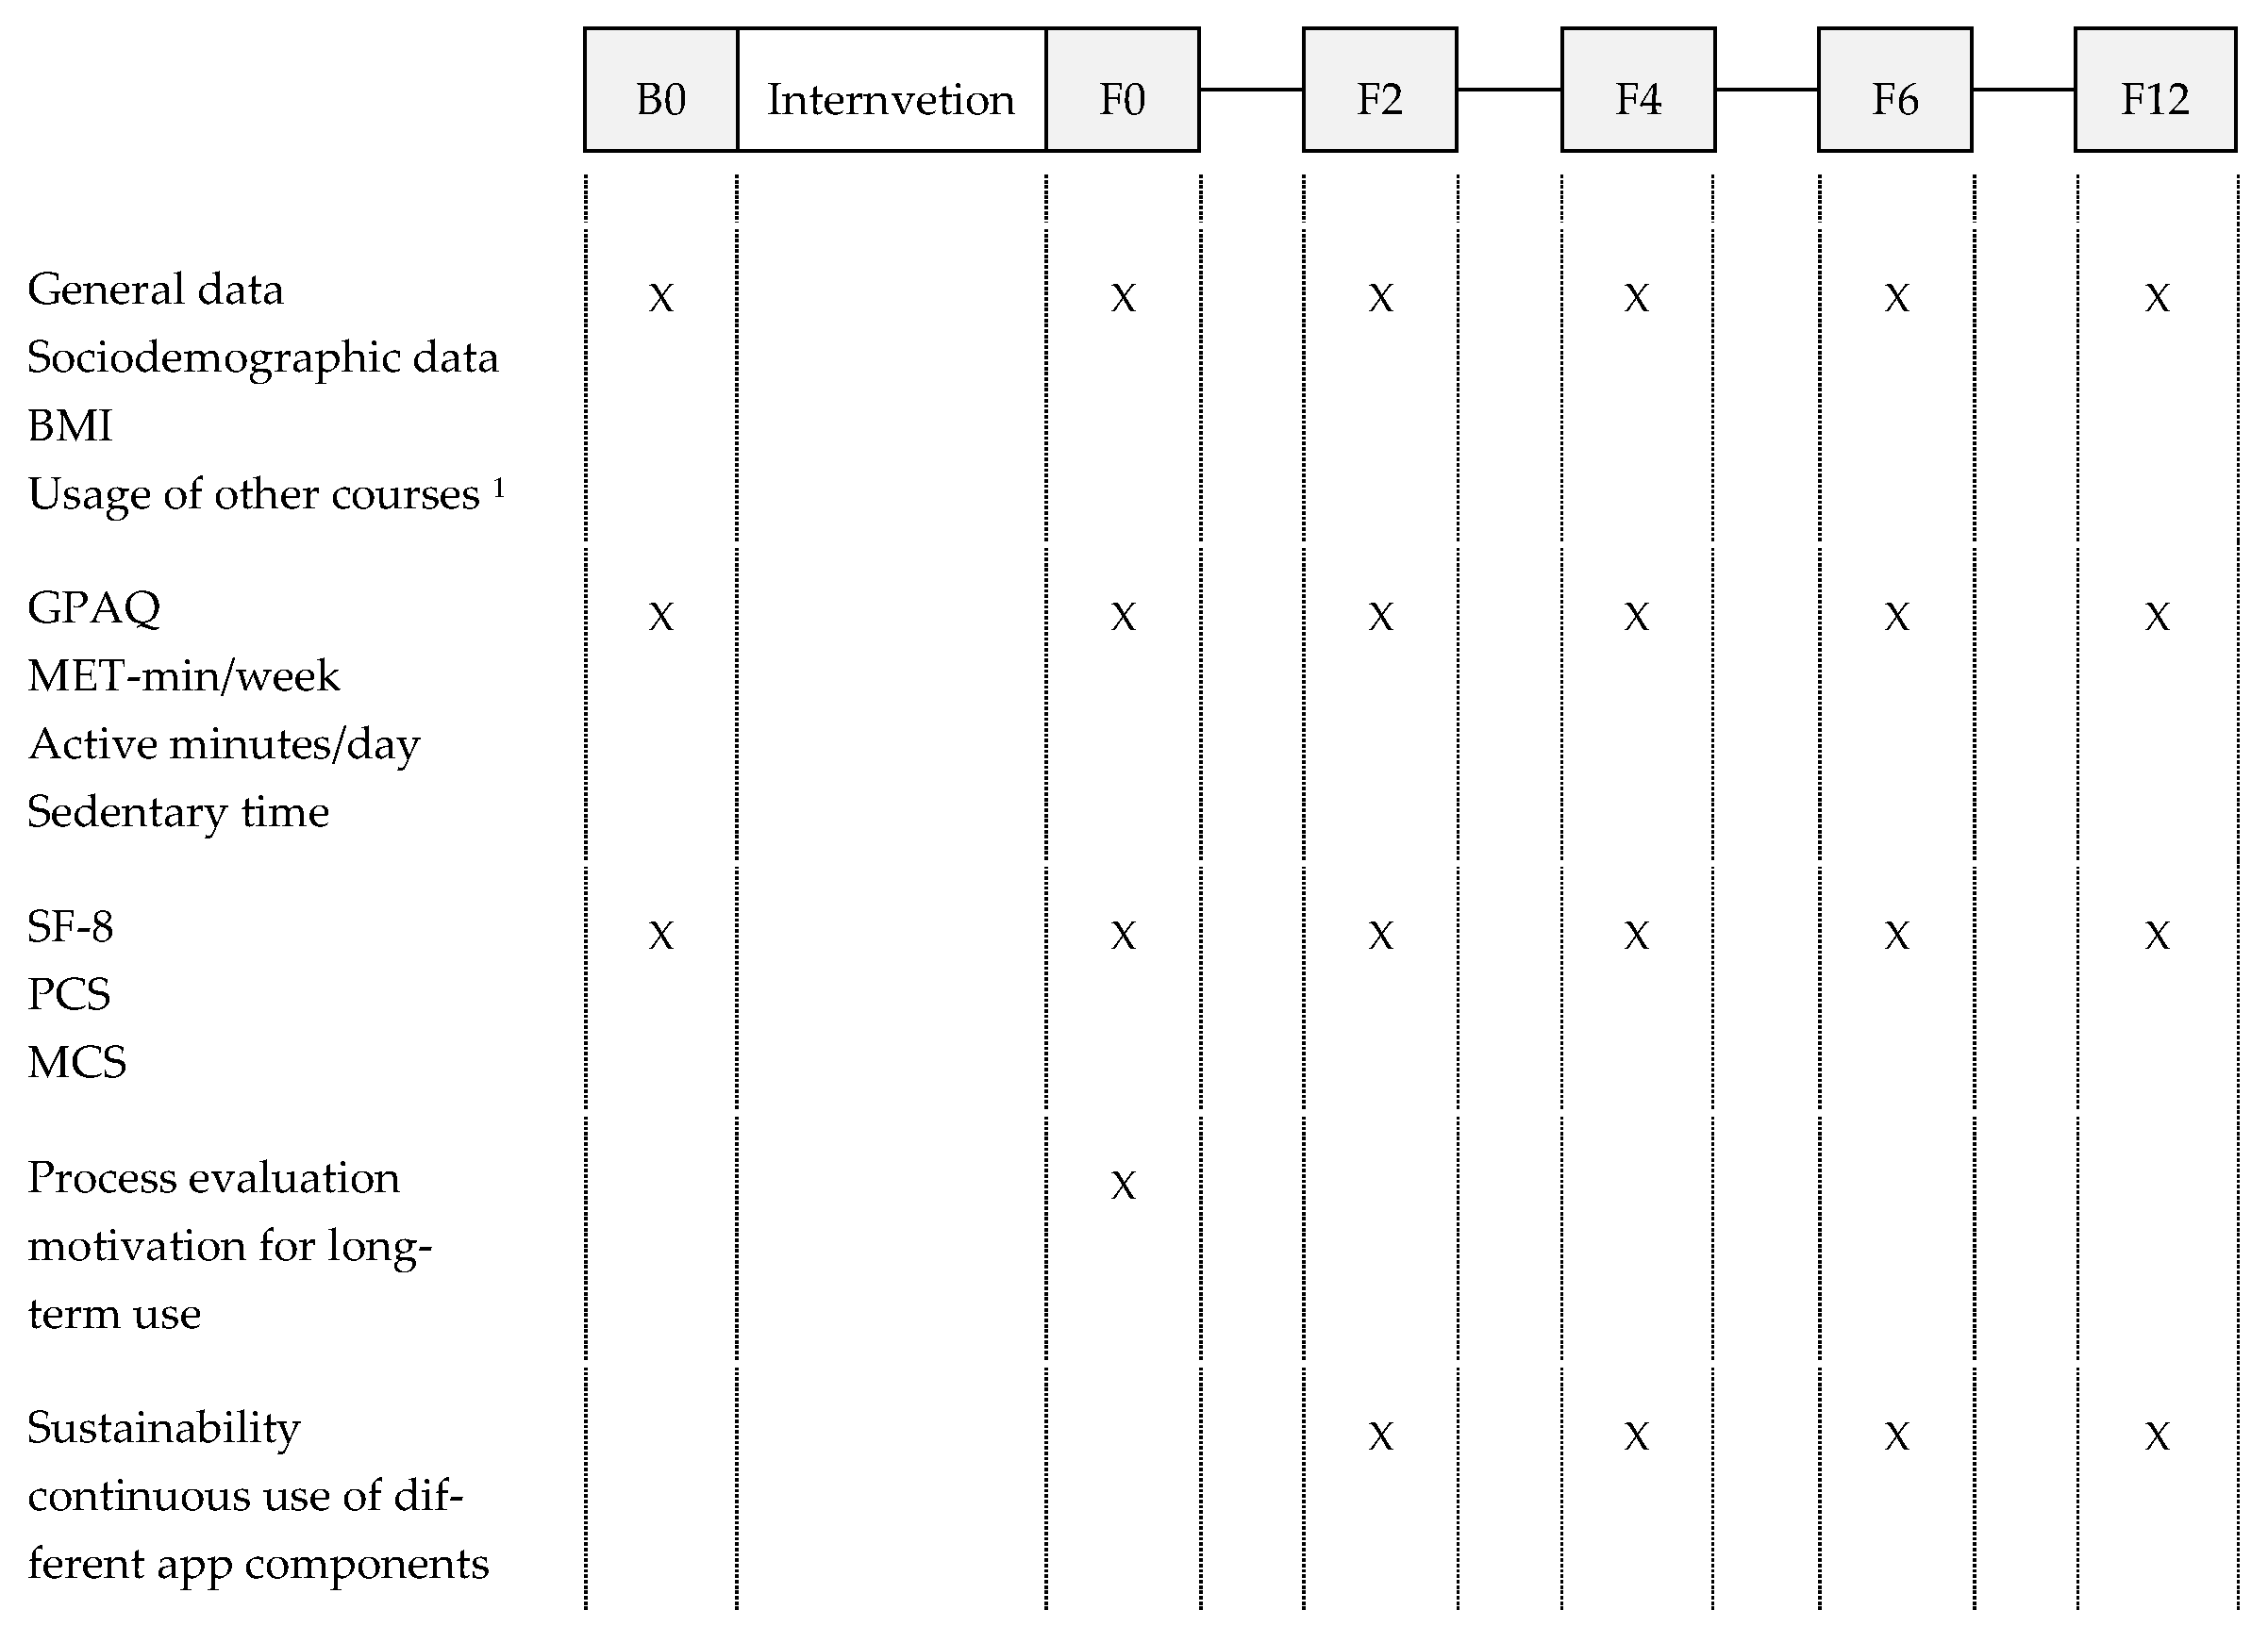
2.6. Procedure

At the beginning of the intervention, all users were informed about the evaluation and asked whether they agreed to receive an email with further information about the study and access to the first questionnaire (B0). The completion of the first questionnaire, which included a consent form and privacy policy, was considered as consent to participate in the study. Invitations to further online questionnaires were sent out after completion of the program (F0) as well as two (F2), four (F4), six (F6), and twelve (F12) months later (see Figure 1).
Data collection was solely carried out based on the questionnaires and, therefore, all data was self-reported. No study visit occurred at any time during the intervention or follow-up period and no researcher was present when the questionnaires were completed.

2.7. Primary and Secondary Outcomes

Physical activity was the primary outcome of this study and measured as MET-minutes per week (metabolic equivalent, [37]) which were assessed with the Global Physical Activity Questionnaire (GPAQ) [38,39].
The secondary outcome of this study was the health related quality of life based on the Physical Component Summary Score (PCS) and the Mental Component Summary Score (MCS), which were obtained using the Short Form Health Survey (SF-8) [40,41].
Further outcomes included the BMI and body weight, physically active minutes per week in the domains of leisure, work, and transport, as well as sedentary hours per day. In addition to the measurements listed in the previously published study protocol [24], a more thorough description of the measurements used is given in the Appendix B.

2.8. Statistics

Sociodemographic data and sustained use were analyzed descriptively. Since the Shapiro-Wilk-Test confirmed the absence of a normal distribution for most of the primary and secondary outcomes (p at B0: weight = 0.026, BMI = 0.004, MET-minutes per week < 0.001, active minutes within the domains work/transport/leisure < 0.001, PCS = 0.123, MCS = 0.004), the Wilcoxon signed-rank test for dependent samples was used to test for significant changes in the main outcomes between the measurement points F0, F2, F4, F6 and F12 compared to baseline (B0). For the main outcome MET-minutes per week the Wilcoxon signed-rank test was also carried out to test for significant changes between the measurement points F2, F4, F6, and F12 compared to the time of app completion (F0). Due to multiple testing with the same dependent variable (see outcomes and Figure 1), Bonferroni correction was applied, which led to the significance level being defined as p = 0.01 for all analysis using the Wilcoxon signed-rank test. Since the sample size of this study was smaller than expected, only one subgroup analysis was conducted, which distinguished between users with a low/moderate or high physical activity at baseline. According to the WHO, less than 3000 MET-minutes per week is defined as low to moderate, while a minimum of 3000 MET-minutes per week characterizes high levels of physical activity [42]. Furthermore, in order to identify factors influencing the effect of the intervention on physical activity and BMI, the Spearman’s Rho test was carried out as test for correlations as well as the Mann-Whitney-U test for independent samples. Due to the small sample size and the low significance, a regression test was omitted.

3. Results

3.1. Population

Between July 2019 and June 2020, 737 individuals registered for the “VIDEA bewegt” app program and were offered participation in the study. Of the 193 individuals who were interested in participating, 103 answered the first questionnaire. Of those, 90 study participants completed the program and the second questionnaire (F0). More than one quarter (25 of those 90) of potential study participants could not be included into the presented analysis for the following reasons: three people withdrew their study participation, eleven participants were excluded due to non-meaningful use (completion of more than 50% of the program in one day), another ten did not answer the first questionnaire (B0) before finishing the first two course weeks and/or the second questionnaire (F0) within one week after completion of the program and one person did not answer any of the follow-up questionnaires F2, F4, F6 and F12. Finally, 65 users could be included in this follow-up study with women accounting for 81.5% (n = 53) of the participants and a median participant age of 52 years (mean = 49 years, SD = 13.82). Most participants were married (58.5%, n = 38), had a university degree (38.5%, n = 25), and were insured through a statutory health insurance, which covered the course costs completely (83.1%, n = 54). The median duration of program use was 87 days (interquartile range (IQR) = 155.5 days). Further information on the characteristics of the participants is provided in Table 1.

3.2. Physical Activity

There were no significant differences in the primary outcome MET-minutes per week between B0 and any of the following measurement time points F0 (p = 0.150, r = 0.180), F2 (p = 0.242, r = 0.150), F4 (p = 0.515, r = 0.084), F6 (p = 0.766, r =0.040) and F12 (p = 0.032, r = 0.317) (see Table 2). Overall, study participants showed highest MET-minutes per week during F2 (median 3840 MET-minutes per week). By contrast, at F12 physical activity had significantly decreased by 960 MET-minutes per week (median) compared to the end of intervention F0 (p = 0.002, r = 0.462).
However, when comparing effects between participants with high and low/moderate baseline activity, a significant increase in physical activity in participants with a low or moderate activity at the beginning of the intervention was observed during the first four months after program completion (F0: p < 0.001, r = 0.684; F2: p < 0.001, r = 0.775; F4: p < 0.001, r = 0.649). In that period of time, the median MET-minutes per week increased by at least 140 MET-minutes per week at F0 and a maximum of 1200 MET-minutes per week at F2 compared to B0. F12 was the only measurement point where MET-minutes per week fell below the baseline level (−150 MET-minutes per week, p = 0.258, r = 0.222).
The physical activity of users with a high baseline activity showed an opposing trend, meaning that the median MET-minutes per week were below the baseline at all follow-up measurement points. At F2, physical activity was significantly below B0 (p = 0.009, r = 0.506) and at F12, the median physical activity had significantly decreased by 3640 MET-minutes per week compared to B0 (p < 0.001, r = 0.785) and by 3600 compared to F0 (p = 0.005, r = 0.646).
Nevertheless, the proportion of participants with a high physical activity level was always above baseline during the first six months of follow-up and only fell below B0 at F12 (see Table 2).
When comparing the sociodemographic characteristics of users depending on their baseline activity, it becomes clear that participants with a low to moderate baseline activity were significantly younger and had a higher level of education than users with a high baseline activity. It also took them less time to finish the program and they were more frequently informed about the intervention by their health insurance than people with a high baseline activity. Both groups of participants where predominantly employed full time, but while among participants with a heightened baseline activity were a higher proportion of retired people, users with a low or moderate baseline activity were more frequently unemployed (see Appendix C).

3.3. Health-Related Quality of Life

Health-related quality of life based on the Physical and Mental Component Summary Score did significantly improve between B0 and the measurement time points F0 (PCS: p = 0.003, r = 0.325; MCS: p < 0.001, r = 0.456) and F2 (PCS: p < 0.001, r = 0.521; MCS: p = 0.006, r = 0.344). Compared to baseline, the median PCS and MCS were increased at all measurement points except for F12, even though the changes at F4 and F6 did not meet the threshold of significance (see Table 3 and Table 4).

3.4. Additional Analyses

BMI was calculated from self-reported height and weight and was reduced continuously during the whole year of follow-up. Significant decreases were observed between F0 (p < 0.001, r = 0.441), F2 (p < 0.001, r = 0.478), F4 (p = 0.002, r = 0.409) and F6 (p < 0.001, r = 0.465) compared to B0 (see Table 5). Data show the strongest decrease in body weight for those participants with high body weight at baseline (see Appendix D).
Based on the GPAQ, the active minutes per day in the domains work, transport, and leisure time as well as the sedentary time per day were analysed. None of these outcomes showed any significant changes during follow-up compared to baseline (see Appendix E, Table A4). Nevertheless, the median of active minutes per day in the work domain increased during the first six months and even doubled at the measurement time points F2 and F4, while the other domains showed only minor improvements during the first months after the intervention.
The results of a Mann-Whitney-U test suggest that the development of the different domains was partly influenced by the season and by the presence or absence of high incidences of COVID-19 (see Appendix E, Table A4). At F0 (p = 0.020, r = 0.290) and F12 (p = 0.029, r = 0.322) participants showed a higher number of active minutes per day in the work domain during the warm season, as well as at F4 (p = 0.015, r = 0.325) and F12 (p = 0.020, r = 0.343) in the leisure time-domain. At F0 participants showed a higher number of active minutes per day in the transport domain (p = 0.015, r = 0.303) and in leisure time domain (p = 0.005, r = 0.355) during months with high incidences of COVID-19.
Furthermore, the sedentary time per day was decreased by one hour during the first 6 months after completion of the program (see Appendix E, Table A5).

3.5. User Assessment of the App Components

At the end of the intervention (F0), participants found it likely that they would continue using the app components “my focus” and “practical tips” as well as the in-app training sessions, the latter being the most favoured for a continuous use (see Figure 2).
During follow-up, a small minority reported performing the in-app training sessions or referring to the practical tips within the app daily, while the majority reported using both at least once a week, irregularly or never (see Figure 3 and Figure 4). The ratio between those using these two components at least once per week and those using them irregularly or never was stable over time, although a decrease in use could be observed.
In terms of sustained use of “my focus”, participants reported using predominantly the goal-setting (“my personal why”), motivational (“sources of strength”, “stop negative thoughts”) and support (“coping with setbacks”) components of the app (see Figure 5), although usage declined between F2 and F12. The components providing “rewards” and allowing for action planning (“action plan” and “if/then-plans”) were used less according to the participants.
A majority of users reported having improved their health literacy by using the app, a fact that remained stable throughout the whole follow-up period (see Figure 6).
For a detailed description of the intervention and the app components, please see Appendix A.

3.6. Effect Analyses

3.6.1. Usage Time of the Intervention

There was no significant correlation between total usage time of the app and MET-minutes per week and BMI at most of the follow-up measurement points, but at F0 usage time (measured in days) was positively correlated with MET-minutes per week (r = 0.295, p = 0.018) (see Appendix F, Table A6). In contrast, at F4 a long usage time was significantly associated with a decline in physical activity compared to baseline (r = −0.270, p = 0.039) (see Appendix F, Table A7).

3.6.2. Motivation for Continuous Use of App Components at F0

Motivation to further use the training videos correlated significantly with an increase in physical activity at F4 (r = 0.349, p = 0.006) and F6 (r = 0.291, p = 0.030) (see Appendix F, Table A6) and motivation to continue doing the exercises presented in the app component “my focus” positively correlated with an increase in MET-minutes per week at F0 (r = 0.258, p = 0.040), F4 (r = 0.390, p = 0.002), F6 (r = 0.356, p = 0.007) and F12 (r = 0.294, p = 0.047) (see Appendix F, Table A6). Furthermore, motivation to further use contents of “my focus” correlated with a decrease of BMI compared to B0 at F2 (r = −0.269, p = 0.033) and F4 (r = −0.277, p = 0.032) (see Appendix F, Table A9) and motivation to further use contents of “practical tips” also correlated with a decrease of BMI compared to B0 at F2 (r = −0.290, p = 0.021), F4 (r = −0.291, p = 0.024) and F6 (r = −0.266, p = 0.046) (see Appendix F, Table A9).

3.6.3. Sustained Use

Continuous use of the in-app videos was positively correlated with physical activity at F2 (r = 0.279, p = 0.029), F4 (r = 0.390, p = 0.006), F6 (r = 0.528, p = 0.000) and F12 (r = 0.355, p = 0.015) (see Appendix F, Table A6) and also negatively corelated with BMI at F4 (r = −0.258, p = 0.048) and F6 (r = −0.447, p = 0.001) compared to baseline (see Appendix F, Table A9). Furthermore, there was a correlation between usage of practical tips and a decrease of BMI at F2 (r = −0.298, p = 0.018) and F6 (r = −0.359, p = 0.007) compared to B0 (see Appendix F, Table A9).
However, continuous use of the in-app videos also positively correlated with an increase in BMI at F12 (r = 0.452, p = 0.002) (see Appendix F, Table A8).
Other factors such as the participation in other online or analogue lifestyle interventions or the external factors such as the COVID-19 pandemic did not seem to have any significant impact on the MET-minutes per week and the BMI of the study participants (see Appendix F, Table A10, Table A11, Table A12, Table A13).

4. Discussion

The results of the present study show that the app under investigation can actively increase the time spent physically active, especially for those with low levels of activity at baseline, and so it is in line with previous results concerning the effects of digital behavior change applications (e.g., for type 2 diabetes) [19].
With 81.5%, women accounted for the vast majority of study participants. This is an even higher proportion of female participants than in other studies [43,44] even though telemedicine interventions are known to be more likely used by women [12,45,46]. Still, the high proportion of women is representative for the users of “VIDEA bewegt” according to the manufacturer’s data.
With the majority of the participants being older than 50 (median age 52) and overweight or obese, it is evident that the intervention succeeded in reaching its target population. Furthermore, the results show the effectiveness of the app for those at high risk for cardiovascular events or lifestyle-associated diseases [47], an observation which is further underlined by the fact that significant effects on the MET-minutes per week were only to be found with those participants reporting low baseline levels. This effect is mirrored by the effects on weight loss, which were higher for overweight and obese participants. This corresponds with findings on improvement in clinical outcomes through the use of diabetes self-management apps [48].
However, the majority of participants is well-educated, underlining once again, that preventive measures, even though delivered via an app, often do not reach those especially vulnerable to life style-related diseases [49].
For most positive effects observed, there is a clearly visible wash-out period between F4 and F6, where values for physical activity decrease, in some cases drastically, and the BMI increases, suggesting that while the app may have had an activating effect [50], the impact reduces over time [11,51] if no new content is provided within the app [52].
Directly after finishing the app program, usage time positively correlated with physical activity, whereas at F4 a long usage time had a negative influence on physical activity. While the latter may seem counterintuitive at first glance, it can possibly be explained since in the case of “VIDEA bewegt”, a long usage time is predominantly caused by discontinued use as the program can be modified much more in its duration than in its intensity. Thus, it could be useful to increase the frequency of reminders to guarantee a continuous and therefore meaningful use. At F12, values for MET-minutes per week drop below baseline values. This points at well-documented social desirability effects [53] which might have been present when estimating the baseline activity levels. However, it also suggests using the app might have served as a reality check concerning everyday activity levels for some participants [54]. This awareness-raising effect of the app [55] is further underlined by the fact that especially goal-setting components were used continuously throughout the whole follow-up period. While goal-setting is the basis for behavior change, keeping up with the behavior changes requires making plans to integrate it into everyday life [
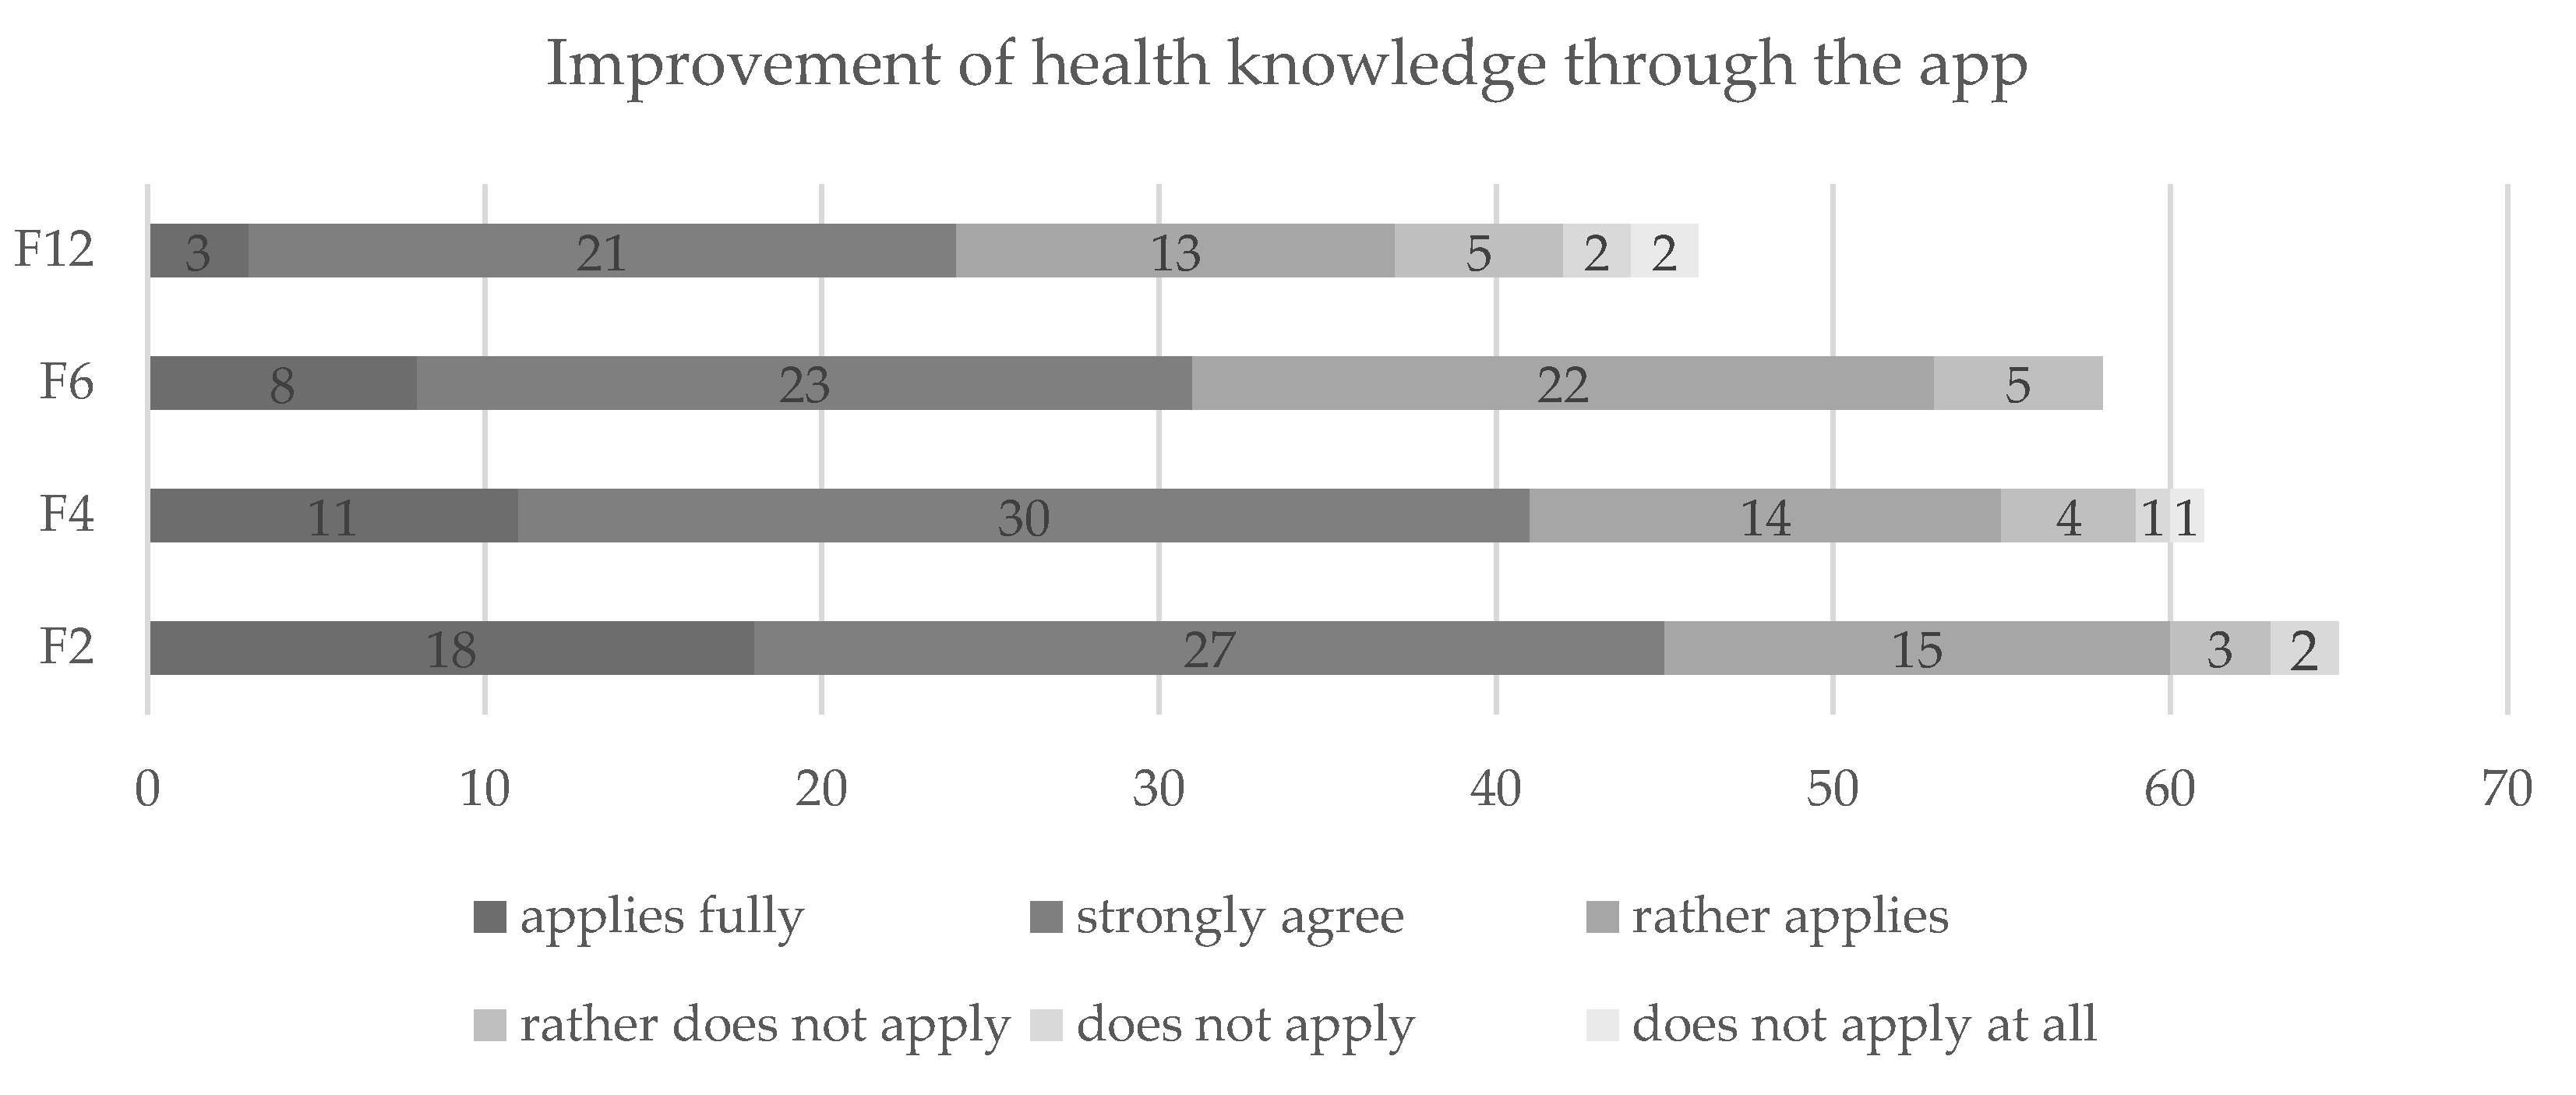
20]. The fact that the planning components of the app were used less according to the participants may be one explanation for the deteriorating effects on MET-minutes per week and the time spent active during work, transportation, and leisure time. The reported interest in the guided exercises within the app, which partly correlates with MET-minutes per week, fits the evidence for the effectiveness of in-app videos for promoting physical activity [56].
Quality of life, even though not always significant, remained high all the way to F6, which shows that quality of life corresponds with increased physical activity and decreases (e.g., in BMI) [57]. It also fits the reported high usage of app-components that provided motivational support, which shows the importance of positive framing of behavior change in order to fulfill the users’ outcome expectancy [58], a fact already known from interventions aiming to increase screening behavior [59]. The fact that quality of life also dropped below baseline at F12 once more shows the importance of continuously proving new content, also to prevent disinterest on the part of the users [60].
It is also worth noting that the median sedentary time of study participants decreased by one hour during the first six months of follow-up. Although this observation did not meet the threshold of significance, it is still of clinical relevance since one hour spent physically active instead of sitting already reduces all-cause mortality [61].
It is known that physical activity is influenced by external factors such as the season [62,63]. It is therefore not surprising that participants showed higher levels of physical activity at several measurement time points during the warm season. Furthermore, directly after finishing the app, participants spent more minutes per day physically active during time periods with high COVID-19 incidences. However, since these effects only occurred sporadically and may have been influenced by other external factors, no clear interpretation of this observation is possible.
Last but not least, decreases of weight and BMI peak at F6 while increases of MET-minutes and quality of life peak at F2 or F4, showing that actual metabolic effects of a digital intervention take time to show [52], warranting, once more, longer follow-ups [64] for evaluation studies.

4.1. Strengths and Weaknesses

The greatest strength of the present study lies in the reliance on real-world evidence, since data was generated in the every-day settings of participants [65]. Then again, the one-armed observational design holds considerable risk of bias, which has to be considered when interpreting the results. The lack of a control group and the unobserved app usage as well as completion of the questionnaires severely limits options to control for confounding factors. However, use of other health applications or courses was part of the questionnaires and had no significant effect on any of the outcomes studied. Still, showing correlations between app components and, respectively, BMI, weight and MET-minutes per week during app usage and follow-up periods, the study serves as a proof-of-concept for the usefulness of health apps with a video component for the promotion of physical activity.
The low number of participants, especially at F12, did not allow for more sophisticated analyses such as regression, rendering correlation results open for interpretation concerning the direction of the effects. This is also due to the fact that no power analysis or intention-to-treat calculation was performed a priori for this follow-up study. However, a power analysis was conducted concerning the complete evaluation of “VIDEA bewegt” (short-term and long-term study), which led to a study sample of at least 27 participants [24]. Even though the number of participants meets the required minimum, the sample size is far below the required number for subgroup analyses. This was caused by a low number of app users rather than a lack of willingness to participate in the study. Consequently, the intervention “VIDEA bewegt” encountered two of the leading barriers of telemedicine interventions to their implementation in medical care, which are non-use and discontinued use, mostly caused by user-related factors [66]. The attrition rate of this follow-up study was rather low. However, the previous study investigating the short-term effect of the intervention reported a significant dropout rate. Only 63% of the initial study participants took part in this follow-up study. Thirteen participants dropped out of the intervention, mostly at the beginning of the program, and another 25 participants were excluded since they did not fulfil the inclusion criteria. Thus, the population of this long-term evaluation is heavily filtered with a consecutive risk of selection bias. During the follow-up study the response rate was 100% at F0, 94% at F4, 95% at F6, and 92% at F12.

4.2. Outlook

Data collection of this study will carry on until January of 2022. Further research should apply “VIDEA bewegt” in a controlled setting without abandoning the real-world approach taken so far. The findings from the current proof-of-concept should be validated using at least a randomized control group and assign participants to both groups based on a power estimation.
Continuous evaluation of “VIDEA bewegt” should be performed especially when the app content is updated.

5. Conclusions

This follow-up study provides evidence on the positive medium-term effect of the intervention “VIDEA bewegt” on several clinical outcomes such as physical activity, health related quality of life and BMI, when being used by individuals with low levels of physical activity in everyday life. As such, it is an example for the potential of evidence-based video-interventions and contributes to a research field in which limited evidence exists to date. However, its validity is limited due to a small sample size due to recruitment problems and high dropout rates.

Author Contributions

Conceptualization, G.R., P.T., P.E.H.S. and L.H.; data curation, G.R.; formal analysis, G.R. and L.H.; funding acquisition, P.E.H.S.; investigation, G.R.; methodology, G.R.; project administration, P.E.H.S.; supervision, P.T. and L.H.; validation, G.R., P.T. and L.H.; visualization, G.R.; writing—original draft, G.R. and L.H.; writing—review and editing, P.T., P.E.H.S. and L.H. All authors have read and agreed to the published version of the manuscript.

Funding

This research received no specific grant from any funding agency in the public, commercial or not-for-profit sectors. The TUMAINI Institut für Präventionsmanagement GmbH provided necessary system-internal data.

Institutional Review Board Statement

The study was conducted according to the guidelines of the Declaration of Helsinki, and approved by the Ethics Committee of the Technical University of Dresden, Germany (EK 272062019, 25 May 2019).

Informed Consent Statement

Informed consent was obtained from all subjects involved in the study. The informed consent to participate is obtained written by clicking a button in the first online questionnaire in accordance with the DSGVO as a prerequisite for participation.

Data Availability Statement

Data will be shared with researchers who provide a methodologically sound proposal. Proposals should be directed to [email protected]. To gain access, data requestors will need to sign a data access agreement.

Conflicts of Interest

The principal investigator Prof Schwarz was involved in the development and implementation of the app ‘VIDEA bewegt’ as a medical expert. He is responsible for the medical and theoretical background and is shown in the app’s videos. He received no payment for his participation in the app. None of the other authors have any conflicts of interest to declare.

Appendix A. Description of the Intervention “VIDEA Bewegt”

The German app “VIDEA bewegt” is a certified, multimodal prevention program which aims to increase the physical activity of German adults. It is based on the behavior change model by Greaves and Sheppard (i.e., motivation, action, and maintenance [67]) and contains eight consecutive course weeks with theoretical and practical sessions of 45 min each. Every week the user gains access to another stage of the app. Thus the duration of the intervention is at least seven weeks and one day and is limited to a maximum of one year.
The intervention is video-based and provides four videos with theoretical input delivered by a diabetologist and practical trainings moderated by a personal trainer. Furthermore, there are several additional videos with workouts and medical fun facts that are accessible within the rubric “video+”. At the end of each stage, the user can test his or her knowledge in a short quiz.
Apart from the videos the app contains several other components. One of them is the rubric “my focus”, wherein the user deals with his or her personal goals and resources in free text format and learns a number of behavioral strategies to maintain motivation and handle throwbacks. Furthermore, there is a rubric called “activity” where the user has the possibility to track different forms of physical activity such as walking, biking, gardening etc. Each day the user is supposed to reach a defined number of activity minutes. Therefore, the rubric contains an animated ring that fills up progressively throughout the day as the user enters activities until the personal goal is reached. Within the rubric “activity” the user can also document his daily mood using a scale with five smileys.
Each user also has the opportunity to contact the experts via a chat function and to connect with other users via a forum. Furthermore, each user receives a personal and motivational message every day, in case he or she opens the app.
At the end of the digital course, every user receives a certificate of participation that can be submitted to statutory health insurance companies for proportional reimbursement of the course costs.

Appendix B. Measurements

Table A1. Summary of the measurements used in this follow-up study, based on the study-protocol [24].
ToolValidationContentItems
General dataself-validated 1Author-constructed questions about sociodemographic data, individual backgrounds, BMI, endurance, and muscle strength [24].5–12
GPAQ [38,39]validated [39,68]The Global Physical Activity Questionnaire measures the intensity and duration of physical activity at work, during transport, and during leisure time. The data are quantified by a conversion into MET minutes per week. One metabolic equivalent represents the energy consumption at rest. The GPAQ defines 4 METs for moderate activity and 8 METs for vigorous activity [37].16
SF-8 [40,41]validated [69]The Short Form Health Survey 8 measures physical and mental health related quality of life and covers the eight dimensions of SF-36 on the basis of eight questions: physical functioning (PF), role-physical (RP), bodily pain (BP), general health (GH), vitality (VT), social functioning (SF), role-emotional (RE), and mental health (MH).8
Process evaluationself-validated 1Author-constructed question to assess the motivation of participants to further use different contents of the app after completion of the program [24].1
Sustainabilityself-validated 1Author-constructed questions to assess the use of the exercises and components of the program after it has been completed [24].5
1 see Section 2.5. Preliminary evaluative measures. Abbreviations: GPAQ = Global Physical Activity Questionnaire; SF-8 = Short Form Health Survey 8.

Appendix C. Population

Table A2. Characteristics of the study participant with different baseline activity levels.
<3000 MET-Min/Week≥3000 MET-Min/Week
n3430
Sex [%, (n)]
female85.3 (29)76.7 (23)
male14.7 (5)23.3 (7)
Age [years]
Mean, Median43.74, 42.0055.23, 58.00
Marital status [%, (n)]
Married44.1 (15)73.3 (22)
Living in a stable relationship26.5 (9)-
Divorced or separated14.7 (5)10.0 (3)
Single8.8 (3)13.3 (4)
Widowed2.9 (1)3.3 (1)
Other2.9 (1)-
Level of education [%, (n)]
University degree52.9 (18)20.0 (6)
Completed vocational training20.6 (7)46.7 (14)
High school (12 years or more)11.8 (4)10.0 (3)
Secondary school (10 or 11 years)11.8 (4)16.7 (5)
Main school (9 years or less)-3.3 (1)
Other2.9 (1)3.3 (1)
Employment status [%, (n)]
Full-time52.9 (18)40.0 (12)
Half-time14.7 (5)13.3 (4)
Part-time5.9 (2)10.0 (3)
Not employed17.6 (6)3.3 (1)
Retired8.8 (3)33.3 (10)
Length of program use [days]
Mean (SD)124.62 (98.28)153.27 (102.88)
Median (IQR)67.00 (126.25)129.50 (159.50)
25% quantile56.5058.50
75% quantile182.75218.00
Source of information 1 [%, (n)]
Health insurance23.5 (8)3.3 (1)
Doctor2.9 (1)-
Internet14.7 (5)16.7 (5)
Social environment14.7 (5)16.7 (5)
Others44.1 (15)63.3 (19)
Participation in other sport courses 2 [%, (n)]44.1 (15)50.0 (15)
Use of other health apps 2 [%, (n)]20.6 (7)23.3 (7)
Health insurance provider [%, (n)]
AOK PLUS, AOK Rheinland/Hamburg 379.4 (27)90.0 (27)
Other statutory insurance 417.6 (6)6.7 (2)
Private insurance 42.9 (1)3.3 (1)
1 about the app “VIDEA bewegt”; 2 interventions other than „VIDEA bewegt“; 3 German statutory insurances where users could participate in the app for free; 4 other German insurances where users had to pay 130€ in advance and were reimbursed part of the course cost after completing the program.

Appendix D. Changes in Body Weight

Table A3. Changes in body weight depending on the baseline weight 1.
B0F0F2F4F6F12
All
participants
n646463605846
weight [kg], mean76.7775.4275.4475.2375.0374.54
(SD)(16.71)(16.07)(15.24)(15.53)(15.08)(16.04)
weight [kg], median75.0074.0075.0074.5075.0073.00
25% quantile63.0062.0062.0062.5062.0060.75
75% quantile89.2584.7587.0085.0085.2585.25
Δ weight [kg], mean (SD) −1.34−1.63−1.57−1.89−60.63
(3.22)(3.29)(3.58)(3.76)(4.73)
Δ weight [kg], median −1.00−1.00−1.00−1.000.00 3
25% quantile−2.00−3.00−3.70−4.50−2.50
75% quantile0.000.000.000.002.00
Wilcoxon 2
p<0.001<0.0010.002<0.0010.644
z−3.613−3.782−3.157−3.547−0.462
r0.4520.4760.4080.4660.068
Normal weight at B0n292928272523
weight [kg], mean63.4863.4163.4363.5263.4063.74
(SD)(8.73)(8.89)(8.95)(9.31)(9.15)(9.36)
weight [kg], median62.0061.0061.5062.0062.0061.00
25% quantile55.5056.5056.2555.0055.0056.00
75% quantile71.5071.5071.5072.0071.0073.00
Δ weight [kg], mean (SD) −0.07−0.29−0.19−0.280
(1.22)(1.33)(1.73)(1.31)(2.04)
Δ weight [kg], median 0.000.000.000.000.00
25% quantile−1.00−1.00−2.00−1.00−1.00
75% quantile0.000.000.000.002.00
Wilcoxon 2
p0.7000.2370.4540.2680.896
z−0.386−1.182−0.749−1.109−0.131
r0.0720.2230.1440.2220.065
Overweight
at B0
n161616161611
weight [kg], mean77.7575.7577.1976.3876.5077.00
(SD)(6.25)(7.22)(7.57)(7.10)(7.53)(9.47)
weight [kg], median76.0074.0074.5074.5075.5073.00
25% quantile74.0070.5072.2572.2571.5070.00
75% quantile82.7581.7585.7583.7583.0086.00
Δ weight [kg], mean (SD) −2.00−0.56−1.38−1.250.09
(5.11)(3.50)(3.63)(4.74)(7.11)
Δ weight [kg], median −1.50−1.50−1.00−1.000.00
25% quantile−4.75−3.00−4.75−4.50−4.00
75% quantile0.001.750.752.255.00
Wilcoxon 2
p0.0510.2400.1290.3090.798
z−1.953−1.175−1.517−1.018−0.256
r0.4880.2940.3790.2540.077
Obesity at B0n191919171612
weight [kg], mean96.2193.4791.6892.7691.9493.00
(SD)(11.93)(12.68)(11.24)(11.89)(11.84)(13.22)
weight [kg], median94.090.091.092.089.593.0
25% quantile90.084.084.084.083.583.5
75% quantile99.094.094.095.095.595.0
Δ weight [kg], mean (SD) −2.74−4.53−3.94−5.06−2.50
−2.68−3.42−4.55−3.49−5.68
Δ weight [kg], median −2.00−5.00−4.00−6.00−1.00
25% quantile−5.00−7.00−6.50−6.75−7.00
75% quantile0.00−2.00−1.50−2.002.00
Wilcoxon 2
p0.001<0.0010.006<0.0010.212
z−3.222−3.609−2.771−3.3131.248
r0.7390.8230.6720.8280.938
1 normal weight: BMI < 15 kg/m2, overweight: BMI = 25.00–29.99 kg/m2, obesity: BMI > 30 kg/m2; 2 Wilcoxon signed-rank test between B0 and the follow-up measurements points; 3 a possible explanation for this result is that the study participants who have already completed the follow-up study had a lower BMI than the total sample. Abbreviations: B0 = baseline; F0 = end of intervention; F2 = two months after the intervention; F4 = four months after the intervention; F6 = six months after the intervention; F12 = twelve months after the intervention; Δ = changes in weight compared to B0; r = effect size.

Appendix E. Additional Analyses Based on the GPAQ

Table A4. Active minutes per day in the domain’s work, transport, and leisure time.
B0F0F2F4F6F12
Workn646461605646
Mean70.3574.9776.1676.5877.7048.78
(SD)(95.68)(105.24)(106.14)(108.83)(108.83)(74.21)
Median19.6427.8640.0041.4329.2917.14
25% quantile0.000.007.865.710.000.00
75% quantile122.14102.86124.29128.57106.0772.86
Wilcoxon 1
p0.5710.5890.2290.9710.190
z−0.566−0.541−1.204−0.036−1.312
r0.0700.0690.1550.0050.193
MWU 2
p0.1130.4590.6160.4000.3820.820
z−1.586−0.741−0.502−0.842−0.874−0.228
r0.1980.0920.0620.1090.1170.034
MWU 3
p0.1080.0200.9130.8590.0520.029
z−1.608−0.317−0.109−0.177−1.944−2.182
r0.2010.2900.0140.0230.2600.322
Transportn646461605646
Mean24.5026.9227.4924.8832.3920.59
(SD)(31.43)(32.40)(26.34)(24.53)(34.13)(23.77)
Median15.7117.1425.0017.1421.4315.71
25% quantile0.006.436.438.577.502.14
75% quantile30.0042.1437.1438.9348.2130.00
Wilxocon 1
p0.3500.1150.2720.0990.243
z−0.934−1.576−1.100−1.651−1.243
r0.1170.2020.1420.2210.183
MWU 2
p0.5070.0150.9560.2330.2670.709
z−0.663−2.421−0.055−1.192−1.110−0.381
r0.0830.3030.0070.1540.1480.027
MWU 3
p0.0780.8380.5900.0550.5340.427
z−1.761−0.204−0.539−1.920−0.621−0.795
r0.2200.0260.0700.2480.0830.117
Leisure timen646461605646
Mean34.3353.3046.4940.6538.8027.42
(SD)(34.02)(69.20)(40.99)(38.54)(44.84)(26.28)
Median25.7132.8634.2925.7125.7118.21
25% quantile12.8617.1417.1412.8613.2110.71
75% quantile38.5764.2962.8659.6442.8634.29
Wilxocon 1
p0.0110.0110.0680.1820.385
z−2.5332.547−1.828−1.335−0.869
r0.3170.3260.2360.1780.128
MWU 2
p0.4390.0050.3050.1170.2550.086
z−0.773−2.838−1.026−1.568−1.139−1.716
r0.0970.3550.1310.2020.1520.253
MWU 3
p0.1430.5170.1360.0150.5770.020
z−1.465−0.648−1.492−2.520−0.558−2.329
r0.1830.0810.1910.3250.0750.343
1 Wilcoxon signed-rank test between B0 and the follow-up measurements points; 2 Mann-Whitney-U test distinguishing whether the respective measurement point fell in a time period with high incidences of COVID-19 or not. High incidences appeared in March to April 2020 and November 2020 to February 2021 (these were also the months with the greatest restrictions on public live in Germany); 3 Mann-Whitney-U test distinguishing whether the respective measurement point fell into the cold or warm season. The cold season was defined as the period from 22 September to 19 March, and the warm season from 20 March to 21 September. Abbreviations: B0 = baseline; F0 = end of intervention; F2 = two months after the intervention; F4 = four months after the intervention; F6 = six months after the intervention; F12 = twelve months after the intervention; r = effect size.
Table A5. Sedentary time per day in hours.
B0F0F2F4F6F12
n646461605646
Mean6.525.895.665.716.266.72
(SD)(3.37)(3.35)(2.95)(3.08)(3.36)(3.22)
Median6.005.005.005.005.006.00
25% quantile4.003.004.003.134.004.00
75% quantile8.008.007.008.008.389.00
Wilcoxon 1
p0.0130.0690.0220.3450.482
z−2.472−1.818−2.213−0.944−0.703
r0.3090.2330.2860.1260.104
1 = Wilcoxon signed-rank test between B0 and the follow-up measurements points. Abbreviations: B0 = baseline; F0 = end of intervention; F2 = two months after the intervention; F4 = four months after the intervention; F6 = six months after the intervention; F12 = twelve months after the intervention; r = effect size.

Appendix F. Effect Analysis

Table A6. Spearman-Rho Test for measuring correlations: Influence of different factors on physical activity (MET-minutes per week) at the follow-up measurement points.
Independent Factor F0F2F4F6F12
Course durationr0.2950.2130.0160.1670.172
p0.0180.0990.9040.2180.252
n6461605646
Motivation training videos F0r0.1760.1790.3490.2910.129
p0.1650.1690.0060.0300.394
n6461605646
Motivation “my focus” F0r0.2580.2430.3900.3560.294
p0.0400.0590.0020.0070.047
n6461605646
Motivation “practical tips” F0r0.1280.0720.2550.1730.159
p0.3130.5820.0500.2010.292
n6461605646
Usage training videos FXr 0.2790.3900.5280.355
p0.0290.0060.0000.015
n61605546
Usage practical tips FXr 0.2060.074−0.0280.138
p0.1100.5800.8370.362
n61595546
Abbreviations: F0 = end of intervention; F2 = two months after the intervention; F4 = four months after the intervention; F6 = six months after the intervention; F12 = twelve months after the intervention; FX = respective measurement point; r = correlation coefficient.
Table A7. Spearman-Rho Test for measuring correlations: Influence of different factors on the effect of the app on the physical activity (MET-minutes per week) between B0 and the following measurement points.
Independent Factor ΔB0-F0ΔB0-F2ΔB0-F4ΔB0-F6ΔB0-F12
Course durationr0.085−0.192−0.270−0.042−0.196
p0.5050.1430.0390.7630.196
n6360595545
Motivation training videos F0r−0.045−0.0720.1400.028−0.133
p0.7240.5850.2920.8390.385
n6360595545
Motivation “my focus” F0r0.014−0.0360.0880.081−0.068
p0.9150.7840.5050.5560.655
n6360595545
Motivation “practical tips” F0r−0.069−0.070−0.027−0.047−0.006
p0.591−0.5940.8370.7340.967
n6360595545
Usage training videos FXr −0.1930.0510.1080.038
p0.1400.6990.4390.806
n60595445
Usage practical tips FXr −0.0800.070−0.1200.241
p0.5420.6000.3880.111
n60585445
Abbreviations: B0 = baseline; F0 = end of intervention; F2 = two months after the intervention; F4 = four months after the intervention; F6 = six months after the intervention; F12 = twelve months after the intervention; Δ = difference between two measurement points; FX = respective measurement point; r = correlation coefficient; PCS = Physical Component Summary Score; MCS = Mental Component Summary Score.
Table A8. Spearman-Rho Test for measuring correlations: Influence of different factors on the effect of the app on the BMI at the measurement points.
Independent Factor F0F2F4F6F12
Course durationr0.0360.0380.0100.030−0.056
p0.7760.7670.9390.8250.712
n6463605746
Motivation training videos F0r0.0600.0500.0480.0300.026
p0.6380.6940.7140.8270.862
n6463605746
Motivation “my focus” F0r0.2220.2100.2270.2270.286
p0.0780.0990.0810.0890.054
n6463605746
Motivation “practical tips” F0r0.1780.1640.1900.1900.140
p0.1590.1990.1460.1580.353
n6463605746
Usage training videos FXr 0.2320.1300.2130.452
p0.0670.3220.1140.002
n63605646
Usage practical tips FXr 0.182−0.0150.1610.061
p0.1530.9070.2370.688
n63595646
Abbreviations: F0 = end of intervention; F2 = two months after the intervention; F4 = four months after the intervention; F6 = six months after the intervention; F12 = twelve months after the intervention; FX = respective measurement point; r = correlation coefficient; PCS = Physical Component Summary Score; MCS = Mental Component Summary Score.
Table A9. Spearman-Rho Test for measuring correlations: Influence of different factors on the effect of the app on the BMI between B0 and the following measurement points.
Independent Factor ΔB0-F0ΔB0-F2ΔB0-F4ΔB0-F6ΔB0-F12
Course durationr0.0210.0550.1710.2280.066
p0.8720.6660.1910.0880.663
n6463585746
Motivation training videos F0r0.000−0.130−0.187−0.160−0.074
p1.0000.3090.1520.2350.624
n6463605746
Motivation “my focus” F0r−0.139−0.269−0.277−0.215−0.059
p0.2720.0330.0320.1090.696
n6463605746
Motivation “practical tips” F0r−0.177−0.290−0.291−0.266−0.150
p0.1620.0210.0240.0460.320
n6463605746
Usage training videos FXr −0.160−0.258−0.447−0.160
p0.2090.0480.0010.288
n63605646
Usage practical tips FXr −0.298−0.203−0.359−0.107
p0.0180.1230.0070.479
n63595646
Abbreviations: B0 = baseline; F0 = end of intervention; F2 = two months after the intervention; F4 = four months after the intervention; F6 = six months after the intervention; F12 = twelve months after the intervention; Δ = difference between two measurement points; FX = respective measurement point; r = correlation coefficient; PCS = Physical Component Summary Score; MCS = Mental Component Summary Score.
Table A10. Mann-Whiney-U test: Influence of different factors on the effect of the app on the physical activity at the different measurement points.
VariableGroup VariablenMiddle Rankpzr
MET-min/Wo F0Prepayment 130€1119.050.008−2.6340.329
No costs5335.29
Usage of other health apps1431.040.739−0.3330.042
No other health apps5032.91
Other health courses 13234.090.493−0.6850.086
No other health courses 13230.91
During high COVID incidences 23636.130.169−1.3740.172
Outside high COVID incidences 22829.68
MET-min/Wo F2Prepayment 130€1020.600.042−2.0260.259
No costs5133.04
Usage of other health apps1230.380.892−0.1360.017
No other health apps4931.15
Other health courses 12931.330.891−0.1370.018
No other health courses 13230.70
During high COVID incidences 21231.290.949−0.0640.008
Outside high COVID incidences 24930.93
MET-min/Wo F4Prepayment 130€1114.09<0.001−3.3620.441
No costs4733.11
Usage of other health apps1128.090.758−0.3070.040
No other health apps4729.83
Other health courses 12027.630.540−0.6140.081
No other health courses 13830.49
During high COVID incidences 21826.280.330−0.9750.128
Outside high COVID incidences 24030.95
MET-min/Wo F6Prepayment 130€1116.090.008−2.6320.362
No costs4229.86
Usage of other health apps1027.200.964−0.0450.006
No other health apps4326.95
Other health courses 12225.890.658−0.4420.061
No other health courses 13127.79
During high COVID incidences 21521.030.077−1.7670.243
Outside high COVID incidences 23829.36
MET-min/Wo F12Prepayment 130€912.940.043−2.0260.329
No costs2921.53
Usage of other health apps1016.300.302−1.0610.172
No other health apps2820.64
Other health courses 11020.250.804−0.2490.040
No other health courses 12819.23
During high COVID incidences 21416.290.180−0.1730.028
Outside high COVID incidences 22421.38
Notes: 1 = Other health courses within the last six months at the time of baseline; 2 = High incidences appeared in March to April 2020 and November 2020 to February 2021. Abbreviations: F0 = end of intervention; F2 = two months after the intervention; F4 = four months after the intervention; F6 = six months after the intervention; F12 = twelve months after the intervention; Δ = difference between two measurement points.
Table A11. Mann-Whiney-U test: Influence of different factors on the effect of the app on the physical activity between the different measurement points and B0.
VariableGroup VariablenMiddle Rankpzr
Δ MET-min/Wo B0-F0Prepayment 130€1028.200.475−0.7150.090
No costs5332.72
Usage of other health apps1428.860.467−0.7270.090
No other health apps4932.90
Other health courses 13232.360.874−0.1580.020
No other health courses 13131.63
During high COVID incidences 22730.410.550−0.5970.075
Outside high COVID incidences 23633.19
Δ MET-min/WoPrepayment 130€937.560.189−1.3150.170
B0-F2No costs5129.25
Usage of other health apps1224.460.180−1.3400.173
No other health apps4832.01
Other health courses 12932.090.496−0.6810.064
No other health courses 13129.02
During high COVID incidences 21223.880.142−1.4690.190
Outside high COVID incidences 24832.16
Δ MET-min/WoPrepayment 130€1024.700.367−0.9020.119
B0-F4No costs4729.91
Usage of other health apps1122.180.129−1.5170.201
No other health apps4630.63
Other health courses 12027.430.598−0.5270.070
No other health courses 13729.85
During high COVID incidences 21823.470.088−1.7080.226
Outside high COVID incidences 23931.55
Δ MET-min/WoPrepayment 130€1024.700.157−1.4160.196
B0-F6No costs4226.93
Usage of other health apps1020.400.676−0.4180.058
No other health apps4227.95
Other health courses 12228.360.448−0.7590.105
No other health courses 13025.13
During high COVID incidences 21525.300.716−0.3640.033
Outside high COVID incidences 23726.99
Δ MET-min/WoPrepayment 130€818.190.814−0.2400.039
B0-F12No costs2919.22
Usage of other health apps1013.950.084−1.7270.284
No other health apps2720.87
Other health courses 11021.250.448−0.7700.127
No other health courses 12718.17
During high COVID incidences 21420.640.486−0.7200.118
Outside high COVID incidences 22318.00
Notes: 1 = Other health courses within the last six months at the time of baseline; 2 = High incidences appeared in March to April 2020 and November 2020 to February 2021. Abbreviations: B0 = baseline; F0 = end of intervention; F2 = two months after the intervention; F4 = four months after the intervention; F6 = six months after the intervention; F12 = twelve months after the intervention; Δ = difference between two measurement points.
Table A12. Mann-Whiney-U test: Influence of different factors on the effect of the app on the BMI at the different measurement points.
VariableGroup VariablenMiddle Rankpzr
BMI F0Prepayment 130€1131.910.908−0.1160.015
No costs5332.62
Usage of other health apps1433.320.852−0.1870.023
No other health apps5032.27
Other health courses 13231.890.793−0.2620.033
No other health courses 13233.11
During high COVID incidences 22936.930.083−1.7330.217
Outside high COVID incidences 23528.83
BMI F2Prepayment 130€1131.910.986−0.0180.002
No costs5232.02
Usage of other health apps1432.250.954−0.0580.007
No other health apps4931.93
Other health courses 13031.820.94−0.0760.010
No other health courses 13332.17
During high COVID incidences 21433.860.667−0.4300.054
Outside high COVID incidences 24931.47
BMI F4Prepayment 130€1129.980.937−0.0790.010
No costs4729.41
Usage of other health apps1132.090.572−0.5650.074
No other health apps4728.89
Other health courses 12126.690.34−0.9550.125
No other health courses 13731.09
During high COVID incidences 21724.210.124−1.5370.202
Outside high COVID incidences 24131.70
BMI F6Prepayment 130€1128.680.78−0.2790.038
No costs4327.20
Usage of other health apps1027.350.973−0.0330.132
No other health apps4427.53
Other health courses 12326.570.707−0.3760.051
No other health courses 13128.19
During high COVID incidences 21528.970.671−0.4250.058
Outside high COVID incidences 23926.94
BMI F12Prepayment 130€919.410.932−0.0860.014
No costs2919.78
Usage of other health apps1019.800.935−0.0990.016
No other health apps2819.39
Other health courses 11016.100.260−1.1270.183
No other health courses 12820.71
During high COVID incidences 21417.860.486−0.6960.113
Outside high COVID incidences 22420.46
Notes: 1 = Other health courses within the last six months at the time of baseline; 2 = High incidences appeared in March to April 2020 and November 2020 to February 2021. Abbreviations: B0 = baseline; F0 = end of intervention; F2 = two months after the intervention; F4 = four months after the intervention; F6 = six months after the intervention; F12 = twelve months after the intervention; Δ = difference between two measurement points.
Table A13. Mann-Whiney-U test: Influence of different factors on the effect of the app on the BMI between the different measurement points and B0.
VariableGroup VariablenMiddle Rankpzr
Δ BMI B0-F0Prepayment 130€1135.640.533−0.6240.078
No costs5331.85
Usage of other health apps1429.820.536−0.6190.077
No other health apps5033.23
Other health courses 13232.970.838−0.2050.026
No other health courses 13232.03
During high COVID incidences 22928.780.139−0.4790.060
Outside high COVID incidences 23535.59
Δ BMI B0-F2Prepayment 130€1133.730.729−0.3470.044
No costs5231.63
Usage of other health apps1428.250.381−0.8750.110
No other health apps4933.07
Other health courses 13031.780.928−0.0900.011
No other health courses 13332.20
During high COVID incidences 21433.040.809−0.2420.030
Outside high COVID incidences 24931.70
Δ BMI B0-F4Prepayment 130€1128.180.771−0.2910.038
No costs4729.81
Usage of other health apps1133.090.428−0.7920.104
No other health apps4728.66
Other health courses 12133.480.172−1.3650.179
No other health courses 13727.24
During high COVID incidences 21730.180.843−0.1990.026
Outside high COVID incidences 24129.22
Δ BMI B0-F6Prepayment 130€1130.180.522−0.6400.087
No costs4326.81
Usage of other health apps1028.200.875−0.1580.022
No other health apps4427.34
Other health courses 12329.800.349−0.9370.128
No other health courses 13125.79
During high COVID incidences 21529.400.578−0.5560.076
Outside high COVID incidences 23926.77
Δ BMI B0-F12Prepayment 130€920.390.782−0.2770.045
No costs2919.22
Usage of other health apps1021.700.463−0.7340.119
No other health apps2818.71
Other health courses 11017.000.404−0.8340.136
No other health courses 12820.39
During high COVID incidences 21424.640.028−2.1930.356
Outside high COVID incidences 22416.50
Notes: 1 = Other health courses within the last six months at the time of baseline; 2 = High incidences appeared in March to April 2020 and November 2020 to February 2021. Abbreviations: B0 = baseline; F0 = end of intervention; F2 = two months after the intervention; F4 = four months after the intervention; F6 = six months after the intervention; F12 = twelve months after the intervention; Δ = difference between two measurement points.

References

  1. Lee, I.-M.M.; Shiroma, E.J.; Lobelo, F.; Puska, P.; Blair, S.N.; Katzmarzyk, P.T.; Alkandari, J.R.; Andersen, L.B.; Bauman, A.E.; Brownson, R.C.; et al. Effect of physical inactivity on major non-communicable diseases worldwide: An analysis of burden of disease and life expectancy. Lancet 2012, 380, 219–229. [Google Scholar] [CrossRef] [Green Version]
  2. World Health Organization Global Health Risks: Mortality and Burden of Disease Attributable to Selected Major Risks. Available online: https://apps.who.int/iris/handle/10665/44203 (accessed on 23 November 2020).
  3. Warburton, D.E.R.; Nicol, C.W.; Bredin, S.S.D. Health benefits of physical activity: The evidence. CMAJ 2006, 174, 801–809. [Google Scholar] [CrossRef] [PubMed] [Green Version]
  4. Guthold, R.; Stevens, G.A.; Riley, L.M.; Bull, F.C. Worldwide trends in insufficient physical activity from 2001 to 2016: A pooled analysis of 358 population-based surveys with 1·9 million participants. Lancet Glob. Health 2018, 6, e1077–e1086. [Google Scholar] [CrossRef] [Green Version]
  5. Fiuza-Luces, C.; Garatachea, N.; Berger, N.A.; Lucia, A. Exercise is the real polypill. Physiology 2013, 28, 330–358. [Google Scholar] [CrossRef] [PubMed] [Green Version]
  6. Zhao, J.; Freeman, B.; Li, M. Can mobile phone apps influence people’s health behavior change? An evidence review. J. Med. Internet Res. 2016, 18, e287. [Google Scholar] [CrossRef] [Green Version]
  7. Coughlin, S.S.; Whitehead, M.; Sheats, J.Q.; Mastromonico, J.; Smith, S. A Review of Smartphone Applications for Promoting Physical Activity. Jacobs J. Community Med. 2016, 2, 21. [Google Scholar]
  8. Alexander Fleming, G.; Petrie, J.R.; Bergenstal, R.M.; Holl, R.W.; Peters, A.L.; Heinemann, L. Diabetes digital app technology: Benefits, challenges, and recommendations. A consensus report by the European Association for the Study of Diabetes (EASD) and the American Diabetes Association (ADA) Diabetes Technology Working Group. Diabetes Care 2020, 43, 250–260. [Google Scholar] [CrossRef] [Green Version]
  9. Fanning, J.; Mullen, S.P.; Mcauley, E. Edward Increasing Physical Activity With Mobile Devices: A Meta-Analysis. J. Med. Internet Res. 2012, 14, e161. [Google Scholar] [CrossRef]
  10. Muralidharan, S.; Ranjani, H.; Anjana, R.; Allender, S.; Mohan, V. Mobile health technology in the prevention and management of Type 2 diabetes. Indian J. Endocrinol. Metab. 2017, 21, 334–340. [Google Scholar]
  11. Romeo, A.; Edney, S.; Plotnikoff, R.; Curtis, R.; Ryan, J.; Sanders, I.; Crozier, A.; Maher, C. Can smartphone apps increase physical activity? systematic review and meta-analysis. J. Med. Internet Res. 2019, 21, e12053. [Google Scholar] [CrossRef]
  12. Schoeppe, S.; Alley, S.; Van Lippevelde, W.; Bray, N.A.; Williams, S.L.; Duncan, M.J.; Vandelanotte, C. Efficacy of interventions that use apps to improve diet, physical activity and sedentary behaviour: A systematic review. Int. J. Behav. Nutr. Phys. Act. 2016, 13, 1–26. [Google Scholar] [CrossRef] [PubMed] [Green Version]
  13. Dunkley, A.J.; Bodicoat, D.H.; Greaves, C.J.; Russell, C.; Yates, T.; Davies, M.J.; Khunti, K. Diabetes prevention in the real world: Effectiveness of pragmatic lifestyle interventions for the prevention of type 2 diabetes and of the impact of adherence to guideline recommendations—A systematic review and meta-analysis. Diabetes Care 2014, 37, 922–933. [Google Scholar] [CrossRef] [PubMed] [Green Version]
  14. Pagoto, S.; Schneider, K.; Jojic, M.; Debiasse, M.; Mann, D. Evidence-based strategies in weight-loss mobile apps. Am. J. Prev. Med. 2013, 45, 576–582. [Google Scholar] [CrossRef]
  15. Knight, E.; Stuckey, M.I.; Prapavessis, H.; Petrella, R.J. Public Health Guidelines for Physical Activity: Is There an App for That? A Review of Android and Apple App Stores. JMIR mHealth uHealth 2015, 3, e43. [Google Scholar] [CrossRef]
  16. Lee, M.; Lee, H.; Kim, Y.; Kim, J.; Cho, M.; Jang, J.; Jang, H. Mobile App-Based Health Promotion Programs: A Systematic Review of the Literature. Int. J. Environ. Res. Public Health 2018, 15, 2838. [Google Scholar] [CrossRef] [Green Version]
  17. Stuckey, M.I.; Carter, S.W.; Knight, E. The role of smartphones in encouraging physical activity in adults. Int. J. Gen. Med. 2017, 10, 293–303. [Google Scholar] [CrossRef] [Green Version]
  18. Rutz, M.; Kühn, D.; Dierks, M.-L. Kapitel 5. Gesundheits—Apps und Prävention. In Chancen und Risiken von Gesundheits-Apps (CHARISMHA); Albrecht, U.-V. (Hrsg.), Ed.; Medizinische Hochschule Hannover: Hannover, Germany, 2016; Available online: http://www.digibib.tu-bs.de/?docid=60010www.charismha.de (accessed on 3 December 2020).
  19. Van Rhoon, L.; Byrne, M.; Morrissey, E.; Murphy, J.; McSharry, J. A systematic review of the behaviour change techniques and digital features in technology-driven type 2 diabetes prevention interventions. Digit. Health 2020, 6. [Google Scholar] [CrossRef]
  20. Schwarzer, R. Self-Efficacy through Control of Action, 1st ed.; Hemisphere Publishing Corporation: Washington, DC, USA, 1992; ISBN 1560322691. [Google Scholar]
  21. Lyons, E.J.; Hatkevich, C. Prevalence of behavior changing strategies in fitness video games: Theory-based content analysis. J. Med. Internet Res. 2013, 15, e2403. [Google Scholar] [CrossRef] [PubMed]
  22. Tuong, W.; Larsen, E.R.; Armstrong, A.W. Videos to influence: A systematic review of effectiveness of video-based education in modifying health behaviors. J. Behav. Med. 2014, 37, 218–233. [Google Scholar] [CrossRef] [PubMed]
  23. Alley, S.; Jennings, C.; Plotnikoff, R.C.; Vandelanotte, C. Web-Based Video-Coaching to Assist an Automated Computer-Tailored Physical Activity Intervention for Inactive Adults: A Randomized Controlled Trial. J. Med. Internet Res. 2016, 18, e223. [Google Scholar] [CrossRef] [Green Version]
  24. Fischer, T.; Stumpf, P.; Reinhardt, G.; Schwarz, P.E.H.; Timpel, P. Video-based smartphone app (‘VIDEA bewegt’) for physical activity support in German adults: A study protocol for a single-armed observational study. BMJ Open 2020, 10, e034027. [Google Scholar] [CrossRef] [Green Version]
  25. Fischer, T.; Stumpf, P.; Schwarz, P.E.H.; Timpel, P. A video-based smartphone app (“VIDEA bewegt”) for physical activity support in German adults, a single armed observational study. BMJ Open 2021. under revised. [Google Scholar] [CrossRef] [Green Version]
  26. Eysenbach, G. Consort-ehealth: Improving and standardizing evaluation reports of web-based and mobile health interventions. J. Med. Internet Res. 2011, 13, e1923. [Google Scholar] [CrossRef] [PubMed]
  27. Olander, E.K.; Fletcher, H.; Williams, S.; Atkinson, L.; Turner, A.; French, D.P. What are the most effective techniques in changing obese individuals’ physical activity self-efficacy and behaviour: A systematic review and meta-analysis. Int. J. Behav. Nutr. Phys. Act. 2013, 10, 1–15. [Google Scholar] [CrossRef]
  28. Parkinson, J.; David, P.; Rundle-Thiele, S. Self-efficacy or perceived behavioural control: Which influences consumers’ physical activity and healthful eating behaviour maintenance? J. Consum. Behav. 2017, 16, 413–423. [Google Scholar] [CrossRef]
  29. Lindström, J.; Louheranta, A.; Mannelin, M.; Rastas, M.; Salminen, V.; Eriksson, J.; Uusitupa, M.; Tuomilehto, J. The Finnish Diabetes Prevention Study (DPS). Diabetes Care 2003, 26, 3230–3236. [Google Scholar] [CrossRef] [PubMed] [Green Version]
  30. Ajzen, I. The theory of planned behavior: Frequently asked questions. Hum. Behav. Emerg. Technol. 2020, 2, 314–324. [Google Scholar] [CrossRef]
  31. Gardner, B.; Rebar, A.L. Habit Formation and Behavior Change. Oxford Res. Encycl. Psychol. 2019. [Google Scholar] [CrossRef]
  32. Hofmann, B.; Stanak, M. Nudging in screening: Literature review and ethical guidance. Patient Educ. Couns. 2018, 101, 1561–1569. [Google Scholar] [CrossRef] [Green Version]
  33. Kohl, H.W.; Craig, C.L.; Lambert, E.V.; Inoue, S.; Alkandari, J.R.; Leetongin, G.; Kahlmeier, S.; Andersen, L.B.; Bauman, A.E.; Blair, S.N.; et al. The pandemic of physical inactivity: Global action for public health. Lancet 2012, 380, 294–305. [Google Scholar] [CrossRef] [Green Version]
  34. Gardner, L.; Leshner, G. The Role of Narrative and Other-Referencing in Attenuating Psychological Reactance to Diabetes Self-Care Messages. Health Commun. 2016, 31, 738–751. [Google Scholar] [CrossRef]
  35. Calderón-Mora, J.; Alomari, A.; Byrd, T.L.; Shokar, N.K. Evaluation of a Narrative Video to Promote Prevention and Early Detection of Cervical Cancer Among Latinas. Health Promot. Pract. 2021. [Google Scholar] [CrossRef] [PubMed]
  36. VIDEA BEWEGT. Available online: https://videabewegt.de/ (accessed on 24 April 2021).
  37. World Health Organization. Global Physical Activity Questionnaire (GPAQ). In Analysis Guide; WHO: Geneva, Switzerland, 2005; pp. 46–49. [Google Scholar] [CrossRef] [Green Version]
  38. Armstrong, T.; Bull, F. Development of the world health organization global physical activity questionnaire (GPAQ). J. Public Health 2006, 14, 66–70. [Google Scholar] [CrossRef]
  39. Wanner, M.; Hartmann, C.; Pestoni, G.; Martin, B.W.; Siegrist, M.; Martin-diener, E.; Ch, M.W.; Hartmann, C.; Pestoni, G.; Martin, B.W.; et al. Validation of the Global Physical Activity Questionnaire for self-administration in a European context. Exerc. Med. 2017, 3, 206. [Google Scholar] [CrossRef] [PubMed] [Green Version]
  40. Ellert, U.; Lampert, T.; Ravens-Sieberer, U. Messung der gesundheitsbezogenen Lebensqualität mit dem SF-8. Eine Normstichprobe für Deutschland. Bundesgesundheitsblatt-Gesundheitsforsch.-Gesundheitsschutz 2005, 48, 1330–1337. [Google Scholar] [CrossRef]
  41. Ware, J.E.; Kosinski, M.; Dewey, J.E.; Gandek, B. How to Score and Interpret Single-Item Health Status Measures: A Manual for Users of the SF-8 Health Survey—ScienceOpen. Available online: https://www.scienceopen.com/document?vid=7b91998e-ec0f-420a-b894-9251a41423d9 (accessed on 23 May 2020).
  42. World Health Organization. WHO STEPS Surveillance Manual; WHO: Geneva, Switzerland, 2017. [Google Scholar]
  43. Harris, T.; Kerry, S.M.; Limb, E.S.; Furness, C.; Wahlich, C.; Victor, C.R.; Iliffe, S.; Whincup, P.H.; Ussher, M.; Ekelund, U.; et al. Physical activity levels in adults and older adults 3–4 years after pedometer-based walking interventions: Long-term follow-up of participants from two randomised controlled trials in UK primary care. PLoS Med. 2018, 15, e1002526. [Google Scholar] [CrossRef]
  44. Kari, T.; Makkonen, M.; Carlsson, J.; Frank, L. Using a Physical Activity Application to Promote Physical Activity Levels among Aged People: A Follow-Up Study. In Proceedings of the Hawaii International Conference on System Sciences, Kauai, HI, USA, 4–8 January 2021; ISBN 9780998133140. [Google Scholar]
  45. Mobile Health 2012|Pew Research Center. Available online: https://www.pewresearch.org/internet/2012/11/08/mobile-health-2012/ (accessed on 23 November 2021).
  46. Guertler, D.; Vandelanotte, C.; Kirwan, M.; Duncan, M.J. Engagement and nonusage attrition with a free physical activity promotion program: The case of 10,000 steps Australia. J. Med. Internet Res. 2015, 17, e176. [Google Scholar] [CrossRef] [Green Version]
  47. Wood, D. Established and emerging cardiovascular risk factors. Am. Heart J. 2001, 141, S49–S57. [Google Scholar] [CrossRef]
  48. Kebede, M.M.; Zeeb, H.; Peters, M.; Heise, T.L.; Pischke, C.R. Effectiveness of Digital Interventions for Improving Glycemic Control in Persons with Poorly Controlled Type 2 Diabetes: A Systematic Review, Meta-analysis, and Meta-regression Analysis. Diabetes Technol. Ther. 2018, 20, 767–782. [Google Scholar] [CrossRef]
  49. Balia, S.; Jones, A.M. Mortality, lifestyle and socio-economic status. J. Health Econ. 2008, 27, 1–26. [Google Scholar] [CrossRef] [Green Version]
  50. King, A.C.; Hekler, E.B.; Grieco, L.A.; Winter, S.J.; Sheats, J.L.; Buman, M.P.; Banerjee, B.; Robinson, T.N.; Cirimele, J. Effects of Three Motivationally Targeted Mobile Device Applications on Initial Physical Activity and Sedentary Behavior Change in Midlife and Older Adults: A Randomized Trial. PLoS ONE 2016, 11, e0156370. [Google Scholar] [CrossRef]
  51. Lee, K.; Kwon, H.; Lee, B.; Lee, G.; Lee, J.H.; Park, Y.R.; Shin, S.Y. Effect of self-monitoring on long-term patient engagement with mobile health applications. PLoS ONE 2018, 13, e0201166. [Google Scholar] [CrossRef] [PubMed] [Green Version]
  52. Timpel, P.; Oswald, S.; Schwarz, P.E.H.; Harst, L. Mapping the Evidence on the Effectiveness of Telemedicine Interventions in Diabetes, Dyslipidemia, and Hypertension: An Umbrella Review of Systematic Reviews and Meta-Analyses. J. Med. Internet Res. 2020, 22, e16791. [Google Scholar] [CrossRef] [PubMed]
  53. Adams, S.A.; Matthews, C.E.; Ebbeling, C.B.; Moore, C.G.; Cunningham, J.E.; Fulton, J.; Hebert, J.R. The effect of social desirability and social approval on self-reports of physical activity. Am. J. Epidemiol. 2005, 161, 389–398. [Google Scholar] [CrossRef] [PubMed]
  54. Fukuoka, Y.; Haskell, W.; Lin, F.; Vittinghoff, E. Short- And long-term effects of a mobile phone app in conjunction with brief in-person counseling on physical activity among Physically InactiveWomen the mPED Randomized Clinical Trial. JAMA Netw. Open 2019, 2, e194281. [Google Scholar] [CrossRef] [Green Version]
  55. Turner, T.; Hingle, M. Evaluation of a Mindfulness-Based Mobile App Aimed at Promoting Awareness of Weight-Related Behaviors in Adolescents: A Pilot Study. JMIR Res. Protoc. 2017, 6, e67. [Google Scholar] [CrossRef] [Green Version]
  56. Eckardt, I.; Buschhaus, C.; Nickenig, G.; Jansen, F. Smartphone app-guided secondary prevention in patients with coronary heart disease. Eur. J. Prev. Cardiol. 2021, 28. [Google Scholar] [CrossRef]
  57. Al-Khudairy, L.; Loveman, E.; Colquitt, J.L.; Mead, E.; Johnson, R.E.; Fraser, H.; Olajide, J.; Murphy, M.; Velho, R.M.; O’Malley, C.; et al. Diet, physical activity and behavioural interventions for the treatment of overweight or obese adolescents aged 12 to 17 years. Cochrane Database Syst. Rev. 2017, 6, CD012691. [Google Scholar] [CrossRef] [Green Version]
  58. Harst, L.; Lantzsch, H.; Scheibe, M. Theories predicting end-user acceptance of telemedicine use: Systematic review. J. Med. Internet Res. 2019, 21, e13117. [Google Scholar] [CrossRef] [Green Version]
  59. Sarfati, D.; Howden-Chapman, P.; Woodward, A.; Salmond, C. Does the frame affect the picture? A study into how attitudes to screening for cancer care are affected by the way benefits are expressed. J. Med. Screen. 1998, 5, 137–140. [Google Scholar] [CrossRef]
  60. Lie, S.S.; Karlsen, B.B.; Oord, E.R.; Graue, M.; Oftedal, B.B. Dropout From an eHealth Intervention for Adults With Type 2 Diabetes: A Qualitative Study. J. Med. Internet Res. 2017, 19, e187. [Google Scholar] [CrossRef] [PubMed]
  61. Matthews, C.E.; Moore, S.C.; Sampson, J.; Blair, A.; Xiao, Q.; Keadle, S.K.; Hollenbeck, A.; Park, Y. Mortality Benefits for Replacing Sitting Time with Different Physical Activities. Med. Sci. Sports Exerc. 2015, 47, 1833–1840. [Google Scholar] [CrossRef] [PubMed] [Green Version]
  62. Tucker, P.; Gilliland, J. The effect of season and weather on physical activity: A systematic review. Public Health 2007, 121, 909–922. [Google Scholar] [CrossRef]
  63. Shephard, R.J.; Aoyagi, Y. Seasonal variations in physical activity and implications for human health. Eur. J. Appl. Physiol. 2009, 107, 251–271. [Google Scholar] [CrossRef] [PubMed]
  64. Timpel, P.; Harst, L. Research implications for future telemedicine studies and innovations in diabetes and hypertension—A mixed methods study. Nutrients 2020, 12, 1340. [Google Scholar] [CrossRef] [PubMed]
  65. Corrigan-Curay, J.; Sacks, L.; Woodcock, J. Real-world evidence and real-world data for evaluating drug safety and effectiveness. JAMA-J. Am. Med. Assoc. 2018, 320, 867–868. [Google Scholar] [CrossRef] [PubMed]
  66. Reinhardt, G.; Schwarz, P.E.; Harst, L. Non-use of telemedicine: A scoping review. Health Inform. J. 2021, 27. [Google Scholar] [CrossRef]
  67. Greaves, C.J.; Reddy, P.; Sheppard, K. Supporting behaviour change for diabetes prevention. Diabetes Prev. Pract. 2010, 1, 19–29. [Google Scholar]
  68. Chu, A.H.Y.; Ng, S.H.X.; Koh, D.; Müller-Riemenschneider, F.; Brucki, S. Reliability and validity of the self- and interviewer-administered versions of the Global Physical Activity Questionnaire (GPAQ). PLoS ONE 2015, 10, e0136944. [Google Scholar] [CrossRef]
  69. Beierlein, V.; Morfeld, M.; Bergelt, C.; Bullinger, M.; Brähler, E. Messung der gesundheitsbezogenen Lebensqualität mit dem SF-8. Diagnostica 2012, 58, 145–153. [Google Scholar] [CrossRef]
Figure 1. Study concept: measurement points and methods. 1 other analogue or digital lifestyle interventions than “VIDEA bewegt”. Abbreviations: B0 = baseline; F0 = end of intervention; F2 = two months after the program; F4 = four months after the program; F6 = six months after the program; F12 = twelve months after the program; GPAQ = Global Physical Activity Questionnaire, MET = metabolic equivalent, SF-8 = Short Form Health Survey; PCS = Physical Component Summary Score; MCS = Mental Component Summary Score.
Nutrients 13 04215 g001
Figure 2. Motivation for long-term usage of app components at the end of the intervention. Notes: presentation in percentages.
Nutrients 13 04215 g002
Figure 3. Sustained use of exercises contained in the training videos. Notes: Presentation in numbers of participants. Abbreviations: F2 = two months after the intervention; F4 = four months after the intervention; F6 = six months after the intervention; F12 = twelve months after the intervention.
Nutrients 13 04215 g003
Figure 4. Sustained use of practical tips contained in videos of the app. Notes: Presentation in numbers of participants. Abbreviations: F2 = two months after the intervention; F4 = four months after the intervention; F6 = six months after the intervention; F12 = twelve months after the intervention.
Nutrients 13 04215 g004
Figure 5. Application of different components of the rubric “my focus”. Abbreviations: F2 = two months after the intervention; F4 = four months after the intervention; F6 = six months after the intervention; F12 = twelve months after the intervention.
Nutrients 13 04215 g005
Figure 6. Long-term improvement of health knowledge due to “VIDEA bewegt”. Notes: Presentation in numbers of participants. Abbreviations: F2 = two months after the intervention, F4 = four months after the intervention, F6 = six months after the intervention, F12 = twelve months after the intervention.
Nutrients 13 04215 g006
Table 1. Characteristics of the study participants.
Overall n65
Sex [%, (n)]
female81.5(53)
male18.5(12)
Age [years]
Mean, Median4952
20–29 [%, (n)]12.3(8)
30–39 [%, (n)]13.8(9)
40–49 [%, (n)]18.5(12)
50–59 [%, (n)]29.2(19)
60–69 [%, (n)]21.5(14)
70–79 [%, (n)]4.6(3)
BMI
Mean, Median [kg/m2]27.0426.11
Normal weight [%, (n)]45.3(29)
Overweight [%, (n)]25(16)
Obesity [%, (n)]29.7(19)
Marital status [%, (n)]
Married58.5(38)
Living in a stable relationship13.8(9)
Divorced or separated12.3(8)
Single10.8(7)
Widowed3.1(2)
Other1.5(1)
Level of education [%, (n)]
University degree38.5(25)
Completed vocational training32.3(21)
High school (12 years or more)10.8(7)
Secondary school (10 or 11 years)13.8(9)
Main school (9 years or less)1.5(1)
Other3.1(2)
Employment status [%, (n)]
Full-time46.2(30)
Half-time15.4(10)
Part-time7.7(5)
Not employed10.8(7)
Retired20(13)
Length of program use [days]
Mean, Median136.787
Source of information 1 [%, (n)]
Health insurance53.8(35)
Doctor15.4(10)
Internet15.4(10)
Social environment13.9(9)
Others1.5(1)
Participation in other sport courses 2 [%, (n)]46.2(30)
Use of other health apps 2 [%, (n)]21.5(14)
Health insurance provider [%, (n)]
AOK PLUS, AOK Rheinland/Hamburg 383.1(54)
Other statutory insurance 413.8(9)
Private insurance 43.1(2)
1 about the app “VIDEA bewegt”; 2 interventions other than “VIDEA bewegt”; 3 German statutory insurances where users could participate in the app for free; 4 other German insurances where users had to pay 130€ in advance and were reimbursed part of the course cost after completing the program.
Table 2. Development of MET-minutes per week, using Wilcoxon signed-rank test.
B0F0F2F4F6F12
all participantsn646461605646
Mean468056895090490848763224
(SD)(4938)(6903)(4933)(4687)(4613)(3687)
Median264030803840313035602120
25% quantile14701440172012801070840
75% quantile665074406960657083723630
Wilcoxon 1
p0.1500.2420.5150.7660.032
z−1.441−1.171−0.650−0.297−2.147
r0.1800.1500.0840.0400.317
Wilcoxon 2
p0.4480.6420.2610.002
z−0.759−0.465−1.124−3.136
r0.0970.0600.1500.462
<3000 MET−min/week at B0n343333323026
Mean143531413538308428532005
(SD)(799)(4112)(3439)(3204)(3017)(1753)
Median156017002760178017301410
25% quantile82098010801200855780
75% quantile204034004540384040053250
Wilcoxon 1
p<0.001<0.001<0.0010.0180.258
z−3.931−4.450−3.674−2.368−1.130
r0.6840.7750.6490.4320.222
Wilcoxon 2
p0.3520.9020.4320.124
z−0.931−0.123−0.786−1.537
r0.1620.0220.1440.301
≥3000 MET−min/week at B0n303027272519
Mean835786407159723374615022
(SD)(5091)(8233)(5770)(5212)(5006)(4881)
Median706070205180528052803420
25% quantile439030003360322035722020
75% quantile10,67010,725924010,08011,3707800
Wilcoxon 1
p0.5650.0090.1100.211<0.001
z−0.576−2.631−1.598−1.251−3.421
r0.1050.5060.3080.2500.785
Wilcoxon 2
p0.0880.6920.2640.005
z−1.706−0.396−1.117−2.817
r0.3280.0760.2230.646
<3000 MET−min/week [% (n)]53.1 (34)48.4 (31)36.1 (22)45.0 (27)46.4 (26)58.7 (27)
≥3000 MET−min/week [% (n)]46.9 (30)51.6 (33)63.9 (39)55.0 (33)53.6 (30)41.3 (19)
1 asymptotic, two-sided Wilcoxon test between the baseline and subsequent measurement points; 2 asymptotic, two-sided Wilcoxon test between the end of intervention (F0) and the subsequent measurement points. Abbreviations: B0 = baseline; F0 = end of intervention; F2 = two months after the intervention; F4 = four months after the intervention; F6 = six months after the intervention; F12 = twelve months after the intervention; MET = metabolic equivalent; r = effect size.
Table 3. Development of PCS, using Wilcoxon signed-rank test.
B0F0F2F4F6F12
n656565615845
Mean47.245051.4148.714948.31
(SD)(8.83)(6.94)(6.71)(9.04)(8.05)(9.03)
Median49.7450.4852.3451.1150.1648.92
25% quantile41.3044.6147.7645.4842.0442.10
75% quantile53.3055.4656.6855.8955.8656.96
Wilcoxon 1
p0.003<0.0010.0330.0250.167
z−2.623−4.197−2.133−2.241−1.383
r0.3250.5210.2730.2940.206
1 Wilcoxon signed-rank test between B0 and the follow-up measurements points. Abbreviations: B0 = baseline; F0 = end of intervention; F2 = two months after the intervention; F4 = four months after the intervention; F6 = six months after the intervention; F12 = twelve months after the intervention; PCS = Physical Component Summary Score; r = effect size.
Table 4. Development of MCS, using Wilcoxon signed-rank test.
B0F0F2F4F6F12
n656565615845
Mean47.2251.5950.2849.2548.7845.4
(SD)(9.05)(8.23)(7.86)(10.02)(9.74)(10.04)
Median48.3052.5551.1052.3149.8746.70
25% quantile41.5748.0147.8844.0143.4240.35
75% quantile53.5057.4856.8857.4857.1051.98
Wilcoxon 1
p<0.0010.0060.0540.0270.800
z−3.676−2.773−1.952−2.210−0.254
r0.4560.3440.2500.2900.038
1 Wilcoxon signed-rank test between B0 and the follow-up measurements points. Abbreviations: B0 = baseline; F0 = end of intervention; F2 = two months after the intervention; F4 = four months after the intervention; F6 = six months after the intervention; F12 = twelve months after the intervention; MCS = Mental Component Summary Score; r = effect size.
Table 5. Development of the BMI, using Wilcoxon signed-rank test.
B0F0F2F4F6F12
n646463605746
Mean27.04 (5.61)26.57 (5.38)26.56 (5.17)26.45 (5.25)26.31 (5.01)26.06 (4.92)
(SD)
Median26.1224.9125.3825.4425.1624.85
25% quantile22.5522.5222.5922.1622.5024.85
75% quantile31.2230.5930.1029.7529.3430.12
Wilcoxon 1
p<0.001<0.0010.002<0.0010.624
z−3.530−3.794−3.169−3.514−0.490
r0.4410.4780.4090.4650.072
1 Wilcoxon signed-rank test between B0 and the follow-up measurements points. Abbreviations: B0 = baseline; F0 = end of intervention; F2 = two months after the intervention; F4 = four months after the intervention; F6 = six months after the intervention, F12 = twelve months after the intervention; SD = standard deviation; r = effect size.
Publisher’s Note: MDPI stays neutral with regard to jurisdictional claims in published maps and institutional affiliations.

