
Body Composition and Its Impact on the Hormonal Disturbances in Women with Polycystic Ovary Syndrome

 , , and
Abstract
:1. Introduction
2. Materials and Methods
2.1. Assessment of Body Composition
2.2. Hormone and SHBG Concentrations
2.3. Statistical Analysis
3. Results
4. Discussion
5. Conclusions
- In the group of women with PCOS, the alteration in the value of body composition parameters were significantly associated with the concentration of SHBG and fTest.
- The concentration of AMH and the value of BMI were the parameters most strongly and independently related to belonging to the PCOS group.
Author Contributions
Funding
Institutional Review Board Statement
Informed Consent Statement
Data Availability Statement
Conflicts of Interest
References
- Swinburn, B.A.; Caterson, I.; Seidell, J.C.; James, W.P.T. Diet, nutrition and the prevention of excess weight gain and obesity. Public Health Nutr. 2004, 7, 123–146. [Google Scholar]
- Barthelmess, E.K.; Naz, R.K. Polycystic ovary syndrome: Current status and future perspective. Front. Biosci. Elite Ed. 2014, 6, 104–119. [Google Scholar]
- Rojas, J.; Chávez, M.; Olivar, L.; Rojas, M.; Morillo, J.; Mejías, J.; Calvo, M.; Bermúdez, V. Polycystic Ovary Syndrome, Insulin Resistance, and Obesity: Navigating the Pathophysiologic Labyrinth. Int. J. Reprod. Med. 2014, 2014, 719050. [Google Scholar] [CrossRef]
- Vilmann, L.S.; Thisted, E.; Baker, J.L.; Holm, J.-C. Development of Obesity and Polycystic Ovary Syndrome in Adolescents. Horm. Res. Paediatr. 2012, 78, 269–278. [Google Scholar] [CrossRef]
- Barber, T.M.; Hanson, P.; Weickert, M.O.; Franks, S. Obesity and Polycystic Ovary Syndrome: Implications for Pathogenesis and Novel Management Strategies. Clin. Med. Insights Reprod. Health 2019, 13, 1179558119874042. [Google Scholar] [CrossRef] [Green Version]
- Yang, H.; Xin, Z.; Feng, J.-P.; Yang, J.-K. Waist-to-height ratio is better than body mass index and waist circumference as a screening criterion for metabolic syndrome in Han Chinese adults. Medicine 2017, 96, e8192. [Google Scholar] [CrossRef] [PubMed]
- Ndefo, U.A.; Eaton, A.; Green, M.R. Polycystic ovary syndrome: A review of treatment options with a focus on pharmacological approaches. P T Peer-Rev. J. Formul. Manag. 2013, 38, 336–355. [Google Scholar]
- Szczuko, M.; Kikut, J.; Szczuko, U.; Szydłowska, I.; Nawrocka-Rutkowska, J.; Ziętek, M.; Verbanac, D.; Saso, L. Nutrition Strategy and Life Style in Polycystic Ovary Syndrome-Narrative Review. Nutrients 2021, 13, 2452. [Google Scholar] [CrossRef] [PubMed]
- Escobar-Morreale, H.F. Polycystic ovary syndrome: Definition, aetiology, diagnosis and treatment. Nat. Rev. Endocrinol. 2018, 14, 270–284. [Google Scholar] [CrossRef] [PubMed]
- Rotterdam ESHRE/ASRM-Sponsored PCOS Consensus Workshop Group. Revised 2003 consensus on diagnostic criteria and long-term health risks related to polycystic ovary syndrome (PCOS). Hum. Reprod. Oxf. Engl. 2004, 19, 41–47. [Google Scholar] [CrossRef] [Green Version]
- Daan, N.M.P.; Louwers, Y.V.; Koster, M.P.H.; Eijkemans, M.J.C.; de Rijke, Y.B.; Lentjes, E.W.G.; Fauser, B.C.J.M.; Laven, J.S. Cardiovascular and metabolic profiles amongst different polycystic ovary syndrome phenotypes: Who is really at risk? Fertil. Steril. 2014, 102, 1444–1451.e3. [Google Scholar] [CrossRef]
- Gažarová, M.; Galšneiderová, M.; Mečiarová, L. Obesity diagnosis and mortality risk based on a body shape index (ABSI) and other indices and anthropometric parameters in university students. Rocz. Panstw. Zakl. Hig. 2019, 70, 267–275. [Google Scholar] [CrossRef] [PubMed]
- Tchernof, A.; Brochu, D.; Maltais-Payette, I.; Mansour, M.F.; Marchand, G.B.; Carreau, A.-M.; Kapeluto, J. Androgens and the Regulation of Adiposity and Body Fat Distribution in Humans. Compr. Physiol. 2018, 8, 1253–1290. [Google Scholar] [PubMed]
- Blouin, K.; Boivin, A.; Tchernof, A. Androgens and body fat distribution. J. Steroid. Biochem. Mol. Biol. 2008, 108, 272–280. [Google Scholar] [CrossRef]
- Polak, A.M.; Adamska, A.; Krentowska, A.; Łebkowska, A.; Hryniewicka, J.; Adamski, M.; Kowalska, I. Body Composition, Serum Concentrations of Androgens and Insulin Resistance in Different Polycystic Ovary Syndrome Phenotypes. J. Clin. Med. 2020, 9, 732. [Google Scholar] [CrossRef] [Green Version]
- Kirchengast, S. Body composition characteristics and body fat distribution in lean women with polycystic ovary syndrome. Hum. Reprod. 2001, 16, 1255–1260. [Google Scholar] [CrossRef] [Green Version]
- Franik, G.; Bizoń, A.; Włoch, S.; Pluta, D.; Blukacz, Ł.; Milnerowicz, H.; Madej, P. The effect of abdominal obesity in patients with polycystic ovary syndrome on metabolic parameters. Eur. Rev. Med. Pharmacol. Sci. 2017, 21, 4755–4761. [Google Scholar]
- Kokot, I.; Lilla Pawlik-Sobecka Płaczkowska, S.; Żółcińska-Wilczyńska, M.; Piwowar, A. The relationship between total body fat and distribution of body fat mass and markers of insulin resistance in young women with normal weight—A pilot study. Clin. Diabetol. 2016, 5, 41–48. [Google Scholar] [CrossRef] [Green Version]
- Flegal, K.M.; Shepherd, J.A.; Looker, A.C.; Graubard, B.I.; Borrud, L.G.; Ogden, C.L.; Harris, T.B.; Everhart, J.E.; Schenker, N. Comparisons of percentage body fat, body mass index, waist circumference, and waist-stature ratio in adults. Am. J. Clin. Nutr. 2009, 89, 500–508. [Google Scholar] [CrossRef]
- Čuta, M.; Bařicová, K.; Černý, D.; Sochor, O. Normal-weight obesity frequency in the Central European urban adult female population of Brno, Czech Republic. Cent. Eur. J. Public Health 2019, 27, 131–134. [Google Scholar] [CrossRef] [PubMed] [Green Version]
- Nuttall, F.Q. Body Mass Index: Obesity, BMI, and Health: A Critical Review. Nutr. Today 2015, 50, 117–128. [Google Scholar] [CrossRef] [Green Version]
- Arusoglu, G. The Use of SenseWear Armband for Assessment of Daily Energy Expenditure and the Relation to Body Fat Distribution and Nutritional Intake in Lean Women with Polycystic Ovary Syndrome. J. Nutr. Metab. 2020, 2020, 9191505. [Google Scholar] [CrossRef]
- Płaczkowska, S.; Pawlik-Sobecka, L.; Kokot, I.; Żółcińska-Wilczyńska, M.; Piwowar, A. Use of direct and indirect methods for measuring body composition of young people—Preliminary report. Fam. Med. Prim. Care Rev. 2015, 17, 33–38. [Google Scholar]
- Després, J.-P. Is visceral obesity the cause of the metabolic syndrome? Ann. Med. 2006, 38, 52–63. [Google Scholar] [CrossRef]
- Giampaolino, P.; Foreste, V.; Di Filippo, C.; Gallo, A.; Mercorio, A.; Serafino, P.; Improda, F.P.; Verrazzo, P.; Zara, G.; Buonfantino, C. Microbiome and PCOS: State-of-Art and Future Aspects. Int. J. Mol. Sci. 2021, 22, 2048. [Google Scholar] [CrossRef] [PubMed]
- Della Corte, L.; Foreste, V.; Barra, F.; Gustavino, C.; Alessandri, F.; Centurioni, M.G.; Ferrero, S.; Bifulco, G.; Giampaolino, P. Current and experimental drug therapy for the treatment of polycystic ovarian syndrome. Expert Opin. Investig. Drugs 2020, 29, 819–830. [Google Scholar] [CrossRef] [PubMed]
- Giampaolino, P.; Della Corte, L.; De Rosa, N.; Mercorio, A.; Bruzzese, D.; Bifulco, G. Ovarian volume and PCOS: A controversial issue. Gynecol. Endocrinol. 2018, 34, 229–232. [Google Scholar] [CrossRef] [PubMed]
- Azrad, M.; Gower, B.A.; Hunter, G.R.; Nagy, T.R. Intra-abdominal adipose tissue is independently associated with sex-hormone binding globulin in premenopausal women. Obesity 2012, 20, 1012–1015. [Google Scholar] [CrossRef] [PubMed]
- Bizoń, A.; Franik, G.; Niepsuj, J.; Czwojdzińska, M.; Leśniewski, M.; Nowak, A.; Szynkaruk-Matusiak, M.; Madej, P.; Piwowar, A. The Associations between Sex Hormones and Lipid Profiles in Serum of Women with Different Phenotypes of Polycystic Ovary Syndrome. J. Clin. Med. 2021, 10, 3941. [Google Scholar] [CrossRef]
- Yucel, A.; Noyan, V.; Sagsoz, N. The association of serum androgens and insulin resistance with fat distribution in polycystic ovary syndrome. Eur. J. Obstet. Gynecol. Reprod. Biol. 2006, 126, 81–86. [Google Scholar] [CrossRef]
- Wei, S.; Schmidt, M.D.; Dwyer, T.; Norman, R.J.; Venn, A.J. Obesity and Menstrual Irregularity: Associations With SHBG, Testosterone, and Insulin. Obesity 2009, 17, 1070–1076. [Google Scholar] [CrossRef] [PubMed]
- Dumesic, D.A.; Akopians, A.L.; Madrigal, V.K.; Ramirez, E.; Margolis, D.J.; Sarma, M.K.; Thomas, A.M.; Grogan, T.R.; Haykal, R.; Schooler, T.A.; et al. Hyperandrogenism Accompanies Increased Intra-Abdominal Fat Storage in Normal Weight Polycystic Ovary Syndrome Women. J. Clin. Endocrinol. Metab. 2016, 101, 4178–4188. [Google Scholar] [CrossRef] [PubMed]
- Deswal, R.; Yadav, A.; Dang, A.S. Sex hormone binding globulin—An important biomarker for predicting PCOS risk: A systematic review and meta-analysis. Syst. Biol. Reprod. Med. 2018, 64, 12–24. [Google Scholar] [CrossRef] [PubMed]
- Lim, S.S.; Norman, R.J.; Davies, M.J.; Moran, L.J. The effect of obesity on polycystic ovary syndrome: A systematic review and meta-analysis. Obes. Rev. Off J. Int. Assoc. Study Obes. 2013, 14, 95–109. [Google Scholar] [CrossRef]
- Cosar, E.; Uçok, K.; Akgün, L.; Köken, G.; Sahin, F.K.; Arioz, D.T.; Baş, O. Body fat composition and distribution in women with polycystic ovary syndrome. Gynecol. Endocrinol. Off J. Int. Soc. Gynecol. Endocrinol. 2008, 24, 428–432. [Google Scholar] [CrossRef]
- Bialka-Kosiec, A.A.; Wilk, K.; Pytel, M.; Skrzypulec-Plinta, V.; Stojko, R.; Drosdzol-Cop, A. Body mass composition and dietary habits in adolescents with polycystic ovary syndrome. Ginekol. Pol. 2019, 90, 589–595. [Google Scholar] [CrossRef] [Green Version]
- Cassar, S.; Teede, H.J.; Moran, L.J.; Joham, A.E.; Harrison, C.L.; Strauss, B.J.; Stepto, N.K. Polycystic ovary syndrome and anti-Müllerian hormone: Role of insulin resistance, androgens, obesity and gonadotrophins. Clin. Endocrinol. 2014, 81, 899–906. [Google Scholar] [CrossRef]
- Luo, E.; Zhang, J.; Song, J.; Feng, D.; Meng, Y.; Jiang, H.; Li, D.; Fang, Y. Serum Anti-Müllerian Hormone Levels Were Negatively Associated With Body Fat Percentage in PCOS Patients. Front. Endocrinol. 2021, 12, 659717. [Google Scholar] [CrossRef] [PubMed]
- Dólleman, M.; Faddy, M.J.; van Disseldorp, J.; van der Schouw, Y.T.; Messow, C.M.; Leader, B.; Peeters, P.H.M.; McConnachie, A.; Nelson, S.M.; Broekmans, F.J.M. The relationship between anti-Müllerian hormone in women receiving fertility assessments and age at menopause in subfertile women: Evidence from large population studies. J. Clin. Endocrinol. Metab. 2013, 98, 1946–1953. [Google Scholar] [CrossRef] [Green Version]
- Casarotto, A.A.F.; Galera, B.B.; Sumiyoshi, L.M.; Floôr, T.M. Polymorphism rs7895833 in the SIRT1 gene and its association with dyslipidaemia in the elderly. Rev. Espanola Geriatr. Gerontol. 2019, 54, 214–219. [Google Scholar] [CrossRef]
- Dadachanji, R.; Patil, A.; Joshi, B.; Mukherjee, S. Elucidating the impact of obesity on hormonal and metabolic perturbations in polycystic ovary syndrome phenotypes in Indian women. PLoS ONE 2021, 16, e0246862. [Google Scholar] [CrossRef] [PubMed]

| Parameters | Women | ||
|---|---|---|---|
| without PCOS | with PCOS | p Value | |
| Age (years) | 28.24 ± 6.24 | 25.91 ± 4.70 | 0.058 |
| LH (lU/L) | 5.08 (4.17–6.55) | 6.79 (5.23–9.36) | 0.006 |
| FSH (lU/L) | 7.09 (5.89–8.21) | 6.16 (5.27–7.39) | 0.056 |
| DHEA-S (µg/mL) | 276.00 (216.00–350.00) | 284.50 (217.00–384.00) | 0.566 |
| SHBG (nmol/L) | 53.2 (37.00–75.10) | 46.70 (30.70–73.10) | 0.399 |
| t-test (ng/mL) | 0.22 (0.13–0.30) | 0.28 (0.19–0.39) | 0.025 |
| fTest (pg/mL) | 1.64 (0.93–3.02) | 2.26 (1.28–3.39) | 0.116 |
| AD (ng/mL) | 1.89 (1.37–2.26) | 2.36 (1.81–3.13) | 0.005 |
| 17α-OHP (nmol/L) | 0.67 (0.39–0.92) | 0.65 (0.46–0.89) | 0.756 |
| Prolactine (ng/mL) | 9.81 (6.83–13.30) | 11.60 (8.80–15.70) | 0.086 |
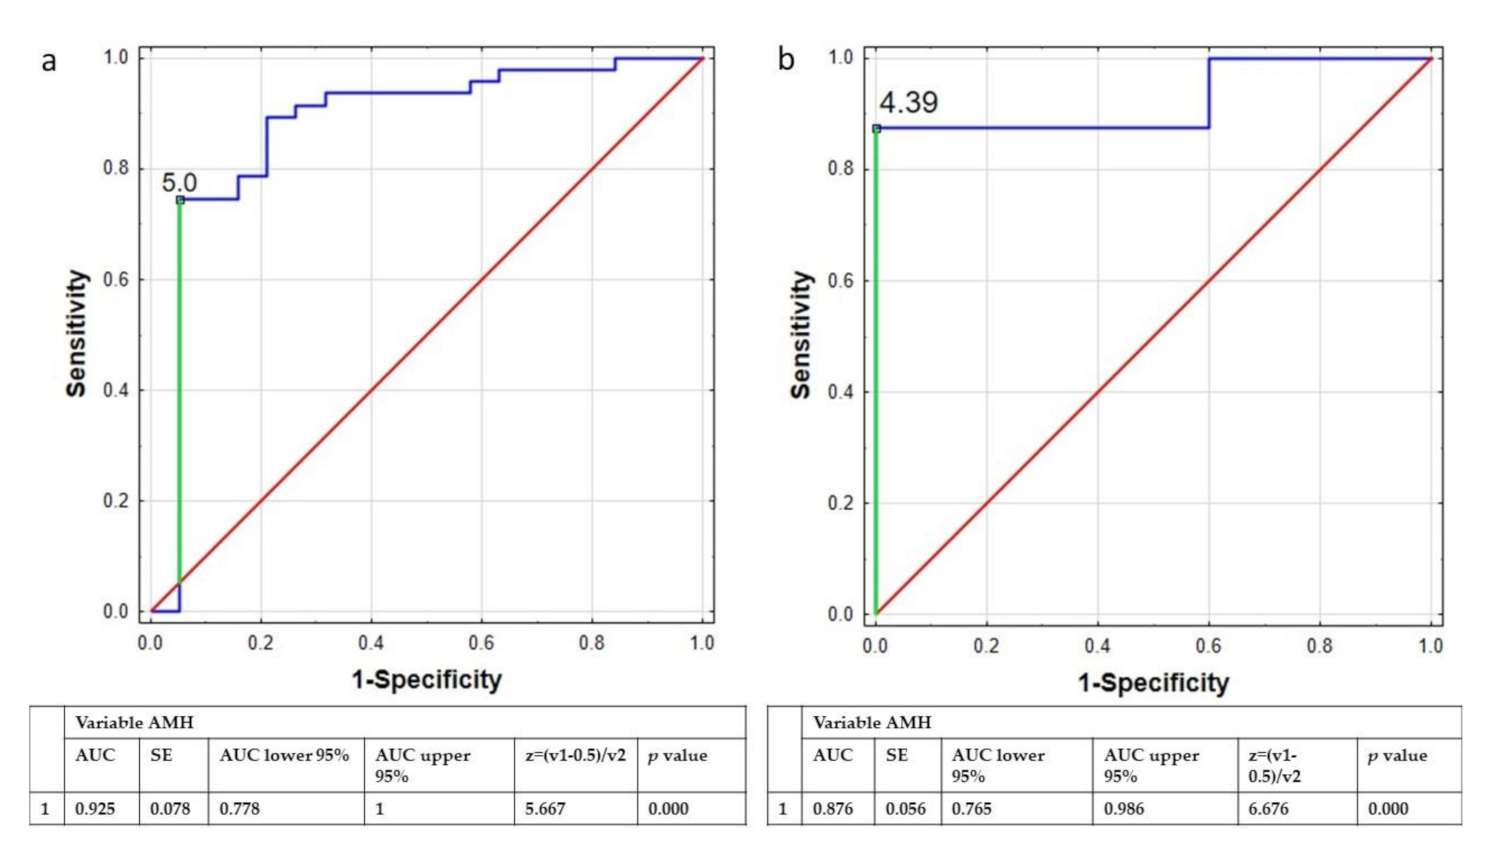
| AMH (ng/mL) | 2.95 (1.58–3.63) | 6.07 (4.84–8.25) | 0.000 |
| BMI (kg/m2) | 20.90 (19.80–23.80) | 24.00 (20.50–30.30) | 0.069 |
| WHR | 0.85 (0.83–0.90) | 0.87 (0.83–0.96) | 0.168 |
| SMM (kg) | 23.40 (21.20–25.10) | 24.70 (22.20–28.40) | 0.094 |
| FAT (kg) | 17.80 (13.50–22.50) | 21.60 (13.60–31.90) | 0.157 |
| TBW (%) | 31.10 (28.50–33.30) | 32.70 (29.70–37.60) | 0.081 |
| FFM (%) | 42.60 (39.00–45.30) | 44.70 (40.60–51.40) | 0.082 |
| PBF (%) | 31.00 (39.00–45.30) | 32.40 (24.20–39.00) | 0.271 |
| VFA (cm2) | 8.00 (5.00–10.00) | 9.00 (5.00–15.00) | 0.236 |
| BMR (kcal) | 1290.0 (1212.0–1349.0) | 1336.0 (1246.0–1479.0) | 0.080 |
| Parameters | Phenotype 1 | Phenotype 2 | Phenotype 3 | Phenotype 4 | p Value |
|---|---|---|---|---|---|
| n = 31 | n = 7 | n = 11 | n = 6 | ||
| Age (years) | 26.00 (22.00–29.00) | 25.000 (19.00–27.00) | 25.00 (24.00–28.00) | 27.50 (2500–33.00) | 0.546 |
| BMI (kg/m2) | 23.40 (20.50–27.00) | 30.90 (21.00–35.30) | 24.80 (23.20–33.00) | 20.45 (17.30–24.30) | 0.178 |
| WHR | 0.87 (0.83–0.93) | 0.98 (0.84–1.00) | 0.89 (0.87–0.97) | 0.81 (0.79–0.90) | 0.168 |
| SMM (kg) | 25.90 (23.00–29.00) | 24.80 (22.30–26.40) | 22.20 (21.80–27.90) | 23.05 (20.20–23.40) | 0.335 |
| FAT (kg) | 21.60 (12.90–29.40) | 36.70 (18.80–45.70) | 21.90 (20.80–41.50) | 14.00 (11.90–23.40) | 0.245 |
| TBW (%) | 34.10 (31.00–38.00) | 32.70 (29.80–34.60) | 29.70 (29.10–36.90) | 30.90 (27.70–31.10) | 0.311 |
| FFM (%) | 46.60 (42.30–52.00) | 44.70 (40.70–47.40) | 40.70 (39.80–50.50) | 42.10 (37.90–42.60) | 0.331 |
| PBF (%) | 31.70 (23.40–37.80) | 43.70 (30.10–52.20) | 36.30 (30.00–42.60) | 25.90 (22.10–36.70) | 0.180 |
| VFA (cm2) | 9.00 (5.00–14.00) | 19.00 (7.00–22.00) | 10.00 (8.00–20.00) | 5.00 (4.00–12.00) | 0.233 |
| BMR (kcal) | 1377 (1285–1492) | 1336 (1249–1393) | 1249 (1230–1460) | 1279.5 (1188–1290) | 0.318 |
| Parameters | SHBG | fTest |
|---|---|---|
| BMI (kg/m2) | −0.68; 0.000 | 0.47; 0.000 |
| WHR | −0.68; 0.000 | 0.45; 0.000 |
| SMM (kg) | −0.47; 0.000 | 0.37; 0.004 |
| FAT (kg) | −0.63; 0.000 | 0.42; 0.001 |
| TBW (%) | −0.47; 0.000 | 0.38; 0.004 |
| FFM (%) | −0.47; 0.000 | 0.38; 0.004 |
| PBF (%) | −0.57; 0.000 | 0.37; 0.000 |
| VFA (cm2) | −0.61; 0.000 | 0.41; 0.001 |
| BMR (kcal) | −0.47; 0.000 | 0.38; 0.005 |
| Model 1 | Model 2 | Model 3 | Model 4 | ||||
|---|---|---|---|---|---|---|---|
| Variables | OR (95% CI) p | Variables | OR (95% CI) p | Variables | OR (95% CI) p | Variables | OR (95% CI) p |
| AMH (ng/mL) | 2.085 (1.451–2.997) <0.001 | AMH (ng/mL) | 2.057 (1.445–2.929) <0.001 | AMH (ng/mL) | 2.064 (1.442–2.952) <0.001 | AMH (ng/mL) | 2.085 (1.451–2.997) <0.001 |
| BMI (kg/m2) | 1.198 (1.036–1.386) 0.015 | PBF (%) | 1.079 (1.002–1.162) 0.043 | VFA (cm2) | 1.141 (1.012–1.287) 0.031 | BMI (kg/m2) | 1.198 (1.036–1.386) 0.015 |
Publisher’s Note: MDPI stays neutral with regard to jurisdictional claims in published maps and institutional affiliations. |
© 2021 by the authors. Licensee MDPI, Basel, Switzerland. This article is an open access article distributed under the terms and conditions of the Creative Commons Attribution (CC BY) license (https://creativecommons.org/licenses/by/4.0/).
Share and Cite
Bizoń, A.; Płaczkowska, S.; Niepsuj, J.; Czwojdzińska, M.; Leśniewski, M.; Nowak, A.; Pluta, D.; Madej, P.; Piwowar, A.; Franik, G. Body Composition and Its Impact on the Hormonal Disturbances in Women with Polycystic Ovary Syndrome. Nutrients 2021, 13, 4217. https://doi.org/10.3390/nu13124217
Bizoń A, Płaczkowska S, Niepsuj J, Czwojdzińska M, Leśniewski M, Nowak A, Pluta D, Madej P, Piwowar A, Franik G. Body Composition and Its Impact on the Hormonal Disturbances in Women with Polycystic Ovary Syndrome. Nutrients. 2021; 13(12):4217. https://doi.org/10.3390/nu13124217
Chicago/Turabian StyleBizoń, Anna, Sylwia Płaczkowska, Justyna Niepsuj, Marta Czwojdzińska, Marcin Leśniewski, Artur Nowak, Dagmara Pluta, Paweł Madej, Agnieszka Piwowar, and Grzegorz Franik. 2021. "Body Composition and Its Impact on the Hormonal Disturbances in Women with Polycystic Ovary Syndrome" Nutrients 13, no. 12: 4217. https://doi.org/10.3390/nu13124217