
Dietary Intake of Adult Residents in Luxembourg Taking Part in Two Cross-Sectional Studies—ORISCAV-LUX (2007–2008) and ORISCAV-LUX 2 (2016–2017)

 , , and
Abstract
:1. Introduction
2. Participants and Methods
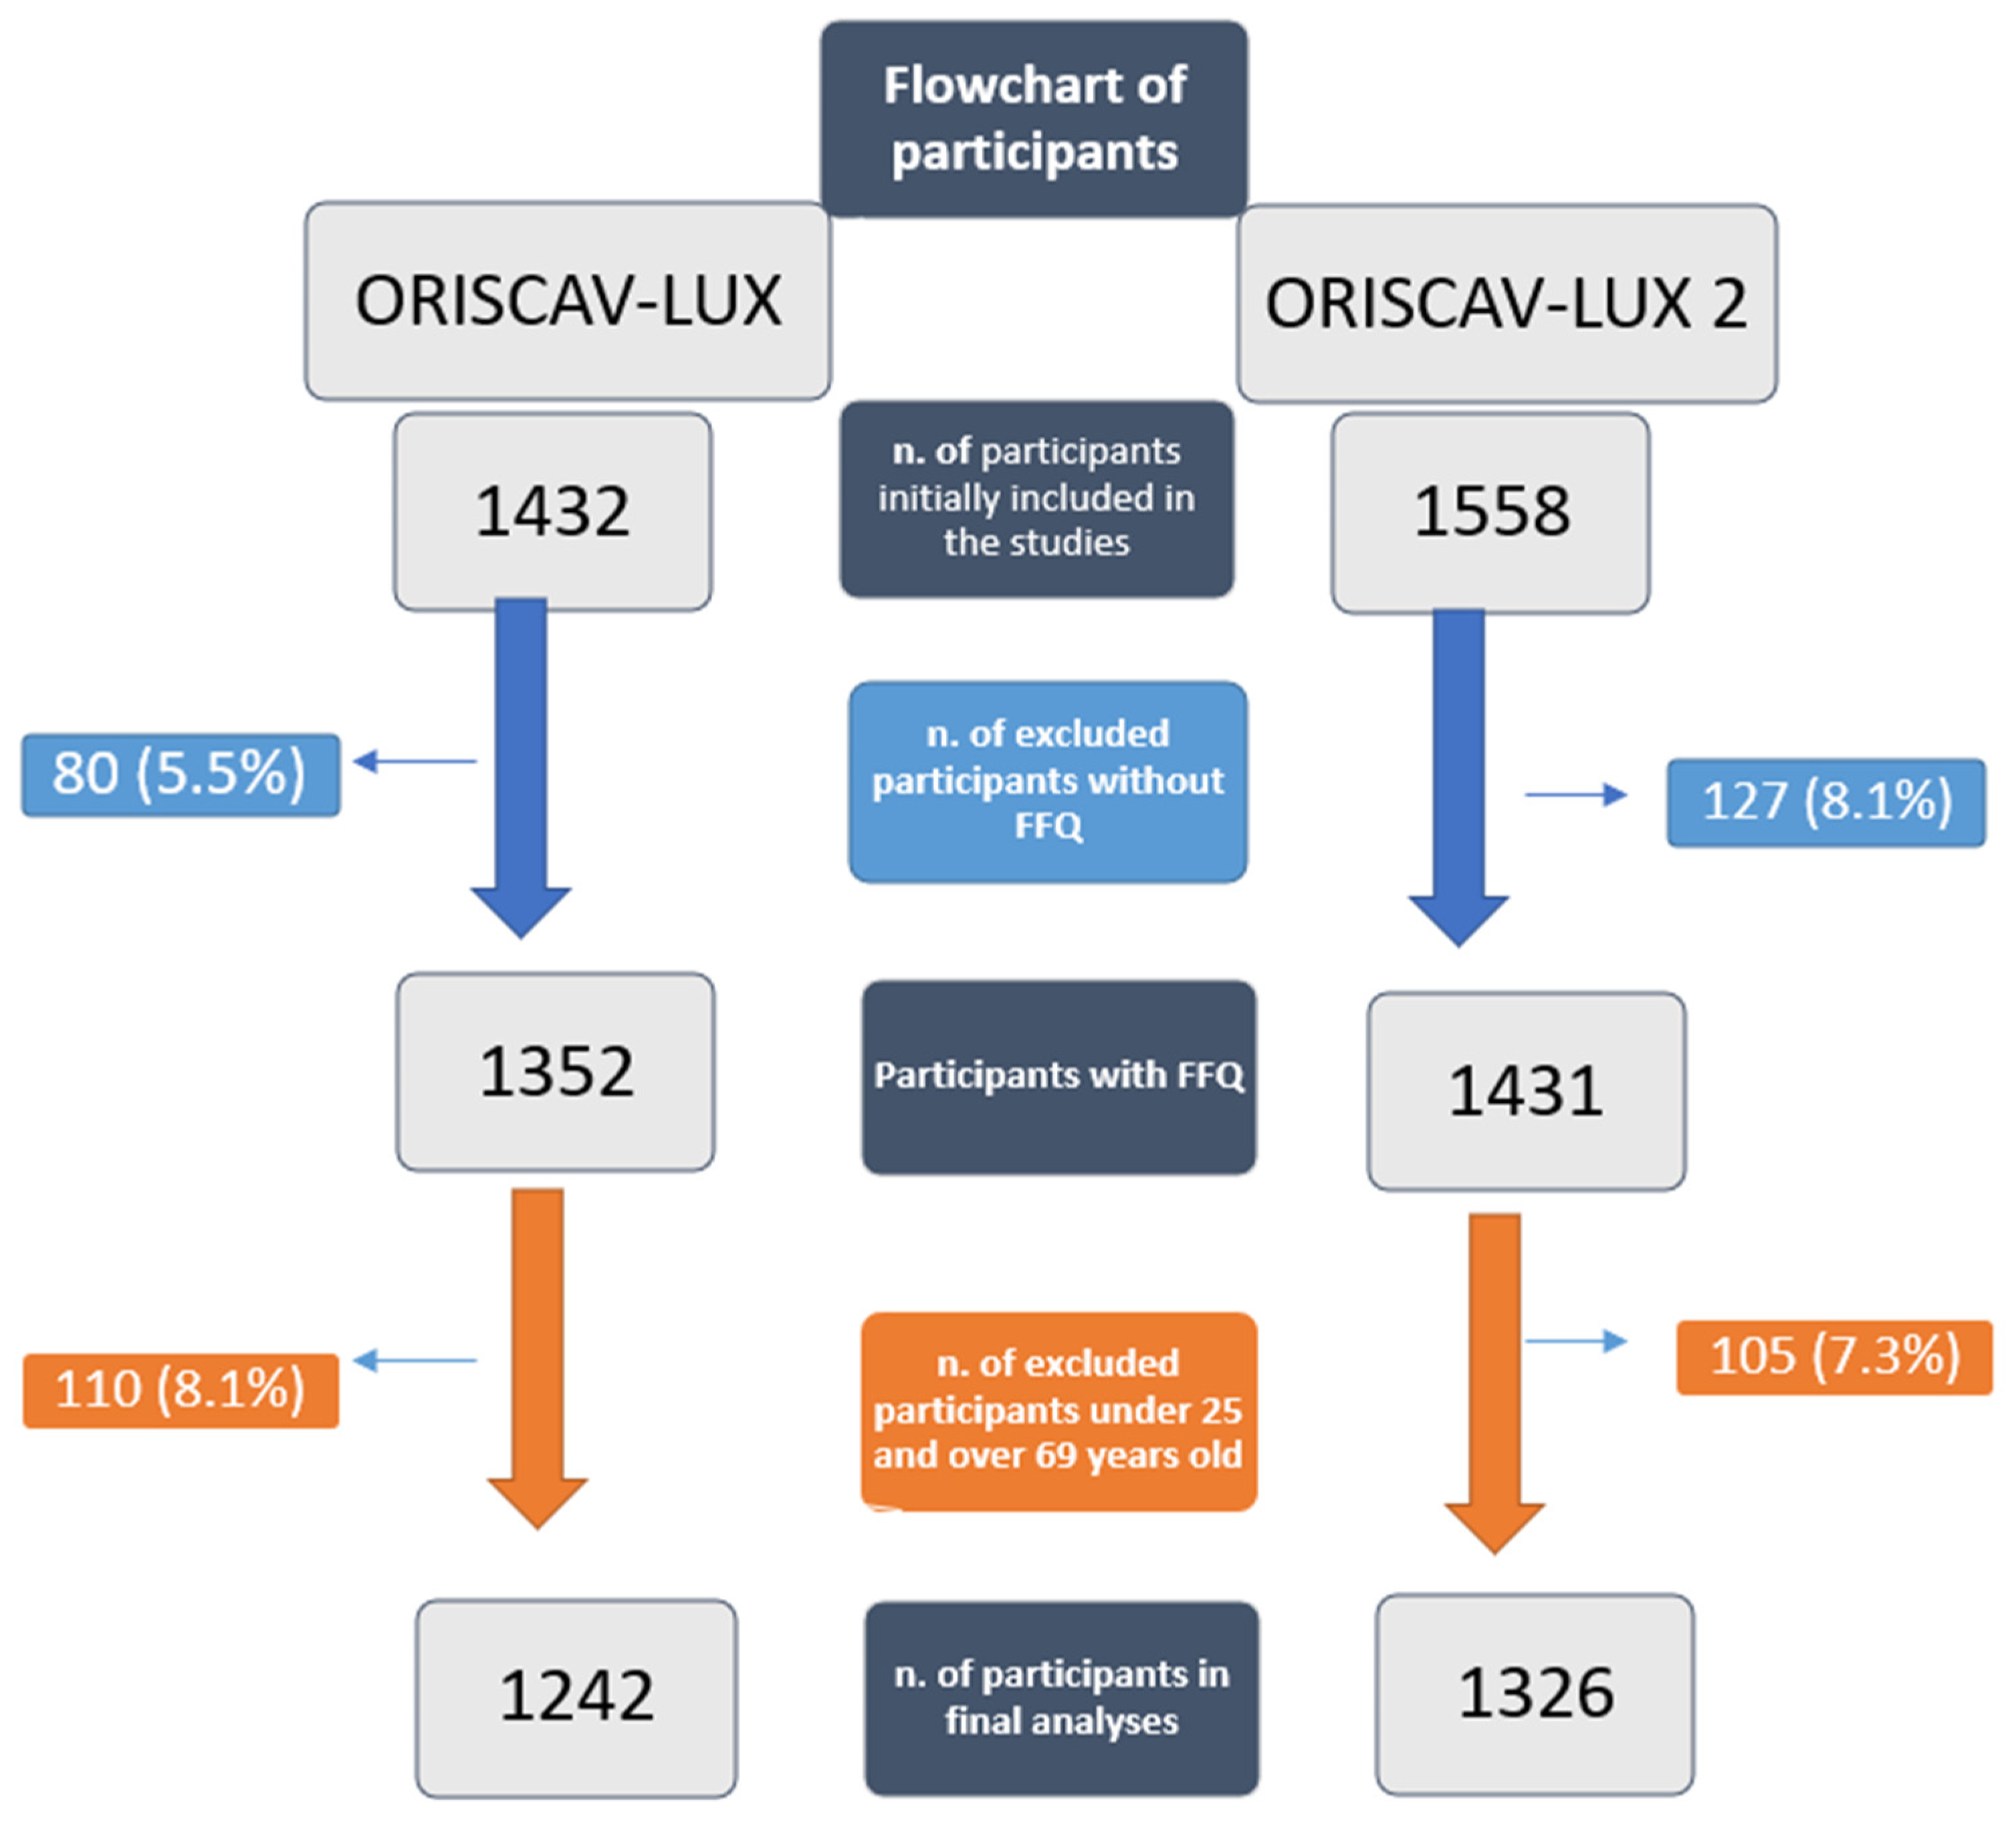
2.1. Study Population and Design
2.2. Assessment of Dietary Intake
2.3. Anthropometric Measures
2.4. Demographic and Socioeconomic Factors
2.5. Data Management
2.6. Statistical Analyses
3. Results
4. Discussion
5. Conclusions
Supplementary Materials
Author Contributions
Funding
Institutional Review Board Statement
Informed Consent Statement
Data Availability Statement
Acknowledgments
Conflicts of Interest
References
- Engeset, D.; Alsaker, E.; Ciampi, A.; Lund, E. Dietary patterns and lifestyle factors in the Norwegian EPIC cohort: The Norwegian Women and Cancer (NOWAC) study. Eur. J. Clin. Nutr. 2005, 59, 675–684. [Google Scholar] [CrossRef] [Green Version]
- Grosso, G.; Bella, F.; Godos, J.; Sciacca, S.; Del Rio, D.; Ray, S.; Galvano, F.; Giovannucci, E.L. Possible role of diet in cancer: Systematic review and multiple meta-analyses of dietary patterns, lifestyle factors, and cancer risk. Nutr. Rev. 2017, 75, 405–419. [Google Scholar] [CrossRef]
- Sadeghi, M.; Vahid, F.; Rahmani, D.; Akbari, M.E.; Davoodi, S.H. The Association between Dietary Patterns and Breast Cancer Pathobiological Factors Progesterone Receptor (PR) and Estrogen Receptors (ER): New Findings from Iranian Case-Control Study. Nutr. Cancer 2019, 71, 1290–1298. [Google Scholar] [CrossRef]
- Johansson, L.; Thelle, D.S.; Solvoll, K.; Bjørneboe, G.-E.A.; Drevon, C.A. Healthy dietary habits in relation to social determinants and lifestyle factors. Br. J. Nutr. 1999, 81, 211–220. [Google Scholar] [CrossRef] [PubMed] [Green Version]
- Pänkäläinen, M.; Fogelholm, M.; Valve, R.; Kampman, O.; Kauppi, M.; Lappalainen, E.; Hintikka, J. Pessimism, diet, and the ability to improve dietary habits: A three-year follow-up study among middle-aged and older Finnish men and women. Nutr. J. 2018, 17, 92. [Google Scholar] [CrossRef] [PubMed]
- Tapsell, L.C. Dietary behaviour changes to improve nutritional quality and health outcomes. Chronic. Dis. Transl. Med. 2017, 3, 154–158. [Google Scholar] [CrossRef] [PubMed]
- Johansson, S.E.; Sundquist, J. Change in lifestyle factors and their influence on health status and all-cause mortality. Int. J. Epidemiol. 1999, 28, 1073–1080. [Google Scholar] [CrossRef]
- Alkerwi, A.a.; Sauvageot, N.; Donneau, A.-F.; Lair, M.-L.; Couffignal, S.; Beissel, J.; Delagardelle, C.; Wagener, Y.; Albert, A.; Guillaume, M. First nationwide survey on cardiovascular risk factors in Grand-Duchy of Luxembourg (ORISCAV-LUX). BMC Public Health. 2010, 10, 468. [Google Scholar] [CrossRef] [Green Version]
- Suetens, C. Healthcare-associated infections in European long-term care facilities: How big is the challenge? Eurosurveillance 2012, 17, 20259. [Google Scholar] [CrossRef] [PubMed]
- Bocquet, V.; Ruiz-Castell, M.; de Beaufort, C.; Barre, J.; de Rekeneire, N.; Michel, G.; Donahue, R.P.; Kuemmerle, A.; Stranges, S. Public health burden of pre-diabetes and diabetes in Luxembourg: Finding from the 2013-2015 European Health Examination Survey. BMJ Open 2019, 9, e022206. [Google Scholar] [CrossRef] [Green Version]
- Perquin, M.; Diederich, N.; Pastore, J.; Lair, M.L.; Stranges, S.; Vaillant, M.; MemoVie, G. Prevalence of Dementia and Cognitive Complaints in the Context of High Cognitive Reserve: A Population-Based Study. PLoS ONE 2015, 10, e0138818. [Google Scholar]
- Hipp, G.; Vaillant, M.; Diederich, N.J.; Roomp, K.; Satagopam, V.P.; Banda, P.; Sandt, E.; Mommaerts, K.; Schmitz, S.K.; Longhino, L.; et al. The Luxembourg Parkinson’s Study: A Comprehensive Approach for Stratification and Early Diagnosis. Front. Aging Neurosci. 2018, 10, 326. [Google Scholar] [CrossRef] [PubMed] [Green Version]
- Alkerwi, A.; Bahi, I.E.; Stranges, S.; Beissel, J.; Delagardelle, C.; Noppe, S.; Kandala, N.-B. Geographic variations in cardiometabolic risk factors in Luxembourg. Int. J. Environ. Res. 2017, 14, 648. [Google Scholar] [CrossRef] [Green Version]
- Naska, A.; Fouskakis, D.; Oikonomou, E.; Almeida, M.D.V.; Berg, M.A.; Gedrich, K.; Moreiras, O.; Nelson, M.; Trygg, K.; Turrini, A.; et al. Dietary patterns and their socio-demographic determinants in 10 European countries: Data from the DAFNE databank. Eur. J. Clin. Nutr. 2006, 60, 181–190. [Google Scholar] [CrossRef] [PubMed] [Green Version]
- World Health Organization. Global Status Report on Alcohol and Health 2018; World Health Organization: Geneva, Switzerland, 2019. [Google Scholar]
- Alkerwi, A.; Crichton, G.E.; Hébert, J.R. Consumption of ready-made meals and increased risk of obesity: Findings from the Observation of Cardiovascular Risk Factors in Luxembourg (ORISCAV-LUX) study. Br. J. Nutr. 2015, 113, 270–277. [Google Scholar] [CrossRef] [Green Version]
- Esposito, K.; Maiorino, M.I.; Bellastella, G.; Panagiotakos, D.B.; Giugliano, D. Mediterranean diet for type 2 diabetes: Cardiometabolic benefits. Endocrine 2017, 56, 27–32. [Google Scholar] [CrossRef] [PubMed]
- Shen, J.; Wilmot, K.A.; Ghasemzadeh, N.; Molloy, D.L.; Burkman, G.; Mekonnen, G.; Gongora, M.C.; Quyyumi, A.A.; Sperling, L.S. Mediterranean Dietary Patterns and Cardiovascular Health. Annu. Rev. Nutr. 2015, 35, 425–449. [Google Scholar] [CrossRef] [PubMed]
- Schwingshackl, L.; Hoffmann, G. Adherence to Mediterranean diet and risk of cancer: An updated systematic review and meta-analysis of observational studies. Cancer Med. 2015, 4, 1933–1947. [Google Scholar] [CrossRef]
- Herforth, A.; Arimond, M.; Álvarez-Sánchez, C.; Coates, J.; Christianson, K.; Muehlhoff, E. A Global Review of Food-Based Dietary Guidelines. Adv. Nutr. 2019, 10, 590–605. [Google Scholar] [CrossRef] [Green Version]
- Elmadfa, I. European Nutrition and Health Report 2009; Karger Medical and Scientific Publishers: Basel, Switzerland, 2009; Volume 62. [Google Scholar]
- Alkerwi, A.a.; Sauvageot, N.; Nau, A.; Lair, M.-L.; Donneau, A.-F.; Albert, A.; Guillaume, M. Population compliance with national dietary recommendations and its determinants: Findings from the ORISCAV-LUX study. Br. J. Nutr. 2012, 108, 2083–2092. [Google Scholar] [CrossRef] [PubMed] [Green Version]
- FAOSTAT 2007. Livestock and Fish Primary Equivalent, Food and Agriculture Organization of the United Nations, Viewed 31 March 2007. Available online: http://faostat.fao.org/site/610/DesktopDefault.aspx?PageID=610#ancor (accessed on 21 January 2021).
- McEvoy, C.T.; Temple, N.; Woodside, J.V. Vegetarian diets, low-meat diets and health: A review. Public Health Nutr. 2012, 15, 2287–2294. [Google Scholar] [CrossRef] [Green Version]
- McNeill, S.H. Inclusion of red meat in healthful dietary patterns. Meat. Sci. 2014, 98, 452–460. [Google Scholar] [CrossRef] [PubMed]
- Kearney, J. Food consumption trends and drivers. Philos. Trans. R. Soc. B Biol. Sci. 2010, 365, 2793–2807. [Google Scholar] [CrossRef] [PubMed]
- Vilaro, M.J.; Colby, S.E.; Riggsbee, K.; Zhou, W.; Byrd-Bredbenner, C.; Olfert, M.D.; Barnett, T.E.; Horacek, T.; Sowers, M.; Mathews, A.E. Food Choice Priorities Change Over Time and Predict Dietary Intake at the End of the First Year of College Among Students in the U.S. Nutrients 2018, 10, 1296. [Google Scholar] [CrossRef] [PubMed] [Green Version]
- Caruana, E.J.; Roman, M.; Hernández-Sánchez, J.; Solli, P. Longitudinal studies. J. Thorac. Dis. 2015, 7, E537–E540. [Google Scholar] [PubMed]
- Karageorgou, D.; Magriplis, E.; Mitsopoulou, A.V.; Dimakopoulos, I.; Bakogianni, I.; Micha, R.; Michas, G.; Chourdakis, M.; Ntouroupi, T.; Tsaniklidou, S.M.; et al. Dietary patterns and lifestyle characteristics in adults: Results from the Hellenic National Nutrition and Health Survey (HNNHS). Public Health. 2019, 171, 76–88. [Google Scholar] [CrossRef]
- Alkerwi, A.a.; Pastore, J.; Sauvageot, N.; Coroller, G.L.; Bocquet, V.; d’Incau, M.; Aguayo, G.; Appenzeller, B.; Bejko, D.; Bohn, T.; et al. Challenges and benefits of integrating diverse sampling strategies in the observation of cardiovascular risk factors (ORISCAV-LUX 2) study. BMC Med. Res. Methodol. 2019, 19, 27. [Google Scholar] [CrossRef] [PubMed] [Green Version]
- Sauvageot, N.; Guillaume, M.; Albert, A. Validation of the food frequency questionnaire used to assess the association between dietary habits and cardiovascular risk factors in the NESCAV study. J. Food Sci. 2013, 3, 3. [Google Scholar] [CrossRef] [Green Version]
- Sauvageot, N.; Alkerwi, A.; Albert, A.; Guillaume, M. Use of food frequency questionnaire to assess relationships between dietary habits and cardiovascular risk factors in NESCAV study: Validation with biomarkers. Nutr. J. 2013, 12, 143. [Google Scholar] [CrossRef] [PubMed] [Green Version]
- French Agency for Food, Environmental and Occupational Health & Safety. ANSES-CIQUAL French Food Composition Table for Nutritional Intakes Calculation CALNUT. Available online: https://ciqual.anses.fr/ (accessed on 21 January 2021).
- Barnard, N.; Levin, S.; Trapp, C. Meat consumption as a risk factor for type 2 diabetes. Nutrients 2014, 6, 897–910. [Google Scholar] [CrossRef] [Green Version]
- Micha, R.; Wallace, S.K.; Mozaffarian, D. Red and processed meat consumption and risk of incident coronary heart disease, stroke, and diabetes mellitus: A systematic review and meta-analysis. Circulation 2010, 121, 2271–2283. [Google Scholar] [CrossRef] [Green Version]
- Ericson, U.; Sonestedt, E.; Gullberg, B.; Hellstrand, S.; Hindy, G.; Wirfält, E.; Orho-Melander, M. High intakes of protein and processed meat associate with increased incidence of type 2 diabetes. Br. J. Nutr. 2013, 109, 1143–1153. [Google Scholar] [CrossRef] [Green Version]
- Ibsen, D.B.; Steur, M.; Imamura, F.; Overvad, K.; Schulze, M.B.; Bendinelli, B.; Guevara, M.; Agudo, A.; Amiano, P.; Aune, D. Replacement of red and processed meat with other food sources of protein and the risk of type 2 diabetes in European populations: The EPIC-InterAct Study. Diab. Care 2020, 43, 2660–2667. [Google Scholar] [CrossRef]
- Arsenault, B.J.; Lamarche, B.; Després, J.-P. Targeting Overconsumption of Sugar-Sweetened Beverages vs. Overall Poor Diet Quality for Cardiometabolic Diseases Risk Prevention: Place Your Bets! Nutrients 2017, 9, 600. [Google Scholar] [CrossRef] [PubMed]
- Brambila-Macias, J.; Shankar, B.; Capacci, S.; Mazzocchi, M.; Perez-Cueto, F.J.; Verbeke, W.; Traill, W.B. Policy interventions to promote healthy eating: A review of what works, what does not, and what is promising. Food Nutr. Bull. 2011, 32, 365–375. [Google Scholar] [CrossRef] [PubMed]
- Trichopoulou, A.; Martínez-González, M.A.; Tong, T.Y.; Forouhi, N.G.; Khandelwal, S.; Prabhakaran, D.; Mozaffarian, D.; de Lorgeril, M. Definitions and potential health benefits of the Mediterranean diet: Views from experts around the world. BMC Med. 2014, 12, 112. [Google Scholar] [CrossRef] [Green Version]
- Ford, E.S.; Mokdad, A.H. Dietary Magnesium Intake in a National Sample of U.S. Adults. J. Nutr. 2003, 133, 2879–2882. [Google Scholar] [CrossRef] [PubMed] [Green Version]
- Fang, X.; Wang, K.; Han, D.; He, X.; Wei, J.; Zhao, L.; Imam, M.U.; Ping, Z.; Li, Y.; Xu, Y.; et al. Dietary magnesium intake and the risk of cardiovascular disease, type 2 diabetes, and all-cause mortality: A dose-response meta-analysis of prospective cohort studies. BMC Med. 2016, 14, 210. [Google Scholar] [CrossRef] [PubMed] [Green Version]
- Tai, V.; Leung, W.; Grey, A.; Reid, I.R.; Bolland, M.J. Calcium intake and bone mineral density: Systematic review and meta-analysis. BMJ 2015, 351, h4183. [Google Scholar] [CrossRef] [PubMed] [Green Version]
- Kong, S.H.; Kim, J.H.; Hong, A.R.; Cho, N.H.; Shin, C.S. Dietary calcium intake and risk of cardiovascular disease, stroke, and fracture in a population with low calcium intake. Am. J. Clin. Nutr. 2017, 106, 27–34. [Google Scholar] [CrossRef] [PubMed] [Green Version]
- Bradbury, K.E.; Appleby, P.N.; Key, T.J. Fruit, vegetable, and fiber intake in relation to cancer risk: Findings from the European Prospective Investigation into Cancer and Nutrition (EPIC). Am. J. Clin. Nutr. 2014, 100 (Suppl. 1), 394s–398s. [Google Scholar] [CrossRef] [Green Version]
- Dingeo, G.; Brito, A.; Samouda, H.; Iddir, M.; La Frano, M.R.; Bohn, T. Phytochemicals as modifiers of gut microbial communities. Food Funct. 2020, 11, 8444–8471. [Google Scholar] [CrossRef] [PubMed]
- Post, R.E.; Mainous, A.G., 3rd; King, D.E.; Simpson, K.N. Dietary fiber for the treatment of type 2 diabetes mellitus: A meta-analysis. J. Am. Board. Fam. Med. 2012, 25, 16–23. [Google Scholar] [CrossRef] [PubMed] [Green Version]
- Vahid, F.; Goodarzi, R.; Shivappa, N.; Hébert, J.R.; Fazeli Moghadam, E. Dietary Inflammatory Index (DII®): A significant association between coronary heart disease and DII® in Armenian adults. Eur. J. Prev. Cardiol. 2020, 27, 2235–2237. [Google Scholar] [CrossRef]
- Marques-Vidal, P.; Gaspoz, J.-M.; Theler, J.-M.; Guessous, I. Twenty-year trends in dietary patterns in French-speaking Switzerland: Toward healthier eating. Am. J. Clin. Nutr. 2017, 106, 217–224. [Google Scholar] [CrossRef] [Green Version]
- CALERIE StudyGroup. Energy requirements in nonobese men and women: Results from CALERIE. Am. J. Clin. Nutr. 2013, 99, 71–78. [Google Scholar]
- Harrington, J.M.; Dahly, D.L.; Fitzgerald, A.P.; Gilthorpe, M.S.; Perry, I.J. Capturing changes in dietary patterns among older adults: A latent class analysis of an ageing Irish cohort. Public Health Nutr. 2014, 17, 2674–2686. [Google Scholar] [CrossRef] [PubMed] [Green Version]
- Bédard, A.; Riverin, M.; Dodin, S.; Corneau, L.; Lemieux, S. Sex differences in the impact of the Mediterranean diet on cardiovascular risk profile. Br. J. Nutr. 2012, 108, 1428–1434. [Google Scholar] [CrossRef] [PubMed]
- Macdiarmid, J.I.; Vail, A.; Cade, J.E.; Blundell, J.E. The sugar–fat relationship revisited: Differences in consumption between men and women of varying BMI. Int. J. Obes. 1998, 22, 1053–1061. [Google Scholar] [CrossRef] [Green Version]
- Sánchez-Villegas, A.; Delgado-Rodríguez, M.; Martínez-González, M.Á.; de Irala-Estévez, J.; for the Seguimiento Universidad de Navarra group. Gender, age, socio-demographic and lifestyle factors associated with major dietary patterns in the Spanish Project SUN (Seguimiento Universidad de Navarra). Eur. J. Clin. Nutr. 2003, 57, 285–292. [Google Scholar] [CrossRef] [Green Version]
- Bamia, C.; Orfanos, P.; Ferrari, P.; Overvad, K.; Hundborg, H.H.; Tjønneland, A.; Olsen, A.; Kesse, E.; Boutron-Ruault, M.-C.; Clavel-Chapelon, F.; et al. Dietary patterns among older Europeans: The EPIC-Elderly study. Br. J. Nutr. 2005, 94, 100–113. [Google Scholar] [CrossRef]
- Harding, A.-H.; Day, N.E.; Khaw, K.-T.; Bingham, S.; Luben, R.; Welsh, A.; Wareham, N.J. Dietary Fat and the Risk of Clinical Type 2 Diabetes: The European Prospective Investigation of Cancer-Norfolk Study. Am. J. Epidemiol. 2004, 159, 73–82. [Google Scholar] [CrossRef] [Green Version]
- Genkinger, J.M.; Hunter, D.J.; Spiegelman, D.; Anderson, K.E.; Beeson, W.L.; Buring, J.E.; Colditz, G.A.; Fraser, G.E.; Freudenheim, J.L.; Goldbohm, R.A.; et al. A pooled analysis of 12 cohort studies of dietary fat, cholesterol and egg intake and ovarian cancer. Cancer. Causes. Control. 2006, 17, 273–285. [Google Scholar] [CrossRef] [PubMed]
- Morrison, D.J.; Preston, T. Formation of short chain fatty acids by the gut microbiota and their impact on human metabolism. Gut Microbes 2016, 7, 189–200. [Google Scholar] [CrossRef] [Green Version]
- Schulze, M.B.; Hu, F.B. Dietary patterns and risk of hypertension, type 2 diabetes mellitus, and coronary heart disease. Curr. Atheroscler. Rep. 2002, 4, 462–467. [Google Scholar] [CrossRef]
- Mendez, M.A.; Popkin, B.M.; Jakszyn, P.; Berenguer, A.; Tormo, M.J.; Sanchéz, M.J.; Quirós, J.R.; Pera, G.; Navarro, C.; Martinez, C.; et al. Adherence to a Mediterranean Diet Is Associated with Reduced 3-Year Incidence of Obesity. J. Nutr. 2006, 136, 2934–2938. [Google Scholar] [CrossRef] [PubMed] [Green Version]
- Europepan Commission. Report from the Commission to the European Parliament and the Council Regarding the Use of Additional Forms of Expression and Presentation of the Nutrition Declaration. 2020. Available online: https://eur-lex.europa.eu/legal-content/GA/TXT/?uri=CELEX:52020DC0207 (accessed on 25 February 2021).
- Buckland, G.; Travier, N.; Cottet, V.; González, C.A.; Luján-Barroso, L.; Agudo, A.; Trichopoulou, A.; Lagiou, P.; Trichopoulos, D.; Peeters, P.H.; et al. Adherence to the mediterranean diet and risk of breast cancer in the European prospective investigation into cancer and nutrition cohort study. Int. J. Cancer Res. 2013, 132, 2918–2927. [Google Scholar] [CrossRef]
- Mishra, G.; McNaughton, S.; Bramwell, G.a.; Wadsworth, M. Longitudinal changes in dietary patterns during adult life. Br. J. Nutr. 2006, 96, 735–744. [Google Scholar]
- Waid, J.L.; Sinharoy, S.S.; Ali, M.; Stormer, A.E.; Thilsted, S.H.; Gabrysch, S. Dietary patterns and determinants of changing diets in Bangladesh from 1985 to 2010. Curr. Dev. Nutr. 2019, 3, nzy091. [Google Scholar] [CrossRef]
- Mazzocchi, M.; Brasili, C.; Sandri, E. Trends in dietary patterns and compliance with World Health Organization recommendations: A cross-country analysis. Public Health Nutr. 2008, 11, 535–540. [Google Scholar] [CrossRef] [Green Version]
- Uusitalo, U.; Sobal, J.; Moothoosamy, L.; Chitson, P.; Shaw, J.; Zimmet, P.; Tuomilehto, J. Dietary Westernisation: Conceptualisation and measurement in Mauritius. Public Health Nutr. 2005, 8, 608–619. [Google Scholar] [CrossRef] [PubMed] [Green Version]
- Wakimoto, P.; Block, G. Dietary intake, dietary patterns, and changes with age: An epidemiological perspective. J. Gerontol. Ser. A Biol. Sci. Med. Sci. 2001, 56, 65–80. [Google Scholar] [CrossRef] [PubMed] [Green Version]
- Lake, A.A.; Adamson, A.J.; Hyland, R.M.; Mathers, J.C. Dietary change and perceptions of change over time. Nutr. Bull. 2004, 29, 199–203. [Google Scholar] [CrossRef]
- Jiang, L.; Audouze, K.; Romero Herrera, J.A.; Ängquist, L.H.; Kjærulff, S.K.; Izarzugaza, J.M.G.; Tjønneland, A.; Halkjær, J.; Overvad, K.; Sørensen, T.I.A.; et al. Conflicting associations between dietary patterns and changes of anthropometric traits across subgroups of middle-aged women and men. Clin. Nutr. 2020, 39, 265–275. [Google Scholar] [CrossRef] [PubMed] [Green Version]
- Vega Mejía, N.; Ponce Reyes, R.; Martinez, Y.; Carrasco, O.; Cerritos, R. Implications of the Western Diet for Agricultural Production, Health and Climate Change. Front. Sustain. Food Syst. 2018, 2, 88. [Google Scholar] [CrossRef] [Green Version]
- European Commission, Eurydice Network. Population: Demographic Situation, Languages and Religions of Luxembourg. 2020. Available online: https://eacea.ec.europa.eu/national-policies/eurydice/content/population-demographic-situation-languages-and-religions-46_en (accessed on 2 March 2021).
- Bocquet, V.; Barré, J.; Couffignal, S.; d’Incau, M.; Delagardelle, C.; Michel, G.; Schlesser, M.; Stranges, S.; Kuemmerle, A.; Ruiz-Castell, M. Study design and characteristics of the Luxembourg European Health Examination Survey (EHES-LUX). BMC Public Health. 2018, 18, 1169. [Google Scholar] [CrossRef] [PubMed]
- Shim, J.-S.; Oh, K.; Kim, H.C. Dietary assessment methods in epidemiologic studies. Epidemiol. Health. 2014, 36, e2014009. [Google Scholar] [CrossRef] [PubMed]
- Hercberg, S.; Touvier, M.; Salas-Salvado, J.; on behalf of the Group of European scientists supporting the implementation of Nutri-Score in Europe. The Nutri-Score nutrition label. Int. J. Vitam. Nutr. Res. 2021. [Google Scholar] [CrossRef] [PubMed]


| Variables | Mean ± SD (Minimum–Maximum) or Number (%) | |
|---|---|---|
| ORISCAV-LUX (N = 1242) | ORISCAV-LUX 2 (N = 1326) | |
| Age (year) | 46.3 ± 11.6 (25.2–69.9) | 49.5 ± 10.0 (25.2–69.9) |
| BMI (kg/m2) | 26.9 ± 5.0 (16.1–51.2) | 26.1 ± 4.7 (12.9–50.4) |
| Gender | ||
| 634 (51.1%) | 709 (53.4%) |
| 608 (48.9%) | 617 (46.6%) |
| Marital status | ||
| 155 (12.5%) | 150 (11.3%) |
| 944 (76.0%) | 984 (74.2%) |
| 32 (2.6%) | 162 (12.2%) |
| 111 (8.9%) | 150 (11.3%) |
| Education | ||
| 292 (23.5%) | 169 (12.7%) |
| 478 (38.5%) | 463 (34.9%) |
| 364 (29.3%) | 587 (44.3%) |
| 108 (8.7%) | 107 (8.1%) |
| Occupation (Job) | ||
| 835 (67.2%) | 917 (69.1%) |
| 216 (17.4%) | 141 (10.6%) |
| 170 (13.8%) | 251 (19.0%) |
| 20 (1.6%) | 17 (1.3%) |
| Income (EUR) | ||
| 13 (1.0%) | 4 (0.3%) |
| 49 (3.9%) | 22 (1.7%) |
| 143 (11.5%) | 45 (3.4%) |
| 195 (15.7%) | 74 (5.6%) |
| 381 (30.7%) | 306 (23.1%) |
| 277 (22.3%) | 466 (35.1%) |
| 57 (4.6%) | 111 (8.4%) |
| 127 (10.2%) | 298 (22.5%) |
| Country of birth | ||
| 738 (59.4%) | 778 (58.7%) |
| 149 (12.0%) | 110 (8.3%) |
| 246 (19.8%) | 315 (23.3%) |
| 109 (8.8%) | 123 (9.3%) |
| Parameter | Raw Values | Modeled Values | p-Value ** | ||
|---|---|---|---|---|---|
| Median (IQR) | Estimated Marginal Means (95% CI) * | ||||
| ORISCAV-LUX | ORISCAV-LUX 2 | ORISCAV-LUX | ORISCAV-LUX 2 | ||
| Total energy intake (kcal/day) | 2213 (1142) | 2374 (1136) | 3.349 (3.340, 3.358) | 3.379 (3.371, 3.387) | <0.001 |
| Total water (g/day) | 2920 (1353) | 3083 (1250) | 3.469 (3.461, 3.478) | 3.482 (3.475, 3.490) | 0.018 |
| Total protein (g/day) | 88.3 (46.4) | 89.6 (45.3) | 1.939 (1.929, 1.948) | 1.954 (1.946, 1.963) | 0.017 |
| VSP (g/day) | 26.6 (14.8) | 26.7 (14.2) | 1.427 (1.417, 1.437) | 1.432 (1.422, 1.441) | 0.474 |
| Animal source protein (g/day) | 56.8 (36.2) | 60.6 (37.4) | 1.746 (1.734, 1.757) | 1.772 (1.760, 1.783) | <0.001 |
| Total fat (g/day) | 93.4 (57.1) | 116.7 (64.7) | 1.975 (1.964, 1.986) | 2.066 (2.056, 2.075) | <0.001 |
| SFA (g/day) | 32.2 (21.4) | 39.8 (23.1) | 1.511 (1.499, 1.522) | 1.594 (1.583, 1.604) | <0.001 |
| MUFA (g/day) | 39.2 (24.5) | 46.8 (26.2) | 1.598 (1.587, 1.610) | 1.674 (1.664, 1.684) | <0.001 |
| PUFA (g/day) | 14.8 (10.0) | 20.7 (13.4) | 1.180 (1.168, 1.193) | 1.323 (1.311, 1.335) | <0.001 |
| Linoleic acid (g/day) | 12.2 (8.5) | 17.3 (11.7) | 1.092 (1.079, 1.105) | 1.240 (1.228, 1.252) | <0.001 |
| Alpha-linoleic acid (g/day) | 1.04 (0.74) | 1.79 (1.40) | 0.045 (0.031, 0.058) | 0.265 (0.251, 0.279) | <0.001 |
| Arachidonic acid (g/day) | 0.15 (0.11) | 0.19 (0.13) | −0.821 (−0.834, −0.808) | −0.720 (−0.733, −0.707) | <0.001 |
| EPA (g/day) | 0.12 (0.13) | 0.20 (0.23) | −0.934 (−0.955, −0.912) | −0.769 (−0.794, −0.743) | <0.001 |
| DPA (g/day) | 0.06 (0.05) | 0.08 (0.07) | −1.230 (−1.245, −1.214) | −1.133 (−1.151, −1.115) | <0.001 |
| DHA (g/day) | 0.18 (0.19) | 0.28 (0.31) | −0.746 (−0.767, −0.726) | −0.591 (−0.614, −0.569) | <0.001 |
| Cholesterol (mg/day) | 310.5 (196.1) | 356.5 (204.5) | 2.485 (2.474, 2.497) | 2.554 (2.543, 2.565) | <0.001 |
| Total carbohydrates (g/day) | 229.4 (125.8) | 217.6 (110.1) | 2.361 (2.351, 2.371) | 2.341 (2.332, 2.350) | 0.002 |
| Simple sugars (g/day) | 108.3 (71.5) | 100.1 (59.6) | 2.038 (2.025, 2.051) | 1.995 (1.983, 2.006) | <0.001 |
| Added sugars (g/day) | 31.7 (32.9) | 28.1 (27.6) | 1.504 (1.485, 1.523) | 1.433 (1.414, 1.451) | <0.001 |
| Starch (g/day) | 108.5 (68.0) | 102.9 (61.7) | 2.029 (2.018, 2.040) | 2.019 (2.008, 2.030) | 0.220 |
| Total fiber (g/day) | 22.9 (12.8) | 23.1 (12.0) | 1.367 (1.356, 1.377) | 1.357 (1.347, 1.367) | 0.178 |
| Soluble fiber (g/day) | 4.6 (2.6) | 4.7 (2.4) | 0.667 (0.666, 0.687) | 0.662 (0.652, 0.673) | 0.049 |
| Alcohol (g/day) | 4.1 (11.5) | 5.6 (11.2) | 0.641 (0.601, 0.682) | 0.762 (0.729, 0.794) | <0.001 |
| Parameter | Raw Values | Modeled Values | p-Value ** | ||
|---|---|---|---|---|---|
| Median (IQR) | Estimated Marginal Means (95% CI) * | ||||
| ORISCAV-LUX | ORISCAV-LUX 2 | ORISCAV-LUX | ORISCAV-LUX 2 | ||
| Vitamin A (µg/day) | 364.8 (399.7) | 475.5 (340.3) | 2.595 (2.578, 2.612) | 2.670 (2.657, 2.684) | <0.001 |
| Beta-carotene (µg/day) | 4121 (3690) | 4973 (4094) | 3.637 (3.620, 3.654) | 3.689 (3.673, 3.705) | <0.001 |
| Vitamin D (µg/day) | 2.6 (3.2) | 5.1 (4.6) | 0.410 (0.389, 0.430) | 0.693 (0.677, 0.710) | <0.001 |
| Vitamin E (mg/day) | 13.8 (8.8) | 18.4 (11.6) | 1.151 (1.139, 1.163) | 1.269 (1.258, 1.280) | <0.001 |
| Vitamin C (mg/day) | 135.1 (109.1) | 145.1 (101.7) | 2.129 (2.114, 2.144) | 2.150 (2.136, 2.163) | 0.049 |
| Thiamine (mg/day) | 1.55 (0.85) | 1.53 (0.81) | 0.184 (0.174, 0.194) | 0.192 (0.183, 0.201) | 0.221 |
| Riboflavin (mg/day) | 1.86 (1.04) | 1.83 (0.96) | 0.271 (0.261, 0.281) | 0.269 (0.260, 0.278) | 0.794 |
| Niacin (mg/day) | 21.2 (11.4) | 23.0 (12.0) | 1.325 (1.315, 1.334) | 1.361 (1.352, 1.370) | <0.001 |
| Pantothenic acid (mg/day) | 5.29 (2.71) | 5.85 (2.91) | 0.720 (0.711, 0.730) | 0.771 (0.762, 0.780) | <0.001 |
| Pyridoxine (mg/day) | 2.18 (1.18) | 2.39 (1.22) | 0.340 (0.330, 0.349) | 0.381 (0.372, 0.390) | <0.001 |
| Folate (µg/day) | 351.0 (196.8) | 349.6 (172.3) | 2.546 (2.536, 2.557) | 2.538 (2.529, 2.547) | 0.220 |
| Vitamin B12 (µg/day) | 5.34 (4.35) | 6.30 (4.54) | 0.723 (0.709, 0.737) | 0.798 (0.785, 0.812) | <0.001 |
| Calcium (mg/day) | 1047 (518.3) | 933.6 (454.3) | 3.022 (3.013, 3.032) | 2.969 (2.961, 2.978) | <0.001 |
| Iron (mg/day) | 13.9 (7.1) | 14.3 (6.7) | 1.143 (1.133, 1.152) | 1.154 (1.145, 1.162) | 0.082 |
| Iodide (µg/day) | 143.8 (82.6) | 154.9 (78.8) | 2.157 (2.147, 2.167) | 2.193 (2.183, 2.202) | <0.001 |
| Magnesium (mg/day) | 411.0 (177.2) | 373.5 (161.0) | 2.620 (2.612, 2.628) | 2.574 (2.566, 2.581) | <0.001 |
| Potassium (mg/day) | 3575 (1638) | 3526 (1547) | 3.550 (3.541, 3.559) | 3.543 (3.535, 3.551) | 0.220 |
| Phosphorus (mg/day) | 1354 (686.6) | 1330 (612.4) | 3.134 (3.124, 3.143) | 3.126 (3.118, 3.134) | 0.220 |
| Sodium (mg/day) | 2332 (1878) | 3333 (1957) | 3.497 (3.487, 3.508) | 3.531 (3.521, 3.541) | <0.001 |
| Parameter | Raw Values | Modeled Values | p-Value ** | ||
|---|---|---|---|---|---|
| Median (IQR) | Estimated Marginal Means (95% CI) * | ||||
| ORISCAV-LUX | ORISCAV-LUX 2 | ORISCAV-LUX | ORISCAV-LUX 2 | ||
| Grains (g/day) | 196.7 (140.0) | 119.1 (101.1) | 2.275 (2.260, 2.289) | 2.075 (2.085, 2.092) | <0.001 |
| Fruits (g/day) | 289.8 (315.5) | 286.6 (268.2) | 2.419 (2.395, 2.442) | 2.414 (2.395, 2.434) | 0.779 |
| Vegetables (g/day) | 261.6 (232.6) | 216.4 (171.8) | 2.427 (2.410, 2.444) | 2.302 (2.286, 2.318) | <0.001 |
| Starchy vegetables (g/day) | 57.1 (82.8) | 56.7 (60.7) | 1.765 (1.743, 1.786) | 1.725 (1.704, 1.745) | 0.008 |
| Protein-rich foods (g/day) | 161.0 (118.1) | 213.7 (147.9) | 2.181 (2.166, 2.196) | 2.322 (2.309, 2.335) | <0.001 |
| Ready-to-eat and fast foods (g/day) | 83.3 (87.9) | 95.7 (103.8) | 1.879 (1.858, 1.899) | 1.948 (1.927, 1.969) | <0.001 |
| Dairy products (g/day) | 233.8 (254.0) | 178.4 (199.7) | 2.322 (2.299, 2.346) | 2.163 (2.139, 2.188) | <0.001 |
| Lipids (fats and oils) (g/day) | 40.8 (37.4) | 61.4 (51.5) | 1.606 (1.588, 1.623) | 1.768 (1.752, 1.784) | <0.001 |
| Sugary products (g/day) | 38.0 (46.7) | 33.6 (41.4) | 1.545 (1.519, 1.572) | 1.495 (1.472, 1.518) | 0.006 |
| - NCB (g/day) | 1515 (989.3) | 1698 (1011) | 3.131 (3.114, 3.148) | 3.198 (3.186, 3.210) | <0.001 |
| - SSB (g/day) | 53.5 (237.2) | 70.7 (233.3) | 2.045 (2.005, 2.086) | 2.074 (2.039, 2.109) | 0.333 |
| - Alcoholic beverages (g/day) | 58.6 (172.3) | 76.2 (157.4) | 1.908 (1.874, 1.941) | 1.955 (1.927, 1.983) | 0.019 |
| ORISCAV-LUX | p-Value a | ORISCAV-LUX 2 | p-Value a | Men W 1 vs. W 2 | Women W 1 vs. W 2 | |||||||
|---|---|---|---|---|---|---|---|---|---|---|---|---|
| Men (n = 608) | Women (n = 634) | Men (n = 617) | Women (n = 709) | |||||||||
| Median (IQR) | EMM (95% CI) | Median (IQR) | EMM (95% CI) | Median (IQR) | EMM (95% CI) | Median (IQR) | EMM (95% CI) | p-Value c | p-Value d | |||
| Total energy intake (kcal/day) | 2435 (1242) | 3.395 (3.375, 3.415) | 2015 (1005) | 3.313 (3.293, 3.333) | <0.001 | 2684 (1187) | 3.432 (3.413, 3.452) | 2133 (922) | 3.336 (3.317, 3.354) | <0.001 | <0.001 | <0.001 |
| Total water (g/day) | 2944 (1370) | 3.468 (3.451, 3.485) | 2901 (1325) | 3.451 (3.434, 3.469) | 0.421 | 3162 (1389) | 3.483 (3.465, 3.501) | 3006 (1118) | 3.466 (3.449, 3.483) | 0.126 | 0.035 | 0.040 |
| Total protein intake (g/day) | 96.5 (50.3) | 1.994 (1.974, 2.014) | 80.1 (40.7) | 1.894 (1.874, 1.914) | <0.001 | 102 (48.6) | 2.006 (1.986, 2.026) | 80.1 (39.1) | 1.900 (1.880, 1.919) | <0.001 | 0.126 | 0.521 |
| Vegetable protein (g/day) | 29.1 (15.8) | 1.489 (1.467, 1.510) | 24.4 (13.3) | 1.406 (1.384, 1.427) | <0.001 | 29.2 (15.5) | 1.490 (1.468, 1.511) | 24.7 (12.3) | 1.410 (1.389, 1.431) | <0.001 | 0.906 | 0.656 |
| Animal source protein (g/day) | 64.1 (37.8) | 1.787 (1.762, 1.812) | 51.6 (32.0) | 1.684 (1.659, 1.709) | <0.001 | 70.1 (40.4) | 1.822 (1.795, 1.848) | 53.4 (32.1) | 1.694 (1.668, 1.720) | <0.001 | 0.001 | 0.890 |
| Total fat (g/day) | 99.8 (60.5) | 2.000 (1.976, 2.024) | 88.7 (52.5) | 1.950 (1.926, 1.974) | <0.001 | 128 (66.7) | 2.101 (2.078, 2.124) | 108.9 (56.8) | 2.028 (2.005, 2.050) | <0.001 | <0.001 | <0.001 |
| SFA (g/day) | 35.2 (24.3) | 1.536 (1.511, 1.562) | 30.0 (19.2) | 1.476(1.451, 1.502) | <0.001 | 44.5 (25.1) | 1.627 (1.601, 1.652) | 36.2 (20.0) | 1.545 (1.521, 1.569) | <0.001 | <0.001 | <0.001 |
| MUFA (d/day) | 41.7 (24.8) | 1.619 (1.595, 1.644) | 37.3 (24.0) | 1.575 (1.550, 1.600) | <0.001 | 52.3 (27.7) | 1.707 (1.683, 1.732) | 43.2 (22.4) | 1.633 (1.610, 1.657) | <0.001 | <0.001 | <0.001 |
| PUFA (g/day) | 15.4 (10.0) | 1.196 (1.169, 1.223) | 14.4 (9.6) | 1.156 (1.128, 1.183) | <0.001 | 22.6 (13.9) | 1.354 (1.326, 1.382) | 19.6 (12.5) | 1.287 (1.260, 1.314) | <0.001 | <0.001 | <0.001 |
| - Linoleic acid (g/day) | 12.5 (8.6) | 1.105 (1.077, 1.133) | 12.0 (8.3) | 1.065 (1.036, 1.094) | <0.001 | 18.8 (12.0) | 1.271 (1.242, 1.300) | 16.2 (11.1) | 1.200 (1.171, 1.228) | <0.001 | <0.001 | <0.001 |
| - Alpha-linoleic acid (g/day) | 1.08 (0.73) | 0.065 (0.036, 0.095) | 1.02 (0.77) | 0.039 (0.009, 0.070) | 0.295 | 1.89 (1.29) | 0.303 (0.272, 0.334) | 1.68 (1.45) | 0.016 (0.228, 0.290) | 0.003 | <0.001 | <0.001 |
| - Arachidonic acid (g/day) | 0.17 (0.13) | −0.746 (−0.775, −0.718) | 0.13 (0.09) | −0.894 (−0.923, −0.864) | <0.001 | 0.22 (0.15) | −0.657 (−0.687, −0.628) | 0.17 (0.11) | −0.792 (−0.821, −0.762) | <0.001 | <0.001 | <0.001 |
| - EPA (g/day) | 0.13 (0.13) | −0.868 (−0.917, −0.819 | 0.10 (0.13) | −0.988 (−1.038, −0.937) | <0.001 | 0.21 (0.24) | −0.705 (−0.758, −0.653) | 0.18 (0.23) | −0.808 (−0.863, −0.753) | <0.001 | <0.001 | <0.001 |
| - DPA (g/day) | 0.07 (0.06) | −1.150 (−1.185, −1.115) | 0.05 (0.04) | −1.298 (−1.334, −1.265) | <0.001 | 0.08 (0.08) | −1.064 (−1.101, −1.027) | 0.07 (0.07) | −1.196 (−1.235, −1.157) | <0.001 | <0.001 | <0.001 |
| - DHA (g/day) | 0.20 (0.20) | −0.680 (−0.727, −0.634) | 0.16 (0.18) | −0.792 (−0.840, −0.745) | <0.001 | 0.29 (0.33) | −0.537 (−0.585, −0.488) | 0.26 (0.31) | −0.619 (−0.668, −0.570) | <0.001 | <0.001 | <0.001 |
| Cholesterol intake (mg/day) | 352 (220) | 2.541 (2.516, 2.566) | 279 (173) | 2.433 (2.408, 2.459) | <0.001 | 395 (225) | 2.600 (2.574, 2.625) | 323 (169) | 2.502 (2.477, 2.527) | <0.001 | <0.001 | <0.001 |
| Total carbohydrates (g/day) | 250 (134) | 2.421 (2.399, 2.442) | 210 (105) | 2.337 (2.315, 2.359) | <0.001 | 240 (121) | 2.406 (2.384, 2.428) | 197 (92.2) | 2.310 (2.289, 2.331) | <0.001 | 0.084 | <0.001 |
| Total fiber (g/day) | 23.4 (13.1) | 1.390 (1.367, 1.412) | 22.6 (12.6) | 1.364 (1.341, 1.387) | 0.030 | 23.6 (12.4) | 1.384 (1.361, 1.408) | 22.8 (11.7) | 1.360 (1.337, 1.383) | 0.015 | 0.858 | 0.565 |
| - Soluble fiber (g/day) | 4.5 (2.5) | 0.686 (0.662, 0.709) | 4.7 (2.6) | 0.679 (0.655, 0.703) | 0.830 | 4.6 (2.4) | 0.676 (0.652, 0.701) | 4.7 (2.4) | 0.673 (0.649, 0.969) | 0.664 | 0.662 | 0.516 |
| Alcohol (g/day) | 8.2 (18.1) | 0.728 (0.640, 0.816) | 2.0 (5.7) | 0.303 (0.209, 0.396) | <0.001 | 9.3 (15.6) | 0.837 (0.750, 0.925) | 3.3 (7.5) | 0.466 (0.379, 0.552) | <0.001 | <0.001 | <0.001 |
| ORISCAV-LUX | ORISCAV-LUX 2 | Men W 1 vs. W 2 | Women W 1 vs. W 2 | |||||||||
|---|---|---|---|---|---|---|---|---|---|---|---|---|
| Men (n = 608) | Women (n = 634) | p-Value a | Men (n= 617) | Women (n = 709) | p-Value a | |||||||
| Median (IQR) | EMM (95% CI) | Median (IQR) | EMM (95% CI) | Median (IQR) | EMM (95% CI) | Median (IQR) | EMM (95% CI) | p-Value c | p-Value d | |||
| Vitamin A (µg/day) | 412 (491) | 2.662 (2.625, 2.698) | 337 (306) | 2.562 (2.526, 2.597) | <0.001 | 541 (375) | 2.737 (2.703, 2.771) | 425 (276) | 2.640 (2.607, 2.674) | <0.001 | <0.001 | <0.001 |
| Beta-carotene (µg/day) | 3789 (3241) | 3.609 (3.572, 3.645) | 4427 (4195) | 3.669 (3.632, 3.707) | <0.001 | 4693 (3733) | 3.669 (3.630, 3.707) | 5108 (4515) | 3.727 (3.690, 3.763) | <0.001 | <0.001 | <0.001 |
| Vitamin D (µg/day) | 2.9 (3.4) | 0.468 (0.425, 0.511) | 2.3 (2.7) | 0.362 (0.319, 0.406) | <0.001 | 5.6 (4.7) | 0.733 (0.692, 0.774) | 4.8 (4.4) | 0.664 (0.623, 0.704) | <0.001 | <0.001 | <0.001 |
| Vitamin E (mg/day) | 13.7 (8.3) | 1.137 (1.111, 1.163) | 14.1 (9.0) | 1.143 (1.117, 1.170) | 0.208 | 20.3 (13.5) | 1.295 (1.269, 1.321) | 16.7 (9.5) | 1.225 (1.200, 1.250) | <0.001 | <0.001 | <0.001 |
| Vitamin C (mg/day) | 128 (102) | 2.130 (2.098, 2.162) | 141 (120) | 2.152 (2.119, 2.186) | 0.038 | 141 (99.1) | 2.161 (2.129, 2.194) | 150 (103) | 2.183 (2.152, 2.215) | 0.093 | 0.009 | 0.086 |
| Thiamine (mg/day) | 1.7 (0.9) | 0.234 (0.212, 0.255) | 1.4 (0.7) | 0.151 (0.129, 0.173) | <0.001 | 1.7 (0.9) | 0.245 (0.223, 0.267) | 1.4 (0.6) | 0.154 (0.133, 0.175) | <0.001 | 0.110 | 0.469 |
| Riboflavin (mg/day) | 1.9 (1.1) | 0.309 (0.287, 0.330) | 1.7 (0.9) | 0.250 (0.228, 0.272) | <0.001 | 2.0 (1.0) | 0.315 (0.293, 0.337) | 1.6 (0.8) | 0.238 (0.217, 0.259) | <0.001 | 0.279 | 0.038 |
| Niacin (mg/day) | 23.8 (12.3) | 1.373 (1.352, 1.393) | 19.4 (9.6) | 1.273 (1.253, 1.294) | <0.001 | 26.3 (13.2) | 1.414 (1.393, 1.435) | 20.2 (9.8) | 1.302 (1.282, 1.322) | <0.001 | <0.001 | <0.001 |
| Pantothenic acid (mg/day) | 5.6 (2.8) | 0.765 (0.744, 0.785) | 5.0 (2.4) | 0.699 (0.678, 0.720) | <0.001 | 6.4 (3.3) | 0.819 (0.798, 0.840) | 5.4 (2.4) | 0.747 (0.727, 0.767) | <0.001 | <0.001 | <0.001 |
| Pyridoxine (mg/day) | 2.3 (1.2) | 0.386 (0.365, 0.407) | 2.0 (1.0) | 0.305 (0.284, 0.327) | <0.001 | 2.6 (1.3) | 0.434 (0.412, 0.455) | 2.2 (1.0) | 0.342 (0.321, 0.363) | <0.001 | <0.001 | <0.001 |
| Folate (µg/day) | 354 (203) | 2.563 (2.541, 2.585) | 347 (194) | 2.547 (2.525, 2.570) | 0.418 | 358 (179) | 2.567 (2.545, 2.589) | 340 (162) | 2.541 (2.520, 2.563) | 0.004 | 0.311 | 0.284 |
| Vitamin B12 (µg/day) | 6.0 (4.8) | 0.795 (0.764, 0.826) | 4.8 (3.8) | 0.678 (0.647, 0.709) | <0.001 | 7.4 (4.9) | 0.875 (0.844, 0.906) | 5.5 (4.0) | 0.746 (0.715, 0.777) | <0.001 | <0.001 | <0.001 |
| Calcium (mg/day) | 1043 (520) | 3.029 (3.008, 3.050) | 1048 (507) | 3.024 (3.004, 3.045) | 0.605 | 990 (473) | 2.983 (2.963, 3.004) | 904 (433) | 2.960 (2.940, 2.981) | <0.001 | <0.001 | <0.001 |
| Iron (mg/day) | 15.4 (7.7) | 1.192 (1.172, 1.212) | 12.8 (6.5) | 1.108 (1.088, 1.129) | <0.001 | 15.7 (7.5) | 1.203 (1.182, 1.223) | 13.3 (5.9) | 1.120 (1.101, 1.140) | <0.001 | 0.104 | 0.174 |
| Iodide (µg/day) | 151 (80.9) | 2.194 (2.171, 2.216) | 134 (83.5) | 2.143 (2.121, 2.166) | <0.001 | 166 (84.3) | 2.235 (2.213, 2.257) | 145 (71.7) | 2.174 (2.152, 2.195) | <0.001 | <0.001 | <0.001 |
| Magnesium (mg/day) | 430 (192) | 2.649 (2.631, 2.666) | 391 (164) | 2.604 (2.586, 2.621) | <0.001 | 404 (171) | 2.611 (2.593, 2.629) | 353 (146) | 2.554 (2.536, 2.571) | <0.001 | <0.001 | <0.001 |
| Potassium (mg/day) | 3683 (1701) | 3.583 (3.564, 3.602) | 3378 (1531) | 3.542 (3.522, 3.562) | <0.001 | 3721 (1635) | 3.582 (3.562, 3.601) | 3370 (1447) | 3.540 (3.521, 3.559) | <0.001 | 0.928 | 0.354 |
| Phosphorus (mg/day) | 1483 (763) | 3.178 (3.158, 3.198) | 1280 (637) | 3.104 (3.083, 3.124) | <0.001 | 1504 (694) | 3.174 (3.154, 3.194) | 1215 (544) | 3.090 (3.071, 3.110) | <0.001 | 0.699 | 0.016 |
| Sodium (mg/day) | 3703 (2143) | 3.549 (3.526, 3.572) | 2895 (1524) | 3.444 (3.421, 3.467) | <0.001 | 3894 (2143) | 3.586 (3.562, 3.609) | 2952 (1529) | 3.462 (3.439, 3.484) | <0.001 | <0.001 | 0.310 |
| Wave 1 | Wave 2 | WHO a | USDA ꝭ | BNF a | DACH | EFSA Δ | ||||||||
|---|---|---|---|---|---|---|---|---|---|---|---|---|---|---|
| M | W | M | W | M | W | M | W | M | W | M | W | M | W | |
| Total energy intake (kcal/day) d | 2660 | 2191 | 2785 | 2264 | 2500 | 2000 | ND | ND | 2500 e | 2000 e | 2600 | 2000 e | 2000 e | 1800 e |
| Total water (g/day) | 3057 | 2995 | 3242 | 3103 | 3700 c | 2700 c | 3700 | 2700 | ND | ND | 2700 | 2700 | 2500 c | 2000 c |
| Total protein (g/day) (%) t | 104 (15%) | 84.4 (15%) | 106 (23%) | 84.1 (14%) | 0.66 b | 0.66 b | 56 | 46 | 0.75 b | 0.75 b | 56 | 50 | 0.83 b | 0.83 b |
| Total fat (g/day) (%) t | 109 (37%) | 97.0 (40%) | 135 (43%) | 115 (46%) | 20–35% | 20–35% | ND | ND | 35% | 35% | 30% | 30% | 30% | 30 |
| SFA (g/day) (%) t | 39.0 (13%) | 33.4 (14%) | 46.8 (15%) | 38.8 (15%) | 10% | 10% | ND | ND | 11% | 11% | ND | ND | ND | ND |
| MUFA (g/day) (%) t | 45.8 (15%) | 41.0 (17%) | 55.2 (18%) | 47.0 (18%) | 15–20% | 15–20% | ND | ND | ND | ND | ND | ND | ND | ND |
| PUFA (g/day) (%)t | 17.4 (11%) | 16.2 (7%) | 25.0 (8%) | 22.4 (9%) | 6–11% | 6–11% | ND | ND | ND | ND | ND | ND | ND | ND |
| Carbohydrate (g/day) (%) t | 282 (42%) | 227 (41%) | 257 (37%) | 210 (37%) | 55–75% | 55–75% | 13D | 130 | 50% | 50% | 50% | 50% | 50% | 50% |
| Total fiber (g/day) | 25.3 | 24.2 | 25.4 | 24.3 | 38 | 25 | 38 | 25 | 30 | 30 | 30 | 30 | 25 c | 25 c |
| Alcohol (g/day) | 12.5 | 4.8 | 14.8 | 6.3 | ND | ND | ND | ND | ND | ND | 20 | 10 | ND | ND |
| Vitamin A (µg/day) | 549 | 437 | 603 | 490 | 600 | 500 | 900 | 700 | 700 | 600 | 1.0 g | 0.8 g | 750 | 650 |
| Vitamin D (µg/day) | 3.6 | 3.0 | 6.6 | 5.7 | 5 * | 5 * | 5 * | 5 * | 10 | 10 | 20 s | 20 s | 15 c | 15 c |
| Vitamin E (mg/day) | 15.4 | 15.6 | 21.7 | 18.8 | 10 | 7.5 | 15 | 15 | ND | ND | 14 | 12 | 13 c | 11 c |
| Vitamin C (mg/day) | 151 | 162 | 161 | 170 | 45 | 45 | 90 | 75 | 40 | 40 | 110 | 95 | 110 | 95 |
| Thiamine (mg/day) | 1.8 | 1.5 | 1.8 | 1.5 | 1.2 | 1.1 | 1.2 | 1.1 | 1.0 | 0.8 | 1.2 | 1.0 | 1.0 | 1.0 |
| Riboflavin (mg/day) | 2.1 | 1.9 | 2.1 | 1.8 | 1.3 | 1.1 | 1.3 | 1.1 | 1.3 | 1.1 | 1.3 | 1.1 | 1.6 | 1.6 |
| Niacin (mg/day) | 24.8 | 20.1 | 27.3 | 21.4 | 16 | 14 | 16 | 14 | 16 | 14 | 15 | 11 | 16 | 16 |
| Pantothenic acid (mg/day) | 6.0 | 5.2 | 6.7 | 5.7 | 5 | 5 | 5 | 5 | ND | ND | 6 | 6 | 5 | 5 |
| Pyridoxine (mg/day) | 2.5 | 2.1 | 2.8 | 2.3 | 1.7 | 1.5 | 1.3 * | 1.3 * | 1.4 | 1.2 | 1.6 | 1.4 | 1.7 | 1.6 |
| Folate (µg/day) | 374 | 372 | 383 | 363 | 400 | 400 | 400 | 400 | 200 | 200 | 300 | 300 | 330 | 330 |
| Vitamin B12 (µg/day) | 6.8 | 5.3 | 8.1 | 6.3 | 2.4 | 2.4 | 2.4 | 2.4 | 1.5 | 1.5 | 4.0 | 4.0 | 4.0 c | 4.0 c |
| Calcium (mg/day) | 1136 | 1111 | 1023 | 969 | 1000 * | 1000 * | 1000 * | 1000 * | 700 | 700 | 1000 | 1000 | 1000 c | 1000 c |
| Iron (mg/day) | 16.1 | 13.4 | 16.4 | 13.8 | 8 | 18 * | 8 | 18 * | 8.7 | 14.8 * | 10 | 15/10 p | 11 | 16/11 p |
| Iodide (µg/day) | 162 | 147 | 177 | 155 | 200 | 150 | 150 | 150 | 140 | 140 | 190 | 150 | 150 c | 150 c |
| Magnesium (mg/day) | 453 | 410 | 419 | 371 | 260 | 220 | 420 l | 320 l | 300 | 270 | 350 | 300 | 350 | 300 |
| Potassium (mg/day) | 3886 | 3584 | 3860 | 3543 | 3400 c | 2600 c | 4700 | 4700 | 3500 | 3500 | 4000 | 4000 | 3500 | 3500 |
| Phosphorus (mg/day) | 1571 | 1350 | 1542 | 1284 | 700 | 700 | 700 | 700 | 550 | 550 | 700 | 700 | 550 | 550 |
| Sodium (mg/day) | 3937 | 3092 | 4152 | 3154 | 2000 | 2000 | 2300 | 2300 | 1600 | 1600 | 1500 | 1500 | 2000 | 2000 |
Publisher’s Note: MDPI stays neutral with regard to jurisdictional claims in published maps and institutional affiliations. |
© 2021 by the authors. Licensee MDPI, Basel, Switzerland. This article is an open access article distributed under the terms and conditions of the Creative Commons Attribution (CC BY) license (https://creativecommons.org/licenses/by/4.0/).
Share and Cite
Vahid, F.; Brito, A.; Le Coroller, G.; Vaillant, M.; Samouda, H.; Bohn, T.; on behalf of ORISCAV Working Group. Dietary Intake of Adult Residents in Luxembourg Taking Part in Two Cross-Sectional Studies—ORISCAV-LUX (2007–2008) and ORISCAV-LUX 2 (2016–2017). Nutrients 2021, 13, 4382. https://doi.org/10.3390/nu13124382
Vahid F, Brito A, Le Coroller G, Vaillant M, Samouda H, Bohn T, on behalf of ORISCAV Working Group. Dietary Intake of Adult Residents in Luxembourg Taking Part in Two Cross-Sectional Studies—ORISCAV-LUX (2007–2008) and ORISCAV-LUX 2 (2016–2017). Nutrients. 2021; 13(12):4382. https://doi.org/10.3390/nu13124382
Chicago/Turabian StyleVahid, Farhad, Alex Brito, Gwenaëlle Le Coroller, Michel Vaillant, Hanen Samouda, Torsten Bohn, and on behalf of ORISCAV Working Group. 2021. "Dietary Intake of Adult Residents in Luxembourg Taking Part in Two Cross-Sectional Studies—ORISCAV-LUX (2007–2008) and ORISCAV-LUX 2 (2016–2017)" Nutrients 13, no. 12: 4382. https://doi.org/10.3390/nu13124382