Article

Magnitude, Temporal Trends, and Inequalities in the DALYs and YLDs of Nutritional Deficiency among Older Adults in the Western Pacific Region: Findings from the Global Burden of Disease Study 1990–2019

1
School of Nursing, The Hong Kong Polytechnic University, Hong Kong, China
2
Parc Sanitari Sant Joan de Déu, Universitat de Barcelona, Fundació Sant Joan de Déu, 08007 Barcelona, Spain
3
Centro de Investigación Biomédica en Red de Salud Mental, Instituto de Salud Carlos III, 28029 Madrid, Spain
*
Author to whom correspondence should be addressed.
Nutrients 2021, 13(12), 4421; https://doi.org/10.3390/nu13124421
Submission received: 2 November 2021 / Revised: 7 December 2021 / Accepted: 8 December 2021 / Published: 10 December 2021
(This article belongs to the Special Issue Nutrition, Frailty and Sarcopenia Prevention)

Abstract

:
The population in the Western Pacific region is aging rapidly. Nutritional deficiency is prevalent in older adults; however, information regarding nutritional deficiency in this population is scarce. Using the 2019 Global Burden of Disease (GBD) results, the age-standardized disability-adjusted life years (DALYs) and years of healthy life lost due to disability (YLDs) from nutritional deficiency were estimated between 1990 and 2019 for this population. Average annual percentage change (AAPC) was used to assess temporal trends, and linear mixed-effects models were used to examine socioeconomic and sex inequalities. From 1990 to 2019, the age-standardized DALYs of nutritional deficiency in this population decreased from 697.95 to 290.95 per 100,000, and their age-standardized YLDs decreased from 459.03 to 195.65 per 100,000, with the greatest declines seen in South Korea (AAPCs < −5.0). Tonga had the least decline in DALYs (AAPC = −0.8), whereas Fiji experienced an increase in YLDs (AAPC = 0.1). Being female and having a lower sociodemographic index score was significantly associated with higher age-standardized DALYs and YLDs. The magnitude and temporal trends of the nutritional deficiency burden among older adults varied across countries and sex in the region, indicating that health policies on nutritional deficiency among older adults must be crafted to local conditions.

1. Introduction

The Western Pacific region has one of the largest aging populations in the world, accounting for 34.3% of older adults in the world aged 65 years or over [1]. The size of this older population is projected to double over the next 30 years, from 240 million to 480 million by 2050 [1,2]. Within this aging population, it is estimated that the number of oldest-old adults (aged ≥80 years) will triple during this period [2]. Some countries in the region, such as Singapore, Vietnam, the Lao People’s Democratic Republic, and China, are expected to transition from an aging to an aged society in less than 30 years [1]. Aging populations are prone to chronic diseases, functional decline, and cognitive impairment, placing a significant burden on regional healthcare resources [3].
Nutritional deficiencies have been identified as an important risk factor in the disease burden of older adults through increasing rates of infections, lifestyle diseases, frailty, sarcopenia, and mental disorders [4,5]. This is prevalent in older adults, manifesting in deficiencies in energy, protein, and other micronutrients including vitamins (e.g., vitamin D) and minerals (e.g., iron), thereby leading to the progression of under-nutrition [4,6,7]. Owing to physiological and psychosocial factors, many older adults have diminished dietary intake and poor food options, both of which would result in a reduction in the quantity and quality of the nutrients that they consume [7,8]. Meta-analytic results indicate that, with regard to prevalence, the risk of high malnutrition ranges from 8.5% in a community setting, to 28.0% in a hospital setting [9,10]. Studies have shown that nutritional deficiencies are related to an increased risk of morbidity and mortality [11,12,13], and thus are a serious public health problem that has been attracting more attention from policymakers [14].
Recent research in the area has extended from older patients in hospitals, care situations and nursing homes, to community settings [15,16]. However, the scope of inquiry has remained limited to the district level, as well as to health resource outcomes. A recent study has estimated the disease burden due to the nutritional status of 186 countries from 1990 to 2015, using the Global Nutritional Index calculated based on disability-adjusted life years (DALYs). DALYS associated with nutritional deficiency are defined as the sum of the number of years of healthy life lost, due to the premature loss of life (YLL) and to disability (YLD) in the population from cases of nutritional deficiency [17]. That study clearly showed the impact of socioeconomic factors on the nutritional burden. There was substantial variation among low- and middle-income countries in the Western Pacific region, compared with other WHO regional groups in 2015 [18]. That study provided information about temporal trends in the disease burden owing to nutritional deficiencies at the country level. However, this revealed little about demographic metrics, such as age-specific estimates for older adults and gender inequality, with regard to the health burden of the disorder, data needed by nutritionists, public health professionals, and policy makers.
Nutritional experts in the Western Pacific region have acknowledged the lack of country-specific data on nutrition in the older adult subpopulation [19]. In this study, we aimed to fill this knowledge gap by providing data on (1) the magnitude of the problem, by calculating age-standardized DALYs and YLDs and (2) temporal trends, by estimating the average annual percentage change (AAPC) in age-standardized DALYs and YLDs attributed to nutritional deficiency in countries in the region from 1990 to 2019. Lastly, (3) we examined gender inequality and socioeconomic disparities in relation to the burden of nutritional deficiency in older adults.

2. Materials and Methods

2.1. Data Source

The data utilized in this study are available on the Global Burden of Disease, Injuries and Risk Factors Study (GBD) website (http://ghdx.healthdata.org/gbd-results-tool, accessed date: 27 October 2021), which provides specific data on multiple measures of loss of health from 369 causes and 87 risk factors for 204 countries and territories from 1990 to 2019 [17]. We extracted the annual DALYs and YLDs numbers on nutritional deficiency according to sex, age (≥65 years old), and the sociodemographic index (SDI) from 1990 to 2019 for the 27 countries or territories in the Western Pacific region. These 27 countries or territories can be classified into three economic levels (high income, upper-middle, and lower-middle income) based on the World Bank Classification in 2019 [20]. In GBD, the International Classification of Diseases (ICD) 10th version codes D50-D53.9, E00-E02, E40-E46.9, E50-E61.9, E64-E64.9, Z13.2-Z13.3, and 9th version codes 244.2, 260–269.9, 280–281.2, V12.1, V18.2-V18.3, V77.2, V78.0-V78.1 were used to represent nutritional deficiency, which includes protein-energy malnutrition, and deficiencies in iron, vitamin A, iodine, and other nutritional deficiencies [21].
To quantify the trends in burden due to nutritional deficiencies in the Western Pacific region, the age-standardized rates of DALYs and YLDs, expressed per 100,000 population, were calculated for 30 consecutive years according to the following age stratification used in GBD: 65–69, 70–74, 75–79, 80–84, 85–89, 90–94, and >95 years old, using the GBD world population in 2019 as the standard population. The age-standardized rate is a weighted average of the age-specific rates per 100,000 persons, where the weights are the proportions of persons in the corresponding age groups of a standard population. Age-standardization is essential when comparing different populations with different age distributions, because it removes the influences of population size and age structure. Briefly, YLDs present the number of years lived in less than “ideal health.” DALYs are the sum of the number of years of life lost (YLLs are the years lost due to premature mortality) and of YLDs [17,22].
The SDI is used to further assess the effects of socioeconomic factors on trends in the burden of nutritional deficiency over time. The SDI is a summary index of components covering country-level income per capita, average educational attainment among individuals over the age of 15, and total fertility rate among women under the age of 25. The SDI ranges from 0 to 100, with a higher value indicating a higher level of socioeconomic development [21].
More details on the GBD methodology and estimates analysis can be found in previous GBD 2019 publications [17,22,23].

2.2. Statistical Analysis

Stratified by sex, the annual percent change (APC) and the average annual percentage change (AAPC) in the age-standardized rates of DALYs and YLDs attributed to nutritional deficiency over the years were computed for the Western Pacific region, and for each of the 27 countries and territories in the region using the joinpoint regression programme 4.8.0.1 [24]. The AAPC is a weighted average of the APCs, and has a 95% confidence interval (CI), which was used as a summary measure of the trend over the complete study period. The trend is considered stable if the 95% CI of the AAPC covers 0; decreasing if the upper bound of the 95% CI is <0; and increasing if the lower bound of the 95% CI is >0. The statistical significance of the AAPC was tested using the parametric t-test provided by the joinpoint regression programme.
Pooled analyses were performed to examine associations between age-standardized DALYs and YLD rates for nutritional deficiency with SDI and sex, using data from all years and countries by Spearman correlation and independent t-test with a 95% bootstrap confidence interval (CI). To interpret the strength, we classified correlations into three groups: weak (≤0.3), moderate (0.4–0.6), and strong (≥0.7). To further examine the individual contribution of sex and SDI and their interaction effect on age-standardized DALYs and YLDs rates attributed to nutritional deficiency, mixed-effect multilevel linear regression models were performed. This was performed to assess whether these two measures of burden due to nutritional deficiency were related to sex and socioeconomic development (i.e., SDI) between 1990 and 2019, after controlling for the dependency of the observations at the country level. Specifically, two linear mixed-effect model regressions were carried out separately, for age-standardized DALYs and YLD rates. In the models, four independent variables, namely, time (1990–2019), sex (male vs. female), SDI, and an interaction term of Sex × SDI, were considered as the level 1 analysis. Countries were considered for the level 2 analysis where the observations of the repeated measures were aggregated. Statistical tests on AAPC were performed using the joinpoint regression programme, although all other statistical tests were performed using SPSS version 26.0. p-values were calculated based on two-sided tests and the level of significance was set at 5%.

3. Results

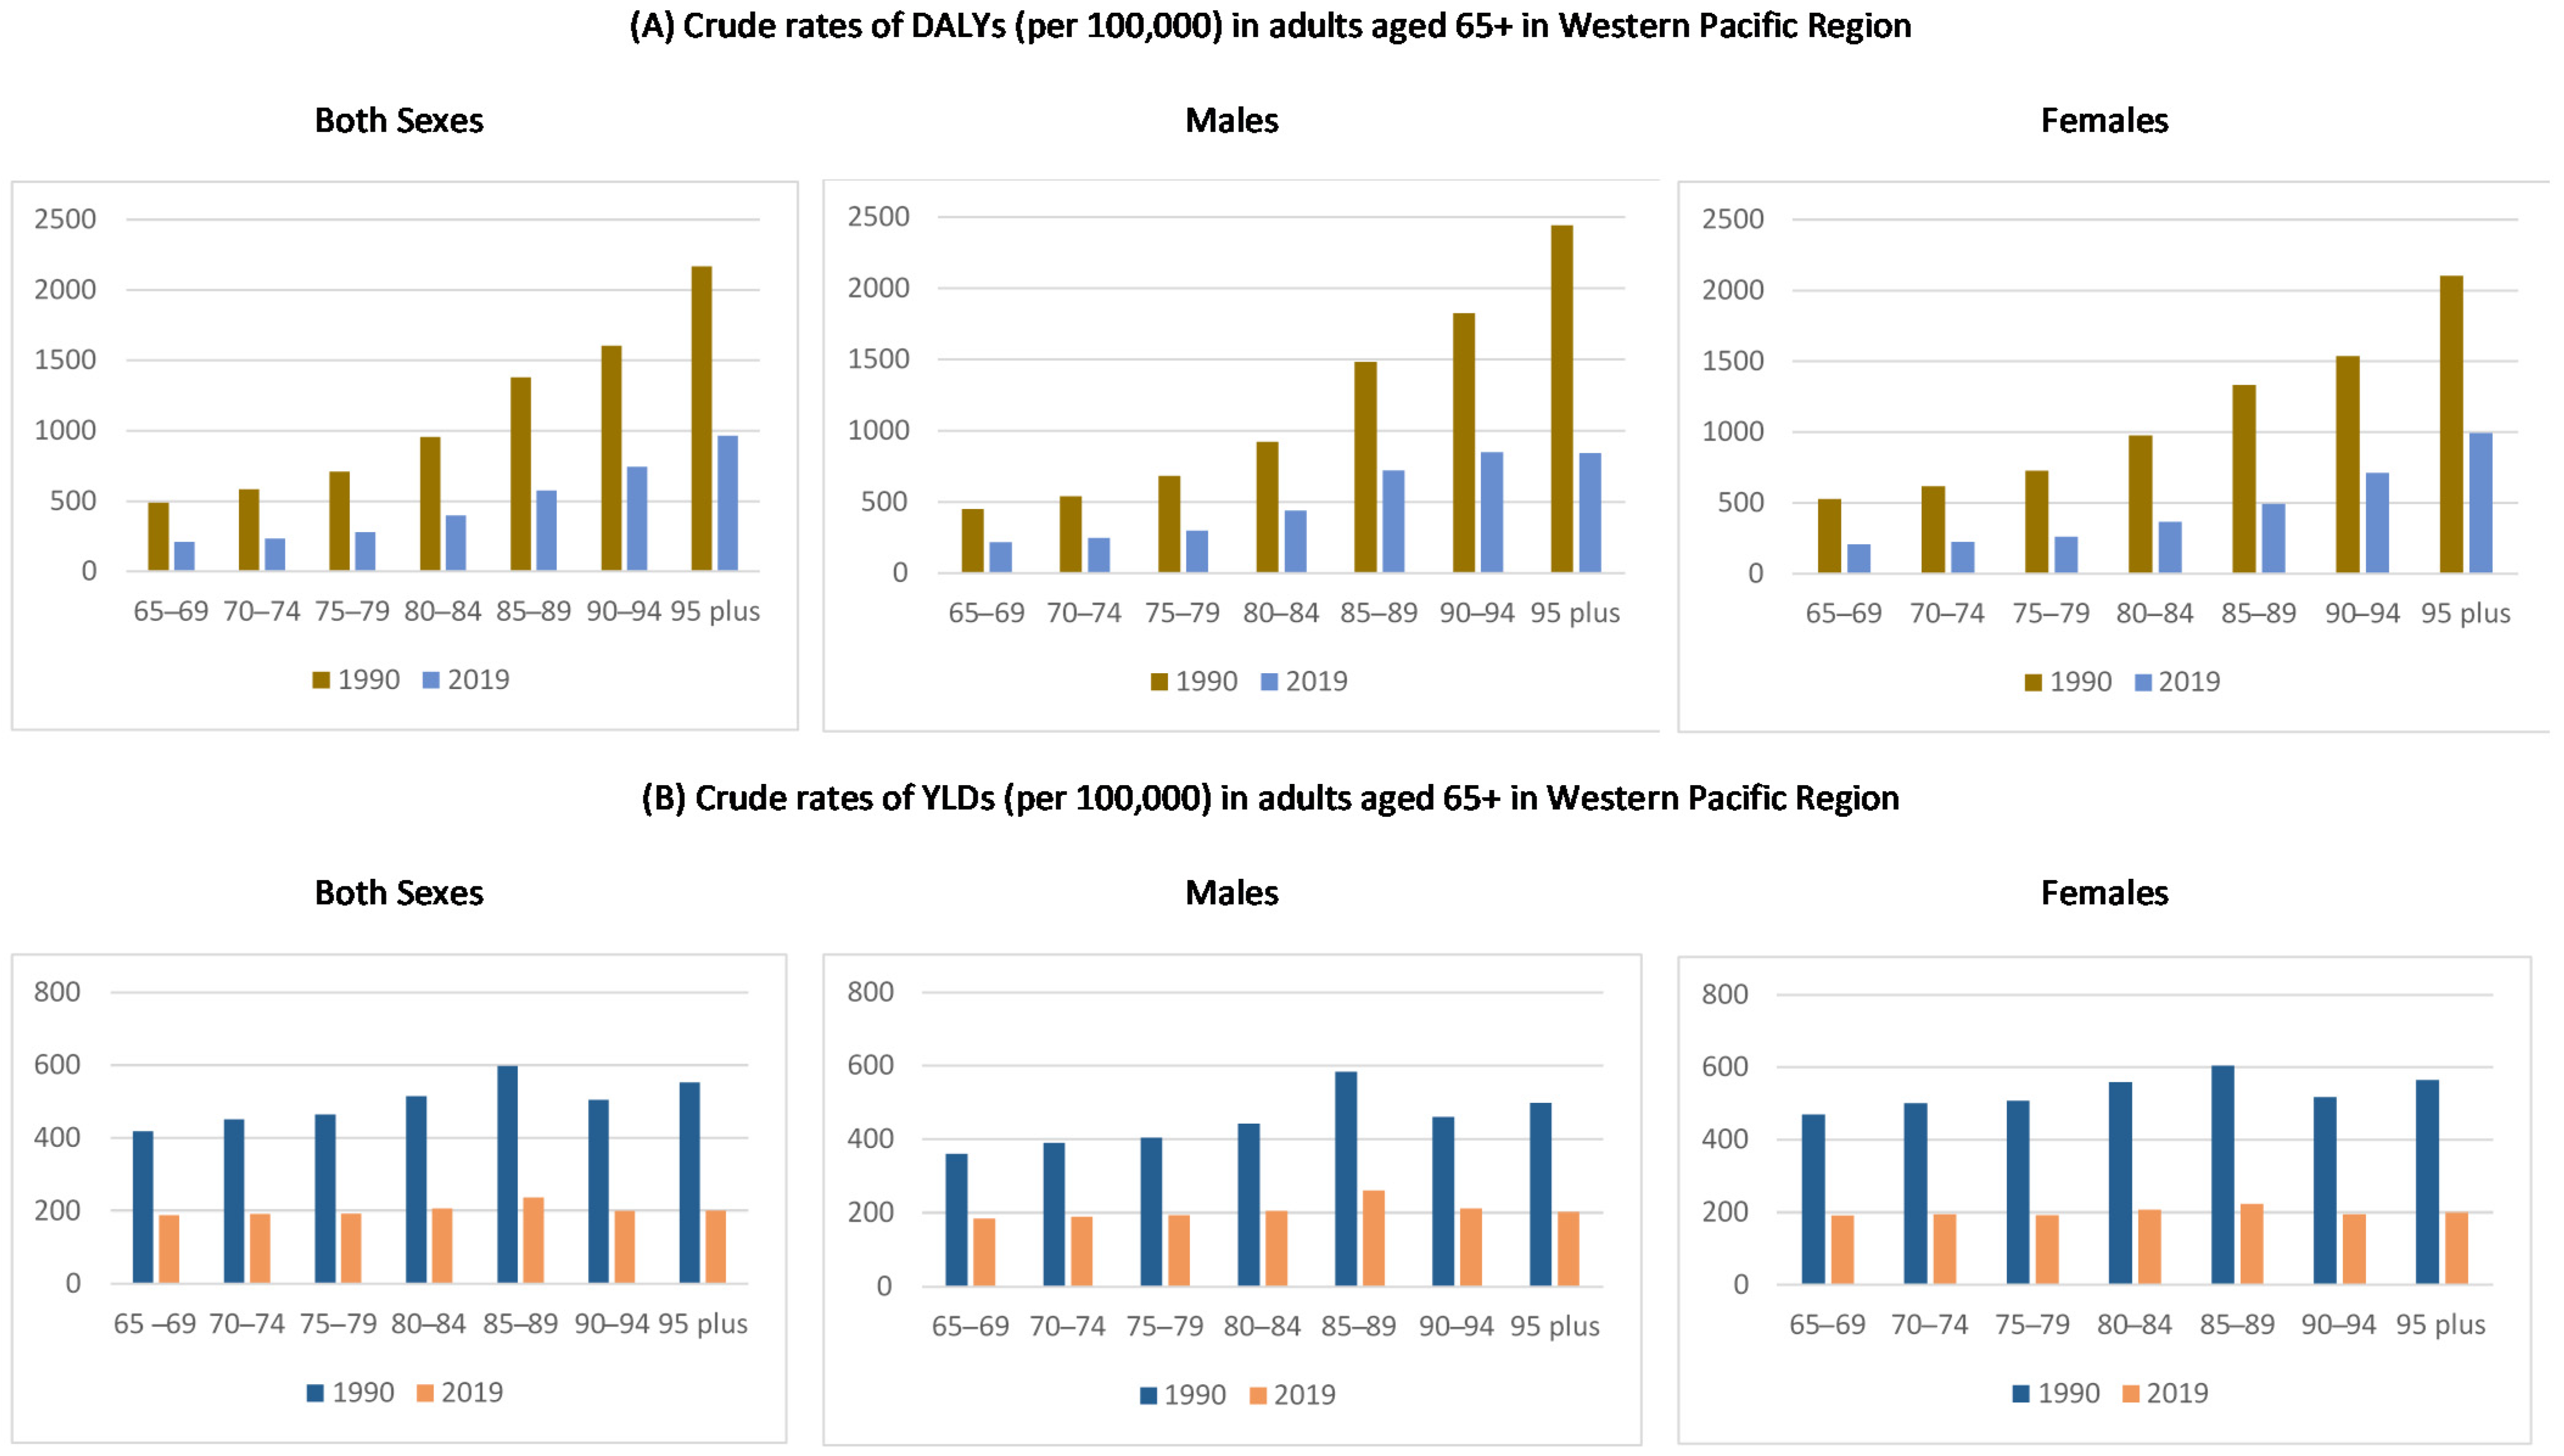
3.1. Age-Specific Crude Rates of DALYs and YLDs Attributed to Nutritional Deficiency in the Western Pacific Region

Age-specific crude rates of DALYs and YLDs among older adults in the Western Pacific region, stratified by sex, are shown in Figure 1 and the Supplementary Table S1. The age-specific DALYs rates were reduced from 1990 to 2019, and were found to increase with age in both sexes, reaching a maximum in the age group of 95 years and above. Comparing between the two years, a sex difference in the impact of nutritional deficiency was observed in 1990, in which the crude DALYs rates were larger in females than males; however, in 2019 the rates were comparable between males and females (Figure 1A). For YLDs, the age-specific crude rates were also reduced over the study period, and were similar in all age groups and between males and females (Figure 1B).

3.2. Temporal Trends in DALYs and YLD Attributed to Nutritional Deficiency in the Western Pacific Region

Table 1 shows the overall age-standardized DALYs and YLD rates and their percentage change in nutritional deficiency among adults aged 65 or above in the Western Pacific region, in the period of 1990 to 2019. In the whole region, both the age-standardized DALYs and YLDs rates decreased significantly during the period 1990–2019, with larger drops in females than males. Specifically, the estimated age-standardized DALYs rate for both sexes decreased from 697.95 (95%CI: 696.03, 699.87) in 1990 to 290.95 (95%CI: 290.25, 291.65) per 100,000 population in 2019—an annual percentage change of 3.0% (2.2%, 3.8%). The decrement in the age-standardized rate in YLDs was also observed in males by an average of 2.6% (2.5%, 2.8%) and females by an average of 3.3% (3.0%, 3.6%), respectively. For YLDs, a decreasing pattern was also observed. The age-standardized YLDs rate decreased significantly by an average of 2.9% (2.8%, 3.1%) in both sexes, by 2.5% (2.3%, 2.6%) in males, and 3.2% (3.1%, 3.3%) in females.
Analyses of the AAPC of age-standardized rates in DALYs and YLDs attributed to nutritional deficiency among older adults between 1990 and 2019 in both sexes, and by country in the Western Pacific region, are presented in Figure 2, Table 2, and Supplementary Figure S1. All of the countries have significant decreasing trends in age-standardized DALYs rates in both sexes over the period, as reflected by the upper bound of the 95% CI of the AAPCs being <0. However, a substantial variation was observed by country, with AAPC ≥5 in two countries (South Korea and Cambodia), between 3 and 4 in four countries (Laos, Vietnam, Singapore, and China), between 2 and 3 in one country (Brunei), and <2 in the remaining 20 countries. Larger variations were observed in the lower-middle income region (Figure 2 and Table 2). The age-standardized DALYs rate (per 100,000 population) ranged from 129.12 (95% CI: 117.32, 140.92) in New Zealand to 4920.64 (4832.42, 5008.86) in Cambodia in 1990, and from 84.32 (77.68, 90.96) in New Zealand to 3140.23 (2397.29, 3883.17) in Kiribati in 2019, in the data for both sexes. In addition, variations in the magnitude of the decreasing trends in the age-standardized rate in DALYs by sex were observed, with most countries seeing sharper reductions in males than in females. Exceptions were observed in seven high-income or upper-middle income countries (South Korea, Japan, Singapore, Brunei, Malaysia, China and Fiji), where there were sharper reductions in females. The age-standardized DALYs rates for males ranged from 106.91 (89.55, 124.27) in New Zealand to 6282.01 (6118.17, 6445.85) in Cambodia in 1990, and from 71.01 (62.05, 79.97) in New Zealand to 1725.12 (818.98, 2631.26) in Kiribati in 2019. The corresponding ranges for females were 145.07 (128.81, 161.33) in New Zealand to 5135.66 (3561.68, 6709.64) in Kiribati in 1990, and from 96.27 (86.51, 106.03) in New Zealand to 3894.84 (2879.90, 4909.78) in Kiribati in 2019. For all of the countries, the patterns of the decreasing trends varied as well. Although, in general the decreases occurred gradually over time in the region, the age-standardized rate in DALYs in six countries increased first, and then decreased. These countries were: Japan (in males only); Tonga; Nauru; Mongolia; Vanuatu (in females only), and Papua New Guinea (Supplementary Figure S1).
For the age-standardized YLDs rate, contrary to most countries that showed significant decreasing trends, Fiji and Vanuatu showed significant increasing trends in both sexes, with AAPCs = 0.1 (0.00, 0.2) (p-values < 0.05). Among the 25 countries with decreasing trends in the age-standardized rate in YLDs, substantial variations were observed, with AAPC ≥5 in one country (South Korea), between 3 and 4 in three countries (Japan, Singapore, and China), between 2 and 3 in three countries (Malaysia, Vietnam, and Cambodia), and below 2 in the remaining 18 countries. Larger variations were observed in high-income regions (Figure 2 and Table 2). The age-standardized YLDs rate ranged from 95.91 (85.79, 106.03) in New Zealand to 1093.73 (1034.99, 1152.47) in Laos in 1990, and from 68.53 (62.47, 74.59) in New Zealand to 853.57 (526.07, 1181.07) in Kiribati in 2019, in the data for both sexes. Similar to the age-standardized rate in DALYs, most countries saw sharper reductions in males than females, with the exception of five high-income countries (South Korea, Japan, Singapore, New Zealand, and Brunei), three upper-middle income countries (Malaysia, China, and Fiji), and one lower-middle income country (Vanuatu), with sharper reductions in females. In 1990, the highest age-standardized YLDs rate for males was 943.84 (854.42, 1033.26) in Laos, and the lowest was 69.96 (56.24, 83.68) in New Zealand, whereas in 2019 the highest rate was 545.98 (505.08, 586.88) in Laos and the lowest was 53.86 (46.02, 61.70) in New Zealand. The corresponding figures for females were as follows: the highest was 1244.06 (594.34, 1893.78) in Kiribati; the lowest was 111.89 (105.41, 118.37) in Australia in 1990; the highest was 1157.38 (689.12, 1625.64) in Kiribati and the lowest was 81.56 (72.46, 90.66) in New Zealand in 2019. Variations in the pattern of a decreasing trend in the age-standardized rate in YLDs for all of the countries are presented in Supplementary Figure S1.

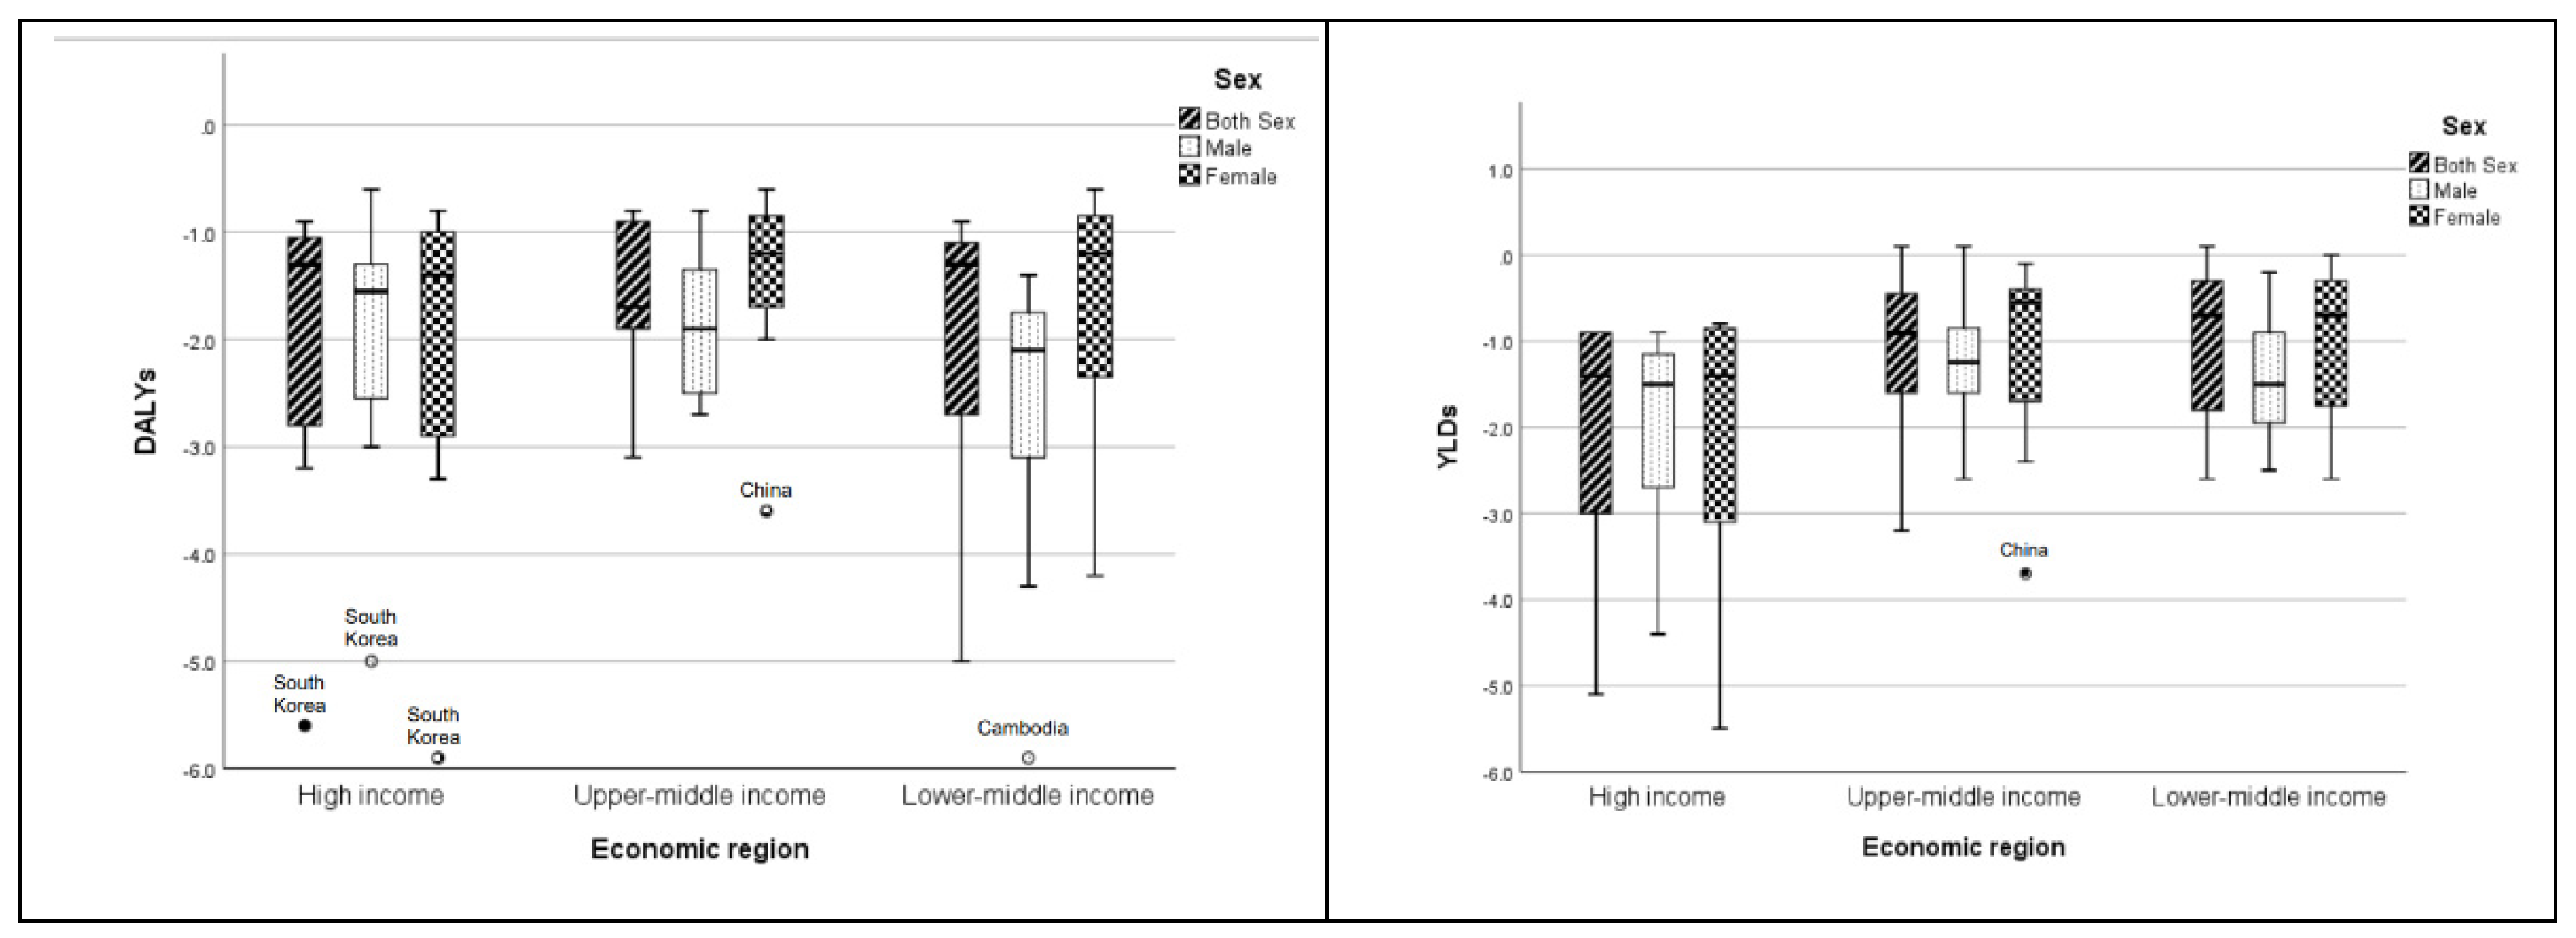
3.3. Relationship of the Age-Standardized Rates in DALYs and YLDs with Sex, SDI, and Time

Mean values of the age-standardized rates in DALYs and YLDs attributed to nutritional deficiency and their correlations with SDI by sex are presented in Table 3. On average, females demonstrated a significantly greater age-standardized rate in DALYs (mean difference = 506.44, 95% CI (422.42, 598.28), p-value < 0.001) and in YLDs (mean difference = 387.76, 95% CI (360.82, 416.22), p-value < 0.001) than their male counterparts. Strong and negative correlations between the age-standardized DALYs rate attributed to nutritional deficiency and SDI (correlations < −0.84, p-values < 0.001) were observed in both sexes, males and females. For YLDs, negative correlations with SDI were observed, with strong correlations in both sexes and females (correlations < −0.84, p-value < 0.001) and moderate correlations (correlation = −0.682, p-value < 0.001) in males.
The results of the mixed-effects model regression for age-standardized rates in DALYs and YLDs on Time, Sex, SDI, and Sex × SDI as level 1 factors, and countries as a level 2 factors, are presented in Table 4. The two models showed that the age-standardized rates in DALYs and YLDs have significant negative associations with sex and SDI. In addition, the interaction of sex and SDI was also statistically significant with a coefficient of 1317.44 for DALYs and 1216.17 for YLDs, after controlling for the effect of time and the clustering effect of the country. This indicates that older adults who were males and living in countries with high SDI tended to have lower age-standardized rates in DALYs and YLDs. The impact of SDI on reducing the two measures of burden was greater among males than females.

4. Discussion

Regionally, our results from the Western Pacific area indicate that nutritional deficiency imposes a formidable burden on older adults. They also show that although there is a trend of a decrease in burden, DALYs and YLDs were decreasing to a small extent in most low- and middle-income areas in the region, over the study period. Socioeconomic and gender inequality persist. A higher burden attributed to nutritional deficiency was still seen in countries in the region with lower SDI, and in females. More importantly, females living in lower SDI countries in the region experienced a greater burden from nutritional deficiency.
The present study found that although there has been a substantial reduction in the Western Pacific region in the age-standardized DALYs and YLDs rates attributed to nutritional deficiency from 1990 to 2019, the magnitudes were notably larger with higher DALYs, and increased with age. Despite the significant burden of increased disability related to nutritional deficiency in this vulnerable population, government policies seldom prioritize the development of effective strategies to meet their nutritional needs. Only a few high-income countries in the region, including Australia, Singapore, and New Zealand, have drawn up nutritional guidelines or recommendations specifically for older adults [25,26,27]. Nonetheless, the challenges involved in addressing nutritional deficiency in older adults have not been emphasized. Although international dietetic organizations recommend that all older people, regardless of age, can benefit from routine assessments of nutritional risk and careful attention to nutritional adequacy and balance [4,28,29], older adults, particularly the old-old, may be at a higher risk from consuming food of poor quality, especially when the consumption of food and its access and preparation present difficulties for them, due to physical and/or cognitive decline, and/or the lack of a caregiver. Some evidence exists regarding the health benefits of nutritional strategies targeting this population in the United States and European countries, through the provision of assisted meal services or packed foods, or the mobilization of social or community resources to support the nutritional care of older adults [30,31,32]. These nutritional support strategies can be considered for adoption in the Western Pacific region, especially as populations in the region continue to age. A further analysis could focus on subtypes of nutritional deficiency to determine areas of priority in dealing with the burden, so that policies can be developed for the older adult subpopulation in the Western Pacific region.
With regard to spatial patterns in the burden of nutritional deficiency in the Western Pacific region, the age-standardized rates in DALYs and YLDs were high in lower-middle income countries, especially those with lower SDI. Our jointpoint and mixed models results are in line with those of previous studies, which found a strong relationship between dietary quality and socioeconomic status among older adults, as reflected in energy intake and macronutrient and micronutrient levels [33]. Dietary habits in the Western Pacific area have been recognized as a major health risk factor for the population [19]. However, to date the focus has been on maternal and child nutrition [34]. Research and guidelines for older populations have been lacking, although this population is expected to increase dramatically in the coming years in the Western Pacific region. Our analysis showed that the majority of countries reported a mild decline (AAPC <2) in both DALYs and YLDs, attributed to nutritional deficiencies. Countries implementing long-term nutrition policies and strategies such as South Korea, Japan, and Singapore saw large declines in DALYs or YLDs attributed to nutritional deficiencies [35,36,37]. Similar moderate reductions were noted among some Western Pacific regions (i.e., Malaysia), where population-healthy nutrition policies have been implemented for several years [38,39]. In contrast to the above, the island of Fiji and Vanuatu showed an increase in AAPCs in both sexes. Although these places have taken nutrition-related actions [40,41], the current trends call for additional efforts to be made in reforming health and nutrition, as well as in enhancing nutrition policies, especially those relating to older adults. These results, in conjunction with our analysis, show the impact of nutrition and public health policies on the health of the older adult population. Our study is the first to report the diverse geographical/regional disability patterns attributed to nutritional disorders, using population-based data from the GBD 1990–2019 study, indicating that country-specific nutrition strategies are needed in Western Pacific areas.
Our research also reveals that there has been a great difference in the past 20 years between males and females in DALYs and YLDs, attributed to nutritional deficiency. Although the age-standardized rates in DALYs and YLDs attributed to nutritional deficiency show a decreasing trend in both sex groups, substantially larger burdens were observed in women than men in most of the countries in the region, especially in the low- and upper-middle income countries, as shown in Supplementary Figure S1. The result is in line with published literature indicating that women of all ages report a greater magnitude of disability than men [42,43,44]. Apart from the differences in genetic background between men and women [45], social factors such as financial deprivation and social inequality may play a role in creating these disparities [46]. Differential power relations between sex subgroups are clear in countries with lower SDI in the Western Pacific area [47,48]. Social inequality may be apparent in women, with respect to their health circumstances and their pursuit of access to the healthcare system. This social inequality in women may further be amplified with the interplay between poverty and limited availability of health care in the community, meaning that women are unlikely to treat their health conditions in a timely manner. Hence, they might live with a disability for a longer time than men. On the other hand, the rise of female empowerment and better availability of healthcare services are expected to close the gender gap in high-income countries in the region [48]. Nevertheless, our study has provided country- and sex-specific data regarding the burden attributable to nutritional deficiency among older adults. This information is important for developing nutritional initiatives for older people in the Western Pacific region [19].
Our study has some limitations, including the use of GBD 2019 data on burden metrics being calculated from estimates based on a Bayesian hierarchy model, using pooled data obtained from an extensive systematic review at the global, regional, and national level; bias may have resulted due to statistical assumptions and the data sources in the estimations [17,22,23]. Moreover, we used the aggregate data at the country level instead of at the district level, which might have introduced bias from geographical variations within a country in DALYs and YLDs estimates. Additional limitations are that the data analyses (such as in correlations and mixed-effect modeling) could not adjust for other factors influencing nutritional deficiencies, such as living alone, following specific dietary schemes and others, that could also have altered the estimations. As this is a descriptive research work, although we applied a number of correlates and associations (i.e., Spearman correlations and mixed models), our analyses did not come to any conclusion about causal relationships.

5. Conclusions

Using the GBD data of 27 countries from 1990–2019 in the Western Pacific region, a diverse age-standardized DALY pattern attributable to nutritional disorders was observed. Although the results show a great difference between males and females in age-standardized DALYs and YLDs, such a gap is narrowing over time. Older adults who were males and living in high SDI countries tended to have lower age-standardized rates in DALYs and YLDs. Moreover, age-specific DALYs increased with age, reaching a maximum in the age group of 95 years and above. As an aging population would likely drive up resource utilization and healthcare costs, our findings call for governments to be highly aware of the importance of formulating nutritional policies that address the needs of older people, especially those of the female sex, to assure gender equality in health.

Supplementary Materials

The following are available online at https://www.mdpi.com/article/10.3390/nu13124421/s1, Figure S1: Average annual percentage change (AAPC) in the age-standardized rates of the DALYs and YLDs attributed to nutritional deficiency among older adults (≥65 years) between 1990 and 2019 in both sexes and by country in the Western Pacific region, Table S1: Age-specific numbers and crude rates in DALYs and YLDs among older adults, stratified by sex, in the Western Pacific region.

Author Contributions

Conceptualization, D.Y.P.L., H.-L.C. and A.M.; methodology, D.Y.P.L. and S.T.; statistical analysis, D.Y.P.L.; data curation, D.Y.P.L., H.-L.C., A.S.K.T., J.Y.W.L. and M.M.Y.T.; manuscript writing, D.Y.P.L., H.-L.C., S.T., A.S.K.T., J.Y.W.L.; M.M.Y.T., C.K.Y.L. and A.M. All authors have read and agreed to the published version of the manuscript.

Funding

GBD is supported by the Bill & Melinda Gates Foundation. This work is partly supported by the Angel S.P. Chan Lau endowment.

Institutional Review Board Statement

Ethical approval was not needed for this secondary data analysis of publicly available data. The institutions that conducted the surveys were responsible for ethical clearance.

Informed Consent Statement

The institutions that conducted the surveys were responsible for obtaining informed consent from the participants.

Data Availability Statement

Data are available in a public, open access repository. All of the data are publically available. Data are available on request.

Conflicts of Interest

The authors declare no conflict of interest.

References

  1. Regional Action Plan on Healthy Ageing in the Western Pacific. Available online: https://www.who.int/publications/i/item/9789290619352 (accessed on 2 September 2021).
  2. United Nations Department of Economic and Social Affairs. World Population Prospects: The 2019 Revision; United Nations Department of Economic and Social Affairs, Population Division: New York, NY, USA, 2019; Available online: https://population.un.org/wpp/ (accessed on 17 September 2021).
  3. World Report on Ageing and Health 2015. Available online: http://apps.who.int/iris/bitstream/handle/10665/186463/9789240694811_eng.pdf;jsessionid=9E053CD8C6E80CC827437CA7B9BADC8F?sequence=1 (accessed on 3 September 2021).
  4. Volkert, D.; Beck, A.M.; Cederholm, T.; Cruz-Jentoft, A.; Goisser, S.; Hooper, L.; Kiesswetter, E.; Maggio, M.; Raynaud-Simon, A.; Sieber, C.C.; et al. ESPEN guideline on clinical nutrition and hydration in geriatrics. Clin. Nutr. 2019, 38, 10–47. [Google Scholar] [CrossRef] [Green Version]
  5. Cederholm, T.; Barazzoni, R.; Austin, P.; Ballmer, P.; Biolo, G.; Bischoff, S.C.; Compher, C.; Correia, I.; Higashiguchi, T.; Holst, M.; et al. ESPEN guidelines on definitions and terminology of clinical nutrition. Clin. Nutr. 2017, 36, 49–64. [Google Scholar] [CrossRef]
  6. Norman, K.; Haβ, U.; Pirlich, M. Malnutrition in older adults–recent advances and remaining challenges. Nutrients 2021, 13, 2764. [Google Scholar] [CrossRef]
  7. Baugreet, S.; Hamill, R.M.; Kerry, J.P.; McCarthy, S.N. Mitigating nutrition and health deficiencies in older adults: A role for food innovation? J. Food Sci. 2017, 82, 848–855. [Google Scholar] [CrossRef] [PubMed] [Green Version]
  8. Yannakoulia, M.; Mamalaki, E.; Anastasiou, C.A.; Mourtzi, N.; Lambrinoudaki, I.; Scarmeas, N. Eating habits and behaviors of older people: Where are we now and where should we go? Maturitas 2018, 114, 14–21. [Google Scholar] [CrossRef] [PubMed]
  9. Leij-Halfwerk, S.; Verwijs, M.H.; van Houdt, S.; Borkent, J.W.; Guaitoli, P.R.; Pelgrim, T.; Heymans, M.W.; Power, L.; Visser, M.; Corish, C.A.; et al. Prevalence of protein-energy malnutrition risk in European older adults in community, residential and hospital settings, according to 22 malnutrition screening tools validated for use in adults >/=65 years: A systematic review and meta-analysis. Maturitas 2019, 126, 80–89. [Google Scholar] [CrossRef] [PubMed]
  10. Crichton, M.; Craven, D.; Mackay, H.; Marx, W.; de van der Schueren, M.; Marshall, S. A systematic review, meta-analysis and meta-regression of the prevalence of protein-energy malnutrition: Associations with geographical region and sex. Age Ageing 2019, 48, 38–48. [Google Scholar] [CrossRef]
  11. Gentile, S.; Lacroix, O.; Durand, A.C.; Cretel, E.; Alazia, M.; Sambuc, R.; Bonin-Guillaume, S. Malnutrition: A highly predictive risk factor of short-term mortality in elderly presenting to the emergency department. J. Nutr. Health Aging 2013, 17, 290–294. [Google Scholar] [CrossRef]
  12. Komici, K.; Vitale, D.F.; Mancini, A.; Bencivenga, L.; Conte, M.; Provenzano, S.; Grieco, F.V.; Visaggi, L.; Ronga, I.; Cittadini, A.; et al. Impact of malnutrition on long-term mortality in elderly patients with acute myocardial infarction. Nutrients 2019, 11, 224. [Google Scholar] [CrossRef] [Green Version]
  13. Söderström, L.; Rosenblad, A.; Thors Adolfsson, E.; Bergkvist, L. Malnutrition is associated with increased mortality in older adults regardless of the cause of death. Br. J. Nutr. 2017, 117, 532–540. [Google Scholar] [CrossRef] [Green Version]
  14. Khalatbari-Soltani, S.; Marques-Vidal, P. The economic cost of hospital malnutrition in Europe; a narrative review. Clin. Nutr. ESPEN 2015, 10, e89–e94. [Google Scholar] [CrossRef] [Green Version]
  15. Yeung, S.S.Y.; Chan, R.S.M.; Kwok, T.; Lee, J.S.W.; Woo, J. Malnutrition according to GLIM criteria and adverse outcomes in community-dwelling Chinese older adults: A prospective analysis. J. Am. Med. Dir. Assoc. 2021, 22, 1953–1959. [Google Scholar] [CrossRef] [PubMed]
  16. Rodriguez-Sánchez, B.; Sulo, S.; Carnicero, J.A.; Rueda, R.; Rodriguez-Mañas, L. Malnutrition prevalence and burden on healthcare resource use among Spanish community-living older adults: Results of a longitudinal analysis. Clin. Outcomes Res. 2020, 12, 355–367. [Google Scholar] [CrossRef] [PubMed]
  17. GBD 2019 Diseases and Injuries Collaborators. Global burden of 369 diseases and injuries in 204 countries and territories, 1990–2019: A systematic analysis for the Global Burden of Disease Study 2019. Lancet 2020, 396, 1204–1222. [Google Scholar] [CrossRef]
  18. Peng, W.; Berry, E.M. Global nutrition 1990–1995: A shrinking hungry, and expanding fat world. PLoS ONE 2019, 13, e0194821. [Google Scholar] [CrossRef] [Green Version]
  19. Ong, S.; Woo, J.; Parikh, P.; Chan, R.; Jianqin, S.; Mun, C.Y.; Wee, S.L.; Thu, N.N.; Thang, P.; Setiati, S.; et al. Addressing nutritional requirements of ageing consumers in Asia—Recommendations from an expert workshop. Asia Pac. J. Clin. Nutr. 2019, 28, 204–213. [Google Scholar] [CrossRef]
  20. World Bank Country and Lending Groups. Available online: https://datahelpdesk.worldbank.org/knowledgebase/articles/906519 (accessed on 2 September 2021).
  21. Global Burden of Disease (GBD). Available online: http://www.healthdata.org/gbd/2019 (accessed on 2 September 2021).
  22. GBD 2019 Demographics Collaborators. Global age-sex-specific fertility, mortality, healthy life expectancy (HALE), and population estimates in 204 countries and territories, 1950-2019: A comprehensive demographic analysis for the Global Burden of Disease Study 2019. Lancet 2020, 396, 1160–1203. [Google Scholar] [CrossRef]
  23. GBD 2019 Risk Factor Collaborators. Global burden of 87 risk factors in 204 countries and territories, 1990–2019: A systematic analysis for the Global Burden of Disease Study 2019. Lancet 2020, 396, 1223–1249. [Google Scholar] [CrossRef]
  24. Kim, H.J.; Fay, M.P.; Feuer, E.J.; Midthune, D.N. Permutation tests for joinpoint regression with applications to cancer rates. Stat. Med. 2000, 19, 335–351. [Google Scholar] [CrossRef]
  25. Brownie, S.; Muggleston, H.; Oliver, C. The 2013 Australian dietary guidelines and recommendations for older Australians. Aust. Fam. Physician 2015, 44, 311–315. [Google Scholar]
  26. Singapore Standards Council. Guidelines on Nutrition and Food Service for Older Adults, 1st ed.; Enterprise Singapore: Singapore, 2015. [Google Scholar]
  27. Ministry of Health. Food and Nutrition Guidelines for Healthy Older People: A Background Paper, 1st ed.; Ministry of Health: Wellington, New Zealand, 2013. [Google Scholar]
  28. Robinson, S.M. Improving nutrition to support healthy ageing: What are the opportunities for intervention? Proc. Nutr. Soc. 2018, 77, 257–264. [Google Scholar] [CrossRef]
  29. Shlisky, J.; Bloom, D.E.; Beaudreault, A.R.; Tucker, K.L.; Keller, H.H.; Freund-Levi, Y.; Fielding, R.A.; Cheng, F.W.; Jensen, G.L.; Wu, D.; et al. Nutritional considerations for healthy aging and reduction in age-related chronic disease. Adv. Nutr. 2017, 8, 17–26. [Google Scholar] [CrossRef] [Green Version]
  30. Saffel-Shrier, S.; Johnson, M.A.; Francis, S.L. Position of the Academy of Nutrition and Dietetics and the Society for Nutrition Education and Behavior: Food and nutrition programs for community-residing older adults. J. Nutr. Educ. Behav. 2019, 51, 781–797. [Google Scholar] [CrossRef]
  31. Dorner, B.; Friedrich, E.K. Position of the Academy of Nutrition and Dietetics: Individualized nutrition approaches for older adults: Long-term care, post-acute care, and other settings. J. Acad. Nutr. Diet. 2018, 118, 724–735. [Google Scholar] [CrossRef] [Green Version]
  32. Volkert, D.; Beck, A.M.; Cederholm, T.; Cereda, E.; Cruz-Jentoft, A.; Goisser, S.; de Groot, L.; Groβhauser, F.; Kiesswetter, E.; Norman, K.; et al. Management of malnutrition in older patients—Current approaches, evidence and open questions. J. Clin. Med. 2019, 8, 974. [Google Scholar] [CrossRef] [PubMed] [Green Version]
  33. Zhu, Y.; Minović, I.; Dekker, L.H.; Eggersdorfer, M.L.; van Zon, S.K.R.; Reijneveld, S.A.; Kootstra-Ros, J.E.; Kema, I.P.; Bakker, S.J.L.; Navis, G.J.; et al. Vitamin status and diet in elderly with low and high socioeconomic status: The Lifelines-MINUTHE Study. Nutrients 2020, 12, 2659. [Google Scholar] [CrossRef]
  34. Nutrition in the Western Pacific. Available online: https://www.who.int/westernpacific/health-topics/nutrition (accessed on 2 September 2021).
  35. Park, H.K. Nutrition policy in South Korea. Asia Pac. J. Clin. Nutr. 2008, 17, 343–345. [Google Scholar] [PubMed]
  36. Nakamura, T. Nutritional policies and dietary guidelines in Japan. Asia Pac. J. Clin. Nutr. 2011, 20, 452–454. [Google Scholar] [PubMed]
  37. Lee, B.L. Dietary guidelines in Singapore. Asia Pac. J. Clin. Nutr. 2011, 20, 472–476. [Google Scholar]
  38. Ministry of Health Malaysia. National Plan of Action for Nutrition of Malaysia III 2016–2025, 1st ed.; National Coordinating Committee on Food and Nutrition: Putrajaya, Malaysia, 2016. [Google Scholar]
  39. Policy—National Nutrition Strategy for 2011–2020, with a Vision toward 2030. Available online: https://extranet.who.int/nutrition/gina/en/node/11519#:~:text=By%20the%20year%202020%2C%20the,and%20obesity%2Foverweight%20will%20be (accessed on 2 September 2021).
  40. Policy—Fiji Plan of Action for Nutrition (FPAN). Available online: https://extranet.who.int/nutrition/gina/en/node/8151 (accessed on 2 September 2021).
  41. Vanuatu National Plan of Action on Food and Nutrition Security. Available online: http://extwprlegs1.fao.org/docs/pdf/van158165.pdf (accessed on 2 September 2021).
  42. Oksuzyan, A.; Singh, P.K.; Christensen, K.; Jasilionis, D. A cross-national study of the gender gap in health among older adults in India and China: Similarities and disparities. Gerontologist 2018, 58, 1156–1165. [Google Scholar] [CrossRef]
  43. McCracken, K.; Phillips, D.R. Global Health: An Introduction to Current and Future Trends, 2nd ed.; Routledge: London, UK, 2007. [Google Scholar]
  44. World Health Organization Western Pacific Region. Advancing Health Through Attention to Gender, Equity and Human Rights: Stories from the Western Pacific Region, 1st ed.; World Health Organization: Manila, Philippines, 2017.
  45. Legato, M.J.; Johnson, A.J.; Manson, J.E. Consideration of sex difference in medicine to improve health care and patient outcomes. JAMA 2016, 316, 1865–1866. [Google Scholar] [CrossRef] [PubMed]
  46. Doblhanmmer, G.; Gumà, J. A Demographic Perspective on Gender, Family and Health in Europe, 1st ed.; Springer International Publishing: Cham, Switzerland, 2018. [Google Scholar]
  47. Graham, A.; D’Andrea, A. Gender and Human Rights in Coastal Fisheries and Aquaculture: A Comparative Analysis of Legislation in Fiji, Kiribati, Samoa, Solomon Islands, Tonga and Vanuatu, 1st ed.; SPC: Noumea, New Caledonia, 2021. [Google Scholar]
  48. World Health Organization Western Pacific Region. Celebrating Women’s Voices in the Western Pacific Region: Leadership, Diversity and Health, 1st ed.; World Health Organization: Geneva, Switzerland, 2021.
Figure 1. Age-specific (A) DALYs, (B) YLD crude rate by both sexes, male, and female, in the Western Pacific region from 1990 to 2019. Note: Points in the Y-axis indicate estimates of the rates per 100,000 population.
Nutrients 13 04421 g001
Figure 2. Boxplots of the average annual percentage change in age-standardized DALYs and YLDs rates attributable to nutritional deficiency among older adults (65+) from 1990 to 2019 in the Western Pacific region.
Nutrients 13 04421 g002
Table 1. Trends in age-standardized DALYs and YLDs rates due to nutritional deficiency among older adults (65+) from 1990 to 2019 in the Western Pacific region.
BurdenSex19902019AAPC
DALYsBoth sexes697.95 (696.03, 699.87)290.95 (290.25, 291.65)−3.0 (−3.8, −2.2)
Males676.66 (673.38, 679.94)314.45 (313.31, 315.59)−2.6 (−2.8, −2.5)
Females721.59 (719.09, 724.09)274.61 (273.71, 275.51)−3.3 (−3.6, −3.0)
YLDsBoth sexes459.03 (457.55, 460.51)195.65 (195.09, 196.21)−2.9 (−3.1, −2.8)
Males401.88 (399.64, 404.12)195.56 (194.70, 196.42)−2.5 (−2.6, −2.3)
Females504.43 (502.41, 506.45)196.49 (195.93, 197.05)−3.2 (−3.3, −3.1)
Data are shown as estimates (95% confidence interval). Abbreviations: DALYs, disability-adjusted life years; YLDs, years lived with disability; AAPC, average annual percentage change.
Table 2. Average annual percentage change in age-standardized DALYs and YLDs rates attributable to nutritional deficiency among older adults (65+) from 1990 to 2019, by country in the Western Pacific region.
BurdenEconomic RegionCountry (in Descending Order of SDI in 2019)Both SexesMaleFemale
DALYsHigh
income
South Korea−5.6 * (−5.8, −5.3)−5.0 * (−5.5, −4.5)−5.9 * (−6.0, −5.8)
Japan−1.2 * (−1.3, −1.2)−0.6 * (−0.7, −0.4)−1.4 * (−1.5, −1.4)
Singapore−3.2 * (−3.2, −3.2)−3.0 * (−3.1, −2.9)−3.3 * (−3.3, −3.3)
New Zealand−1.4 * (−1.7, −1.2)−1.5 * (−1.8, −1.2)−1.4 * (−1.8, −1.1)
Australia−1.0 * (−1.1, −0.9)−1.3 * (−1.4, −1.1)−0.8 (−0.9, −0.8)
Brunei−2.4 * (−2.8, −2.1)−2.1 * (−2.4, −1.7)−2.5 * (−2.7, −2.2)
Cook Islands−1.1 * (−1.2, −0.9)−1.6 * (−1.7, −1.5)−1.1 * (−1.2, −1.0)
Palau−0.9 * (−1.0, −0.9)−1.3 * (−1.5, −1.2)−0.9 * (−1.0, −0.9)
Upper-middle incomeMalaysia−1.9 * (−2.2, −1.6)−1.7 * (−2.0, −1.4)−2.0 * (−2.3, −1.7)
Niue−1.6 * (−1.7, −1.5)−2.1 * (−2.3, −1.9)−1.4 (−1.5, −1.3)
China−3.1 * (−4.3, −1.9)−2.3 * (−2.5, −2.1)−3.6 * (−3.9, −3.4)
Fiji−0.9 * (−1.0, −0.8)−0.8 * (−1.0, −0.7)−0.9 * (−1.2, −0.7)
Samoa−0.9 * (−1.0, −0.8)−1.5 * (−1.7, −1.4)−0.6 * (−0.7, −0.5)
Tonga−0.8 * (−0.9, −0.7)−1.2 * (−1.6, −0.1)−0.8 * (−1.0, −0.6)
Tuvalu−1.8 * (−1.9, −1.8)−2.7 * (−2.8, −2.6)−1.3 * (−1.4, −1.2)
Marshall Islands−1.9 * (−2.1, −1.7)−2.7 * (−3.0, −2.4)−1.1 * (−1.2, −1.1)
Lower-middle incomePhilippines−2.0 * (−2.3, −1.7)−2.1 * (−2.5, −1.8)−2.0 * (−2.4, −1.7)
Nauru−0.9 * (−1.1, −0.8)−1.4 * (−1.5, −1.3)−0.9 * (−1.0, −0.8)
Vietnam−3.4 * (−3.5, −3.3)−4.0 * (−4.2, −3.9)−2.7 * (−2.8, −2.7)
Mongolia−1.7 * (−1.8, −1.6)−1.8 * (−2.0, −1.7)−1.6 * (−1.7, −1.5)
Federated States of Micronesia−1.3 * (−1.4, −1.3)−2.2 * (−2.3, −1.1)−1.2 * (−1.2, −1.1)
Kiribati−1.1 * (−1.1, −1.0)−1.7 * (−1.8, −1.6)−1.0 * (−1.0, −0.9)
Laos−3.6 * (−3.7, −3.5)−4.3 * (−4.5, −4.1)−3.1 * (−3.2, −3.0)
Vanuatu−0.9 * (−1.0, −0.8)−1.5 * (−1.6, −1.4)−0.7 * (−0.8, −0.6)
Cambodia−5.0 * (−5.1, −4.9)−5.9 * (−5.9, −5.8)−4.2 * (−4.3, −4.1)
Solomon Islands−1.1 (−1.3, −1.0)−2.1 * (−2.2, −2.0)−0.8 * (−0.9, −0.8)
Papua New Guinea−1.1 * (−1.3, −0.9)−1.9 * (−2.3, −1.6)−0.6 * (−0.7, −0.5)
YLDsHigh
income
South Korea−5.1 * (−5.3, −5.0)−4.4 * (−4.6, −4.2)−5.5 * (−5.7, −5.4)
Japan−3.0 * (−3.0, −3.0−2.7 * (−2.8, −2.7)−3.1 * (−3.1, −3.1)
Singapore−3.0 * (−3.0, −3.0)−2.7 * (−2.8, −2.7)−3.1 * (−3.1, −3.1)
New Zealand−1.2 * (−1.3, −1.0)−0.9 * (−1.2, −0.6)−1.2 * (−1.3, −1.0)
Australia−0.9 * (−1.0, −0.8)−1.0 * (−1.3, −0.6)−0.8 * (−0.9, −0.7)
Brunei−1.6 * (−1.6, −1.6)−1.6 * (−1.7, −1.6)−1.6 * (−1.7, −1.5)
Cook Islands −0.9 * (−1.0, −0.8)−1.4 * (−1.5, −1.3)−0.9 * (−1.0, −0.8
Palau−0.9 * (−1.0, −0.8−1.3 * (−1.5, −1.1)−0.8 * (−0.9, −0.7)
Upper-middle incomeMalaysia−2.1 * (−2.2, −1.9)−1.7 * (−1.9, −1.5)−2.4 * (−2.5, −2.3)
Niue−1.1 * (−1.3, −1.0)−1.5 * (−1.9, −1.1)−1.0 * (−1.2, −0.8)
China−3.2 * (−3.3, −3.1)−2.6 * (−2.8, −2.4)−3.7 * (−3.8, −3.6)
Fiji0.1 * (0.0, 0.2)0.1 (−0.1, 0.2)−0.1 * (−0.2, −0.1)
Samoa−0.5 * (−0.7, −0.4)−0.8 * (−1.0, −0.6)−0.4 * (−0.6, −0.3)
Tonga−0.4 * (−0.4, −0.3)−1.0 * (−1.3, −0.7)−0.4 * (−0.5, −0.3)
Tuvalu−1.0 * (−1.1, −1.0)−1.5 * (−1.6, −1.4)−0.7 * (−0.8, −0.7)
Marshall Islands−0.8 * (−0.9, −0.7)−0.9 * (−1.0, −0.8)−0.4 * (−0.4, −0.3)
Lower-middle incomePhilippines−1.8 * (−1.8, −1.7)−2.0 * (−2.1, −1.9)−1.7 * (−1.8, −1.7)
Nauru−0.4 * (−0.5, −0.2)−1.1 * (−1.3, −0.9)−0.5 * (−0.5, −0.4)
Vietnam−2.6 * (−2.7, −2.5)−2.5 * (−2.6, −2.3)−2.6 * (−2.6, −2.6)
Mongolia−1.6 * (−1.7, −1.5)−1.7 * (−1.7, −1.6)−1.6 * (−1.7, −1.5)
Federated States of Micronesia−0.7 * (−1.0, −0.4)−1.5 * (−1.7, −1.3)−0.7 * (−0.7, −0.6)
Kiribati−0.3 * (−0.3, −0.2)−0.9 * (−1.0, −0.8)−0.2 * (−0.3, −0.2)
Laos−1.8 * (−1.9, −1.8)−1.9 * (−1.9, −1.8)−1.8 * (−1.9, −1.7)
Vanuatu0.1 * (0.0, 0.2)−0.2 * (−0.4, −0.0)0.0 (−0.0, 0.1)
Cambodia−2.0 * (−2.1, −1.9)−2.1 * (−2.3, −1.9)−2.0 * (−2.1, −1.9)
Solomon Islands−0.2 * (−0.3, −0.1)−0.9 * (−1.0, −0.8)−0.4 * (−0.4, −0.3)
Papua New Guinea−0.3 * (−0.4, −0.2)−0.7 * (−0.8, −0.6)−0.1 * (−0.2, −0.1)
Data are shown as estimates (95% confidence interval); * indicates that the p-value < 0.05. Abbreviations: DALYs, disability-adjusted life years; YLDs, years lived with disability; AAPC, average annual percentage change.
Table 3. Associations of age-standardized DALYs and YLDs attributable to nutritional deficiency with sex and SDI among older adults (65+) from 1990 to 2019 in the Western Pacific region.
BurdenSexMean (95% CI)Spearman Correlation with SDI (95% CI)
DALYsBoth sexes1038.25 (981.45, 1095.05)−0.899 ** (−0.911, −0.883)
Male767.31 (721.45, 823.29)−0.904 ** (−0.913, −0.893)
Female1273.75 (120.8.08, 1345.67)−0.847 ** (−0.867, −0.824)
YLDsBoth sexes503.27 (487.02, 519.52)−0.855 ** (−0.875, −0.830)
Male298.16 (287.41, 310.15)−0.682 ** (−0.729, −0.631)
Female685.92 (661.83, 709.61)−0.844 ** (−0.864, −0.820)
Pooled analyses using data from all years/countries; ** indicates p-value < 0.01. Abbreviations: DALYs, disability-adjusted life years; YLDs, years lived with disability; SDI, social development index.
Table 4. Results of the mixed-effects regression on age-standardized DALYs and YLDs rates attributed to nutritional deficiency on sex, SDI, and sex by SDI, among older adults from 1990 to 2019 in the Western Pacific region.
FactorDALYsYLDs
Sex (Reference = female)−1273.13 (−1417.43, −1128.83)−1095.58 (−1144.96, −1046.19)
SDI−6228.80 (−7144.95, −5312.64)−2303.50 (−2551.79, −2055.20)
Sex × SDI1317.44 (1077.74, 1557.14)1216.17 (1134.13, 1298.20)
Models have controlled for time and country. Data are shown as coefficients (95% confidence interval). Abbreviations: DALYs, disability-adjusted life years; YLDs, years lived with disability; SDI, social development index.
Publisher’s Note: MDPI stays neutral with regard to jurisdictional claims in published maps and institutional affiliations.

