
The Effects of Dietary Pattern on Metabolic Syndrome in Jiangsu Province of China: Based on a Nutrition and Diet Investigation Project in Jiangsu Province

 , ,
, ,  , and
, and 
Abstract
:1. Introduction
2. Methods
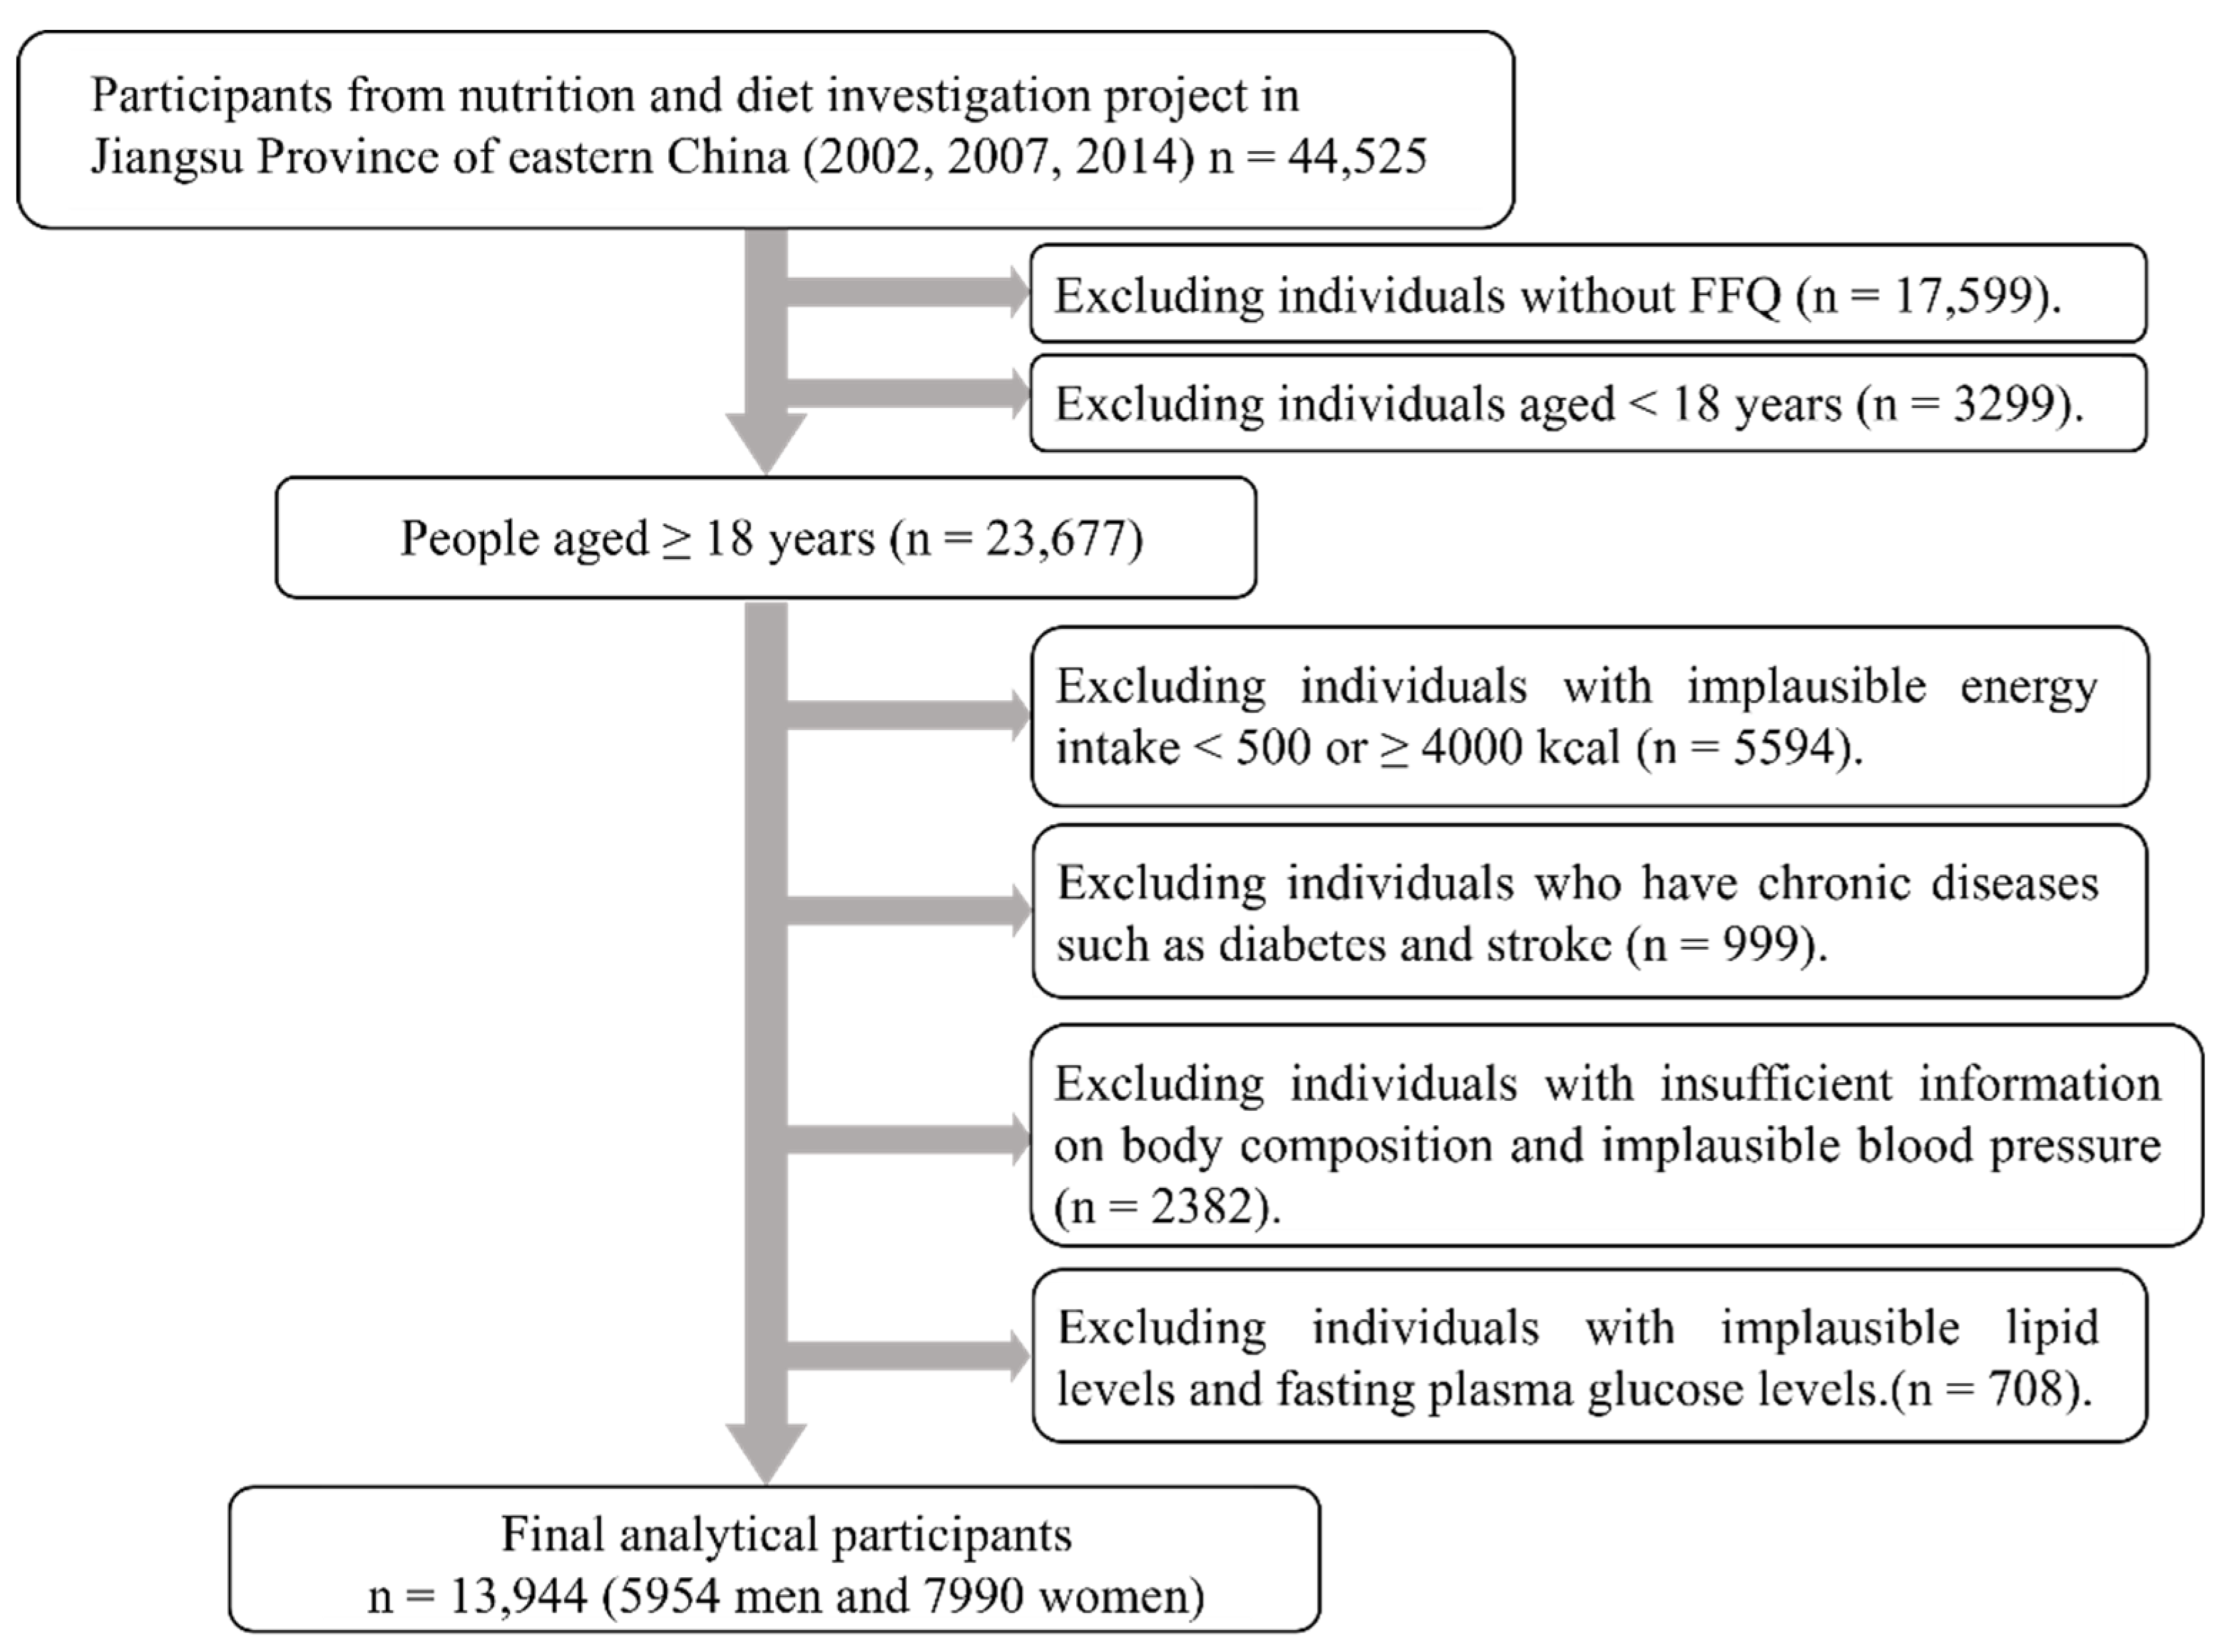
2.1. Study Population
2.2. Demographic and Lifestyle Survey
2.3. Anthropometric Measurements
2.4. Blood Pressure Measurement and Biochemical Indicator
2.5. Definition of Metabolic Syndrome
2.6. Dietary Assessment
2.7. Statistical Analysis
3. Results
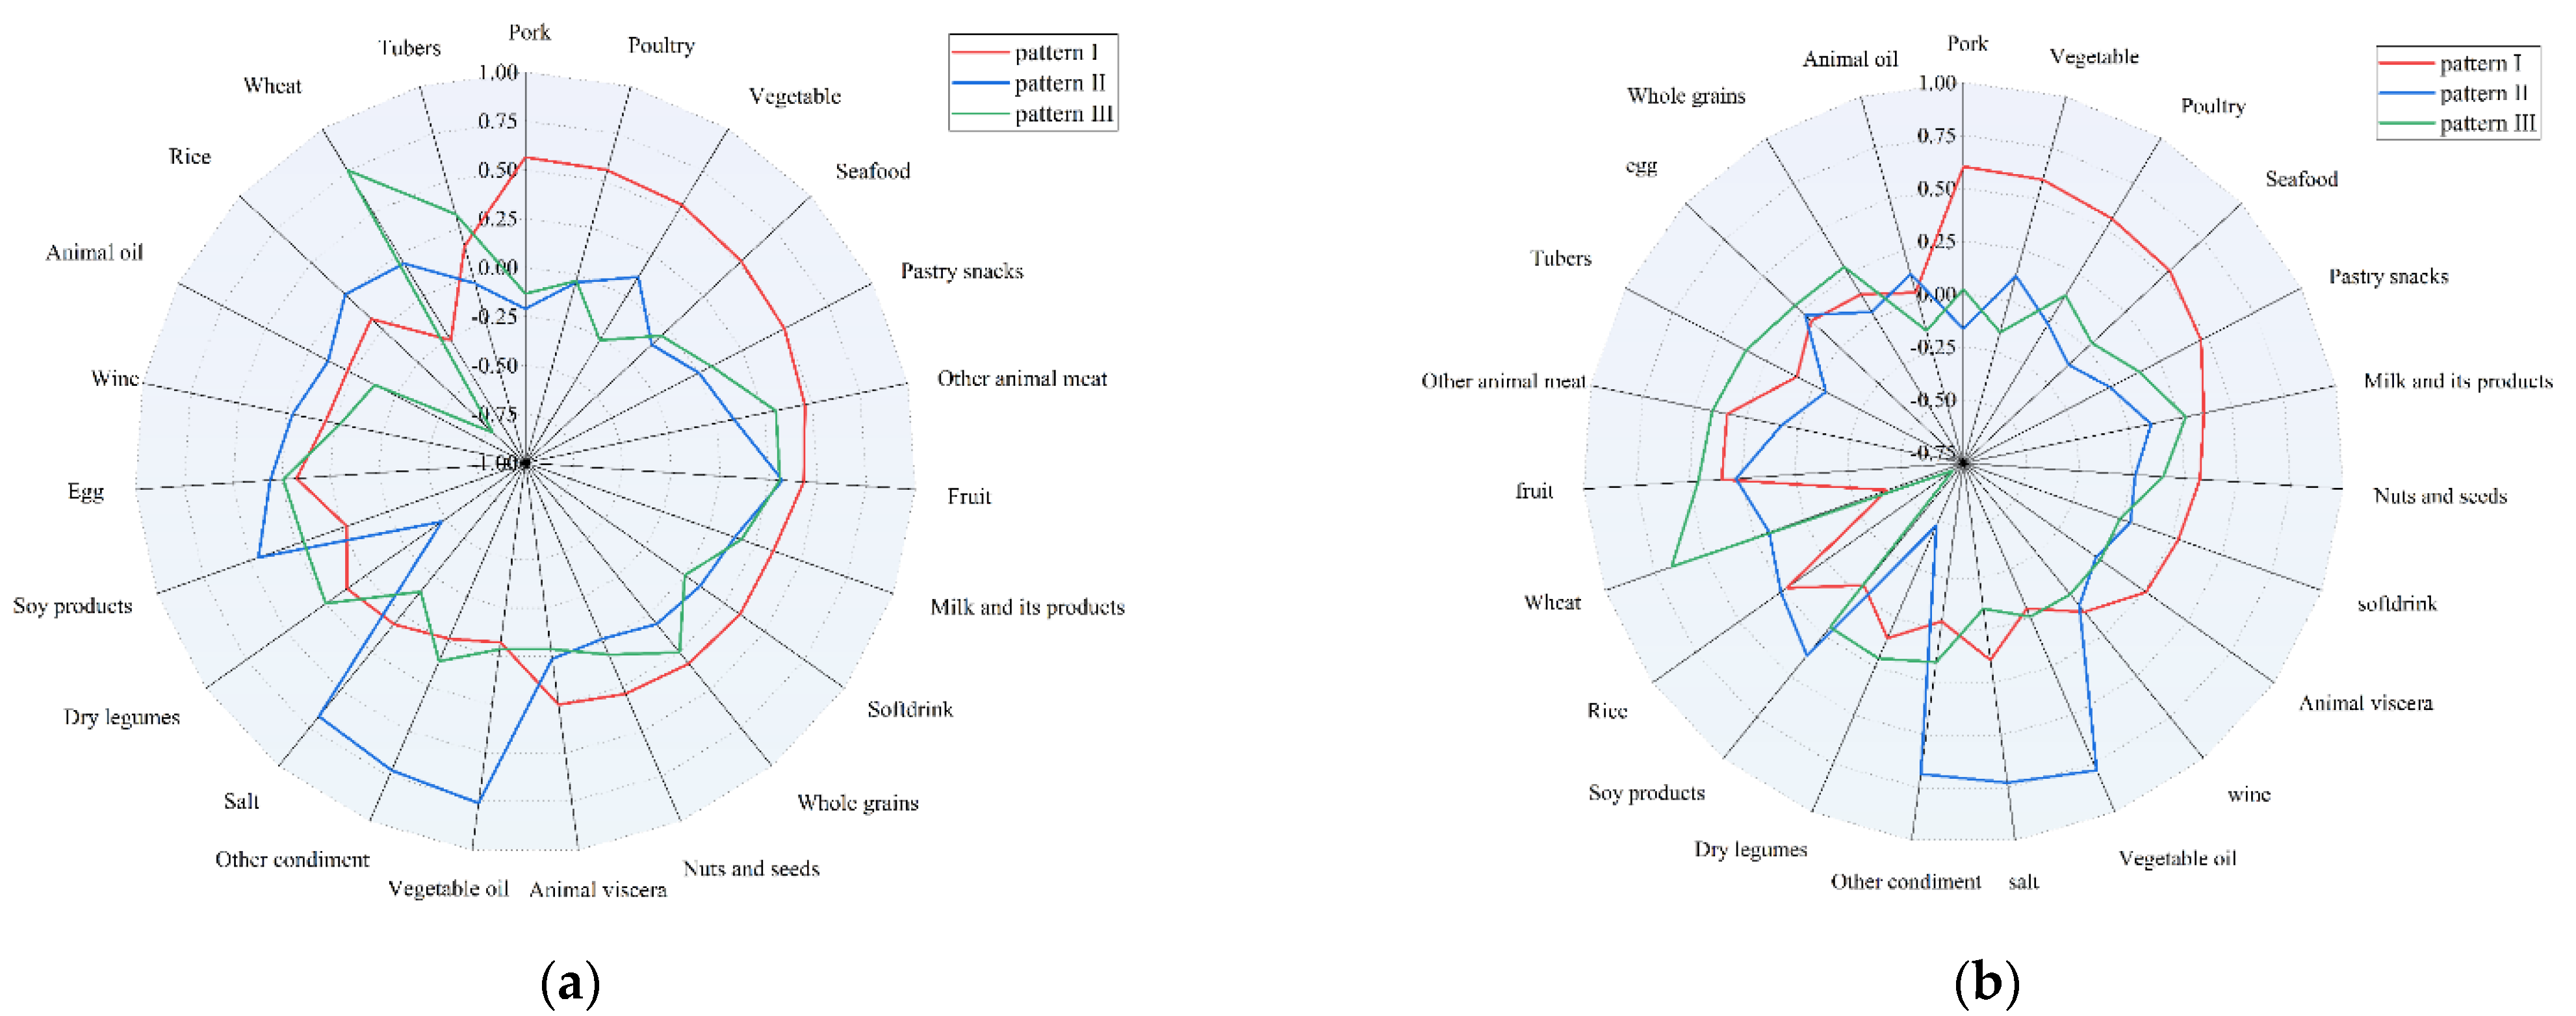
3.1. Determination of Dietary Patterns
3.2. Basic Information of Participants
3.3. Characteristics of the Participants in Dietary Patterns
3.4. Association between Dietary Patterns and Metabolic Syndrome by Gender
4. Discussion
5. Conclusions
Author Contributions
Funding
Institutional Review Board Statement
Informed Consent Statement
Data Availability Statement
Acknowledgments
Conflicts of Interest
References
- McCracken, E.; Monaghan, M.; Sreenivasan, S. Pathophysiology of the metabolic syndrome. Clin. Dermatol 2018, 36, 14–20. [Google Scholar] [CrossRef] [PubMed]
- O’Neill, S.; O’Driscoll, L. Metabolic syndrome: A closer look at the growing epidemic and its associated pathologies. Obes. Rev. 2015, 16, 1–12. [Google Scholar] [CrossRef] [PubMed] [Green Version]
- Saklayen, M.G. The Global Epidemic of the Metabolic Syndrome. Curr. Hypertens Rep. 2018, 20, 12. [Google Scholar] [CrossRef] [Green Version]
- Xu, H.; Li, X.; Adams, H.; Kubena, K.; Guo, S. Etiology of Metabolic Syndrome and Dietary Intervention. Int. J. Mol. Sci. 2018, 20, 128. [Google Scholar] [CrossRef] [PubMed] [Green Version]
- Hirode, G.; Wong, R.J. Trends in the Prevalence of Metabolic Syndrome in the United States, 2011–2016. JAMA 2020, 323, 2526–2528. [Google Scholar] [CrossRef] [PubMed]
- Li, R.; Li, W.; Lun, Z.; Zhang, H.; Sun, Z.; Kanu, J.S.; Qiu, S.; Cheng, Y.; Liu, Y. Prevalence of metabolic syndrome in mainland China: A meta-analysis of published studies. BMC Public Health 2016, 16, 296. [Google Scholar] [CrossRef] [PubMed] [Green Version]
- Song, P.; Yu, J.; Chang, X.; Wang, M.; An, L. Prevalence and Correlates of Metabolic Syndrome in Chinese Children: The China Health and Nutrition Survey. Nutrients 2017, 9, 79. [Google Scholar] [CrossRef] [PubMed] [Green Version]
- Carlson, J.J.; Eisenmann, J.C.; Norman, G.J.; Ortiz, K.A.; Young, P.C. Dietary Fiber and Nutrient Density Are Inversely Associated with the Metabolic Syndrome in US Adolescents. J. Am. Diet. Assoc. 2011, 111, 1688–1695. [Google Scholar] [CrossRef] [PubMed]
- Covas, M.I.; Rafael, D.; Fitó, M. Virgin olive oil: A key food for cardiovascular risk protection. Br. J. Nutr. 2015, 113 (Suppl. 2), S19–S28. [Google Scholar] [CrossRef] [PubMed] [Green Version]
- Chiva-Blanch, G.; Urpi-Sarda, M.; Ros, E.; Valderas-Martinez, P.; Casas, R.; Arranz, S.; Guillén, M.; Lamuela–Raventós, R.M.; Llorach, R.; Andres–Lacueva, C.; et al. Effects of red wine polyphenols and alcohol on glucose metabolism and the lipid profile: A randomized clinical trial. Clin. Nutr. 2013, 32, 200–206. [Google Scholar] [CrossRef] [PubMed]
- Hu, F.B. Dietary pattern analysis: A new direction in nutritional epidemiology. Curr. Opin. Lipidol. 2002, 13, 3–9. [Google Scholar] [CrossRef] [PubMed]
- Chan, R.; Leung, J.; Woo, J. Dietary Patterns and Risk of Frailty in Chinese Community–Dwelling Older People in Hong Kong: A Prospective Cohort Study. Nutrients 2015, 7, 7070–7084. [Google Scholar] [CrossRef] [Green Version]
- Calton, E.K.; James, A.P.; Pannu, P.K.; Soares, M.J. Certain dietary patterns are beneficial for the metabolic syndrome: Reviewing the evidence. Nutr. Res. 2014, 34, 559–568. [Google Scholar] [CrossRef] [PubMed]
- Fabiani, R.; Naldini, G.; Chiavarini, M. Dietary Patterns and Metabolic Syndrome in Adult Subjects: A Systematic Review and Meta–Analysis. Nutrients 2019, 11, 2056. [Google Scholar] [CrossRef] [Green Version]
- Sotos–Prieto, M.; Ortolá, R.; Ruiz–Canela, M.; Garcia-Esquinas, E.; Martínez–Gómez, D.; Lopez–Garcia, E.; Martínez–González, M.Á; Rodriguez-–Artalejo, F. Association between the Mediterranean lifestyle, metabolic syndrome and mortality: A whole–country cohort in Spain. Cardiovasc. Diabetol. 2021, 20, 5. [Google Scholar] [CrossRef]
- Di Daniele, N.; Noce, A.; Vidiri, M.F.; Moriconi, E.; Marrone, G.; Annicchiarico–Petruzzelli, M.; D’Urso, G.; Tesauro, M.; Rovella, V.; De Lorenzo, A. Impact of Mediterranean diet on metabolic syndrome, cancer and longevity. Oncotarget 2017, 8, 8947–8979. [Google Scholar] [CrossRef] [Green Version]
- Hu, X.S.; Guo, Z.R.; Zhou, H.; Shi, Z.M.; Wu, M.; Zhang, J.; Sun, G.X.; Zhou, Z.Y.; Pan, X.Q.; Yao, C.L. Study on the prevalence of metabolic syndrome among 35–74 year–olds in Jiangsu Province. Chin. J. Epidemiol. 2006, 27, 751–756. [Google Scholar]
- Tian, T.; Zhang, J.; Zhu, Q.; Xie, W.; Wang, Y.; Dai, Y. Predicting value of five anthropometric measures in metabolic syndrome among Jiangsu Province, China. BMC Public Health 2020, 20, 1317. [Google Scholar] [CrossRef] [PubMed]
- Zuo, H.; Shi, Z.; Hu, X.; Wu, M.; Guo, Z.; Hussain, A. Prevalence of metabolic syndrome and factors associated with its components in Chinese adults. Metabolism 2009, 58, 1102–1108. [Google Scholar] [CrossRef] [PubMed]
- WHO Expert Committee. Physical status: The use and interpretation of anthropometry. Report of a WHO Expert Committee. World Health Organ. Tech. Rep. Ser. 1995, 854, 1–452. [Google Scholar]
- Zhou, B.F.; Cooperative Meta-Analysis Group of the Working Group on Obesity in China. Predictive values of body mass index and waist circumference for risk factors of certain related diseases in Chinese adults—Study on optimal cut–off points of body mass index and waist circumference in Chinese adults. Biomed. Environ. Sci. 2002, 15, 83–96. [Google Scholar]
- World Health Organization, Guidelines Sub–Committee. International Society of Hypertension Guidelines for the Management of Hypertension. Blood Press. Suppl. 1999, 1, 9–43. [Google Scholar]
- Alberti, K.G.; Eckel, R.H.; Grundy, S.M.; Zimmet, P.Z.; Cleeman, J.I.; Donato, K.A.; Fruchart, J.C.; James, W.P.; Loria, C.M.; Smith, S.C., Jr.; et al. Harmonizing the metabolic syndrome: A joint interim statement of the International Diabetes Federation Task Force on Epidemiology and Prevention; National Heart, Lung, and Blood Institute; American Heart Association; World Heart Federation; International Atherosclerosis Society; and International Association for the Study of Obesity. Circulation 2009, 120, 1640–1645. [Google Scholar]
- Zhao, W.; Hasegawa, K.; Chen, J. The use of food–frequency questionnaires for various purposes in China. Public Health Nutr. 2002, 5, 829–833. [Google Scholar] [CrossRef] [Green Version]
- Wang, S.S.; Lay, S.; Yu, H.N.; Shen, S.R. Dietary Guidelines for Chinese Residents (2016): Comments and comparisons. J. Zhejiang Univ. Sci. B. 2016, 17, 649–656. [Google Scholar] [CrossRef] [PubMed] [Green Version]
- Asghari, G.; Yuzbashian, E.; Mirmiran, P.; Hooshmand, F.; Najafi, R.; Azizi, F. Dietary Approaches to Stop Hypertension (DASH) Dietary Pattern Is Associated with Reduced Incidence of Metabolic Syndrome in Childrenand Adolescents. J. Pediatr 2016, 174, 178–184. [Google Scholar] [CrossRef]
- Drake, I.; Sonestedt, E.; Ericson, U.; Wallström, P.; Orho-Melander, M. A Western dietary pattern is prospectively associated with cardio–metabolic traits and incidence of the metabolic syndrome. Br. J. Nutr. 2018, 119, 1168–1176. [Google Scholar] [CrossRef] [PubMed] [Green Version]
- Xu, X.; Hall, J.; Byles, J.; Shi, Z. Dietary Pattern Is Associated with Obesity in Older People in China: Data from China Health and Nutrition Survey (CHNS). Nutrients 2015, 7, 8170–8188. [Google Scholar] [CrossRef] [PubMed] [Green Version]
- Zhen, S.; Ma, Y.; Zhao, Z.; Yang, X.; Wen, D. Dietary pattern is associated with obesity in Chinese children and adolescents: Data from China Health and Nutrition Survey (CHNS). Nutr. J. 2018, 17, 68. [Google Scholar] [CrossRef] [Green Version]
- Christ, A.; Lauterbach, M.; Latz, E. Western Diet and the Immune System: An Inflammatory Connection. Immunity. 2019, 51, 794–811. [Google Scholar] [CrossRef]
- Narain, A.; Kwok, C.S.; Mamas, M.A. Soft drink intake and the risk of metabolic syndrome: A systematic review and meta–analysis. Int. J. Clin. Pract. 2017, 71, e12927. [Google Scholar] [CrossRef] [PubMed]
- Pan, B.; Ge, L.; Lai, H.; Wang, Q.; Wang, Q.; Zhang, Q.; Yin, M.; Li, S.; Tian, J.; Yang, K.; et al. Association of soft drink and 100% fruit juice consumption with all–cause mortality, cardiovascular diseases mortality, and cancer mortality: A systematic review and dose–response meta–analysis of prospective cohort studies. Crit. Rev. Food Sci. Nutr 2021, 61, 1–12. [Google Scholar] [CrossRef]
- Chen, L.; Liu, R.; Zhao, Y.; Shi, Z. High Consumption of Soft Drinks Is Associated with an Increased Risk of Fracture: A 7–Year Follow–Up Study. Nutrients 2020, 12, 530. [Google Scholar] [CrossRef] [PubMed] [Green Version]
- Njike, V.Y.; Smith, T.M.; Shuval, O.; Shuval, K.; Edshteyn, I.; Kalantari, V.; Yaroch, A.L. Snack Food, Satiety, and Weight. Adv. Nutr. 2016, 7, 866–878. [Google Scholar] [CrossRef] [PubMed] [Green Version]
- Tørris, C.; Molin, M.; Cvancarova Småstuen, M. Fish consumption and its possible preventive role on the development and prevalence of metabolic syndrome—A systematic review. Diabetol. Metab. Syndr. 2014, 6, 112. [Google Scholar] [CrossRef] [PubMed] [Green Version]
- Cheng, M.; Wang, H.; Wang, Z.; Du, W.; Ouyang, Y.; Zhang, B. Relationship between dietary factors and the number of altered metabolic syndrome components in Chinese adults: A cross–sectional study using data from the China Health and Nutrition Survey. BMJ Open 2017, 7, e014911. [Google Scholar] [CrossRef] [Green Version]
- Jiang, J.B.; Lin, L.P.; Li, –Y.D.; Zhen, P.F. Association of three dietary patterns with metabolic syndrome in the middle–aged population in Hangzhou. Prev. Med. 2018, 30, 1222–1225. [Google Scholar]
- Turati, F.; Rossi, M.; Pelucchi, C.; Levi, F.; La Vecchia, C. Fruit and vegetables and cancer risk: A review of southern European studies. Br. J. Nutr. 2015, 113 (Suppl. 2), S102–S110. [Google Scholar] [CrossRef]
- Alissa, E.M.; Ferns, G.A. Dietary fruits and vegetables and cardiovascular diseases risk. Crit. Rev. Food Sci. Nutr. 2017, 57, 1950–1962. [Google Scholar] [CrossRef] [PubMed] [Green Version]
- Kromhout, D.; Spaaij, C.J.; de Goede, J.; Weggemans, R.M. The 2015 Dutch food–based dietary guidelines. Eur. J. Clin. Nutr. 2016, 70, 869–878. [Google Scholar] [CrossRef]
- Batis, C.; Sotres–Alvarez, D.; Gordon–Larsen, P.; Mendez, M.A.; Adair, L.; Popkin, B. Longitudinal analysis of dietary patterns in Chinese adults from 1991 to 2009. Br. J. Nutr. 2014, 111, 1441–1451. [Google Scholar] [CrossRef] [PubMed] [Green Version]
- Batis, C.; Mendez, M.A.; Gordon-Larsen, P.; Sotres-Alvarez, D.; Adair, L.; Popkin, B. Using both principal component analysis and reduced rank regression to study dietary patterns and diabetes in Chinese adults. Public Health Nutr. 2016, 19, 195–203. [Google Scholar] [CrossRef] [PubMed] [Green Version]
- Yu, C.; Shi, Z.; Lv, J.; Guo, Y.; Bian, Z.; Du, H.; Chen, Y.; Tao, R.; Huang, Y.; Chen, J.; et al. Dietary Patterns and Insomnia Symptoms in Chinese Adults: The China Kadoorie Biobank. Nutrients 2017, 9, 232. [Google Scholar] [CrossRef] [PubMed]
- Zuo, H.; Shi, Z.; Yuan, B.; Dai, Y.; Pan, X.; Wu, G.; Hussain, A. Dietary patterns are associated with insulin resistance in Chinese adults without known diabetes. Br. J. Nutr. 2013, 109, 1662–1669. [Google Scholar] [CrossRef] [Green Version]
- Chen, G.C.; Szeto, I.M.; Chen, L.H.; Han, S.F.; Li, Y.J.; van Hekezen, R.; Qin, L.Q. Dairy products consumption and metabolic syndrome in adults: Systematic review and meta–analysis of observational studies. Sci. Rep. 2015, 5, 14606. [Google Scholar] [CrossRef]
- Babio, N.; Becerra-Tomás, N.; Martínez–González, M.Á.; Corella, D.; Estruch, R.; Ros, E.; Sayón-Orea, C.; Fitó, M.; Serra–Majem, L.; Arós, F. Consumption of Yogurt, Low–Fat Milk, and Other Low–Fat Dairy Products Is Associated with Lower Risk of Metabolic Syndrome Incidence in an Elderly Mediterranean Population. J. Nutr. 2015, 145, 2308–2316. [Google Scholar]
- Shin, J.Y.; Xun, P.; Nakamura, Y.; He, K. Egg consumption in relation to risk of cardiovascular disease and diabetes: A systematic review and meta–analysis. Am. J. Clin. Nutr. 2013, 98, 146–159. [Google Scholar] [CrossRef] [Green Version]
- Shin, S.; Lee, H.W.; Kim, C.E.; Lim, J.; Lee, J.K.; Lee, S.A.; Kang, D. Egg Consumption and Risk of Metabolic Syndrome in Korean Adults: Results from the Health Examinees Study. Nutrients 2017, 9, 687. [Google Scholar] [CrossRef] [PubMed]
- Cocores, J.A.; Gold, M.S. The Salted Food Addiction Hypothesis may explain overeating and the obesity epidemic. Med. Hypotheses 2009, 73, 892–899. [Google Scholar] [CrossRef] [PubMed]
- Takase, H.; Machii, M.; Nonaka, D.; Ohno, K.; Dohi, Y. Excessive salt intake is a significant predictor for future development of metabolic syndrome in the general population. Eur. Heart. J. 2020, 41 (Suppl. 2). [Google Scholar] [CrossRef]
- Pilic, L.; Pedlar, C.R.; Mavrommatis, Y. Salt–sensitive hypertension: Mechanisms and effects of dietary and other lifestyle factors. Nutr. Rev. 2016, 74, 645–658. [Google Scholar] [CrossRef] [Green Version]
- Chen, J. Sodium sensitivity of blood pressure in Chinese populations. Curr. Hypertens. Rep. 2010, 12, 127–134. [Google Scholar] [CrossRef] [Green Version]
- Norris, L.E.; Collene, A.L.; Asp, M.L.; Hsu, J.C.; Liu, L.F.; Richardson, J.R.; Li, D.; Bell, D.; Osei, K.; Jackson, R.D.; et al. Comparison of dietary conjugated linoleic acid with safflower oil on body composition in obese postmenopausal women with type 2 diabetes mellitus. Am. J. Clin. Nutr. 2009, 90, 468–476. [Google Scholar] [CrossRef] [PubMed]
- Asp, M.L.; Collene, A.L.; Norris, L.E.; Cole, R.M.; Stout, M.B.; Tang, S.Y.; Hsu, J.C.; Belury, M.A. Time–dependent effects of safflower oil to improve glycemia, inflammation and blood lipids in obese, post–menopausal women with type 2 diabetes: A randomized, double–masked, crossover study. Clin. Nutr. 2011, 30, 443–449. [Google Scholar] [CrossRef] [Green Version]
- Rosqvist, F.; Iggman, D.; Kullberg, J.; Cedernaes, J.; Johansson, H.E.; Larsson, A.; Johansson, L.; Ahlström, H.; Arner, P.; Dahlman, I.; et al. Overfeeding polyunsaturated and saturated fat causes distinct effects on liver and visceral fat accumulation in humans. Diabetes 2014, 63, 2356–2368. [Google Scholar] [CrossRef] [PubMed] [Green Version]
- Julibert, A.; Bibiloni, M.D.M.; Tur, J.A. Dietary fat intake and metabolic syndrome in adults: A systematic review. Nutr. Metab. Cardiovasc. Dis. 2019, 29, 887–905. [Google Scholar] [CrossRef] [PubMed]
- Marangoni, F.; Agostoni, C.; Borghi, C.; Catapano, A.L.; Cena, H.; Ghiselli, A.; La Vecchia, C.; Lercker, G.; Manzato, E.; Pirillo, A.; et al. Dietary linoleic acid and human health: Focus on cardiovascular and cardiometabolic effects. Atherosclerosis 2020, 292, 88–90. [Google Scholar] [CrossRef] [Green Version]
- Molendi–Coste, O.; Legry, V.; Leclercq, I.A. Why and How Meet n–3 PUFA Dietary Recommendations? Gastroenterol Res. Pract. 2011, 2011, 364040. [Google Scholar] [CrossRef] [PubMed] [Green Version]
- Nanri, A.; Mizoue, T.; Takahashi, Y.; Kirii, K.; Inoue, M.; Noda, M.; Tsugane, S. Soy product and isoflavone intakes are associated with a lower risk of type 2 diabetes in overweight Japanese women. J. Nutr. 2010, 140, 580–586. [Google Scholar] [CrossRef] [PubMed] [Green Version]
- Jun, S.H.; Shin, W.K.; Kim, Y. Association of Soybean Food Intake and Cardiometabolic Syndrome in Korean Women: Korea National Health and Nutrition Examination Survey (2007 to 2011). Diabetes Metab. J. 2020, 44, 143–157. [Google Scholar] [CrossRef]
- Pan, A.; Franco, O.H.; Ye, J.; Demark–Wahnefried, W.; Ye, X.; Yu, Z.; Li, H.; Lin, X. Soy protein intake has sex–specific effects on the risk of metabolic syndrome in middle–aged and elderly Chinese. J. Nutr. 2008, 138, 2413–2421. [Google Scholar] [CrossRef] [PubMed] [Green Version]
- Jenkins, D.J.; Kendall, C.W.; Connelly, P.W.; Jackson, C.J.; Parker, T.; Faulkner, D.; Vidgen, E. Effects of high– and low–isoflavone (phytoestrogen) soy foods on inflammatory biomarkers and proinflammatory cytokines in middle–aged men and women. Metabolism 2002, 51, 919–924. [Google Scholar] [CrossRef] [PubMed]

| Food Group | Example of the Food Group |
|---|---|
| Rice | Rice, rice flour |
| Wheat | noodles, pasta, plain bread |
| Whole grains | Barley, buckwheat, millet, corn |
| Tubers | Sweet potato, potato, Chinese yam, taro |
| Vegetables | Spinach, canola, carrot, spinach, preserved vegetables |
| Soy products | Soybeans, soymilk, tofu |
| Dry legumes | Black beans, red lentils, kidney beans, green beans |
| Fruits | Fresh and canned (no added sugar) fruits |
| Eggs | Whole eggs, yolk, white, preserved eggs |
| Milk and its products | Whole milk, skim milk, flavored milk, cheese, yogurt |
| Poultry | Chicken, duck meat |
| Pork | pork and its products |
| Other animal meat | beef, lamb, and those products |
| Animal viscera | Viscera products of animals |
| Seafood | Fresh fish, dried fish, shellfish, shrimp |
| Nuts and seeds | Sesame, sunflower, peanuts, walnuts, almonds, hazelnuts, pine–nuts |
| Vegetable oils | Soybean oil, peanut oil, sesame oil |
| Animal oils | Butter, lard, sheep oil |
| Salt | Salt |
| Other condiments | Sauce, soy sauce, monosodium glutamate |
| Wine | Beer, rice wine, white wine |
| Soft drink | Fruit or flavored drinks, fruit juice, soft drinks |
| Pastry snacks | Cakes, pancake, mooncake |
| Food Groups | Men | Women | ||||
|---|---|---|---|---|---|---|
| Pattern I | Pattern II | Pattern III | Pattern I | Pattern II | Pattern III | |
| Pork | 0.564 | 0.603 | ||||
| Poultry | 0.556 | 0.553 | ||||
| Vegetables | 0.544 | −0.266 | 0.592 | |||
| Seafood | 0.512 | 0.535 | ||||
| Pastry snacks | 0.494 | 0.466 | ||||
| Other animal meats | 0.462 | 0.310 | 0.341 | 0.414 | ||
| Fruits | 0.429 | 0.319 | 0.306 | 0.347 | 0.279 | 0.458 |
| Milk and its products | 0.348 | 0.362 | 0.275 | |||
| Soft drink | 0.345 | 0.279 | ||||
| Whole grains | 0.325 | 0.286 | ||||
| Nuts and seeds | 0.290 | 0.322 | ||||
| Animal viscera | ||||||
| Vegetable oils | 0.758 | 0.784 | ||||
| Other condiments | 0.717 | 0.684 | ||||
| Salt | 0.673 | 0.727 | ||||
| Dry legumes | −0.477 | −0.479 | ||||
| Soy products | 0.450 | 0.374 | ||||
| Eggs | 0.309 | 0.291 | ||||
| Wine | ||||||
| Animal oils | ||||||
| Rice | 0.262 | −0.773 | −0.739 | |||
| Wheat | −0.266 | 0.753 | –0.418 | 0.666 | ||
| Tubers | 0.322 | 0.359 | ||||
| Tertile of Each Pattern Score | ||||||||
|---|---|---|---|---|---|---|---|---|
| Dietary Pattern | Men | Women | ||||||
| T1 | T2 | T3 | p Value | T1 | T2 | T3 | p Value | |
| Pattern I | ||||||||
| Age (years) | 54.4 ± 15.2 a | 52.3 ± 14.9 | 49.0 ± 15.4 | <0.001 | 52.7 ± 16.0 a | 50.6 ± 14.8 | 48.4 ± 14.5 | <0.001 |
| BMI (kg/m2) | 23.4 ± 3.3 a | 23.6 ± 3.2 | 24.0 ± 3.3 | <0.001 | 24.0 ± 3.6 a | 23.7 ± 3.5 | 23.8 ± 3.6 | 0.007 |
| Energy intake (kcal/d) | 2189.5 ± 618.9 c | 2228.4 ± 653.2 | 2454.5 ± 683.0 | <0.001 | 1939.0 ± 556.4 c | 1968.1 ± 563.8 | 2222.3 ± 598.8 | <0.001 |
| Waist circumference (cm) | 81.6 ± 9.6 a | 82.8 ± 9.5 | 84.6 ± 9.8 | <0.001 | 80.4 ± 10.2 a | 79.4 ± 9.9 | 79.7 ± 10.0 | <0.001 |
| SBP (mm Hg) | 129.3 ± 20.1 | 129.7 ± 19.0 | 128.3 ± 17.6 | 0.061 | 127.3 ± 22.3 a | 126.2 ± 20.6 | 124.6 ± 19.7 | <0.001 |
| DBP (mm Hg) | 82.1 ± 11.4 b | 82.8 ± 10.5 | 82.6 ± 10.4 | 0.088 | 79.9 ± 11.9 c | 79.4 ± 10.2 | 78.6 ± 10.2 | <0.001 |
| TG (mmol/L) | 1.4 ± 1.5 a | 1.6 ± 1.7 | 1.9 ± 2.0 | <0.001 | 1.4 ± 1.1 a | 1.5 ± 1.2 | 1.6 ± 1.3 | <0.001 |
| HDL–C (mmol/L) | 1.3 ± 0.4 | 1.3 ± 0.4 | 1.3 ± 0.4 | 0.879 | 1.3 ± 0.3 a | 1.3 ± 0.3 | 1.3 ± 0.4 | <0.001 |
| FPG (mmol/L) | 5.0 ± 1.1 a | 5.1 ± 1.3 | 5.1 ± 1.2 | <0.001 | 5.0 ± 1.2 | 5.0 ± 1.1 | 5.1 ± 1.1 | 0.019 |
| Education level | <0.001 | <0.001 | ||||||
| Primary school or less | 1130 (47.7) c | 947 (40.0) | 770 (32.5) | 1834 (68.8) c | 1478 (55.5) | 1168 (43.9) | ||
| Junior high school | 891 (37.6) | 981 (41.4) | 1027 (43.4) | 696 (26.1) c | 850 (31.9) | 972 (36.5) | ||
| High school and higher | 349 (14.7) c | 441 (18.6) | 572 (24.1) | 134 (5.0) c | 335 (12.6) | 523 (19.6) | ||
| Physical work | <0.001 | <0.001 | ||||||
| Low physical work | 806 (40.6) c | 968 (48.8) | 1111 (55.9) | 1536 (57.7) | 1508 (56.6) c | 1669 (62.7) | ||
| Middle physical work | 119 (6.0) a | 228 (11.5) | 237 (11.9) | 57 (2.1) c | 154 (5.8) | 186 (7.0) | ||
| High physical work | 780 (39.3) a | 462 (23.3) | 344 (17.3) | 876 (32.9) c | 679 (25.5) | 507 (19.0) | ||
| Other physical work | 279 (14.1) | 326 (16.4) | 294 (14.8) | 195 (7.3) c | 322 (12.1) | 301 (11.3) | ||
| Region | 0.278 | <0.001 | ||||||
| City | 610 (30.7) | 564 (28.4) | 589 (29.7) | 812 (30.5) | 916 (34.4) | 755 (28.4) | ||
| Rural | 1374 (69.3) | 1420 (71.6) | 1397 (70.3) | 1852 (69.5) b | 1747 (65.6) | 1908 (71.6) | ||
| Geographical region | <0.001 | <0.001 | ||||||
| Southern Jiangsu | 672 (33.9) a | 1347 (67.9) | 1447 (72.9) | 682 (25.6) a | 1676 (62.9) | 1926 (72.3) | ||
| Northern Jiangsu | 1312 (66.1) | 637 (32.1) | 539 (27.1) | 1982 (74.4) | 987 (37.1) | 737 (27.7) | ||
| Marital status | <0.001 | <0.001 | ||||||
| Unmarried | 71 (3.6) c | 79 (4.0) | 114 (5.7) | 60 (2.3) c | 58 (2.2) | 90 (3.4) | ||
| Married | 1791 (90.3) | 1813 (91.4) | 1812 (91.2) | 2253 (84.6) c | 2356 (88.5) | 2394 (89.9) | ||
| Divorced | 16 (0.8) | 13 (0.7) | 14 (0.7) | 23 (0.9) | 20 (0.8) | 25 (0.9) | ||
| Widowed | 106 (5.3) c | 79 (4.0) | 46 (2.3) | 328 (12.3) c | 229 (8.6) | 154 (5.8) | ||
| Smoking behavior | 0.007 | 0.126 | ||||||
| No | 974 (49.1) | 887 (44.7) | 972 (48.9) | 2596 (97.4) | 2609 (98.0) | 2616 (98.2) | ||
| Yes | 1010 (50.9) b | 1097 (55.3) | 1014 (51.1) | 70 (2.6) c | 167 (2.0) | 287 (1.8) | ||
| Alcohol consumption | 0.100 | <0.001 | ||||||
| Non–drinker | 1142 (57.6) | 1075 (54.2) | 1113 (56.0) | 2606 (97.8) | 2558 (96.1) | 2544 (95.5) | ||
| Current drinker | 842 (42.4) | 909 (45.8) | 873 (44.0) | 58 (2.2) a | 105 (3.9) | 119 (4.5) | ||
| Pattern II | ||||||||
| Age (years) | 54.1 ± 15.4 a | 52.5 ± 15.2 | 49.2 ± 15.0 | <0.001 | 52.5 ± 15.8 a | 50.0 ± 15.4 | 49.2 ± 14.2 | <0.001 |
| BMI (kg/m2) | 23.8 ± 3.2 c | 23.6 ± 3.3 | 23.5 ± 3.2 | 0.112 | 23.7 ± 3.5 c | 23.8 ± 3.6 | 24.0 ± 3.6 | 0.002 |
| Energy intake (kcal/d) | 1969.0 ± 716.0 a | 2277.1 ± 549.6 | 2626.2 ± 534.8 | <0.001 | 1832.6 ± 669.5 a | 2033.9 ± 508.2 | 2262.7 ± 485.2 | <0.001 |
| Waist circumference (cm) | 84.0 ± 9.9 a | 82.8 ± 9.6 | 82.4 ± 9.5 | <0.001 | 79.9 ± 9.9 | 79.6 ± 10.2 | 79.9 ± 9.9 | 0.473 |
| SBP (mm Hg) | 129.8 ± 17.8 c | 130.0 ± 19.8 | 127.5 ± 19.1 | <0.001 | 126.9 ± 20.2 a | 125.7 ± 21.7 | 125.5 ± 20.9 | 0.034 |
| DBP (mm Hg) | 82.1 ± 10.4 c | 82.7 ± 10.8 | 82.9 ± 11.2 | 0.045 | 79.3 ± 10.5 | 78.7 ± 10.9 c | 79.8 ± 11.1 | 0.002 |
| TG (mmol/L) | 1.9 ± 2.0 a | 1.6 ± 1.6 | 1.4 ± 1.5 | <0.001 | 1.7 ± 1.4 a | 1.5 ± 1.2 | 1.3 ± 1.1 | <0.001 |
| HDL–C (mmol/L) | 1.3 ± 0.4 a | 1.3 ± 0.4 | 1.2 ± 0.4 | <0.001 | 1.3 ± 0.4 a | 1.3 ± 0.3 | 1.2 ± 0.3 | <0.001 |
| FPG (mmol/L) | 5.3 ± 1.4 a | 5.1 ± 1.1 | 4.9 ± 1.1 | <0.001 | 5.2 ± 1.0 a | 5.0 ± 1.0 | 4.9 ± 1.3 | <0.001 |
| Education level | 0.001 | <0.001 | ||||||
| Primary school or less | 770 (38.8) | 833 (42.0) c | 715 (36.0) | 1468 (55.1) c | 1456 (54.7) | 1556 (58.4) | ||
| Junior high school | 816 (41.1) | 795 (40.1) | 837 (42.1) | 813 (30.5) | 864 (32.4) | 841 (31.6) | ||
| High school and higher | 399 (20.1) | 355 (17.9) | 434 (21.9) | 382 (14.3) c | 343 (12.9) | 267 (10.0) | ||
| Physical work | <0.001 | <0.001 | ||||||
| Low physical work | 1011 (50.9) | 935 (47.2) | 939 (47.3) | 1600 (60.1) b | 1502 (56.4) | 1611 (60.5) | ||
| Middle physical work | 212 (10.7) | 197 (9.9) | 175 (8.8) | 144 (5.4) c | 149 (5.6) | 104 (3.9) | ||
| High physical work | 521 (26.2) | 509 (25.7) | 556 (28.0) | 646 (24.3) | 707 (26.5) | 709 (26.6) | ||
| Other physical work | 241 (12.1) b | 342 (17.2) | 316 (15.9) | 273 (10.3) | 305 (11.5) | 240 (9.0) | ||
| Region | <0.001 | <0.001 | ||||||
| City | 498 (25.1) a | 593 (29.9) | 672 (33.8) | 744 (27.9) a | 856 (32.1) | 883 (33.1) | ||
| Rural | 1487 (74.9) | 1390 (70.1) | 1314 (66.2) | 1919 (72.1) | 1807 (67.9) | 1781 (66.9) | ||
| Geographical region | <0.001 | <0.001 | ||||||
| Southern Jiangsu | 1286 (64.8) | 1202 (60.6) | 978 (49.2) | 1703 (64.0) | 1411 (53.0) | 1170 (43.9) | ||
| Northern Jiangsu | 699 (35.2) a | 781 (39.4) | 1008 (50.8) | 960 (36.0) a | 1252 (47.0) | 1494 (56.1) | ||
| Marital status | 0.160 | 0.597 | ||||||
| Unmarried | 81 (4.1) | 73 (3.7) | 110 (5.5) | 57 (2.1) | 80 (3.0) | 71 (2.7) | ||
| Married | 1813 (91.3) | 1816 (91.6) | 1787 (90.0) | 2341 (87.9) | 2322 (87.2) | 2340 (87.8) | ||
| Divorced | 13 (0.7) | 15 (0.8) | 15 (0.8) | 21 (0.8) | 24 (0.9) | 23 (0.9) | ||
| Widowed | 78 (3.9) | 79 (4.0) | 74 (3.7) | 244 (9.2) | 237 (8.9) | 230 (8.6) | ||
| Smoking behavior | <0.001 | 0.032 | ||||||
| No | 991 (49.9) | 992 (50.0) | 850 (42.8) | 2617 (98.3) | 2612 (98.1) | 2592 (97.3) | ||
| Yes | 994 (50.1) c | 991 (50.0) | 1136 (57.2) | 46 (1.7) c | 51 (1.9) | 72 (2.7) | ||
| Alcohol consumption | <0.001 | 0.001 | ||||||
| Non–drinker | 1183 (59.6) | 1153 (58.1) | 994 (50.1) | 2586 (97.1) | 2582 (97.0) | 2540 (95.3) | ||
| Current drinker | 802 (40.4) c | 830 (41.9) | 992 (49.9) | 77 (2.9) c | 81 (3.0) | 124 (4.7) | ||
| Pattern III | ||||||||
| Age (years) | 52 ± 14.2 c | 52.7 ± 15.7 | 51.0 ± 16.0 | 0.002 | 52.2 ± 14.5 c | 51.4 ± 15.5 | 48.1 ± 15.3 | <0.001 |
| BMI (kg/m2) | 23.4 ± 3.2 c | 23.5 ± 3.2 | 24.0 ± 3.3 | <0.001 | 23.7 ± 3.6 c | 23.7 ± 3.5 | 24.2 ± 3.6 | <0.001 |
| Energy intake (kcal/d) | 2492.1 ± 546.2 a | 2047.1 ± 699.1 | 2333.4 ± 654.4 | <0.001 | 2115.7 ± 542.9 b | 1881.0 ± 631.7 | 2132.6 ± 548.9 | <0.001 |
| Waist circumference (cm) | 81.9 ± 9.2 a | 83.0 ± 9.7 | 84.2 ± 10.1 | <0.001 | 79.6 ± 9.7 c | 79.4 ± 9.9 | 80.5 ± 10.4 | <0.001 |
| SBP (mm Hg) | 128.4 ± 18.5 | 129.3 ± 18.2 | 129.6 ± 20.1 | 0.123 | 126.6 ± 20.8 c | 126.6 ± 20.6 | 124.8 ± 21.3 | 0.001 |
| DBP (mm Hg) | 82.0 ± 10.5 c | 82.3 ± 10.2 | 83.3 ± 11.6 | <0.001 | 78.7 ± 10.7 a | 79.5 ± 10.6 | 79.6 ± 11.3 | 0.008 |
| TG (mmol/L) | 1.5 ± 1.7 b | 1.9 ± 1.8 | 1.5 ± 1.7 | <0.001 | 1.4 ± 1.0 b | 1.7 ± 1.4 | 1.4 ± 1.2 | <0.001 |
| HDL–C (mmol/L) | 1.3 ± 0.4 b | 1.3 ± 0.4 | 1.2 ± 0.3 | <0.001 | 1.2 ± 0.3 b | 1.3 ± 0.3 | 1.3 ± 0.3 | <0.001 |
| FPG (mmol/L) | 5.0 ± 1.1 a | 5.2 ± 1.3 | 5.1 ± 1.2 | <0.001 | 5.0 ± 1.1 a | 5.1 ± 1.1 | 5.0 ± 1.2 | <0.001 |
| Education level | <0.001 | <0.001 | ||||||
| Primary school or less | 889 (44.8) a | 713 (35.9) | 716 (36.1) | 1659 (62.3) b | 1369 (51.4) | 1452 (54.5) | ||
| Junior high school | 810 (40.8) | 829 (41.8) | 809 (40.8) | 794 (29.8) | 875 (32.9) | 849 (31.9) | ||
| High school and higher | 285 (14.4) a | 443 (22.3) | 460 (23.2) | 210 (7.9) b | 419 (15.7) | 363 (13.6) | ||
| Physical work | <0.001 | <0.001 | ||||||
| Low physical work | 791 (39.9) b | 1112 (56.0) | 982 (49.5) | 1232 (46.3) a | 1693 (63.6) | 1788 (67.1) | ||
| Middle physical work | 198 (10.0) a | 236 (11.9) | 150 (7.6) | 134 (5.0) | 178 (6.7) c | 85 (3.2) | ||
| High physical work | 618 (31.1) a | 363 (18.3) | 605 (30.5) | 985 (37.0) a | 483 (18.1) | 594 (22.3) | ||
| Other physical work | 377 (19.0) c | 274 (13.8) | 248 (12.5) | 312 (11.7) c | 309 (11.6) | 197 (7.4) | ||
| Region | 0.291 | <0.001 | ||||||
| City | 567 (28.6) | 612 (30.8) | 584 (29.4) | 792 (29.7) c | 725 (27.2) | 966 (36.3) | ||
| Rural | 1417 (71.4) | 1373 (69.2) | 1401 (70.6) | 1871 (70.3) | 1938 (72.8) | 1698 (63.7) | ||
| Geographical region | <0.001 | <0.001 | ||||||
| Southern Jiangsu | 1438 (72.5) | 1538 (77.5) | 490 (24.7) | 1693 (63.6) | 1927 (72.4) | 664 (24.9) | ||
| Northern Jiangsu | 546 (27.5) a | 447 (22.5) | 1495 (75.3) | 970 (36.4) a | 736 (27.6) | 2000 (75.1) | ||
| Marital status | 0.409 | <0.001 | ||||||
| Unmarried | 73 (3.7) | 91 (4.6) | 100 (5.0) | 43 (1.6) | 77 (2.9) | 88 (3.3) | ||
| Married | 1817 (91.6) | 1811 (91.2) | 1788 (90.1) | 2326 (87.3) | 2316 (87.0) | 2361 (88.6) | ||
| Divorced | 13 (0.7) | 14 (0.7) | 16 (0.8) | 17 (0.6) | 23 (0.9) | 28 (1.1) | ||
| Widowed | 81 (4.1) | 69 (3.5) | 81 (4.1) | 277 (10.4) a | 247 (9.3) | 187 (7.0) | ||
| Smoking behavior | <0.001 | <0.001 | ||||||
| No | 888 (44.8) | 926 (46.6) | 1019 (51.3) | 2590 (97.3) | 2612 (98.1) | 2619 (98.3) | ||
| Yes | 1096 (55.2) c | 1059 (53.4) | 966 (48.7) | 73 (2.7) a | 51 (1.9) | 45 (1.7) | ||
| Alcohol consumption | 0.024 | <0.001 | ||||||
| Non–drinker | 1061 (53.5) | 1127 (56.8) | 1142 (57.5) | 2543 (95.5) | 2560 (96.1) | 2605 (97.8) | ||
| Current drinker | 923 (46.5) c | 858 (43.2) | 843 (42.5) | 120 (4.5) c | 103 (3.9) | 59 (2.2) | ||
| Group | Dietary Pattern | Model 1 | Model 2 | Model 3 |
|---|---|---|---|---|
| Men | pattern I | OR (95%CI) | OR (95%CI) | OR (95%CI) |
| T1 | 1.000 | 1.000 | 1.000 | |
| T2 | 1.285 (1.105–1.494) | 1.161 (0.969–1.389) | 1.159 (0.968–1.388) | |
| T3 | 1.678 (1.449–1.943) | 1.533 (1.273–1.845) | 1.530 (1.271–1.842) | |
| pattern II | ||||
| T1 | 1.000 | 1.000 | 1.000 | |
| T2 | 0.769 (0.667–0.887) | 0.829 (0.700–0.983) | 0.829 (0.700–0.983) | |
| T3 | 0.692 (0.598–0.800) | 0.867 (0.720–1.043) | 0.871 (0.723–1.048) | |
| pattern III | ||||
| T1 | 1.000 | 1.000 | 1.000 | |
| T2 | 1.462 (1.262–1.695) | 1.213 (1.014–1.450) | 1.210 (1.012–1.446) | |
| T3 | 1.360 (1.172–1.578) | 1.162 (0.954–1.416) | 1.164 (0.956–1.419) | |
| Women | pattern I | |||
| T1 | 1.000 | 1.000 | 1.000 | |
| T2 | 0.922 (0.821–1.035) | 1.104 (0.956–1.275) | 1.109 (0.960–1.281) | |
| T3 | 0.977 (0.871–1.096) | 1.280 (1.096–1.493) | 1.289 (1.104–1.505) | |
| pattern II | ||||
| T1 | 1.000 | 1.000 | 1.000 | |
| T2 | 0.841 (0.750–0.943) | 0.872 (0.760–1.001) | 0.872 (0.759–1.001) | |
| T3 | 0.818 (0.729–0.918) | 0.860 (0.744–0.994) | 0.863 (0.746–0.997) | |
| pattern III | ||||
| T1 | 1.000 | 1.000 | 1.000 | |
| T2 | 1.086 (0.967–1.220) | 1.005 (0.873–1.158) | 1.006 (0.873–1.158) | |
| T3 | 1.121 (0.999–1.259) | 1.208 (1.034–1.412) | 1.203 (1.030–1.406) |
Publisher’s Note: MDPI stays neutral with regard to jurisdictional claims in published maps and institutional affiliations. |
© 2021 by the authors. Licensee MDPI, Basel, Switzerland. This article is an open access article distributed under the terms and conditions of the Creative Commons Attribution (CC BY) license (https://creativecommons.org/licenses/by/4.0/).
Share and Cite
Wang, Y.; Dai, Y.; Tian, T.; Zhang, J.; Xie, W.; Pan, D.; Xu, D.; Lu, Y.; Wang, S.; Xia, H.; et al. The Effects of Dietary Pattern on Metabolic Syndrome in Jiangsu Province of China: Based on a Nutrition and Diet Investigation Project in Jiangsu Province. Nutrients 2021, 13, 4451. https://doi.org/10.3390/nu13124451
Wang Y, Dai Y, Tian T, Zhang J, Xie W, Pan D, Xu D, Lu Y, Wang S, Xia H, et al. The Effects of Dietary Pattern on Metabolic Syndrome in Jiangsu Province of China: Based on a Nutrition and Diet Investigation Project in Jiangsu Province. Nutrients. 2021; 13(12):4451. https://doi.org/10.3390/nu13124451
Chicago/Turabian StyleWang, Yuanyuan, Yue Dai, Ting Tian, Jingxian Zhang, Wei Xie, Da Pan, Dengfeng Xu, Yifei Lu, Shaokang Wang, Hui Xia, and et al. 2021. "The Effects of Dietary Pattern on Metabolic Syndrome in Jiangsu Province of China: Based on a Nutrition and Diet Investigation Project in Jiangsu Province" Nutrients 13, no. 12: 4451. https://doi.org/10.3390/nu13124451
APA StyleWang, Y., Dai, Y., Tian, T., Zhang, J., Xie, W., Pan, D., Xu, D., Lu, Y., Wang, S., Xia, H., & Sun, G. (2021). The Effects of Dietary Pattern on Metabolic Syndrome in Jiangsu Province of China: Based on a Nutrition and Diet Investigation Project in Jiangsu Province. Nutrients, 13(12), 4451. https://doi.org/10.3390/nu13124451