Abstract
Elderly patients are at risk of malnutrition and need an appropriate assessment of energy requirements. Predictive equations are widely used to estimate resting energy expenditure (REE). In the study, we conducted a systematic review of REE predictive equations in the elderly population and compared them in an experimental population. Studies involving subjects older than 65 years of age that evaluated the performance of a predictive equation vs. a gold standard were included. The retrieved equations were then tested on a sample of 88 elderly subjects enrolled in an Italian nursing home to evaluate the agreement among the estimated REEs. The agreement was assessed using the intraclass correlation coefficient (ICC). A web application, equationer, was developed to calculate all the estimated REEs according to the available variables. The review identified 68 studies (210 different equations). The agreement among the equations in our sample was higher for equations with fewer parameters, especially those that included body weight, ICC = 0.75 (95% CI = 0.69–0.81). There is great heterogeneity among REE estimates. Such differences should be considered and evaluated when estimates are applied to particularly fragile populations since the results have the potential to impact the patient’s overall clinical outcome.
1. Introduction
In the elderly population, malnutrition affects up to 60% of hospitalized patients [1]. Nutritional status, along with aging, is affected by social factors, chronic diseases, physiological changes in body weight, and body composition [2,3]. Malnutrition has multifactorial consequences in older adults. It can lead to a decline in health, with increased episodes of falls [4], vulnerability to infections, and poor wound healing [5]. It also affects functional status, with loss of energy and mobility in daily activities [6].
Moreover, malnutrition affects psychological health by reducing the cognitive state [7], increases morbidity and mortality [8], and has a substantial impact on health care costs [9,10], which is estimated at approximately $15.5 billion in the USA [11]. Quality of life (QoL), the most appropriate endpoint for understanding functional impairments and disabilities, is also compromised in these patients [3,12]. Therefore, to avoid malnutrition and related metabolic stress in frail older adults, the determination of energy needs as part of their daily care is fundamental [13,14].
Daily energy expenditure can vary according to numerous factors, such as age, sex, body composition, clinical condition, and physical activity [15]. Total energy expenditure (TEE) may decrease with aging due to reductions in both the basal metabolic rate (BMR) and physical activity [14], or it can increase due to the rising metabolic turnover and the hypermetabolic effect of fever or medications [16]. Estimated energy requirement (EER), also called energy expenditure estimation (EEE), is an estimation of TEE. BMR, also called basal energy expenditure (BEE), is used to assess energy requirements and contributes to approximately 60–75% of TEE [17]. Since BMR is not easy to measure in daily clinical practice, the resting metabolic rate (RMR), also called resting energy expenditure (REE), is measured [18]. Despite these differences, the terms BMR and RMR are often used interchangeably in the literature [19], as shown in recent reviews [20,21,22]. For simplicity, and as done in previous works, such as ours, we will use the term “resting energy expenditure—REE” in this study and, when appropriate, we will distinguish between the terms.
Indirect calorimetry (IC) [23] and the doubly labeled water method [24] are considered the gold standard methods for estimating energy needs. However, those methods are impractical in daily clinical practice because they are expensive, time-consuming, and require specialized personnel and instrumentation [25]. As a result, several predictive equations have been proposed in the literature to estimate REE. Demographic data (age, sex, ethnicity), anthropometric measurements (height, weight), body composition parameters (fat-free mass, fat mass, organ tissue mass), and, in some cases, specific data (diabetic markers) [17] are the variables most often considered in the proposed equations.
Although they are easy to use, not all the proposed equations may be suitable for each individual, and clinical judgment is still required [15]. Furthermore, the equations have often been validated in a specific population that may have different characteristics than the one being studied [26,27]. The accuracy of these predictive equations is lower in specific populations, such as the elderly population. Validation studies have rarely included older adults, and when included, they were not the main objective of the study [14]. Furthermore, these studies often used variables such as weight (unstandardized for age), which do not adequately explain the change in body composition due to aging.
The purpose of this study is to conduct a systematic review of the REE predictive equations used in the elderly population. We selected only studies that validated their equations against a gold standard (i.e., indirect calorimetry or doubly labeled water). The agreement among the predictive equations retrieved was then evaluated in a sample of elderly patients living in a nursing home. Moreover, to enhance the clinical application of our results, we developed a web application to assist clinicians in choosing the equation that best fits a patient’s available data.
2. Materials and Methods
2.1. Data Sources
The review followed the Preferred Reporting Items for Systematic Reviews and Meta-analyses (PRISMA) guidelines [28]. We conducted a literature review of MEDLINE (via PubMed), Scopus, and Embase. Table 1 presents a summary of the Population, Intervention or exposure, Comparison, Outcomes, and Study design (PICOS) parameters used to define the inclusion and exclusion criteria for this literature review.

Table 1.
Summary of Population, Intervention or exposure, Comparison, Outcomes, and Study design (PICOS).
The last update was made on 1 November 2019. The search terms included in the search string were as follows: “energy intake,” “energy intake/physiology,” “basal metabolism,” “nutritional requirements,” “resting metabolic rate,” “resting energy expenditure,” “metabolism,” “energy metabolism” and the additional terms “predictive equations” and “prediction equations.” For the detailed search strategy, see Table S1 in the Supplementary Material.
2.2. Eligibility Criteria
2.2.1. Types of Study
Only original studies were included in the review. To be defined as original, the study had to (i) validate a new predictive equation compared to a gold standard method (indirect calorimetry or doubly labeled water method) or (ii) validate an existing equation in a population different than the original ones.
2.2.2. Types of Predictive Equations
To be included in the study, predictive equations (i) must have been based on parameters that are measurable in all possible contexts (i.e., body weight or height), that is to say, they should not require the use of specific equipment; (ii) must include mixed-age patients, at least a portion of whom were over 65 years of age; and (iii) must include equations that are currently used in elderly patients, even if elderly patients were not included in the validation study. Equations based solely on children or adolescents, critically ill patients (burn patients, spinal cord injury patients, patients in a coma, patients who are mechanically ventilated), and people being treated for cancer or chronic kidney injury were excluded because they may have specific nutritional needs.
2.3. Data Sources
Figure 1 presents the PRISMA flowchart [28]. The studies were eligible if they had been published in the English, Spanish, or Italian languages, with no limits on the date of publication. Additional sources were sought in the references of all retrieved eligible papers, particularly from reviews.
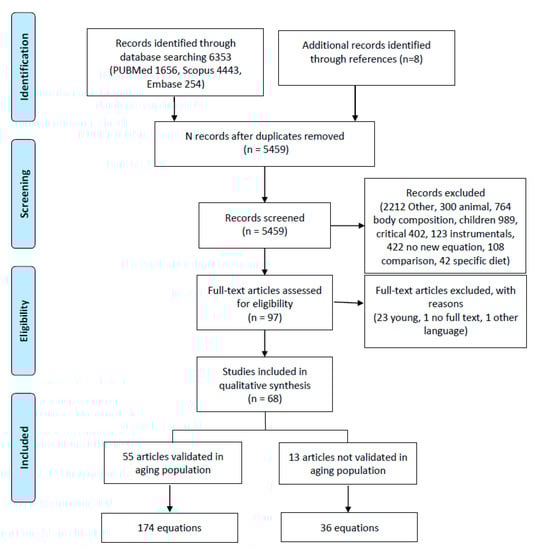
Figure 1.
Flowchart of literature search. This figure was based on the PRISMA example.
2.4. Data Collection
Two independent reviewers screened the title/abstract/full text of the selected records. Then, full texts were retrieved for further assessment. Each assessor independently extracted information from the eligible studies, such as the use of the equation and the characteristics of the sample in which it was applied. Discrepancies were solved through discussion between the two reviewers in each phase of the review; a third author was consulted when the consensus was not achieved.
2.5. Data Extraction
The following key information was extracted from eligible studies and collected in a standard Microsoft Excel sheet: study setting and design, the gold standard used for comparison, study population (number, gender, the presence of disease, body mass index (BMI), age, ethnicity) and predictive equation characteristics (variables in use, agreement with the gold standard). The final data extraction template was modified after reaching consensus in the group based on previous similar work.
2.6. Data Synthesis
The characteristics of each study were summarized in the results. Studies were divided according to the inclusion of elderly adults in the validation population.
2.7. Predictive Equation Testing
Retrieved equations were tested on a convenience sample of 88 subjects older than 65 years old enrolled prospectively in a nursing home in northern Italy. Data were routinely collected from nursing home medical personnel during routine visits. The administration and the medical personnel approved the study through a collaboration protocol with our department (University of Padova). All procedures were conducted in accordance with the Helsinki Declaration of 1975, as revised in 1983.
Patients receiving enteral or parenteral nutrition and those with edema or ascites, neoplasia, or kidney failure were excluded. For each subject, after oral consent was obtained, a qualified dietitian and a nurse collected anthropometric information and other measurements according to the variables retrieved in the equations obtained from the literature review. All the measurements were taken in the morning between 7 and 10 after overnight fasting. Anthropometric characteristics were measured according to international guidelines using calibrated instruments and previously validated standard protocols [29]. BMI was calculated as weight in kilograms divided by height in meters squared and classified as described by NHLBI consensus [30]. The height in centimeters was measured to the nearest 0.50 cm by a stadiometer. For patients who were unable to stand or were bedridden, knee height was used to estimate height. Weight was measured with the patient in minimal clothing on a digital scale to the closest 0.05 kg after overnight fasting. Skinfold thickness was measured using standard calipers, and the median value of three measurements was considered in the analysis. Ambient temperature and humidity were measured with an electronic hygrometer.
2.8. Statistical Methods
Categorical data are reported as relative and absolute frequencies, while continuous data are reported as median and quartiles (I and III). The intraclass correlation coefficient (ICC) was used to evaluate the agreement among the estimated REEs on the convenience sample, with predictive equations as a fixed set of criteria [31]. Equations were grouped as follows for the agreement analysis: (a) equations that consider age; (b) equations that consider gender; (c) equations that consider height; (d) equations that consider weight; (e) equations that consider BMI; (f) equations that consider physical activity; (g) equations that consider more than three variables (three included); (h) equations that include at least one laboratory examination (albumin, glucose level, C reactive protein); (i) equations with at least one measure of the circumference (abdominal circumference, hip circumference, wrist circumference) or that include at least one skinfold measure (chest skinfold, subscapular skinfold); (j) equations including weight and gender; (k) equations with the combination of the variables weight-gender-age; (l) weight-gender-age-height; (m) equations with the combination of the variables weight-gender-age-BMI; and (n) equations with the combination of the variables weight-gender-age-height-BMI equations. For each group, the ICC was determined. The agreement was also determined for BEE-BMR, REE-RMR, and EEE-EER equations since they are representative of different levels of energy requirements. ICC was computed both for the overall sample and for specific subgroups of the sample defined by gender (male/female), obesity (obese/not obese), dysphagia (yes/no), diabetes (yes/no), and Charlson Comorbidity Index (CCI) (≤5, >5). Higher ICCs indicate a higher similarity between values from the same category. The results were reported in forest plots with 95% confidence intervals [CI].
Analyses were performed using R 4.0.2 [32] with the rms [33] and irr [34] packages.
3. Results
3.1. Literature Review Results
3.1.1. Study Selection
In the initial search, 6353 studies were identified (flowchart in Figure 1). In the final review, 68 studies that developed a new regression equation were included.
The retrieved articles were divided into two groups based on the inclusion of elderly adults in the validation population: in the first group, elderly adults were included (55 equations); in the second group, elderly adults were not included in the original sample but the created equations were subsequently used in this population (Table 2).
Table 2.
Predictive equations retrieved by the systematic review. In the table, equations are shown as in the original article (RMR = Resting Metabolic rate, REE = Resting Energy Expenditure, BMR = Basal Metabolic Rate, BEE = Basal Energy Expenditure, 24EE = 24-h energy expenditure). For each equation is reported the formula and characteristics of the population in which is validated and the coefficient of determination (R2). Equations, when not indicated, are expressed in Kcal/day. Continuous variables are reported with mean and standard deviation.
The included studies were predominantly cross-sectional in design (27, 39.7%), and 17 were retrospective (25%). The studies were mainly conducted in healthy patients (N = 36, 53%) in an outpatient setting; only 3 studies were carried out in clinical settings [52,60,69]. Only 19 (28%) studies focused on obese patients [39,41,45,46,55,57,58,60,62,65,76,84,86,90,91,92,93,95,99], and 11 (19.6%) studies focused on a diseased population [49,60,79], such as patients with diabetes [51,56,60,82], oncological diseases [60], rheumatoid arthritis [68], chronic obstructive pulmonary disease (COPD) [70], and heart failure [63].
The studies were carried out in Europe, the USA, South America, and Asia. The participants were prevalently Caucasian [37,38,39,43,45,46,48,49,52,53,59,61,62,66,68,71,72,73,74,75,81,84,85,86,88,89,90,94,95,98]; other groups considered were Chinese [40,63,64,67,100], South American [36,41,78,102], Japanese [50,56,58,82,83], Mexican [65,76,93,97,102], African [21,54,69,73], Indian [96] and Australian [99]. Only ten studies were designed exclusively for elderly patients [37,38,47,49,53,66,72,78,79,102].
3.1.2. Energy Expenditure Assessment
In the retrieved studies, indirect calorimetry was the gold standard most frequently used to measure energy expenditure (55 studies, 62.6%). The most common IC instruments applied were respiratory gas analyzer, metabolic cart and open circuit calorimeter; only one study used a wearable device to assess energy expenditure [74]. Some studies compared their results with other previously validated equations as well as with a gold standard. Twenty-six different predictive equations were used as comparisons with the new equations in the articles retrieved: the most frequently used equations were those of Harris Benedict [21,36,37,38,40,41,45,46,48,49,51,56,60,65,68,70,71,72,73,74,76,78,79,80,84,86,89,90,91,92,94,95,98,100], WHO/FAO/UNU, Schofield [36,37,38,57,60,65,74,80,84,89,98,100,102], Owen [37,38,40,45,46,51,62,65,66,68,74,76,78,79,84,86,89,90,91,92,93,95,98,99], Mifflin [37,38,40,45,46,48,51,62,65,68,72,76,78,79,84,86,89,91,92,93,95,98,99], Fredrix [37,38,49,72], Henry [40,60,82,84], Bernstein [51,60,65,84,85,90,91,92,93,95], and Cunningham [65,68,73,89,91,92].
3.1.3. Equation Characteristics
From the literature review, 210 equations were identified. Of these, 13 were validated in a group of patients that did not include elderly adults, and 174 were validated in the elderly population (Figure 1). The variables considered across the equations can be divided as follows (Table S2): demographic characteristics (age, gender, ethnicity [48,61,98]; menopausal status [37]; smoking [37]; meal status (whether patients had eaten a meal prior to the measurement) [37]); anthropometric measurements (height, weight, BMI [21,49,53,60,71,74,78,82,83,84,94,101]; abdomen [37], hip [51], or wrist circumference [76,101]; arm span [37]; chest skinfold [38] or subscapular skinfold [58]); clinical condition (NYHA [93]; diabetes [55]); physical activity (physical activity [101], leisure time activity [38], athletics [73]); measures of fat percentage (lean body mass [43], surface area [39,81,100]); laboratory tests (glycemia [51,93], albumin [93], C reactive protein [68]); environmental measures (temperature [75,101], humidity [101], time [48]); and vital parameters (body temperature, heart rate and blood pressure [48]). The most commonly used variables were age (147, 70%), gender (166, 79%), weight (183, 87%), and height (86, 41%). BMI was considered in 5 studies (28, 13%).
3.1.4. Precision and Agreement among Equations
Since our review did not evaluate an intervention or a diagnostic tool but instead examined predictive equations, as in Madden’s previous review [22], we did not use the standard Cochrane tools for bias assessment. Stepwise multiple regression was the algorithm most commonly used to select the included variables in the development of predictive equations. Goodness-of-fit was generally assessed in the articles, mainly with the coefficient of determination R2, which varied from 0.390 [82] to 0.92 [48]. Only 18 of the 210 equations retrieved were cross-validated or validated in a different sample in the validation study [38,40,41,48,55,56,64,68,70,71,76,86,88,91,92,93,98,100].
3.2. Results for the Sample Population
3.2.1. Characteristics of the Sample
The 101 equations were applied to a sample of older adults (27 males and 60 females) living in a nursing home in the Veneto region of Italy. All the equations, except for those that had information that are not available in our sample, were used to compute the REE in our population. For example, the equation of Arciero et al. [38] was not used in our sample since we do not have information regarding leisure time activity. Table 3 presents the descriptive statistics of the sample. The patients had a median age of 74 years, were mostly sedentary (39%, 34) or low activity (18%, 16), had diabetes (75%, 64), and had dysphagia (51%, 44). Table S3 provides the estimated REE for each equation by gender.
Table 3.
Descriptive characteristics of the sample. Categorical data are reported as relative and absolute frequencies; continuous data as median, I, and III quartiles.
3.2.2. Equation Agreement Testing in the Sample Population
Figure 2 reports the ICC of the overall sample, with a higher ICC indicating greater agreement between the estimated REEs. The equations that showed the greatest agreement in the overall population were those that considered laboratory examinations (ICC = 0.81 (95% CI = 0.72–0.87) and weight (ICC = 0.75 (95% CI = 0.70–0.81) in their structure. The equations with the poorest agreement were those that considered BMI and physical activity, with ICCs of 0.43 (95% CI = 0.36–0.52) and 0.23 (95% CI = 0.13–0.35), respectively (Figure 2).
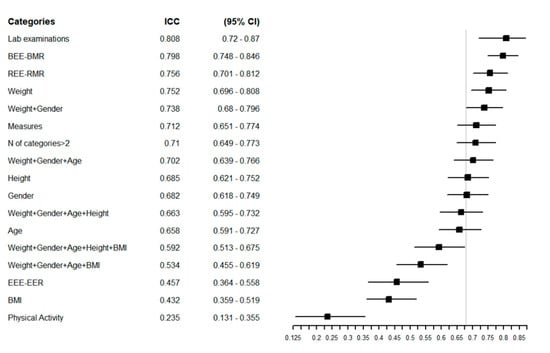
Figure 2.
Forest plot reporting the Intraclass Correlation Coefficient (ICC) with 95% CI of estimated REE in the overall population for each specific group of predictive equations. The vertical grey line represents the ICC in the whole category without any grouping: ICC = 0.68 [0.62–0.75] 95% CI.
Additionally, in males, equations that included laboratory examinations showed a good agreement level (0.94 [(95% CI = 0.87–0.97)]. In examinations of agreement according to gender, females had a higher overall agreement level of 0.67 (95% CI = 0.59–0.75), with a narrow CI (Figure 3).
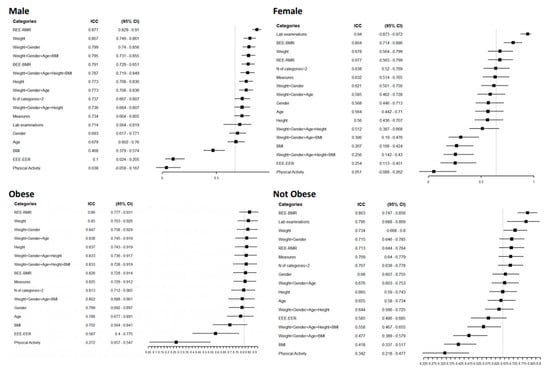
Figure 3.
Forest plot reporting the Intraclass Correlation Coefficient (ICC) with 95% CI of estimated REE according to a specific category of patients for a specific group of predictive equations. The vertical grey line represents the ICC in each category without any grouping: Male ICC 0.64 [0.52–0.77] 95% CI, female 0.67 [0.59–0.75], obese 0.82 [0.72–0.90], normal weight 0.67 [0.59–0.74].
For the obese and normal-weight groups, the overall agreement was higher in the obese group, 0.82 (95% CI = 0.72–0.9), and remained high for all the variables considered except for physical activity, which had an ICC of 0.27 for both groups. Equations that included weight in their structure showed higher agreement in dysphagic and diabetic patients and those with a higher Charlson Comorbidity Index (Figure S1). In these groups, the measurement of circumferences agreed well; in contrast, laboratory examinations performed poorly, especially in nondysphagic patients, with an ICC of 0.04 (95% CI = 0.26–0.33), and people with diabetes (0.02 (95% CI = 0.41–0.44)). In all the categories considered, the equations that included physical activity and BMI in their structure had the worst agreement. For the individual agreement (Figure 3), the groups with lower estimated REE had a reduced CI; for example, females had a 1145 Kcal/day estimated REE (95% CI = 1098–1192).
In the forest plots of the CCI, the agreement was lower in both high risk (CCI ≥ 5) and lower risk patients (CCI < 5); equations that considered weight or weight and gender showed greater agreement (Figure S1). Figure S2 reprts the agreement among predictive equations in terms of Kcal/die at individual level among the categories gender, BMI, Charlson Comorbidity Index, presence/absence of dysphagia and diabetes. In our sample, in the overall group, BMR and REE had a similar level of agreement, 0.80 to 0.76 respectively for BMR and REE, and EEE had an ICC of approximately 0.46 except when gender was considered (Figure S3).
3.3. Web Tool for the Practical Implementation of Equations
In clinical practice, sophisticated instruments such as indirect calorimetry are not always available since they are expensive and require trained personnel [25,103]. This limits their use in daily clinical practice [104]. Furthermore, our results showed that the estimated REE differs according to the equations used. Therefore, a tool is needed to help clinicians estimate REE based on the variables available for the patient. To address this need, we have developed an R Shiny web-based application called equationer, which is freely available at the following link https://r-ubesp.dctv.unipd.it/shiny/equationer/. The app is based on the results of this study. The clinicians, after inputting the patient’s available data, will visualize all the estimated REEs based on the equations that considered the variables imputed in their structure. The results will be displayed both graphically (boxplot and bar plot) and tabularly, thus allowing comparisons of the different results of each equation. In the box plot, the app also provides the minimum, maximum, and median values of the estimated REE. For example, the estimated median BMR for a woman with a weight of 65 kg and an age of 75 years is 1249 Kcal/day (min = 1014 Kcal/day, max = 1449 Kcal/day) and 1352 Kcal/day (min = 1225 Kcal/day, max = 1580 Kcal/day), respectively, depending on whether gender is considered in the predictive equations. The median RMR is 1237 Kcal/day (min = 896 Kcal/day and max = 2003 Kcal/day) and 1325 Kcal/day (min = 1188 Kcal/day, max = 1565 Kcal/day), respectively, in equations that do and do not consider gender, and the overall median is 1271 (min 947 Kcal/day and max = 1943 Kcal/day) in equations that consider gender. RMR and BMR have similar median values, and RMR is slightly lower, especially in terms of the minimum value provided, as expected. RMR has great variability, especially in equations that consider gender, and can vary by as much 1107 Kcal/day, whereas BMR ranges are 434 and 355 in equations that do and do not consider gender, respectively. Adding information about physical activity does not increase the median REE value (1241 Kcal/day) (Figure S4). The number of equations resulting from equationer depends on the selected variables. Selecting a choice for categorical variables like, e.g., gender or ethnicity, will result in a lower number of equations estimated. Conversely, setting a value for numerical variables, like, e.g., height or weight, instead will result in a higher number of equations estimated. Detailed instructions on the utilization of the tool are available in the Supplementary Materials (Text S1).
4. Discussion
Given their characteristics of frailty, elderly adults are at risk of malnutrition; hence, it is important to correctly estimate their caloric intake.
This is the first study, to our knowledge, specifically targeting elderly adults, and predictive equations were chosen if (i) they were created for the elderly population, (ii) if elderly subjects were considered in their original sample, and (iii) if they were not included in the validation sample but were widely used in this population. It is worth noting that several reviews already exist on this topic, but none apply our comprehensive inclusion criteria. We have, in fact, extended the criteria to a broader population and considered variables available in clinical practice, such as weight and height. We excluded only variables derived from the use of technological instruments, such as indirect calorimetry. Gaillard [105] included equations with parameters derived from indirect calorimetry; other studies [14,106,107,108] instead consider the equations most frequently used in clinical contexts, do not include elderly adults as a target [21,26,109,110,111], or were addressed to a more specific population [112,113].
Our review shows that a considerable number of predictive energy equations are available in the literature and that they have high variability in the estimated REE when applied in a real sample (Table S3). This variability could be explained by the fact that the equations were built on a specific population that can have different characteristics from the one in which the equations are used.
Ethnicity has been shown in the literature to influence REE. Our review confirms the results of Compher [114] and shows that this parameter is not widely considered in all equations [115]. However, we were unable to show how differences in ethnicity could affect the estimated REE since our sample included only Caucasians. Equations created for a specific ethnicity, such as for Chinese populations, perform poorly in Caucasian populations, as shown in a recent external validation [20].
The literature reveals that the presence of a specific disease may influence caloric estimation, especially in the elderly. Chronic disease is estimated to affect over 75% of the elderly American population [116] and from 38% to 64% of the Italian population aged from 65 to 69 years, with increased percentages in those over 80 years old [117]. Despite this, in our review, we retrieved only two equations that considered a disease in their structure (diabetes in one case and NYHA classification in the other), even though 11 studies focused on populations with a specific disease.
In the aging population, the physical activity level has a high impact on REE, given the physiological impairments due to aging. Exercise limitations are estimated to increase from 7.7% to 46% in the aging population [117]. In our review, only three equations considered daily living activities. However, adding information about physical activity in our sample worsened the agreement among the equations in the overall sample (ICC = 0.23 (95% CI 0.12–0.35)) (Figure 2) and in all the subgroups considered except patients with diabetes (ICC = 0.48 (95% CI = 0.26–0.70)) (Figure S2). The great variability in physical activity can explain this poor agreement in this population, as can the use of different scores to quantify it.
In our sample, equations that included at least weight or weight and gender yielded a high ICC. In contrast, equations that included variables such as BMI and physical activity had a low agreement in our population for all the considered subgroups.
At the individual level, the agreement was higher in categories that had a lower estimated REE, such as female gender (REE = 1145 Kcal/day (95% CI = 1098–1192)), patients with dysphagia (1173 (95% CI = 115–1231)), normal-weight patients (1179 (95% CI = 1137–1253)) and patients with a Charlson Comorbidity Index higher than 5 (1179 (95% CI = 1115–1231)) (Figure S2). Obese patients have shown high variability in their REE (1364 (95% CI = 1255–1473)), a result in line with those of Bedogni [20], in which equations perform worse with increasing BMI.
Equations that considered the variable age in their structure agreed quite well, from a minimum of 0.57 (95% CI = 0.44–0.7) in male patients and a maximum of 0.79 (95% CI = 0.68–0.90) in obese patients.
BEE-BMR estimation equations agreed better in all the subgroups except for dysphagic patients, where REE-RMR estimation equations were in higher agreement. This could be explained by the fact that the conditions for evaluating BMR were stricter than those for measuring REE in the validation study. Moreover, the EEE-EER equations, which included information on physical activity, showed low agreement in all the subgroups, perhaps because they used different classifications of physical activity.
The female subgroup had a higher level of agreement than the male subgroup. In the example given above for females, the median value changed little (by approximately 100 kcal). At the same time, the minimum and maximum varied up to 1107 when the gender information was included in the structure of the equation. When the same parameter was used for a male person, instead, the median value changed less, and the differences between minimum and maximum for both RMR and BMR were lower, with the highest value produced by equations that included gender (651 Kcal in BMR and 608 in RMR).
The web-based tool derived from this study provides information about the variability of the estimated REEs, which can be viewed easily in the table, the boxplot, and the bar plot. With this information, the clinician can choose the ones most suitable for a patient according to his or her characteristics. The app also provides the minimum, maximum, and median values of REE. At this point, the clinician can choose whether to use the value from a single equation after consulting the original study or to use the median estimated REE, since this seems to be the value that reduces the error best, as shown in previous studies [20,118].
Limitations
This study does not permit a direct comparison of the retrieved studies due to their substantial differences in the statistical measures used and the different populations considered.
The decision to exclude equations based on body composition parameters could bias the results since fat-free mass is considered a good predictor of REE, especially in elderly people.
The inclusion of equations that had only a minority of older adults in the original sample could reduce the validity of their applicability in older adults, although these equations are used for these populations, and some are even widely used in clinical settings.
The agreement among the equations was evaluated in a small sample with specific characteristics, namely, the prevalence of females and diabetic patients. Therefore, our results are not generalizable to the whole Italian population. It would be useful to repeat the agreement analysis in a large sample and to use a gold standard measure.
Finally, our study considered only Caucasian subjects, although some of the equations were validated in patients of different ethnicities.
5. Conclusions
This study provides (i) a relevant examination of the use of predictive equations for elderly adults, (ii) apply the retrieved equations in a convenience sample, and (iii) provide a web application to help the clinician in the choice of the equations to use.
Equations retrieved by this literature review are numerous, consider different variables in their structure, and provide different estimates from one another. Because of the different estimated REEs, that result, choosing one equation over another remains challenging.
The most interesting findings in our work were that in our population, (i) the equations with the highest agreement were those with fewer variables, and (ii) adding information about physical activity and BMI did not increase the agreement among the equations. Since equations with more information reduced the agreement among the equations in our sample, we could suggest avoiding the use of equations that include many variables in their structure, especially for potentially fragile patients, such as those in our sample, for whom all measurements are not usually available. Equations retrieved were usually derived from a specific population; adding variables imply adding coefficient explains the variability of that specific population. This could be the reason why equations with fewer variables showed a higher level of agreement in our population. However, these results must be confirmed by further studies with a broader and more comprehensive sample.
This study was the basis for the development of an easy-to-use tool to guide clinicians in identifying the most appropriate equation for estimating REE based on the subject’s characteristics. The tool allows clinicians to view all the available equations given the characteristics that were entered and to choose the most appropriate equation for the patient. If in doubt, the clinician can use the median value, which is also provided by our tool.
The determination of the exact energy requirements in this population is only the first step in avoiding nutritional problems such as malnutrition and obesity. This vulnerable population requires an overall assessment of nutritional conditions based on the quantification of biomarkers, which is the most objective and unbiased way to assess the intake of particular diet components [119] in addition to appetite evaluation [120] and the use of screening protocols [121].
Supplementary Materials
The following are available online at https://www.mdpi.com/2072-6643/13/2/458/s1, Table S1: Search strategy in Medline, Scopus, and Embase, Table S2: Variables reported in retrieved equations grouped in homogeneous categories. For each variable is reported the frequency of utilization in the equations both in equations validated in elderly and young population, Table S3: Estimated BMR, RMR, and EEE for each equation according to gender in the patients of the nursing home. Variables considered in the structure of the equations and I, II, and III quartiles are showed for each equation, Figure S1: Forest plots reporting the Intraclass Correlation Coefficient (ICC) with 95% CI of estimated REE according to the category of patients that were not considered in predictive equations for specific groups of predictive equations. The vertical grey line represents the ICC in each category without any grouping, Figure S2: Agreement among predictive equations in terms of Kcal/day at the individual level among the categories gender, BMI, Charlson Comorbidity Index, presence/absence of dysphagia, and diabetes. For each category is reported the median estimated REE at 95% CI considering all the predictive equations, Figure S3: ICC among BMR, RMR, and EEE with 95% CI for all predictive equations, Figure S4: Example of plots visualized in the shiny app Equationer in a female of 65 kg and 75 years at first as BMR, in the second plot as RMR and in the third with information on physical activity. The graphics in red included the information on gender; in grey are equations that do not distinguish between males and females, Text S1: Instructions for the use of the web-application.
Author Contributions
Conceptualization, D.G.; methodology, D.G. and G.L.; software, C.L.; formal analysis, D.A.; resources, D.R. and S.G.; data curation, H.O., and M.C.; writing—original draft preparation, H.O.; writing—review and editing, R.S., L.V., G.P., C.E.G., and G.L.; visualization, H.O., and D.A.; supervision, D.G. All authors have read and agreed to the published version of the manuscript.
Funding
This research received no external funding.
Institutional Review Board Statement
Ethical review and approval were waived for this study due to a collaboration protocol with our department (University of Padova) and the administration of the institution. All procedures were conducted in accordance with the Helsinki Declaration of 1975.
Informed Consent Statement
Informed consent was obtained from all subjects involved in the study.
Data Availability Statement
The data presented in this study are available on request from the corresponding author.
Acknowledgments
We wish to thank the personnel, both including the nurses, administrative personnel, physicians, nursing staff, and physiotherapists, at the nursing home “A. Galvan” of Pontelongo (Padova). We also thank Laura Sansone for entering the data. Preliminary results of this study were presented as a poster in the proceedings of the 2019 American Society for Nutrition congress, https://doi.org/10.1093/cdn/nzz028.P01-002-19.
Conflicts of Interest
The authors declare no conflict of interest.
References
- Sullivan, D.H.; Sun, S.; Walls, R.C.; Kovacevich, D.S. Protein-Energy Undernutrition Among Elderly Hospitalized Patients: A Prospective Study. Nutr. Clin. Pract. 1999, 14, 327–328. [Google Scholar] [CrossRef]
- Ahmed, T.; Haboubi, N. Assessment and management of nutrition in older people and its importance to health. Clin. Interv. Aging 2010, 5, 207–216. [Google Scholar]
- Leslie, W.; Hankey, C. Aging, Nutritional Status and Health. Healthcare 2015, 3, 648–658. [Google Scholar] [CrossRef]
- Neyens, J.; Halfens, R.; Spreeuwenberg, M.; Meijers, J.; Luiking, Y.; Verlaan, G.; Schols, J. Malnutrition is associated with an increased risk of falls and impaired activity in elderly patients in Dutch residential long-term care (LTC): A cross-sectional study. Arch. Gerontol. Geriatr. 2013, 56, 265–269. [Google Scholar] [CrossRef]
- Evans, C. Malnutrition in the Elderly: A Multifactorial Failure to Thrive. Perm. J. 2005, 9, 38–41. [Google Scholar] [CrossRef]
- Naseer, M.; Forssell, H.; Fagerström, C. Malnutrition, functional ability and mortality among older people aged ≥60 years: A 7-year longitudinal study. Eur. J. Clin. Nutr. 2016, 70, 399–404. [Google Scholar] [CrossRef]
- Wells, J.L.; Dumbrell, A.C. Nutrition and Aging: Assessment and Treatment of Compromised Nutritional Status in Frail Elderly Patients. Clin. Interv. Aging 2006, 1, 67–79. [Google Scholar] [CrossRef]
- Veronese, N.; Cereda, E.; Solmi, M.; Fowler, S.A.; Manzato, E.; Maggi, S.; Manu, P.; Abe, E.; Hayashi, K.; Allard, J.P.; et al. Inverse relationship between body mass index and mortality in older nursing home residents: A meta-analysis of 19,538 elderly subjects. Obes. Rev. 2015, 16, 1001–1015. [Google Scholar] [CrossRef]
- Elia, M.; Zellipour, L.; Stratton, R. To screen or not to screen for adult malnutrition? Clin. Nutr. 2005, 24, 867–884. [Google Scholar] [CrossRef]
- Moreira, V.G.; Lourenço, R.A. Prevalence and factors associated with frailty in an older population from the city of Rio de Janeiro, Brazil: The FIBRA-RJ Study. Clinics 2013, 68, 979–985. [Google Scholar] [CrossRef]
- Goates, S.; Du, K.; Braunschweig, C.A.; Arensberg, M.B. Economic Burden of Disease-Associated Malnutrition at the State Level. PLoS ONE 2016, 11, e0161833. [Google Scholar] [CrossRef]
- Drewnowski, A.; Evans, W.J. Nutrition, Physical Activity, and Quality of Life in Older AdultsSummary. J Gerontol. A Biol. Sci. Med. Sci. 2001, 56, 89–94. [Google Scholar] [CrossRef]
- Frankenfield, D.C.; Ashcraft, C.M. Estimating Energy Needs in Nutrition Support Patients. J. Parenter. Enter. Nutr. 2011, 35, 563–570. [Google Scholar] [CrossRef]
- Siervo, M.; Bertoli, S.; Battezzati, A.; Wells, J.C.; Lara, J.; Ferraris, C.; Tagliabue, A. Accuracy of predictive equations for the measurement of resting energy expenditure in older subjects. Clin. Nutr. 2014, 33, 613–619. [Google Scholar] [CrossRef]
- Elizabeth Weekes, C. Controversies in the determination of energy requirements. Proc. Nutr. Soc. 2007, 66, 367–377. [Google Scholar] [CrossRef]
- Leibel, R.L. Changes in Energy Expenditure Resulting from Altered Body Weight. N. Engl. J. Med. 1995, 332, 8. [Google Scholar] [CrossRef]
- Noreik, M.; Maurmann, M.; Meier, V.; Becker, I.; Röhrig, G.; Polidori, M.C.; Schulz, R.-J. Resting energy expenditure (REE) in an old-old population: Implications for metabolic stress. Exp. Gerontol. 2014, 59, 47–50. [Google Scholar] [CrossRef]
- Dionne, I.; Després, J.P.; Bouchard, C.; Tremblay, A. Gender difference in the effect of body composition on energy metabolism. Int. J. Obes. Relat. Metab. Disord. 1999, 23, 312–319. [Google Scholar] [CrossRef]
- Bogardus, C.; Lillioja, S.; Ravussin, E.; Abbott, W.; Zawadzki, J.K.; Young, A.; Knowler, W.C.; Jacobowitz, R.; Moll, P.P. Familial dependence of the resting metabolic rate. N. Engl. J. Med. 1986, 315, 96–100. [Google Scholar] [CrossRef]
- Bedogni, G.; Bertoli, S.; Leone, A.; De Amicis, R.; Lucchetti, E.; Agosti, F.; Marazzi, N.; Battezzati, A.; Sartorio, A. External validation of equations to estimate resting energy expenditure in 14,952 adults with overweight and obesity and 1948 adults with normal weight from Italy. Clin. Nutr. 2019, 38, 457–464. [Google Scholar] [CrossRef]
- Sabounchi, N.S.; Rahmandad, H.; Ammerman, A. Best-fitting prediction equations for basal metabolic rate: Informing obesity interventions in diverse populations. Int. J. Obes. 2013, 37, 1364–1370. [Google Scholar] [CrossRef]
- Madden, A.M.; Mulrooney, H.M.; Shah, S. Estimation of energy expenditure using prediction equations in overweight and obese adults: A systematic review. J. Hum. Nutr. Diet. 2016, 29, 458–476. [Google Scholar] [CrossRef]
- Levine, J.A. Measurement of energy expenditure. Public Health Nutr. 2005, 8, 1123–1132. [Google Scholar] [CrossRef]
- Schoeller, D.A.; van Santen, E. Measurement of energy expenditure in humans by doubly labeled water method. J. Appl. Physiol. Respir. Env. Exerc. Physiol. 1982, 53, 955–959. [Google Scholar] [CrossRef]
- Karlsson, M.; Olsson, E.; Becker, W.; Karlstrom, B.; Cederholm, T.; Sjogren, P. Ability to predict resting energy expenditure with six equations compared to indirect calorimetry in octogenarian men. Exp. Gerontol. 2017, 92, 52–55. [Google Scholar] [CrossRef]
- da Rocha, E.E.M.; Alves, V.G.F.; Silva, M.H.N.; Chiesa, C.A.; da Fonseca, R.B.V. Can measured resting energy expenditure be estimated by formulae in daily clinical nutrition practice? Curr. Opin. Clin. Nutr. Metab. Care 2005, 8, 319–328. [Google Scholar] [CrossRef]
- Parker, E.A.; Feinberg, T.M.; Wappel, S.; Verceles, A.C. Considerations When Using Predictive Equations to Estimate Energy Needs Among Older, Hospitalized Patients: A Narrative Review. Curr. Nutr. Rep. 2017, 6, 102–110. [Google Scholar] [CrossRef]
- Liberati, A.; Altman, D.G.; Tetzlaff, J.; Mulrow, C.; Gøtzsche, P.C.; Ioannidis, J.P.A.; Clarke, M.; Devereaux, P.J.; Kleijnen, J.; Moher, D. The PRISMA statement for reporting systematic reviews and meta-analyses of studies that evaluate healthcare interventions: Explanation and elaboration. BMJ 2009, 339, b2700. [Google Scholar] [CrossRef]
- Gibson, R.S. Nutritional Assessment: A Laboratory Manual; Oxford University Press: Oxford, UK, 1993; ISBN 0-19-508547-7. [Google Scholar]
- National Heart, Lung, Blood Institute; North American Association for the Study of Obesity. Overweight The Practical Guide: Identification, Evaluation, and Treatment of Overweight and Obesity in Adults; NIH Publication: Bethesda, MD, USA, 2000. [Google Scholar]
- Shrout, P.E.; Fleiss, J.L. Intraclass correlations: Uses in assessing rater reliability. Psychol. Bull. 1979, 86, 420–428. [Google Scholar] [CrossRef]
- R Core Team. R: A Language and Environment for Statistical Computing; R Foundation for Statistical Computing: Vienna, Austria, 2020. [Google Scholar]
- Harrell, F.E., Jr. rms: Regression Modeling Strategies; R Package Version 6.0-1; R Foundation for Statistical Computing: Vienna, Austria, 2020. [Google Scholar]
- Gamer, M.; Lemon, J.; Gamer, M.M.; Robinson, A.; Kendall’s, W. Package ‘irr.’ Various Coefficients of Interrater Reliability and Agreement; R Foundation for Statistical Computing: Vienna, Austria, 2012. [Google Scholar]
- Aleman-Mateo, H.; Rush, E.; Esparza-Romero, J.; Ferriolli, E.; Ramirez-Zea, M.; Bour, A.; Yuchingtat, G.; Ndour, R.; Mokhtar, N.; Valencia, M.E.; et al. Prediction of fat-free mass by bioelectrical impedance analysis in older adults from developing countries: A cross-validation study using the deuterium dilution method. J. Nutr. Health Aging 2010, 14, 418–426. [Google Scholar] [CrossRef]
- Anjos, L.A.; Wahrlich, V.; Vasconcellos, M.T. BMR in a Brazilian adult probability sample: The Nutrition, Physical Activity and Health Survey. Public Health Nutr. 2014, 17, 853–860. [Google Scholar] [CrossRef]
- Arciero, P.J.; Goran, M.I.; Gardner, A.M.; Ades, P.A.; Tyzbir, R.S.; Poehlman, E.T. A Practical Equation to Predict Resting Metabolic Rate in Older Females. J. Am. Geriatr. Soc. 1993, 41, 389–395. [Google Scholar] [CrossRef]
- Arciero, P.J.; Goran, M.I.; Gardner, A.W.; Ades, P.A.; Tyzbir, R.S.; Poehlman, E.T. A practical equation to predict resting metabolic rate in older men. Metabolism 1993, 42, 950–957. [Google Scholar] [CrossRef]
- Bernstein, R.S.; Thornton, J.C.; Yang, M.U.; Wang, J.; Redmond, A.M.; Pierson, R.N.; Pi-Sunyer, F.X.; Van Itallie, T.B. Prediction of the resting metabolic rate in obese patients. Am. J. Clin. Nutr. 1983, 37, 595–602. [Google Scholar] [CrossRef]
- Camps, S.G.; Wang, N.X.; Tan, W.S.K.; Henry, C.J. Estimation of basal metabolic rate in Chinese: Are the current prediction equations applicable? Nutr. J. 2016, 15, 79. [Google Scholar] [CrossRef]
- Carrasco, N.F.; Reyes, S.E.; Núñez, B.C.; Riedemann, S.K.; Rimler, S.O.; Sánchez, G.G.; Sarrat, G.G. Measured and predicted resting energy expenditure in obese and non-obese Chilean subjects. A proposal of predictive equations for the Chilean population. Rev. Med. Chile 2002, 130, 51–60. [Google Scholar]
- Cole, T.J.; Henry, C.J.K. The Oxford Brookes basal metabolic rate database—A reanalysis. Public Health Nutr. 2005, 8, 1202–1212. [Google Scholar] [CrossRef]
- Cunningham, J.J. A reanalysis of the factors influencing basal metabolic rate in normal adults. Am. J. Clin. Nutr. 1980, 33, 2372–2374. [Google Scholar] [CrossRef]
- European Communities. Nutrient and Energy Intakes for the European Community; Office for Official Pubblications of the European Communities: Luxembourg, 1993; ISBN 92-826-6409-0. [Google Scholar]
- Frankenfield, D.C. Bias and accuracy of resting metabolic rate equations in non-obese and obese adults. Clin. Nutr. 2013, 32, 976–982. [Google Scholar] [CrossRef]
- Frankenfield, D.C.; Rowe, W.A.; Smith, J.S.; Cooney, R.N. Validation of several established equations for resting metabolic rate in obese and nonobese people. J. Am. Diet. Assoc. 2003, 103, 1152–1159. [Google Scholar] [CrossRef]
- Fredrix, E.W.; Soeters, P.B.; Deerenberg, I.M.; Kester, A.D.; von Meyenfeldt, M.F.; Saris, W.H. Resting and sleeping energy expenditure in the elderly. Eur. J. Clin. Nutr. 1990, 44, 741–747. [Google Scholar] [PubMed]
- Freni, S.C.; Lewis, S.M.; Mayhugh, M.A.; Jairaj, K.; Arani, R.B.; Turturro, A.; Hart, R.W. Improved equations for estimating the resting metabolic rate. Hum. Ecol. Risk Assess. 2000, 6, 1039–1054. [Google Scholar] [CrossRef]
- Gaillard, C.; Alix, E.; Salle, A.; Berrut, G.; Ritz, P. A practical approach to estimate resting energy expenditure in frail elderly people. J. Nutr. Health Aging 2008, 12, 277–280. [Google Scholar] [CrossRef] [PubMed]
- Ganpule, A.A.; Tanaka, S.; Ishikawa-Takata, K.; Tabata, I. Interindividual variability in sleeping metabolic rate in Japanese subjects. Eur. J. Clin. Nutr. 2007, 61, 1256–1261. [Google Scholar] [CrossRef]
- Gougeon, R.; Lamarche, M.; Yale, J.-F.; Venuta, T. The prediction of resting energy expenditure in type 2 diabetes mellitus is improved by factoring for glycemia. Int. J. Obes. Relat. Metab. Disord. 2002, 26, 1547–1552. [Google Scholar] [CrossRef]
- Harris, A.; Benedict, F.G. A biometric study of human basal metabolism. Proc. Natl. Acad. Sci. USA 1918, 4, 370–373. [Google Scholar] [CrossRef]
- Hedayati, K.K.; Dittmar, M. Body circumferences are predictors of weight adjusted resting energy expenditure in older people. J. Nutr. Health Aging 2011, 15, 803–808. [Google Scholar] [CrossRef]
- Henry, C.J.K. Basal metabolic rate studies in humans: Measurement and development of new equations. Public Health Nutr. 2005, 8, 1133–1152. [Google Scholar] [CrossRef]
- Huang, K.C.; Kormas, N.; Steinbeck, K.; Loughnan, G.; Caterson, I.D. Resting metabolic rate in severely obese diabetic and nondiabetic subjects. Obes. Res. 2004, 12, 840–845. [Google Scholar] [CrossRef]
- Ikeda, K.; Fujimoto, S.; Goto, M.; Yamada, C.; Hamasaki, A.; Ida, M.; Nagashima, K.; Shide, K.; Kawamura, T.; Inagaki, N. A new equation to estimate basal energy expenditure of patients with diabetes. Clin. Nutr. 2013, 32, 777–782. [Google Scholar] [CrossRef] [PubMed]
- Institute of Medicine (U.S.) (Ed.) Dietary Reference Intakes for Energy, Carbohydrate, Fiber, Fat, Fatty Acids, Cholesterol, Protein, and Amino Acids; National Academies Press: Washington, DC, USA, 2005; ISBN 978-0-309-08525-0. [Google Scholar]
- Kashiwazaki, H.; Suzuki, T.; Inaoka, T. Postprandial resting metabolic rate and body composition in the moderately obese and normal-weight adult subjects at sitting posture. J. Nutr. Sci. Vitam. 1988, 34, 399–411. [Google Scholar] [CrossRef] [PubMed]
- Korth, O.; Bosy-Westphal, A.; Zschoche, P.; Gluer, C.C.; Heller, M.; Muller, M.J. Influence of methods used in body composition analysis on the prediction of resting energy expenditure. Eur. J. Clin. Nutr. 2007, 61, 582–589. [Google Scholar] [CrossRef] [PubMed]
- Kruizenga, H.M.; Hofsteenge, G.H.; Weijs, P.J.M. Predicting resting energy expenditure in underweight, normal weight, overweight, and obese adult hospital patients. Nutr. Metab. 2016, 13, 1–9. [Google Scholar] [CrossRef] [PubMed]
- Lam, Y.Y.; Redman, L.M.; Smith, S.R.; Bray, G.A.; Greenway, F.L.; Johannsen, D.; Ravussin, E. Determinants of sedentary 24-h energy expenditure: Equations for energy prescription and adjustment in a respiratory chamber. Am. J. Clin. Nutr. 2014, 99, 834–842. [Google Scholar] [CrossRef] [PubMed]
- Lazzer, S.; Bedogni, G.; Lafortuna, C.L.; Marazzi, N.; Busti, C.; Galli, R.; De Col, A.; Agosti, F.; Sartorio, A. Relationship between basal metabolic rate, gender, age, and body composition in 8780 white obese subjects. Obesity 2010, 18, 71–78. [Google Scholar] [CrossRef]
- Leung, R.; Woo, J.; Chan, D.; Tang, N. Validation of prediction equations for basal metabolic rate in chinese subjects. Eur. J. Clin. Nutr. 2000, 54, 551–554. [Google Scholar] [CrossRef][Green Version]
- Liu, H.Y.; Lu, Y.F.; Chen, W.J. Predictive equations for basal metabolic rate in Chinese adults: A cross-validation study. J. Am. Diet Assoc. 1995, 95, 1403–1408. [Google Scholar] [CrossRef]
- Livingston, E.H.; Kohlstadt, I. Simplified resting metabolic rate-predicting formulas for normal-sized and obese individuals. Obes. Res. 2005, 13, 1255–1262. [Google Scholar] [CrossRef]
- Lührmann, P.M.; Herbert, B.M.; Krems, C.; Neuhäuser-Berthold, M. A new equation especially developed for predicting resting metabolic rate in the elderly for easy use in practice. Eur. J. Nutr. 2002, 41, 108–113. [Google Scholar] [CrossRef]
- Lv, Y.; Miao, Y.; Qiao, L.; Liu, Y.; Zhang, X.; Zhang, J.; Zhang, R.; Nan, J.; Chi, F.; Zhang, L.; et al. Development and application of a new equation for estimating energy requirement in metabolic syndrome in a Chinese population. Int. J. Clin. Exp. Med. 2017, 10, 13721–13731. [Google Scholar]
- Metsios, G.S.; Stavropoulos-Kalinoglou, A.; Panoulas, V.F.; Koutedakis, Y.; Nevill, A.M.; Douglas, K.M.J.; Kita, M.; Kitas, G.D. New resting energy expenditure prediction equations for patients with rheumatoid arthritis. Rheumatology 2008, 47, 500–506. [Google Scholar] [CrossRef] [PubMed]
- Mifflin, M.D.; St Jeor, S.T.; Hill, L.A.; Scott, B.J.; Daugherty, S.A.; Koh, Y.O. A new predictive equation for resting energy expenditure in healthy individuals. Am. J. Clin. Nutr. 1990, 51, 241–247. [Google Scholar] [CrossRef] [PubMed]
- Moore, J.A.; Angelillo, V.A. Equations for the prediction of resting energy expenditure in chronic obstructive lung disease. Chest 1988, 94, 1260–1263. [Google Scholar] [CrossRef] [PubMed]
- Muller, M.J.; Bosy-Westphal, A.; Klaus, S.; Kreymann, G.; Luhrmann, P.M.; Neuhauser-Berthold, M.; Noack, R.; Pirke, K.M.; Platte, P.; Selberg, O.; et al. World Health Organization equations have shortcomings for predicting resting energy expenditure in persons from a modern, affluent population: Generation of a new reference standard from a retrospective analysis of a German database of resting energy expenditure. Am. J. Clin. Nutr. 2004, 80, 1379–1390. [Google Scholar] [CrossRef]
- Obisesan, T.O.; Toth, M.J.; Poehlman, E.T. Prediction of resting energy needs in older men with heart failure. Eur. J. Clin. Nutr. 1997, 51, 678–681. [Google Scholar] [CrossRef]
- Owen, O.E. Resting metabolic requirements of men and women. Mayo Clin. Proc. 1988, 63, 503–510. [Google Scholar] [CrossRef]
- Pavlidou, E.; Petridis, D.; Fasoulas, A.; Giaginis, C. Current clinical status on the estimation of energy requirement: Searching for a reliable equation to predict energy requirement in multiple populations. Curr. Nutr. Food Sci. 2018, 14, 375–385. [Google Scholar] [CrossRef]
- Quenouille, M.H. Statistical Studies of Recorded Energy Expenditure of Man; Commonwealth Agricultural Bureaux: Aberdeen, UK, 1951. [Google Scholar]
- Quiroz-Olguin, G.; Serralde-Zuniga, A.E.; Saldana-Morales, M.V.; Gulias-Herrero, A.; Guevara-Cruz, M. Validating an energy expenditure prediction equation in overweight and obese Mexican patients. Nutr. Hosp. 2014, 30, 749–755. [Google Scholar] [CrossRef]
- Schofield, W.N. Predicting basal metabolic rate, new standards and review of previous work. Hum. Nutr. Clin. Nutr. 1985, 39 (Suppl. S1), 5–41. [Google Scholar]
- Segura-Badilla, O.; Kammar-García, A.; Vera-López, O.; Aguilar-Alonso, P.; Lazcano-Hernández, M.; Avila-Sosa, R.; Navarro-Cruz, A.R. Simplified equation for resting energy expenditure in a population of elderly chileans compared to indirect calorimetry. NFS J. 2018, 13, 23–29. [Google Scholar] [CrossRef]
- Silver, H.J.; Wall, R.; Hollingsworth, E.; Pruitt, A.; Shotwell, M.; Simmons, S. Simple kcal/kg formula is comparable to prediction equations for estimating resting energy expenditure in older cognitively impaired long term care residents. J. Nutr. Health Aging 2013, 17, 39–44. [Google Scholar] [CrossRef]
- Sridhar, M.K.; Banham, S.W.; Lean, M.E.J. Predicting resting energy expenditure in patients with musculoskeletal deformities. Clin. Nutr. 1994, 13, 286–290. [Google Scholar] [CrossRef]
- Staats, B.A.; Gastineau, C.F.; Offord, K.P. Predictive equations for basal caloric requirement derived from the data of Boothby, Berkson, and Dunn. Mayo Clin. Proc. 1988, 63, 409–410. [Google Scholar] [CrossRef]
- Tabata, I.; Ebine, N.; Kawashima, Y.; Ishikawa-Takata, K.; Tanaka, S.; Higuchi, M.; Yoshitake, Y. Dietary reference intakes for Japanese 2010: Energy. J. Nutr. Sci. Vitaminol. 2013, 59, S26–S35. [Google Scholar] [CrossRef]
- Tabata, S.; Kinoshita, N.; Yamada, S.; Matsumoto, H. Accuracy of basal metabolic rate estimated by predictive equations in Japanese with type 2 diabetes. Asia Pac. J. Clin. Nutr. 2018, 27, 763–769. [Google Scholar] [CrossRef]
- Weijs, P.J.M.; Vansant, G.A.A.M. Validity of predictive equations for resting energy expenditure in Belgian normal weight to morbid obese women. Clin. Nutr. 2010, 29, 347–351. [Google Scholar] [CrossRef]
- World Health Organization; Food and Agriculture Organization of the United Nations; United Nations University Energy and Protein Requirements. Report of a Joint FAO/WHO/UNU Expert Consultation; World Health Organization: Geneva, Switzerland, 1985. [Google Scholar]
- Wilms, B.; Schmid, S.M.; Ernst, B.; Thurnheer, M.; Mueller, M.J.; Schultes, B. Poor prediction of resting energy expenditure in obese women by established equations. Metabolism 2010, 59, 1181–1189. [Google Scholar] [CrossRef]
- Xue, J.; Li, S.; Zhang, Y.; Hong, P. Accuracy of Predictive Resting-Metabolic-Rate Equations in Chinese Mainland Adults. Int. J. Environ. Res. Public Health 2019, 16, 2747. [Google Scholar] [CrossRef]
- de la Cruz Marcos, S.; de Mateo Silleras, B.; Camina Martín, M.A.; Enciso, L.C.; de la Torre, A.M.; Galgani, J.E.; Redondo del Río, M.P. Proposal for a new formula for estimating resting energy expenditure for healthy spanish population. Nutr. Hosp. 2015, 32, 2346–2352. [Google Scholar] [CrossRef]
- De Lorenzo, A.; Tagliabue, A.; Andreoli, A.; Testolin, G.; Comelli, M.; Deurenberg, P. Measured and predicted resting metabolic rate in Italian males and females, aged. Eur. J. Clin. Nutr. 2001, 55, 208–214. [Google Scholar] [CrossRef]
- de Luis, D.A.; Aller, R.; Izaola, O.; Romero, E. Prediction equation of resting energy expenditure in an adult Spanish population of obese adult population. Ann. Nutr. Metab. 2006, 50, 193–196. [Google Scholar] [CrossRef]
- Lazzer, S.; Agosti, F.; Resnik, M.; Marazzi, N.; Mornati, D.; Sartorio, A. Prediction of resting energy expenditure in severely obese Italian males. J. Endocrinol. Investig. 2007, 30, 754–761. [Google Scholar] [CrossRef]
- Lazzer, S.; Agosti, F.; Silvestri, P.; Derumeaux-Burel, H.; Sartorio, A. Prediction of resting energy expenditure in severely obese Italian women. J. Endocrinol. Investig. 2007, 30, 20–27. [Google Scholar] [CrossRef]
- Orozco-Ruiz, X.; Guevara-Cruz, M.; Ontiveros, E.P.; Torres, N.; Medina-Vera, I.; Villanueva-Luna, P.; Lafortuna, C.L.; Prinelli, F.; Tovar, A.R. Development and validation of a new prediction equation for energy expenditure in Mexican adults with overweight and obesity. Faseb. J. 2017, 37, 2198–2205. [Google Scholar] [CrossRef]
- Roza, A.M.; Shizgal, H.M. The Harris Benedict equation reevaluated: Resting energy requirements and the body cell mass. Am. J. Clin. Nutr. 1984, 40, 168–182. [Google Scholar] [CrossRef]
- Siervo, M.; Boschi, V.; Falconi, C. Which REE prediction equation should we use in normal-weight, overweight and obese women? Clin. Nutr. 2003, 22, 193–204. [Google Scholar] [CrossRef]
- Soares, M.J.; Francis, D.G.; Shetty, P.S. Predictive equations for basal metabolic rates of Indian males. Eur. J. Clin. Nutr. 1993, 47, 389–394. [Google Scholar]
- Valencia, M.E.; Moya, S.Y.; McNeill, G.; Haggarty, P. Basal metabolic rate and body fatness of adult men in northern Mexico. Eur. J. Clin. Nutr. 1994, 48, 205–211. [Google Scholar]
- Vander Weg, M.W.; Watson, J.M.; Klesges, R.C.; Eck Clemens, L.H.; Slawson, D.L.; McClanahan, B.S. Development and cross-validation of a prediction equation for estimating resting energy expenditure in healthy African-American and European-American women. Eur. J. Clin. Nutr. 2004, 58, 474–480. [Google Scholar] [CrossRef]
- Wright, T.G.; Dawson, B.; Jalleh, G.; Guelfi, K.J. Accuracy of resting metabolic rate prediction in overweight and obese Australian adults. Obes. Res. Clin. Pract. 2016, 10, S74–S83. [Google Scholar] [CrossRef]
- Yang, X.; Li, M.; Mao, D.; Zeng, G.; Zhuo, Q.; Hu, W.; Piao, J.; Yang, X.; Huang, C. Basal energy expenditure in southern Chinese healthy adults: Measurement and development of a new equation. Br. J. Nutr. 2010, 104, 1817–1823. [Google Scholar] [CrossRef] [PubMed]
- Yangmei, L.; Yanxia, M.; Liangmei, Q.; Jinhui, Z.; Yu, H.; Minwen, Z. Controlling energetic intake based on a novel logistic regression model for the metabolic syndrome in a Chinese population. Br. J. Nutr. 2011, 105, 256–262. [Google Scholar] [CrossRef] [PubMed]
- Aleman-Mateo, H.; Salazar, G.; Hernandez-Triana, M.; Valencia, M.E. Total energy expenditure, resting metabolic rate and physical activity level in free-living rural elderly men and women from Cuba, Chile and Mexico. Eur. J. Clin. Nutr. 2006, 60, 1258–1265. [Google Scholar] [CrossRef] [PubMed][Green Version]
- Holdy, K.E. Monitoring energy metabolism with indirect calorimetry: Instruments, interpretation, and clinical application. Nutr. Clin. Pract. 2004, 19, 447–454. [Google Scholar] [CrossRef]
- Oshima, T.; Berger, M.M.; De Waele, E.; Guttormsen, A.B.; Heidegger, C.-P.; Hiesmayr, M.; Singer, P.; Wernerman, J.; Pichard, C. Indirect calorimetry in nutritional therapy. A position paper by the ICALIC study group. Clin. Nutr. 2017, 36, 651–662. [Google Scholar] [CrossRef]
- Gaillard, C.; Alix, E.; Sallé, A.; Berrut, G.; Ritz, P. Energy requirements in frail elderly people: A review of the literature. Clin. Nutr. 2007, 26, 16–24. [Google Scholar] [CrossRef]
- Melzer, K.; Laurie Karsegard, V.; Genton, L.; Kossovsky, M.P.; Kayser, B.; Pichard, C. Comparison of equations for estimating resting metabolic rate in healthy subjects over 70 years of age. Clin. Nutr. 2007, 26, 498–505. [Google Scholar] [CrossRef]
- Neelemaat, F.; van Bokhorst-de van der Schueren, M.A.E.; Thijs, A.; Seidell, J.C.; Weijs, P.J.M. Resting energy expenditure in malnourished older patients at hospital admission and three months after discharge: Predictive equations versus measurements. Clin. Nutr. 2012, 31, 958–966. [Google Scholar] [CrossRef]
- Siervo, M.; Labanca, F.; Colantuoni, A. Validity of some prediction equations to assess resting energy expenditure (REE) in 29 elderly obese subjects (>60 years). Eating and Weight Disorders-Studies on Anorexia. Bulim. Obes. 2008, 13, e14–e19. [Google Scholar] [CrossRef]
- Frankenfield, D.; Roth-Yousey, L.; Compher, C. Comparison of predictive equations for resting metabolic rate in healthy nonobese and obese adults: A systematic review. J. Am. Diet Assoc. 2005, 105, 775–789. [Google Scholar] [CrossRef]
- Schwartz, A.; Kuk, J.L.; Lamothe, G.; Doucet, E. Greater than predicted decrease in resting energy expenditure and weight loss: Results from a systematic review. Obesity 2012, 20, 2307–2310. [Google Scholar] [CrossRef] [PubMed]
- Wahrlich, V.; dos Anjos, L.A. Historical and methodological aspects of the measurement and prediction of basal metabolic rate: A review. Cad. Saude Publica 2001, 17, 801–817. [Google Scholar] [CrossRef] [PubMed]
- Cereda, E.; Klersy, C.; Rondanelli, M.; Caccialanza, R. Energy Balance in Patients with Pressure Ulcers: A Systematic Review and Meta-Analysis of Observational Studies. J. Am. Diet. Assoc. 2011, 111, 1868–1876. [Google Scholar] [CrossRef] [PubMed]
- Miles, J.M. Energy expenditure in hospitalized patients: Implications for nutritional support. Mayo Clin. Proc. 2006, 81, 809–816. [Google Scholar] [CrossRef] [PubMed]
- Compher, C.; Cato, R.; Bader, J.; Kinosian, B. Harris-Benedict equations do not adequately predict energy requirements in elderly hospitalized African Americans. J. Natl. Med. Assoc. 2004, 96, 209–214. [Google Scholar] [PubMed]
- Hasson, R.E.; Howe, C.A.; Jones, B.L.; Freedson, P.S. Accuracy of four resting metabolic rate prediction equations: Effects of sex, body mass index, age, and race/ethnicity. J. Sci. Med. Sport 2011, 14, 344–351. [Google Scholar] [CrossRef] [PubMed]
- Rocca, W.A.; Boyd, C.M.; Grossardt, B.R.; Bobo, W.V.; Rutten, L.J.; Roger, V.L.; Ebbert, J.O.; Therneau, T.M.; Yawn, B.P.; Sauver, J.L.S. The prevalence of multimorbidity in a geographically defined American population: Patterns by age, sex, and ethnicity. Mayo Clin. Proc. 2014, 89, 1336–1349. [Google Scholar] [CrossRef] [PubMed]
- Anziani: Le Condizioni di Salute in Italia e in Europa. Available online: https://www.istat.it/it/files/2017/09/Condizioni_Salute_anziani_anno_2015.pdf (accessed on 7 September 2020).
- Wells, J.C.K.; Williams, J.E.; Haroun, D.; Fewtrell, M.S.; Colantuoni, A.; Siervo, M. Aggregate predictions improve accuracy when calculating metabolic variables used to guide treatment. Am. J. Clin. Nutr. 2009, 89, 491–499. [Google Scholar] [CrossRef]
- Elmadfa, I.; Meyer, A.L. Developing Suitable Methods of Nutritional Status Assessment: A Continuous Challenge. Adv. Nutr. 2014, 5, 590S–598S. [Google Scholar] [CrossRef]
- Mattes, R.D.; Hollis, J.; Hayes, D.; Stunkard, A.J. Appetite: Measurement and Manipulation Misgivings. J. Am. Diet. Assoc. 2005, 105, 87–97. [Google Scholar] [CrossRef]
- López-Gómez, J.J.; Calleja-Fernández, A.; Ballesteros-Pomar, M.D.; Vidal-Casariego, A.; Brea-Laranjo, C.; Fariza-Vicente, E.; Arias-García, R.M.; Cano-Rodríguez, I. Screening of the nutritional risk in elderly hospitalized patients with different tools. Endocrinol. Y Nutr. 2011, 58, 104–111. [Google Scholar] [CrossRef] [PubMed]


Publisher’s Note: MDPI stays neutral with regard to jurisdictional claims in published maps and institutional affiliations. |
© 2021 by the authors. Licensee MDPI, Basel, Switzerland. This article is an open access article distributed under the terms and conditions of the Creative Commons Attribution (CC BY) license (http://creativecommons.org/licenses/by/4.0/).