Dietary Intake and Lifestyle Habits of Children Aged 10–12 Years Enrolled in the School Lunch Program in Greece: A Cross Sectional Analysis

 , ,
, ,
Abstract
:1. Introduction
2. Materials and Methods
2.1. Participants and Study Design
2.1.1. Dietary Assessment
2.1.2. Anthropometric Data
2.1.3. Sedentary Lifestyle Evaluation
2.1.4. Socio-Economic Status (SES)
2.1.5. Parental Data
2.2. Statistical Analysis
3. Results
4. Discussion
5. Conclusions
Author Contributions
Funding
Institutional Review Board Statement
Informed Consent Statement
Data Availability Statement
Acknowledgments
Conflicts of Interest
References
- Lucas, P.J.; Patterson, E.; Sacks, G.; Billich, N.; Evans, C.E.L. Preschool and School Meal Policies: An Overview of What We Know about Regulation, Implementation, and Impact on Diet in the UK, Sweden, and Australia. Nutrients 2017, 9, 736. [Google Scholar] [CrossRef] [PubMed]
- Oostindjer, M.A.-O.; Aschemann-Witzel, J.; Wang, Q.; Skuland, S.E.; Egelandsdal, B.; Amdam, G.V.; Schjøll, A.; Pachucki, M.C.; Rozin, P.; Stein, J.; et al. Are school meals a viable and sustainable tool to improve the healthiness and sustainability of children’s diet and food consumption? A cross-national comparative perspective. Crit. Rev. Food Sci. Nutr. 2017, 57, 3942–3958. [Google Scholar] [CrossRef] [PubMed]
- McLoughlin, G.M.; Turner, L.; Leider, J.; Piekarz-Porter, E.; Chriqui, J.F. Assessing the Relationship between District and State Policies and School Nutrition Promotion-Related Practices in the United States. Nutrients 2020, 12, 2356. [Google Scholar] [CrossRef] [PubMed]
- Vernarelli, J.A.; O’Brien, B. A Vote for School Lunches: School Lunches Provide Superior Nutrient Quality than Lunches Obtained from Other Sources in a Nationally Representative Sample of US Children. Nutrients 2017, 9, 924. [Google Scholar] [CrossRef] [Green Version]
- Vik, F.N.; Van Lippevelde, W.; Øverby, N.C. Free school meals as an approach to reduce health inequalities among 10–12- year-old Norwegian children. BMC Public Health 2019, 19, 951. [Google Scholar] [CrossRef] [Green Version]
- Μoore, G.M.; Murphy, S.; Chaplin, K.; Lyons, R.A.; Atkinson, M.; Moore, L. Selection and consumption of lunches by National School Lunch Program participants. Appetite 2019, 133, 191–198. [Google Scholar] [CrossRef]
- Moore, G.F.; Murphy, S.; Chaplin, K.; Lyons, R.A.; Atkinson, M.; Moore, L. Impacts of the Primary School Free Breakfast Initiative on socio-economic inequalities in breakfast consumption among 9–11-year-old schoolchildren in Wales. Public Health Nutr. 2014, 17, 1280–1289. [Google Scholar] [CrossRef] [Green Version]
- Huang, Z.; Gao, R.; Bawuerjiang, N.; Zhang, Y.; Huang, X.; Cai, M. Food and Nutrients Intake in the School Lunch Program among School Children in Shanghai, China. Nutrients 2017, 9, 582. [Google Scholar] [CrossRef] [Green Version]
- Kentikelenis, A.; Karanikolos, M.; Papanicolas, I.; Basu, S.; McKee, M.; Stuckler, D. Health Effects of Financial Crisis: Omens of a Greek Tragedy. Lancet 2011, 378, 1457–1458. [Google Scholar] [CrossRef] [Green Version]
- Anagnostopoulos, D.C.; Soumaki, E. The state of child and adolescent psychiatry in Greece during the international financial crisis: A brief report. Eur. Child Adolesc. Psychiatry 2013, 22, 131–134. [Google Scholar] [CrossRef]
- Alderman, L. More Children in Greece Are Going Hungry. The New York Times. 2013. Available online: https://www.nytimes.com/2013/04/18/world/europe/more-children-in-greece-start-to-go-hungry.html (accessed on 18 January 2021).
- Chatzivagia, E.; Pepa, A.; Vlassopoulos, A.; Malisova, O.; Filippou, K.; Kapsokefalou, M. Nutrition Transition in the Post-Economic Crisis of Greece: Assessing the Nutritional Gap of Food-Insecure Individuals. A Cross-Sectional Study. Nutrients 2019, 11, 2914. [Google Scholar] [CrossRef] [PubMed] [Green Version]
- Farajian, P.; Karasouli, K.; Risvas, G.; Panagiotakos, D.; Zampelas, A. Repeatability and Validity of a Food Frequency and Dietary Habits Questionnaire in Children. Circulation 2009, 119, e288. [Google Scholar]
- U.S. Department of Agriculture. Agricultural Research Service. USDA National Nutrient Database for Standard Reference. Available online: https://data.nal.usda.gov/dataset/usda-national-nutrient-database-standard-reference-legacy-release (accessed on 18 January 2021).
- Hellenic Health Foundation. Nutritional Composition Tables οf Greek Recipes by Calculation. Available online: http://www.hhf-greece.gr/tables/DishesIntro.aspx?l=en (accessed on 18 January 2021).
- Yannakoulia, M.L.A.; Kastorini, C.M.; Saranti Papasaranti, E.; Petralias, A.; Veloudaki, A.; Linos, A. DIATROFI Program Research Team. National Nutrition Guide. 2014. Available online: http://www.diatrofikoiodigoi.gr/?Page=english-menu (accessed on 18 January 2021).
- Black, A.E. Critical evaluation of energy intake using the Goldberg cut-off for energy intake:basal metabolic rate. A practical guide to its calculation, use and limitations. Int. J. Obes. 2000, 24, 1119–1130. [Google Scholar] [CrossRef] [PubMed] [Green Version]
- Schofield, W.N. Predicting basal metabolic rate, new standards and review of previous work. Hum. Nutr Clin. Nutr. 1985, 39 (Suppl. 1), 5–41. [Google Scholar]
- Serra-Majem, L.; Ribas, L.; Ngo, J.; Ortega, R.M.; García, A.; Pérez-Rodrigo, C.; Aranceta, J. Food, youth and the Mediterranean diet in Spain. Development of KIDMED, Mediterranean Diet Quality Index in children and adolescents. Public Health Nutr. 2007, 7, 931–935. [Google Scholar] [CrossRef]
- World Health Organization. BMI-for-Age (5–19 Years). Available online: https://www.who.int/tools/growth-reference-data-for-5to19-years/indicators/bmi-for-age (accessed on 18 January 2021).
- Currie, C.; Molcho, M.; Boyce, W.; Holstein, B.; Torsheim, T.; Richter, M. Researching health inequalities in adolescents: The development of the Health Behaviour in School-Aged Children (HBSC) family affluence scale. Soc. Sci. Med. 2008, 66, 1429–1436. [Google Scholar] [CrossRef]
- Panagiotakos, D.B.; Pitsavos, C.; Stefanadis, C. Dietary patterns: A Mediterranean diet score and its relation to clinical and biological markers of cardiovascular disease risk. Nutr. Metab. Cardiovasc. Dis. 2006, 16, 559–568. [Google Scholar] [CrossRef]
- World Health Organization. Obesity: Preventing and Managing the Global Epidemic. Report of a WHO Consultation on Obesity; WHO Technical Report Series; WHO: Geneva, Switzerland, 1997; Volume 894. [Google Scholar]
- Arsenault, J.E.; Brown, K.H. Dietary Protein Intake in Young Children in Selected Low-Income Countries Is Generally Adequate in Relation to Estimated Requirements for Healthy Children, Except When Complementary Food Intake Is Low. J. Nutr. 2017, 147, 932–939. [Google Scholar] [CrossRef] [Green Version]
- Graham, G.G.; MacLean, W.C.; Brown, K.H.; Morales, E.; Lembcke, J.; Gastañaduy, A. Protein requirements of infants and children: Growth during recovery from malnutrition. Pediatrics 1996, 97, 499–505. [Google Scholar]
- EFSA. Dietary Reference Values (DRVs). Available online: https://www.efsa.europa.eu/en/interactive-pages/drvs (accessed on 18 January 2021).
- World Health Organization. Guideline: Sugars Intake for Adults and Children; World Health Organization, Ed.; Nutrition and Food Safety, 2015; p. 49. ISBN 9789241549028. Available online: https://www.who.int/publications/i/item/9789241549028 (accessed on 18 January 2021).
- EFSA Panel on Nutrition, Novel Foods and Food Allergens (NDA); Castenmiller, J.; de Henauw, S.; Hirsch-Ernst, K.-I.; Kearney, J.; Knutsen, H.K.; Maciuk, A.; Mangelsdorf, I.; McArdle, H.J.; Pelaez, C.; et al. Dietary reference values for sodium. EFSA J. 2019, 17, e05778. [Google Scholar] [CrossRef] [Green Version]
- Magriplis, E.; Farajian, P.; Pounis, G.D.; Risvas, G.; Panagiotakos, D.B.; Zampelas, A. High sodium intake of children through ‘hidden’ food sources and its association with the Mediterranean diet: The GRECO study. J. Hypertens 2011, 29, 1069–1076. [Google Scholar] [CrossRef] [PubMed] [Green Version]
- Roos, G.; Johansson, L.; Kasmel, A.; Klumbiene, J.; Prättälä, R. Disparities in vegetable and fruit consumption: European cases from the north to the south. Public Health Nutr. 2001, 4, 35–43. [Google Scholar] [CrossRef] [PubMed] [Green Version]
- Trichopoulou, A.; Naska, A.; Costacou, T.; DAFNE III Group. Disparities in food habits across Europe. Proc. Nutr. Soc. 2002, 1, 553–558. [Google Scholar] [CrossRef] [PubMed] [Green Version]
- Farajian, P.; Risvas, G.; Karasouli, K.; Pounis, G.; Kastorini, C.-M.; Panagiotakos, D.; Zampelas, A. Very high childhood obesity prevalence and low adherence rates to the Mediterranean diet in Greek children: The GRECO Study. Atherosclerosis 2011, 217, 525–530. [Google Scholar] [CrossRef]
- Yannakoulia, M.; Lykou, A.; Kastorini, C.M.; Papasaranti, E.S.; Petralias, A.; Veloudaki, A.; Linos, A. Socio-economic and lifestyle parameters associated with diet quality of children and adolescents using classification and regression tree analysis: The DIATROFI study. Public Health Nutr. 2016, 19, 339–347. [Google Scholar] [CrossRef] [Green Version]
- Trofholz, A.C.; Tate, A.D.; Miner, M.H.; Berge, J.M. Associations between TV viewing at family meals and the emotional atmosphere of the meal, meal healthfulness, child dietary intake, and child weight status. Appetite 2017, 108, 361–366. [Google Scholar] [CrossRef] [Green Version]
- Jones, B.L. Making time for family meals: Parental influences, home eating environments, barriers and protective factors. Physiol. Behav. 2018, 193 Pt B, 248–251. [Google Scholar] [CrossRef]
- Jackson, J.A.; Smit, E.; Branscum, A.; Gunter, K.; Harvey, M.; Manore, M.M.; John, D. The Family Home Environment, Food Insecurity, and Body Mass Index in Rural Children. Health Educ. Behav. 2017, 44, 648–657. [Google Scholar] [CrossRef]
- Vik, F.N.; Bjørnarå, H.B.; Øverby, N.C.; Lien, N.; Androutsos, O.; Maes, L.; Jan, N.; Kovacs, E.; Moreno, L.A.; Dössegger, A.; et al. Associations between eating meals, watching TV while eating meals and weight status among children, ages 10-12 years in eight European countries: The ENERGY cross-sectional study. Int. J. Behav. Nutr. Phys. Act. 2013, 10, 58. [Google Scholar] [CrossRef] [Green Version]
- Farajian, P.; Panagiotakos, D.B.; Risvas, G.; Malisova, O.; Zampelas, A. Hierarchical analysis of dietary, lifestyle and family environment risk factors for childhood obesity: The GRECO study. Eur. J. Clin. Nutr. 2014, 68, 1107–1112. [Google Scholar] [CrossRef]
- Arvaniti, F.; Priftis, K.N.; Papadimitriou, A.; Papadopoulos, M.; Roma, E.; Kapsokefalou, M.; Anthracopoulos, M.B.; Panagiotakos, D.B. Adherence to the Mediterranean type of diet is associated with lower prevalence of asthma symptoms, among 10-12 years old children: The PANACEA study. Pediatr. Allergy Immunol. 2011, 22, 283–289. [Google Scholar] [CrossRef] [PubMed]
- Papadaki, S.; Mavrikaki, E. Greek adolescents and the Mediterranean diet: Factors affecting quality and adherence. Nutrition 2015, 31, 345–349. [Google Scholar] [CrossRef] [PubMed]
- Sustain. 1 in 4 UK Parents Skipping Meals due to Lack of Money. Available online: https://www.sustainweb.org/news/jan18_calls_grow_for_government_food_insecurity_measurement/ (accessed on 18 January 2021).

| Characteristics | School Lunch Group | Control Group | p |
|---|---|---|---|
| Children (n) | 595 | 736 | |
| Weight (kg) | 43.86 ± 10.82 | 41.55 ± 9.57 | <0.001 |
| Height (cm) | 149.47 ± 8.97 | 147.33 ± 8.44 | <0.001 |
| BMI (kg/m2) | 19.18 ± 3.44 | 19.37 ± 3.68 | 0.35 |
| Underweight % (n) | 14.6 (78) | 10.7 (73) | <0.001 |
| Normal weight % (n) | 84.1 (451) | 82.8 (565) | |
| Overweight % (n) | 0.6 (3) | 0.7 (5) | |
| Obese % (n) | 0.7 (4) | 5.7 (39) | |
| SES (2–16) | 6.45 ± 1.62 | 6.35 ± 1.89 | 0.52 |
| Parents (n) | 203 | 305 | |
| Mothers n (%) | 165 (80.8) | 247 (81.0) | |
| Mothers’ age (years) | 41.02 ± 5.46 | 42.26 ± 5.05 | 0.01 |
| Fathers; age (years) | 46.49 ± 5.77 | 45.57 ± 5.84 | 0.88 |
| Mothers’ education (years of school) | 13.30 ± 3.09 | 14.09 ± 3.77 | 0.02 |
| Fathers’ education (years of school) | 12.64 ± 3.18 | 13.45 ± 3.90 | 0.02 |
| BMI of mothers (kg/m2) | 25.08 ± 4.50 | 24.14 ± 4.17 | 0.02 |
| BMI of fathers (kg/m2) | 25.52 ± 3.41 | 27.23 ± 5.27 | 0.52 |
| School Lunch Group | Control Group | p | |||||
|---|---|---|---|---|---|---|---|
| Boys (n = 269) | Girls (n = 326) | Total (n = 595) | Boys (n = 331) | Girls (n = 405) | Total (n = 736) | School Lunch vs. Control | |
| Number of eating occasions (times/day) | 3.41 ± 1.36 | 3.52 ± 1.41 | 3.47 ± 1.38 | 3.67 ± 1.36 | 3.64 ± 1.33 | 3.65 ± 1.35 | 0.02 |
| Having breakfast (times per week) | 4.90 ± 2.37 | 5.04 ± 2.36 | 4.98 ± 2.37 | 5.28 ± 2.27 | 5.17 ± 2.31 | 5.22 ± 2.29 | 0.06 |
| Eating breakfast daily (%) | 49.0 | 53.0 | 51.2 | 58.8 | 55.1 | 56.7 | 0.026 |
| Having meal with family, father or mother (%) | |||||||
| Rarely | 4.7 | 8.2 | 6.6 | 5.5 | 5.3 | 5.4 | 0.22 |
| 1–2 times/week | 16.7 | 16.3 | 16.5 | 22.1 | 22.1 | 22.1 | |
| 3–4 times/week | 15.6 | 12.2 | 13.7 | 16.3 | 14.0 | 15.0 | |
| 5–6 times/week | 17.9 | 12.5 | 14.9 | 8.6 | 11.0 | 9.9 | |
| Daily | 45.1 | 50.8 | 48.3 | 47.2 | 47.6 | 47.4 | |
| Having TV in the bedroom (%) | 41.6 | 33.4 * | 37.1 | 36.8 | 27.0 * | 31.4 | 0.03 |
| Having PC/video game player in the bedroom (%) | 61.4 | 55.4 | 58.1 | 51.1 | 58.5 * | 55.2 | 0.30 |
| Studying hours (weekdays) | 2.07 ± 1.11 | 2.25 ± 1.16 * | 2.17 ± 1.14 | 2.13 ± 1.02 | 2.27 ± 1.12 | 2.21 ± 1.08 | 0.57 |
| Studying hours (weekends) | 2.19 ± 2.11 | 2.22 ± 2.31 | 2.21 ± 2.22 | 2.22 ± 2.26 | 2.13 ± 1.54 | 2.17 ± 1.90 | 0.74 |
| TV/video game weekdays (h) | 2.32 ± 2.74 | 2.10 ± 2.47 | 2.20 ± 2.59 | 1.58 ± 1.30 | 1.46 ± 0.99 | 1.52 ± 1.14 | <0.001 |
| TV/video game weekends (h) | 3.87 ± 2.83 | 3.50 ± 2.86 | 3.66 ± 2.85 | 3.59 ± 2.49 | 2.85 ± 1.77 * | 3.19 ± 2.16 | 0.001 |
| Having meal while watching TV or playing video games (times) (%) | |||||||
| Rarely | 30.9 | 31.5 | 31.2 | 37.5 | 33.8 | 35.5 | 0.99 |
| 1–2 times/week | 34.0 | 32.8 | 33.3 | 26.8 | 31.6 | 29.4 | |
| 3–4 times/week | 16.0 | 14.8 | 15.4 | 13.2 | 12.2 | 12.7 | |
| 5–6 times/week | 5.5 | 6.3 | 5.9 | 5.8 | 7.1 | 6.5 | |
| Daily | 13.7 | 14.5 | 14.1 | 16.3 | 15.3 | 15.7 | |
| School Lunch Group | Control Group | ||||||
|---|---|---|---|---|---|---|---|
| Boys (n = 101) | Girls (n = 97) | Total (n = 197) | Boys (n = 129) | Girls (n = 156) | Total (n = 285) | p | |
| Total Energy (kcal) | 2163(1549,3746) | 2028(1490,2785) | 2060(1511,3438) | 2236(1597,3170) | 1873(1340,2494) * | 1977(1498,2700) | 0.13 |
| Total carbs (% en) | 45.3(39.9,51.64) | 46.1 ± 9.1 | 45.3(39.9,51.6) | 44.9(39.3,0.6) | 46.0 ± 8.8 | 45.6 ± 8.5 | 0.77 |
| Total protein (% en) | 15.3(13.6,16.8) | 14.7 ± 2.9 | 15.1 ± 3.1 | 15.4(13.7,17.3) | 15.0 ± 3.1 | 15.2 ± 2.9 | 0.72 |
| Total fat (% en) | 41.8 ± 7.9 | 41.9 ± 7.3 | 41.8 ± 7.6 | 41.4(38.5,46.3) | 41.9(37.9,45.3) | 41.7 ± 6.1 | 0.84 |
| SFA (% en) | 14.4(12.3,17.2) | 14.3(12.5,16.3) | 14.7 ± 3.7 | 14.8(12.3,16.7) | 13.89(12.04,16.46) | 14.5 ± 3.5 | 0.64 |
| PUFA (% en) | 4.92 (4.2,5.6) | 5.1(4.2,5.9) | 5.0(4.2,5.6) | 4.9 ± 1.1 | 5.2 ± 1.4 | 5.1 ± 1.3 | 0.80 |
| MUFA (% en) | 18.4 ± 5.1 | 17.8(15.6,20.9) | 18.6 ± 5.1 | 17.62(15.9,20.6) | 18.7(15.9,21.6) | 18.0(15.9,21.0) | 0.82 |
| Total sodium (mg) | 1899(1268,3212) | 1726(1193,2412) | 1762(1258,2831) | 1949(1288,2840) | 1533(997,2224) * | 1618(1153,2443) | 0.08 |
| Total calcium (mg) | 1392(888,2096) | 1234(854,1674) | 1303(871,1889) | 1215(875,2183) | 1063(691,1611) * | 1150(809,1819) | 0.13 |
| Total fiber (g/d) | 4.5 ± 1.4 | 4.7 ± 1.2 | 4.6 ± 1.3 | 4.3(3.6,5.2) | 4.6 ± 1.2 | 4.4(3.7,5.3) | 0.61 |
| Total sugars (% en) | 22.4(19.0,28.6) | 23.3(18.9,29.5) | 22.8(18.9,28.9) | 21.8(18.3,25.7) | 23.0(18.4,27.1) | 22.9 ± 7.2 | 0.22 |
| National Nutrition Guide | School Lunch Group (Portions/Day) | Control Group (Portions/Day) | p | |
|---|---|---|---|---|
| Cereals-Potatoes (rice, pasta, breakfast cereals, bread, pastries, toast, crackers, potatoes) | 5–6 portions/day | 1.40(0.93,2.36) | 2.12 ± 1.40 | 0.02 |
| Legumes (lentils, beans, chickpeas) | at least 3 portions/week (0.43 portions /day) | 0.27(0.13,0.53) | 0.33(0.13,0.53) | 0.02 |
| Fruits (raw, dried, fresh juices) | 2–3 portions /day | 2.29 ± 1.59 | 1.66(0.90,2.53) | 0.03 |
| Vegetables (raw and cooked) | 2–3 portions /day | 0.67(0.40,1.10) | 0.83(0.40,1.37) | 0.15 |
| Dairy (milk, yogurt, cheese, dairy products) | 3–4 portions /day | 1.03(0.50.1.74) | 1.19(0.73,1.73) | 0.18 |
| Meat (beef, beef, chicken, turkey) | 2–3 portions/week (0.36 portions /day) | 0.40(0.27,0.66) | 0.40(0.27,0.80) | 0.32 |
| Fish and Seafood | 2–3 portions/week (0.36 portions /day) | 0.13(0.03,0.27) | 0.13(0.03,0.27) | 0.85 |
| Fast foods | - | 0.49(0.30,0.90) | 0.53(0.26,0.96) | 0.91 |
| Oils and Nuts (nuts, olive oil, butter, margarine) | 3–4 portions /day | 2.67 ± 1.56 | 2.55 ± 1.40 | 0.46 |
| Eggs | 4–7 portions/week (0.78 portions /day) | 0.27(0.07,0.53) | 0.27(0.07,0.53) | 0.43 |
| Soft drinks | - | 0.03(0.03,0.13) | 0.03(0.00,0.13) | 0.05 |
| Sweets (sugar, honey, jam, chocolate) | - | 1.26(0.80,1.93) | 1.180(0.70,2.00) | 0.62 |
| KIDMED | Fruits | Vegetables | Legumes | Fast Food | Meat | Cereals | Nuts | Soft Drinks | Sweets | |
|---|---|---|---|---|---|---|---|---|---|---|
| β (95% CI) | β (95% CI) | β (95% CI) | β (95% CI) | β (95% CI) | β (95% CI) | β (95% CI) | β (95% CI) | β (95% CI) | β (95% CI) | |
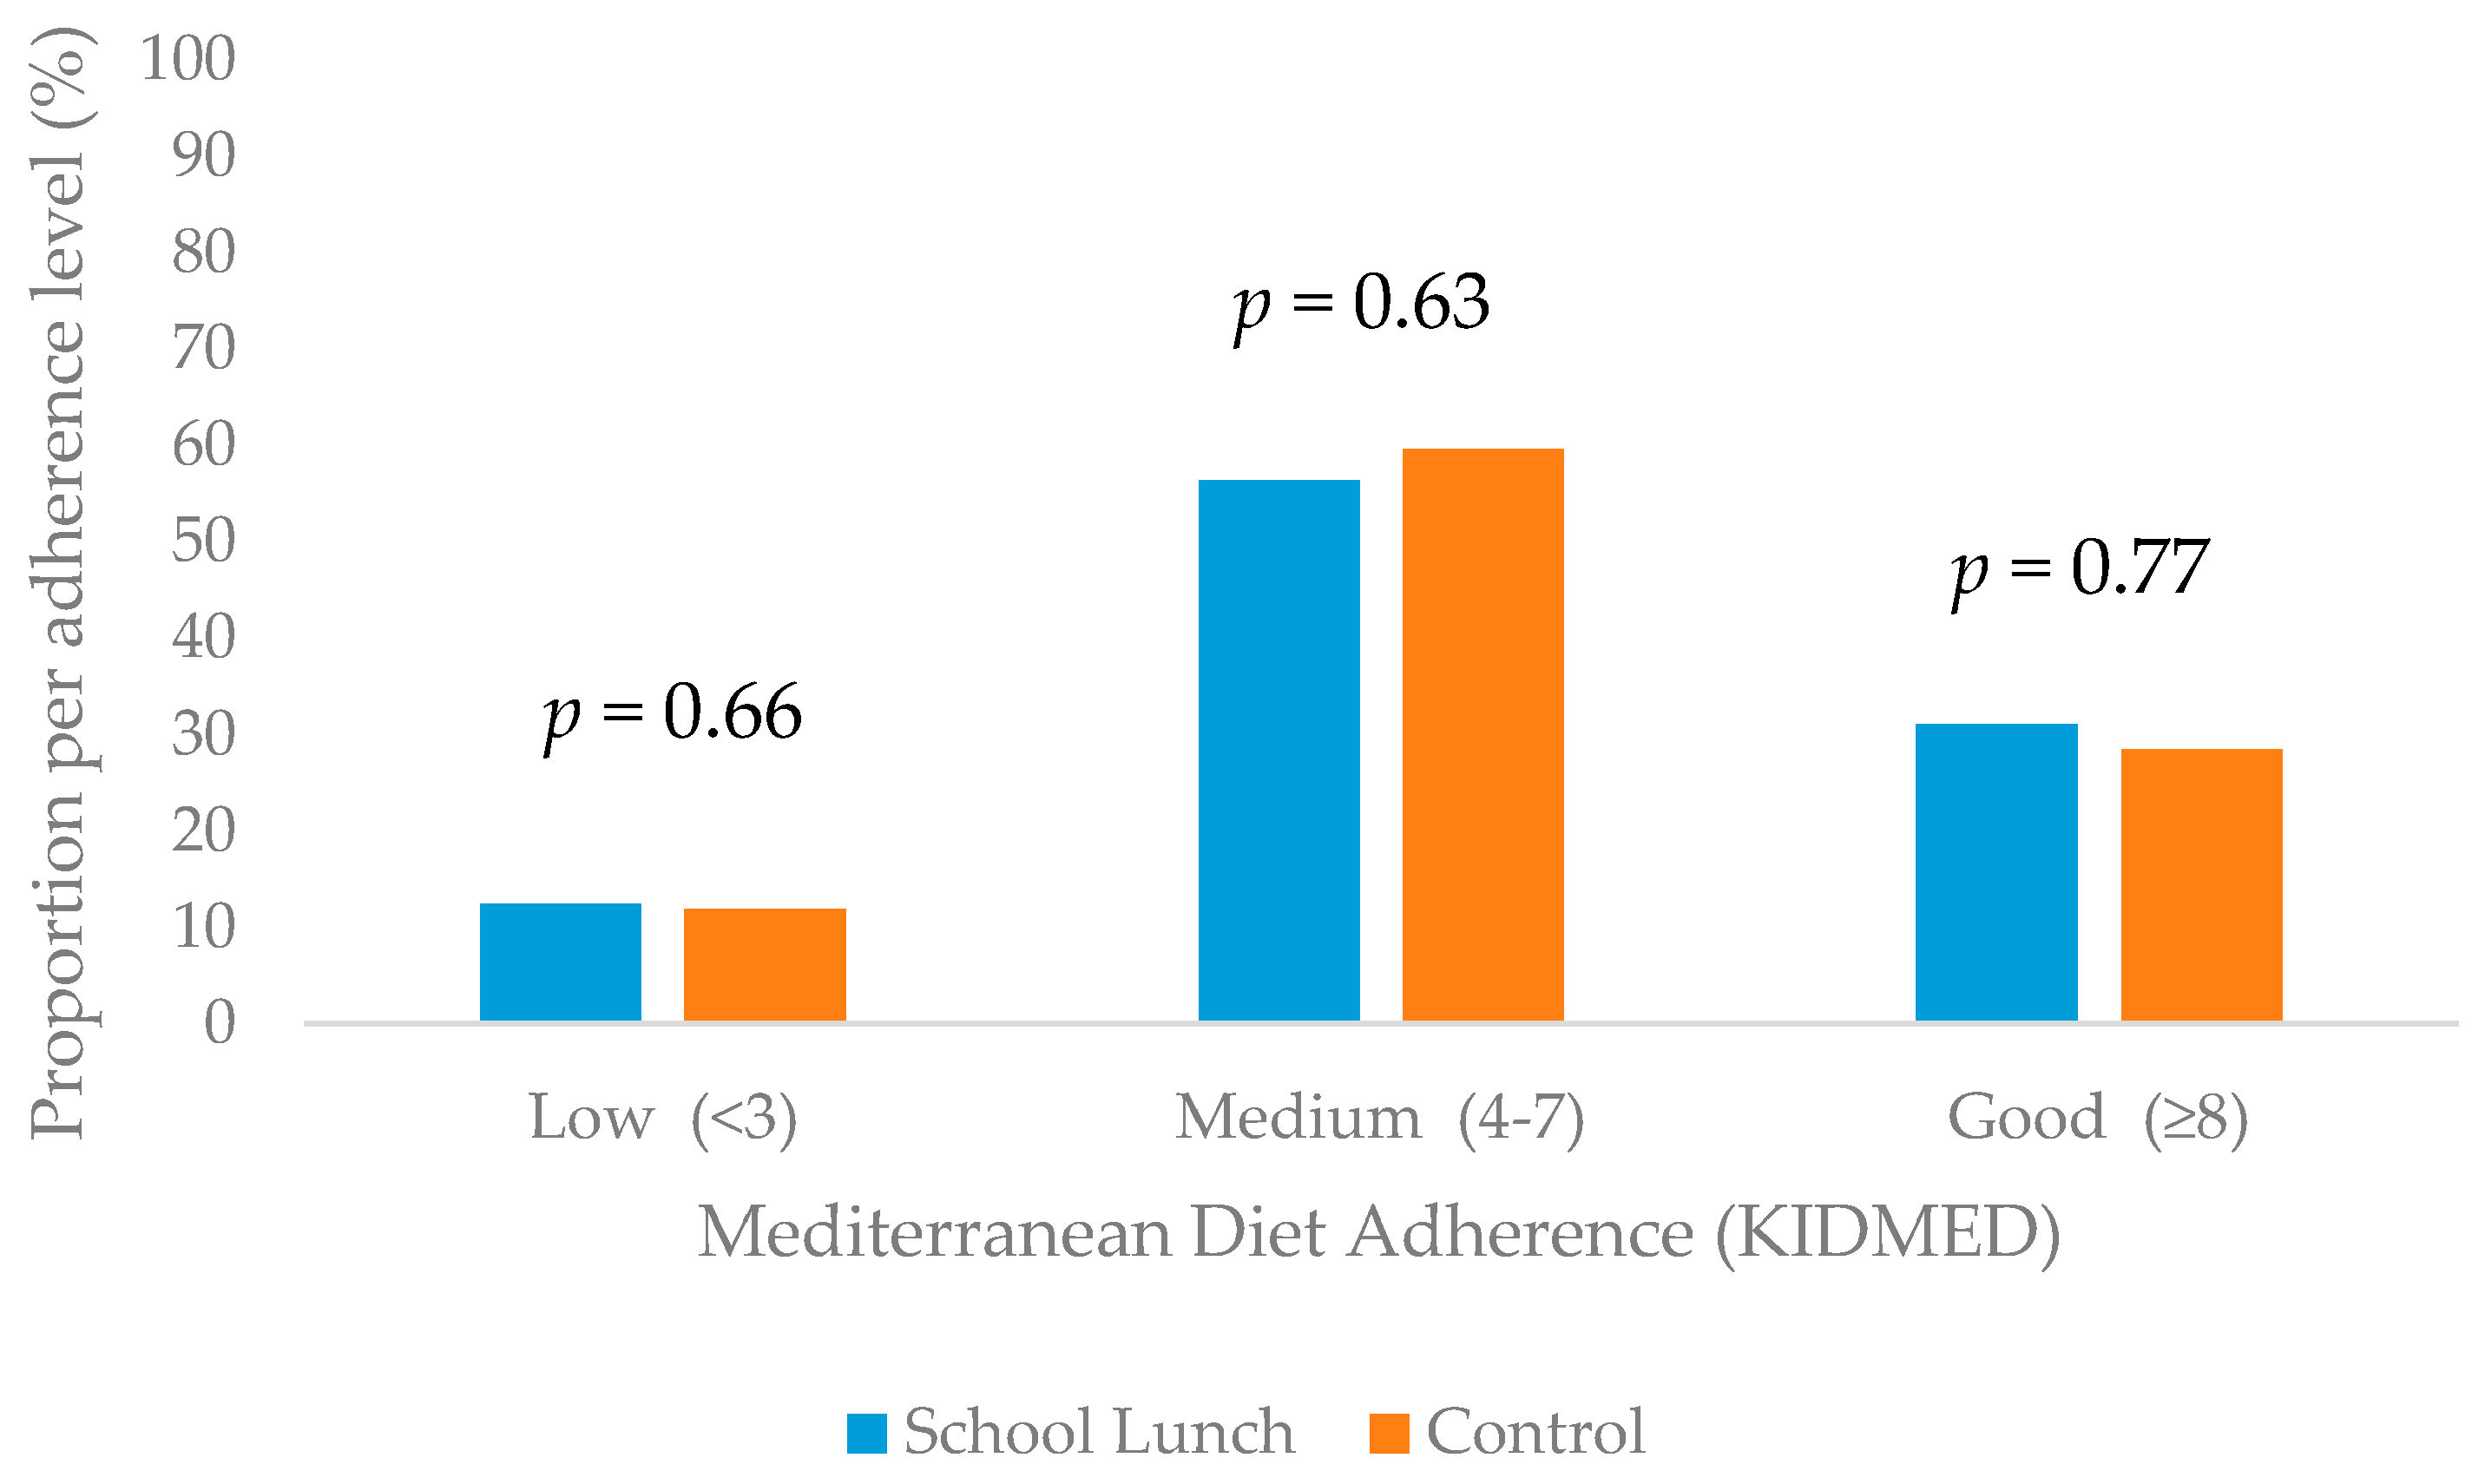
| School Lunch enrollment | 0.042 (−0.463 to 0.864) | 0.027 (−0.496 to 0.718) | −0.06 (−0.276 to 0.254) | −0.016 (−0.168 to 0.135) | −0.122 (−0.616 to 0.038) | −0.052 (−0.242 to 0.111) | −0.110 (−0.759 to 0.879) | 0.60 (−0.298 to 0.879) | 0.111 (−0.015 to 0.129) | 0.046 (−0.886 to 1.788) |
| Periphery | 0.004 (−0.105 to 0.111) | −0.038 (−0.120 to 0.072) | 0.029 (−0.034 to 0.050) | −0.046 (−0.031 to 0.017) | −0.016 (−0.058 to 0.046) | 0.009 (−0.026 to 0.030) | 0.076 (−0.032 to 0.103) | 0.056 (−0.052 to 0.134) | −0.080 (−0.018 to 0.005) | −0.031 (−0.258 to 0.165) |
| Sex | 0.123 (−0.116 to 1.275) | 0.018 (−0.553 to 0.699) | 0.041 (−0.201 to 0.346) | −0.048 (−0.206 to 0.108) | −0.025 (−0.397 to 0.278) | −0.024 (−0.212 to 0.151) | 0.108 (−0.117 to 0.764) | 0.154 (0.135 to 1.348) * | −0.089 (−0.120 to 0.029) | 0.103 (−0.375 to 2.382) |
| SES | −0.049 (−0.254 to 0.128) | 0.041 (−0.129 to 0.223) | −0.006 (−0.080 to 0.074) | −0.002 (−0.045 to 0.043) | 0.059 (−0.056 to 0.134) | −0.159 (−0.107 to −0.005) * | 0.050 (−0.082 to 0.165) | 0.025 (−0.137 to 0.204) | 0.046 (−0.014 to 0.028) | −0.074 (−0.587 to 0.188) |
| Screen time weekdays | −0.194 (−0.641 to 0.025) | 0.067 (−0.209 to 0.399) | −0.045 (−0.161 to 0.105) | 0.072 (−0.050 to 0.102) | 0.238 (0.032 to 0.360) * | −0.037 (−0.104 to 0.072) | −0.044 (−0.260 to 0.168) | −0.028 (−0.341 to 0.248) | 0.031 (−0.031 to 0.042) | 0.024 (−0.588 to 0.751) |
| Screen time weekends | −0.268 (−0.445 to −0.064) * | 0.034 (−0.147 to 0.205) * | −0.071 (−0.103 to 0.051) * | −0.027 (−0.050 to 0.038) | −0.102 (−0.145 to 0.044) | 0.162 (−0.008 to 0.094) | 0.055 (−0.089 to 0.158) | 0.029 (−0.141 to 0.199) | −0.017 (−0.023 to 0.019) | −0.064 (−0.516 to 0.257) |
| Sleep duration weekdays | −0.102 (−0.623 to 0.117) | 0.116 (−0.084 to 0.600) | 0.065 (−0.086 to 0.212) | 0.237 (0.047 to 0.218) * | −0.009 (−0.196 to 0.172) | −0.018 (−0.111 to 0.087) | 0.134 (−0.020 to 0.460) | 0.164 (0.097 to 0.759) * | −0.177 (−0.090 to −0.009) * | −0.033 (−0.925 to 0.579) |
| Sleep duration weekends | 0.165 (0.014 to 0.180) * | −0.056 (−0.106 to 0.047) | 0.003 (−0.033 to 0.034) | 0.227 (0.011 to 0.049) * | −0.018 (−0.047 to 0.036) | 0.029 (−0.018 to 0.027) | −0.035 (−0.067 to 0.040) | 0.026 (−0.058 to 0.090) | 0.115 (−0.002 to 0.017) | −0.026 (−0.202 to 0.136) |
| Energy intake | 0.159 (0.00 to 0.001) * | 0.258 (0.00 to 0.001) * | 0.246 (0.00 to 0.00) * | 0.010 (0.00 to 0.00) | 0.004 (0.00 to 0.00) * | 0.375 (0.00 to 0.00) * | 0.369 (0.00 to 0.001) * | 0.592 (0.001 to 0.001) * | 0.307 (0.00 to 0.00) * | 0.459 (0.001 to 0.002) * |
| BMI category | 0.029 (−0.267 to 0.395) | −0.036 (−0.366 to 0.224) | 0,158 (0.005 to 0.262) * | 0.048 (−0.050 to 0.097) | −0.026 (−0.118 to 0.129) | −0.027 (−0.102 to 0.069) | 0.015 (−0.186 to 0.229) | 0.050 (−0.172 to 0.399) | −0.040 (−0.045 to 0.025) | 0.006 (−0.622 to 0.676) |
Publisher’s Note: MDPI stays neutral with regard to jurisdictional claims in published maps and institutional affiliations. |
© 2021 by the authors. Licensee MDPI, Basel, Switzerland. This article is an open access article distributed under the terms and conditions of the Creative Commons Attribution (CC BY) license (http://creativecommons.org/licenses/by/4.0/).
Share and Cite
Malisova, O.; Vlassopoulos, A.; Kandyliari, A.; Panagodimou, E.; Kapsokefalou, M. Dietary Intake and Lifestyle Habits of Children Aged 10–12 Years Enrolled in the School Lunch Program in Greece: A Cross Sectional Analysis. Nutrients 2021, 13, 493. https://doi.org/10.3390/nu13020493
Malisova O, Vlassopoulos A, Kandyliari A, Panagodimou E, Kapsokefalou M. Dietary Intake and Lifestyle Habits of Children Aged 10–12 Years Enrolled in the School Lunch Program in Greece: A Cross Sectional Analysis. Nutrients. 2021; 13(2):493. https://doi.org/10.3390/nu13020493
Chicago/Turabian StyleMalisova, Olga, Antonis Vlassopoulos, Aikaterini Kandyliari, Evaggelia Panagodimou, and Maria Kapsokefalou. 2021. "Dietary Intake and Lifestyle Habits of Children Aged 10–12 Years Enrolled in the School Lunch Program in Greece: A Cross Sectional Analysis" Nutrients 13, no. 2: 493. https://doi.org/10.3390/nu13020493