
Comparison of Ketogenic Diets with and without Ketone Salts versus a Low-Fat Diet: Liver Fat Responses in Overweight Adults

 , ,
, ,
Abstract
:1. Introduction
2. Materials and Methods
2.1. Study Design
2.2. Human Subjects
2.3. Diet Intervention
2.4. Testing Battery
2.5. MRI Acquisition
2.6. Hepatic Fat Quantification
2.7. Statistical Analysis
3. Results
3.1. Weight Loss and Liver Fat Responses
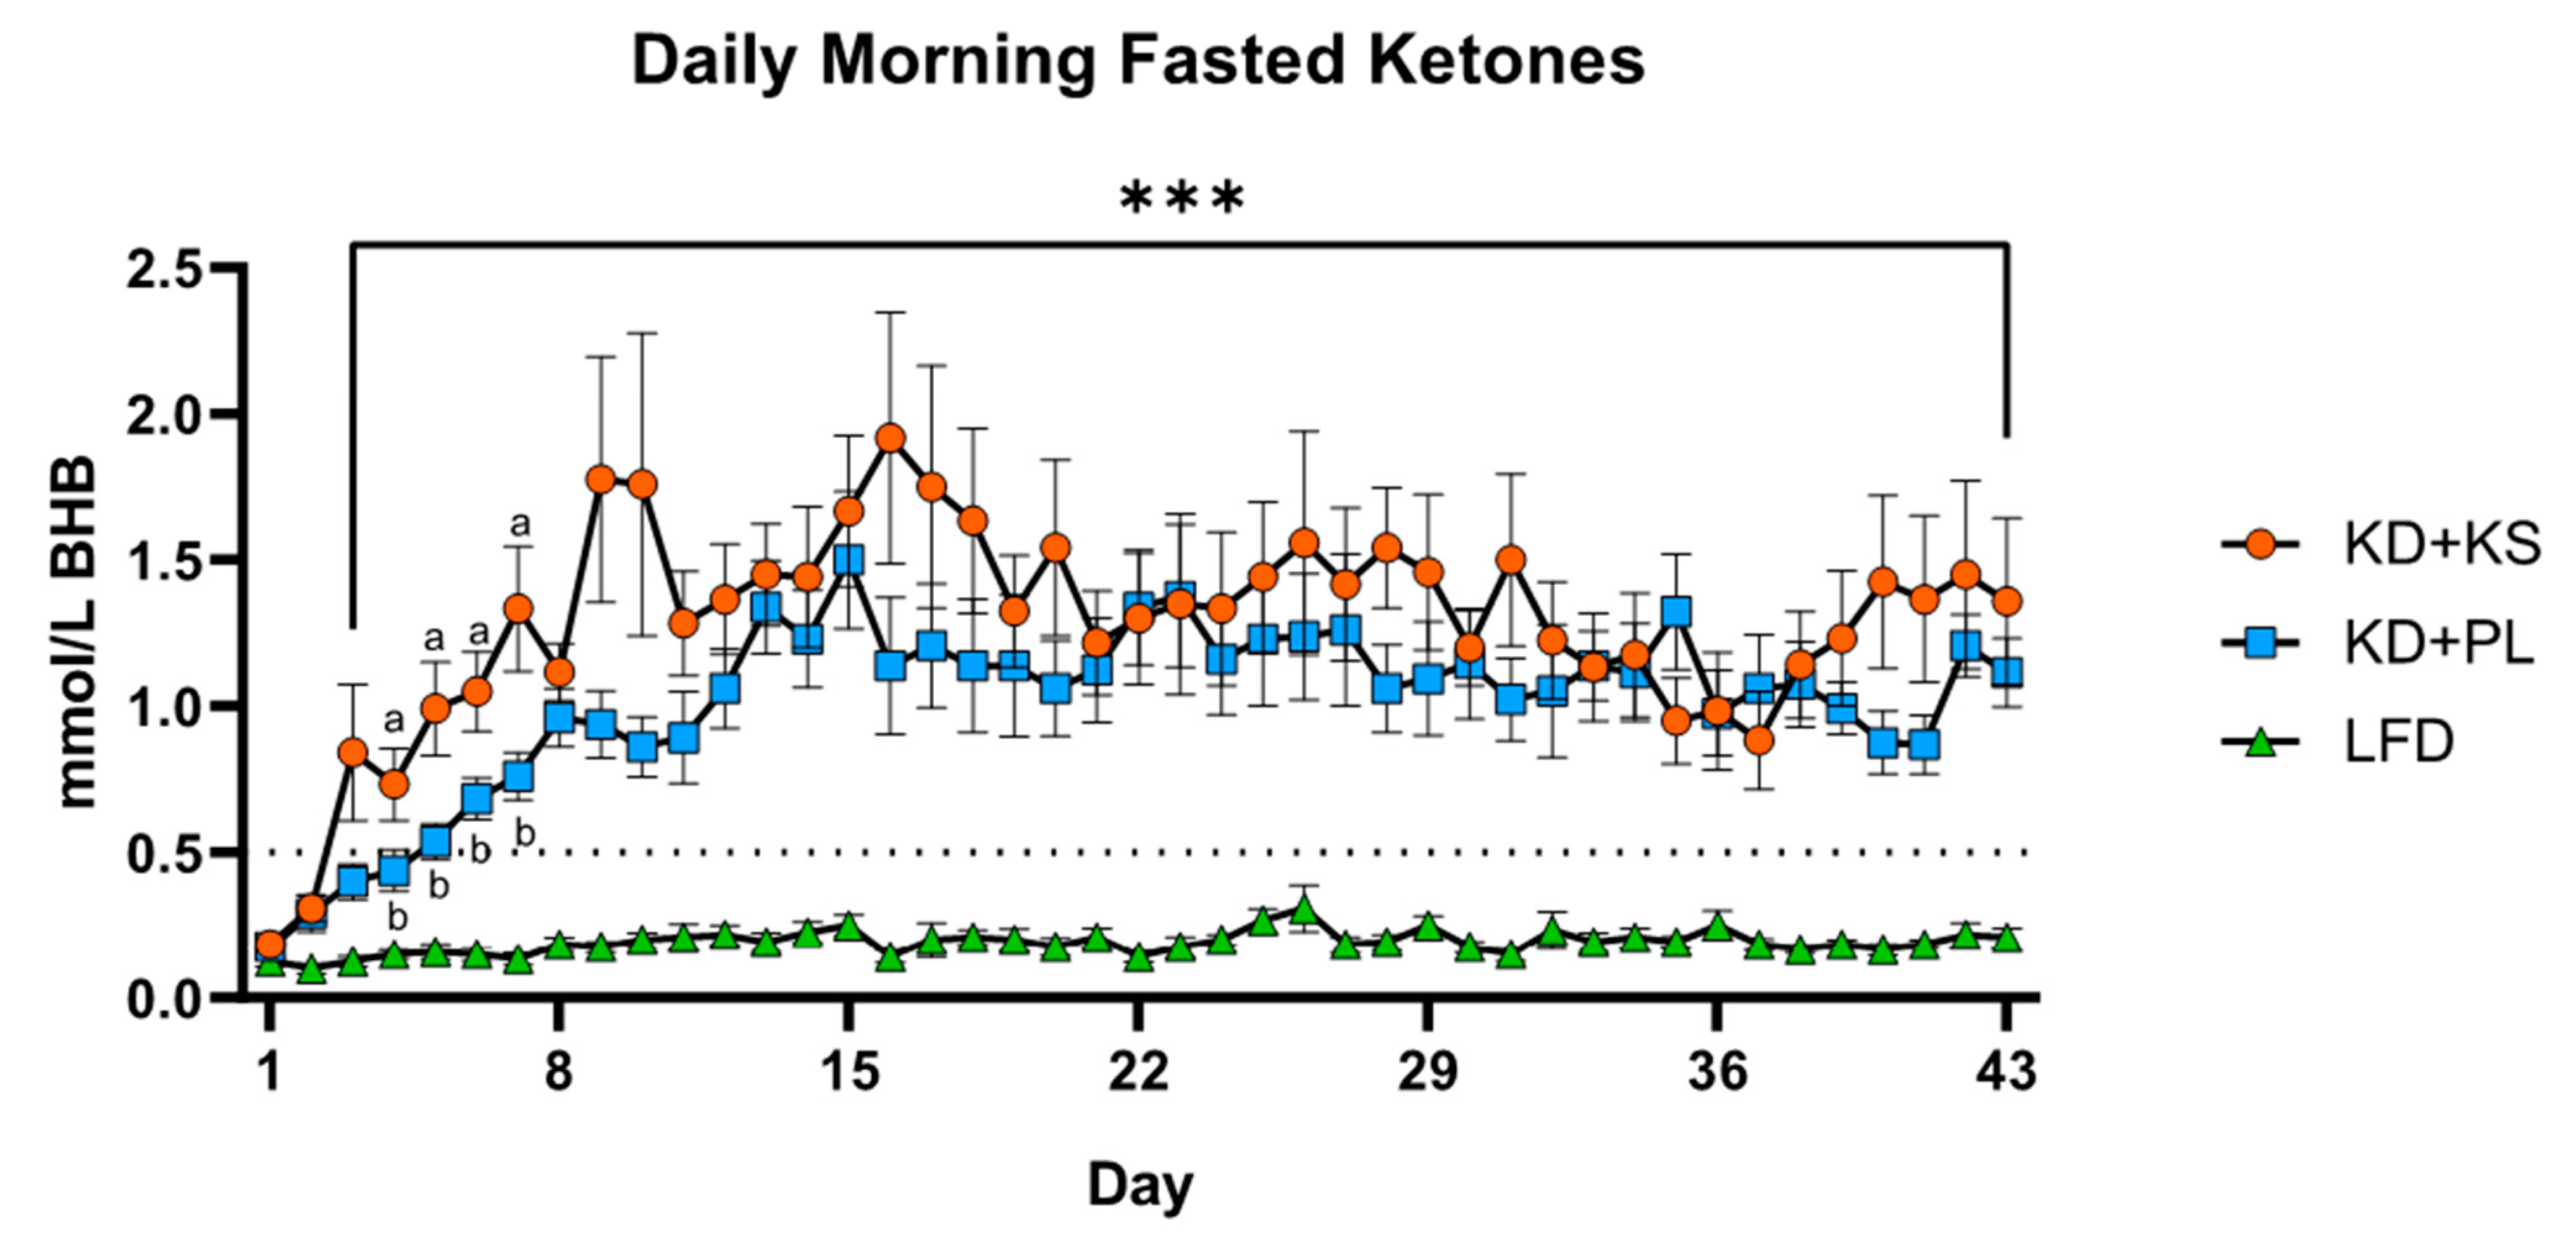
3.2. Metabolic Responses
3.3. Correlations
4. Discussion
Supplementary Materials
Author Contributions
Funding
Institutional Review Board Statement
Informed Consent Statement
Data Availability Statement
Conflicts of Interest
Abbreviations
References
- Fernandes, J.C. The GBD 2015 Obesity Collaborators. Health Effects of Overweight and Obesity in 195 Countries over 25 Years. N. Engl. J. Med. 2017, 377, 13–27. [Google Scholar] [CrossRef]
- Finkelstein, E.A.; Khavjou, O.A.; Thompson, H.; Trogdon, J.G.; Pan, L.; Sherry, B.; Dietz, W. Obesity and Severe Obesity Forecasts Through 2030. Am. J. Prev. Med. 2012, 42, 563–570. [Google Scholar] [CrossRef]
- Formiguera, X.; Cantón, A. Obesity: Epidemiology and clinical aspects. Best Pr. Res. Clin. Gastroenterol. 2004, 18, 1125–1146. [Google Scholar] [CrossRef]
- Johnstone, A.M.; Horgan, G.W.; Murison, S.D.; Bremner, D.M.; Lobley, G.E. Effects of a high-protein ketogenic diet on hunger, appetite, and weight loss in obese men feeding ad libitum. Am. J. Clin. Nutr. 2008, 87, 44–55. [Google Scholar] [CrossRef] [Green Version]
- A Parry, S.; Hodson, L. Influence of dietary macronutrients on liver fat accumulation and metabolism. J. Investig. Med. 2017, 65, 1102–1115. [Google Scholar] [CrossRef] [PubMed]
- Must, A.; Strauss, R. Risks and consequences of childhood and adolescent obesity. Int. J. Obes. 1999, 23, S2–S11. [Google Scholar] [CrossRef]
- Luukkonen, P.K.; Sädevirta, S.; Zhou, Y.; Kayser, B.; Ali, A.; Ahonen, L.; Lallukka, S.; Pelloux, V.; Gaggini, M.; Jian, C.; et al. Saturated Fat Is More Metabolically Harmful for the Human Liver Than Unsaturated Fat or Simple Sugars. Diabetes Care 2018, 41, 1732–1739. [Google Scholar] [CrossRef] [Green Version]
- Garbow, J.R.; Doherty, J.M.; Schugar, R.C.; Travers, S.; Weber, M.L.; Wentz, A.E.; Ezenwajiaku, N.; Cotter, D.G.; Brunt, E.M.; Crawford, P.A. Hepatic steatosis, inflammation, and ER stress in mice maintained long term on a very low-carbohydrate ketogenic diet. Am. J. Physiol. Liver Physiol. 2011, 300, G956–G967. [Google Scholar] [CrossRef]
- Zhang, X.; Qin, J.; Zhao, Y.; Shi, J.; Lan, R.; Gan, Y.; Ren, H.; Zhu, B.; Qian, M.; Du, B. Long-term ketogenic diet contributes to glycemic control but promotes lipid accumulation and hepatic steatosis in type 2 diabetic mice. Nutr. Res. 2016, 36, 349–358. [Google Scholar] [CrossRef] [PubMed]
- Douris, N.; Melman, T.; Pecherer, J.M.; Pissios, P.; Flier, J.S.; Cantley, L.C.; Locasale, J.W.; Maratos-Flier, E. Adaptive changes in amino acid metabolism permit normal longevity in mice consuming a low-carbohydrate ketogenic diet. Biochim. Biophys. Acta (BBA) Mol. Basis Dis. 2015, 1852, 2056–2065. [Google Scholar] [CrossRef] [Green Version]
- Watanabe, M.; Singhal, G.; Fisher, F.M.; Beck, T.C.; Morgan, D.A.; Socciarelli, F.; Mather, M.L.; Risi, R.; Bourke, J.; Rahmouni, K.; et al. Liver-derived FGF21 is essential for full adaptation to ketogenic diet but does not regulate glucose homeostasis. Endocr. 2019, 67, 95–108. [Google Scholar] [CrossRef]
- Kang, H.C.; Chung, D.E.; Kim, D.W.; Kim, H.D. Early- and Late-onset Complications of the Ketogenic Diet for Intractable Epilepsy. Epilepsia 2004, 45, 1116–1123. [Google Scholar] [CrossRef]
- Stevens, C.E.; Turner, Z.; Kossoff, E.H. Hepatic Dysfunction as a Complication of Combined Valproate and Ketogenic Diet. Pediatr. Neurol. 2016, 54, 82–84. [Google Scholar] [CrossRef]
- Mardinoglu, A.; Wu, H.; Bjornson, E.; Zhang, C.; Hakkarainen, A.; Räsänen, S.M.; Lee, S.; Mancina, R.M.; Bergentall, M.; Pietiläinen, K.H.; et al. An Integrated Understanding of the Rapid Metabolic Benefits of a Carbohydrate-Restricted Diet on Hepatic Steatosis in Humans. Cell Metab. 2018, 27, 559–571.e5. [Google Scholar] [CrossRef] [Green Version]
- Donnelly, K.L.; Smith, C.I.; Schwarzenberg, S.J.; Jessurun, J.; Boldt, M.D.; Parks, E.J. Sources of fatty acids stored in liver and secreted via lipoproteins in patients with nonalcoholic fatty liver disease. J. Clin. Investig. 2005, 115, 1343–1351. [Google Scholar] [CrossRef] [PubMed] [Green Version]
- Luukkonen, P.K.; Dufour, S.; Lyu, K.; Zhang, X.-M.; Hakkarainen, A.; Lehtimäki, T.E.; Cline, G.W.; Petersen, K.F.; Shulman, G.I.; Yki-Järvinen, H. Effect of a ketogenic diet on hepatic steatosis and hepatic mitochondrial metabolism in nonalcoholic fatty liver disease. Proc. Natl. Acad. Sci. USA 2020, 117, 7347–7354. [Google Scholar] [CrossRef] [PubMed] [Green Version]
- Yki-Järvinen, H. Nutritional Modulation of Non-Alcoholic Fatty Liver Disease and Insulin Resistance. Nutrients 2015, 7, 9127–9138. [Google Scholar] [CrossRef] [PubMed] [Green Version]
- Haufe, S.; Engeli, S.; Kast, P.; Böhnke, J.; Utz, W.; Haas, V.; Hermsdorf, M.; Mähler, A.; Wiesner, S.; Birkenfeld, A.L.; et al. Randomized comparison of reduced fat and reduced carbohydrate hypocaloric diets on intrahepatic fat in overweight and obese human subjects. Hepatology 2011, 53, 1504–1514. [Google Scholar] [CrossRef] [PubMed]
- Tendler, D.; Lin, S.; Yancy, W.S., Jr.; Mavropoulos, J.; Sylvestre, P.; Rockey, D.C.; Westman, E.C. The Effect of a Low-Carbohydrate, Ketogenic Diet on Nonalcoholic Fatty Liver Disease: A Pilot Study. Dig. Dis. Sci. 2007, 52, 589–593. [Google Scholar] [CrossRef] [PubMed]
- A LaFountain, R.; Miller, V.J.; Barnhart, E.C.; Hyde, P.N.; Crabtree, C.D.; McSwiney, F.T.; Beeler, M.K.; Buga, A.; Sapper, T.N.; A Short, J.; et al. Extended Ketogenic Diet and Physical Training Intervention in Military Personnel. Mil. Med. 2019, 184, e538–e547. [Google Scholar] [CrossRef]
- Hyde, P.N.; Sapper, T.N.; Crabtree, C.D.; LaFountain, R.A.; Bowling, M.L.; Buga, A.; Fell, B.; McSwiney, F.T.; Dickerson, R.M.; Miller, V.J.; et al. Dietary carbohydrate restriction improves metabolic syndrome independent of weight loss. JCI Insight 2019, 4. [Google Scholar] [CrossRef] [PubMed] [Green Version]
- Kirk, E.; Reeds, D.N.; Finck, B.N.; Mayurranjan, M.S.; Patterson, B.W.; Klein, S. Dietary Fat and Carbohydrates Differentially Alter Insulin Sensitivity During Caloric Restriction. Gastroenterol. 2009, 136, 1552–1560. [Google Scholar] [CrossRef] [PubMed] [Green Version]
- Browning, J.D.; A Baker, J.; Rogers, T.; Davis, J.; Satapati, S.; Burgess, S.C. Short-term weight loss and hepatic triglyceride reduction: Evidence of a metabolic advantage with dietary carbohydrate restriction. Am. J. Clin. Nutr. 2011, 93, 1048–1052. [Google Scholar] [CrossRef] [PubMed]
- Cunha, G.; De Mello, L.L.C.; Hasenstab, K.; Spina, L.; Bussade, I.; Mesiano, J.M.P.; Coutinho, W.; Guzman, G.; Sajoux, I. MRI estimated changes in visceral adipose tissue and liver fat fraction in patients with obesity during a very low-calorie-ketogenic diet compared to a standard low-calorie diet. Clin. Radiol. 2020, 75, 526–532. [Google Scholar] [CrossRef]
- Watanabe, M.; Tozzi, R.; Risi, R.; Tuccinardi, D.; Mariani, S.; Basciani, S.; Spera, G.; Lubrano, C.; Gnessi, L. Beneficial effects of the ketogenic diet on nonalcoholic fatty liver disease: A comprehensive review of the literature. Obes. Rev. 2020, 21, e13024. [Google Scholar] [CrossRef] [PubMed] [Green Version]
- Stubbs, B.J.; Cox, P.J.; Evans, R.D.; Santer, P.; Miller, J.J.; Faull, O.K.; Magor-Elliott, S.; Hiyama, S.; Stirling, M.; Clarke, K. On the Metabolism of Exogenous Ketones in Humans. Front. Physiol. 2017, 8, 848. [Google Scholar] [CrossRef]
- Egan, B. The glucose-lowering effects of exogenous ketones: Is there therapeutic potential? J. Physiol. 2018, 596, 1317–1318. [Google Scholar] [CrossRef] [PubMed]
- Idilman, I.S.; Aniktar, H.; Idilman, R.; Kabacam, G.; Savas, B.; Elhan, A.; Celik, A.; Bahar, K.; Karcaaltincaba, M. Hepatic Steatosis: Quantification by Proton Density Fat Fraction with MR Imaging versus Liver Biopsy. Radiology 2013, 267, 767–775. [Google Scholar] [CrossRef]
- Buga, A.; Kackley, M.L.; Crabtree, C.D.; Sapper, T.N.; McCabe, L.; Fell, B.; LaFountain, R.A.; Hyde, P.N.; Martini, E.R.; Bowman, J.; et al. The Effects of a Six-Week Controlled, Hypocaloric Ketogenic Diet, with and without Exogenous Ketone Salts, on Body Composition Responses. Front. Nutr. 2021, 8, 106. [Google Scholar] [CrossRef]
- US Department of Agriculture and Department of Health and Human Services. 2015–2020 Dietary Guidelines for Americans; US Department of Agriculture and Department of Health and Human Services: Washington, DC, USA, 2015. [Google Scholar]
- O’Connor, A.; Chang, J.-L.; Brownlow, M.; Contractor, N. Acute oral intake of beta-hydroxybutyrate in a pilot study transiently increased its capillary levels in healthy volunteers. J. Nutr. Heal. Food Eng. 2018, 8, 1. [Google Scholar] [CrossRef] [Green Version]
- Chen, L.-M.; Huang, J.-F.; Chen, Q.-S.; Lin, G.-F.; Zeng, H.-X.; Lin, X.-F.; Lin, X.-J.; Lin, L.; Lin, Q.-C. Validation of fatty liver index and hepatic steatosis index for screening of non-alcoholic fatty liver disease in adults with obstructive sleep apnea hypopnea syndrome. Chin. Med. J. 2019, 132, 2670–2676. [Google Scholar] [CrossRef]
- Hernando, D.; Haldar, J.P.; Sutton, B.P.; Ma, J.; Kellman, P.; Liang, Z.-P. Joint estimation of water/fat images and field inhomogeneity map. Magn. Reson. Med. 2008, 59, 571–580. [Google Scholar] [CrossRef] [Green Version]
- Springer, F. Liver fat content determined by magnetic resonance imaging and spectroscopy. World J. Gastroenterol. 2010, 16, 1560–1566. [Google Scholar] [CrossRef] [PubMed]
- Crabtree, C.D.; LaFountain, R.A.; Hyde, P.N.; Chen, C.; Pan, Y.; Lamba, N.; Sapper, T.N.; Short, J.A.; Kackley, M.L.; Buga, A.; et al. Quantification of Human Central Adipose Tissue Depots: An Anatomically Matched Comparison Between DXA and MRI. Tomography 2019, 5, 358–366. [Google Scholar] [CrossRef]
- Mitra, V.; Metcalf, J. Functional anatomy and blood supply of the liver. Anaesth. Intensiv. Care Med. 2012, 13, 52–53. [Google Scholar] [CrossRef]
- Dulai, P.S.; Sirlin, C.B.; Loomba, R. MRI and MRE for non-invasive quantitative assessment of hepatic steatosis and fibrosis in NAFLD and NASH: Clinical trials to clinical practice. J. Hepatol. 2016, 65, 1006–1016. [Google Scholar] [CrossRef] [Green Version]
- Regnell, S.E.; Peterson, P.; Trinh, L.; Broberg, P.; Leander, P.; Lernmark, Å; Månsson, S.; Larsson, H.E. Magnetic resonance imaging reveals altered distribution of hepatic fat in children with type 1 diabetes compared to controls. Metabolism 2015, 64, 872–878. [Google Scholar] [CrossRef] [PubMed]
- Sofue, K.; Mileto, A.; Dale, B.M.; Zhong, X.; Bashir, M.R. Interexamination repeatability and spatial heterogeneity of liver iron and fat quantification using MRI-based multistep adaptive fitting algorithm. J. Magn. Reson. Imaging 2015, 42, 1281–1290. [Google Scholar] [CrossRef] [PubMed]
- Bonekamp, S.; Tang, A.; Mashhood, A.; Wolfson, T.; Bs, C.C.; Middleton, M.S.; Clark, L.; Gamst, A.; Loomba, R.; Sirlin, C.B. Spatial distribution of MRI-determined hepatic proton density fat fraction in adults with nonalcoholic fatty liver disease. J. Magn. Reson. Imaging 2014, 39, 1525–1532. [Google Scholar] [CrossRef] [PubMed] [Green Version]
- Browning, J.D.; Szczepaniak, L.S.; Dobbins, R.; Nuremberg, P.; Horton, J.D.; Cohen, J.C.; Grundy, S.M.; Hobbs, H.H. Prevalence of hepatic steatosis in an urban population in the United States: Impact of ethnicity. Hepatology 2004, 40, 1387–1395. [Google Scholar] [CrossRef] [PubMed]
- Angulo, P. Obesity and Nonalcoholic Fatty Liver Disease. Nutr. Rev. 2008, 65, S57–S63. [Google Scholar] [CrossRef] [PubMed]
- Fierbinteanu-Braticevici, C.; Baicus, C.; Tribus, L.; Papacocea, R. Predictive factors for nonalcoholic steatohepatitis (NASH) in patients with nonalcoholic fatty liver disease (NAFLD). J. Gastrointest. Liver Dis. 2011, 20, 153–159. [Google Scholar]
- Angulo, P.; Hui, J.M.; Marchesini, G.; Bugianesi, E.; George, J.; Farrell, G.C.; Enders, F.; Saksena, S.; Burt, A.D.; Bida, J.P.; et al. The NAFLD fibrosis score: A noninvasive system that identifies liver fibrosis in patients with NAFLD. Hepatology 2007, 45, 846–854. [Google Scholar] [CrossRef] [PubMed]
- McCullough, A.J. The clinical features, diagnosis and natural history of nonalcoholic fatty liver disease. Clin. Liver Dis. 2004, 8, 521–533. [Google Scholar] [CrossRef] [PubMed]
- Pantsari, M.W.; Harrison, S.A. Nonalcoholic Fatty Liver Disease Presenting With an Isolated Elevated Alkaline Phosphatase. J. Clin. Gastroenterol. 2006, 40, 633–635. [Google Scholar] [CrossRef] [PubMed]
- Ali, R.; Cusi, K. New diagnostic and treatment approaches in non-alcoholic fatty liver disease (NAFLD). Ann. Med. 2009, 41, 265–278. [Google Scholar] [CrossRef] [PubMed]
- Hines, C.D.; Frydrychowicz, A.; Hamilton, G.; Tudorascu, D.L.; Vigen, K.K.; Yu, H.; McKenzie, C.A.; Sirlin, C.B.; Brittain, J.H.; Reeder, S.B. T1 independent, T2* corrected chemical shift based fat-water separation with multi-peak fat spectral modeling is an accurate and precise measure of hepatic steatosis. J. Magn. Reson. Imaging 2011, 33, 873–881. [Google Scholar] [CrossRef] [PubMed] [Green Version]
- Mohamadnejad, M.; Pourshams, A.; Malekzadeh, R.; Mohamadkhani, A.; Rajabiani, A.; Asgari, A.A.; Alimohamadi, S.M.; Razjooyan, H.; Mamar-Abadi, M. Healthy ranges of serum alanine aminotransferase levels in Iranian blood donors. World J. Gastroenterol. 2003, 9, 2322–2324. [Google Scholar] [CrossRef]
- Kang, H.S.; Um, S.H.; Seo, Y.S.; An, H.; Lee, K.G.; Hyun, J.J.; Kim, E.S.; Park, S.C.; Keum, B.; Kim, J.H.; et al. Healthy range for serum ALT and the clinical significance of “unhealthy” normal ALT levels in the Korean population. J. Gastroenterol. Hepatol. 2010, 26, 292–299. [Google Scholar] [CrossRef]
- Clark, J.M.; Brancati, F.L.; Diehl, A.M. The prevalence and etiology of elevated aminotransferase levels in the United States. Am. J. Gastroenterol. 2003, 98, 960–967. [Google Scholar] [CrossRef]
- Patel, J.; Bettencourt, R.; Cui, J.; Salotti, J.; Hooker, J.; Bhatt, A.; Hernandez, C.; Nguyen, P.; Aryafar, H.; Valasek, M.; et al. Association of noninvasive quantitative decline in liver fat content on MRI with histologic response in nonalcoholic steatohepatitis. Ther. Adv. Gastroenterol. 2016, 9, 692–701. [Google Scholar] [CrossRef] [PubMed] [Green Version]


| Baseline Characteristic | KD + KS (n = 12) | KD + PL (n = 13) | LFD (n = 12) | p-Value | ||||||
|---|---|---|---|---|---|---|---|---|---|---|
| Sex (male/female) | 6/6 | 6/7 | 6/6 | |||||||
| Age (years) | 35 | ± | 3 | 35 | ± | 3 | 35 | ± | 3 | 0.99 |
| Weight (kg) | 90.4 | ± | 3.4 | 94.1 | ± | 3.2 | 92.4 | ± | 3.4 | 0.73 |
| BMI (kg/m2) | 30.6 | ± | 0.7 | 31.8 | ± | 0.7 | 30.9 | ± | 0.7 | 0.50 |
| PAQ (mets*min/week) | 1182 | ± | 269 | 1168 | ± | 268 | 1167 | ± | 208 | 0.99 |
| DXA FM (kg) | 31.1 | ± | 1.5 | 34.5 | ± | 2.3 | 33.4 | ± | 2.4 | 0.52 |
| Baseline Liver Fat (%) | 4.7 | ± | 3.8 | 5.5 | ± | 6.2 | 4.1 | ± | 2.6 | 0.72 |
| Capillary Ketones (mmol/L βHB) | 0.18 | ± | 0.03 | 0.18 | ± | 0.04 | 0.13 | ± | 0.02 | 0.40 |
| Nutrient | KD + KS | KD + PL | LFD | ||||||
|---|---|---|---|---|---|---|---|---|---|
| Energy (kcal) | 1845 | ± | 102 | 1752 | ± | 98 | 1900 | ± | 102 |
| Protein (g) | 99 | ± | 3 | 100 | ± | 3 | 100 | ± | 3 |
| Carbohydrate (g) | 40 | ± | 8 a | 38 | ± | 7 a | 259 | ± | 8 b |
| Sugar (g) | 17 | ± | 3 a | 17 | ± | 3 a | 101 | ± | 3 b |
| Fiber (g) | 10 | ± | 1 a | 10 | ± | 1 a | 34 | ± | 1 b |
| Added Sugars (g) | <25 g/day | ||||||||
| Fat (g) | 143 | ± | 9 a | 131 | ± | 8 a | 51 | ± | 9 b |
| SFA (g) | 63 | ± | 4 a | 63 | ± | 4 a | 17 | ± | 4 b |
| MUFA (g) | 38 | ± | 3 a | 38 | ± | 3 a | 10 | ± | 3 b |
| PUFA (g) | 8 | ± | 1 | 8 | ± | 1 | 7 | ± | 1 |
| Cholesterol (g) | 414 | ± | 27 a | 402 | ± | 26 a | 154 | ± | 27 b |
| Sodium (mg) | 6100 | ± | 32 a | 2351 | ± | 30 b | 1974 | ± | 31 c |
| Potassium (mg) | 2211 | ± | 73 a | 2243 | ± | 75 a | 2758 | ± | 78 b |
| Calcium (mg) | 2001 | ± | 36 a | 880 | ± | 34 b | 1008 | ± | 35 c |
| Timepoint | 3 × 2 ANOVA Effects | |||||||||
|---|---|---|---|---|---|---|---|---|---|---|
| Category | Diet | WK0 | WK6 | Time | Group | Group* Time | ||||
| Serum Biomarkers | ||||||||||
| AST (U/L) | KD + KS | 19.7 | ± | 1.40 | 18.0 | ± | 1.63 | 0.32 | 0.26 | 0.70 |
| KD + PL | 18.9 | ± | 1.67 | 18.8 | ± | 1.75 | ||||
| LFD | 24.2 | ± | 1.75 | 21.3 | ± | 1.73 | ||||
| ALT (U/L) | KD + KS | 23.2 | ± | 3.30 | 21.3 | ± | 2.90 | 0.72 | 0.74 | 0.49 |
| KD + PL | 21.0 | ± | 3.67 | 22.5 | ± | 3.41 | ||||
| LFD | 28.3 | ± | 4.51 | 20.9 | ± | 2.06 | ||||
| AST/ALT Ratio | KD + KS | 0.96 | ± | 0.08 | 0.94 | ± | 0.08 | 0.51 | 0.30 | 0.40 |
| KD + PL | 1.07 | ± | 0.11 | 0.96 | ± | 0.11 | ||||
| LFD | 0.99 | ± | 0.09 | 1.10 | ± | 0.11 | ||||
| HOMA-IR | KD + KS | 2.58 | ± | 0.59 | 1.45 | ± | 0.26 | <0.001 * | 0.45 | 0.99 |
| KD + PL | 2.68 | ± | 0.58 | 1.42 | ± | 0.29 | ||||
| LFD | 3.15 | ± | 0.39 | 1.96 | ± | 0.40 | ||||
| Bilirubin (U/L) | KD + KS | 0.54 | ± | 0.06 | 0.55 | ± | 0.06 | 0.39 | 0.45 | 0.54 |
| KD + PL | 0.73 | ± | 0.16 | 0.71 | ± | 0.18 | ||||
| LFD | 0.64 | ± | 0.07 | 0.78 | ± | 0.12 | ||||
| ALP (U/L) | KD + KS | 60.8 | ± | 3.52 | 48.4 | ± | 2.38 | <0.001 * | 0.55 | 0.21 |
| KD + PL | 63.3 | ± | 7.30 | 55.6 | ± | 4.64 | ||||
| LFD | 62.7 | ± | 5.48 | 57.5 | ± | 5.37 | ||||
| Albumin (mg/dL) | KD + KS | 4.38 | ± | 0.06 | 4.49 | ± | 0.09 | 0.044 * | 0.16 | 0.15 |
| KD + PL | 4.41 | ± | 0.09 | 4.59 | ± | 0.11 | ||||
| LFD | 4.57 | ± | 0.09 | 4.55 | ± | 0.10 | ||||
| Glucose (mg/dL) | KD + KS | 94.0 | ± | 6.00 | 88.0 | ± | 3.0 | 0.035 * | 0.87 | 0.16 |
| KD + PL | 99.0 | ± | 4.00 | 84.0 | ± | 4.0 | ||||
| LFD | 92.0 | ± | 3.00 | 93.0 | ± | 2.0 | ||||
| Ketones (mmol/L BHB) | KD + KS | 0.18 | ± | 0.03 | 1.36 | ± | 0.28 a | <0.001 * | <0.001 * | <0.001 * |
| KD + PL | 0.18 | ± | 0.04 | 1.12 | ± | 0.12 a | ||||
| LFD | 0.13 | ± | 0.02 | 0.21 | ± | 0.03 b | ||||
| HSI | KD + KS | 39.5 | ± | 4.00 | 36.7 | ± | 3.23 | <0.001 * | 0.64 | 0.04 * |
| KD + PL | 41.5 | ± | 5.30 | 37.9 | ± | 5.77 | ||||
| LFD | 39.5 | ± | 3.18 | 38.6 | ± | 3.78 | ||||
| Anthropometry | ||||||||||
| Weight (kg) | KD + KS | 90.4 | ± | 3.7 | 83.1 | ± | 3.2 | <0.001 * | 0.46 | 0.21 |
| KD + PL | 94.1 | ± | 2.8 | 86.1 | ± | 2.8 | ||||
| LFD | 92.4 | ± | 3.4 | 86.3 | ± | 3.8 | ||||
| DXA FM (kg) | KD + KS | 31.1 | ± | 1.5 | 26.4 | ± | 1.4 | <0.001 * | 0.94 | 0.34 |
| KD + PL | 34.5 | ± | 2.3 | 30.2 | ± | 2.2 | ||||
| LFD | 33.4 | ± | 2.4 | 29.2 | ± | 2.5 | ||||
| RMR (kcal/day) | KD + KS | 1885 | ± | 120 | 1653 | ± | 74 | <0.001 * | 0.59 | 0.36 |
| KD + PL | 1739 | ± | 94 | 1604 | ± | 81 | ||||
| LFD | 1704 | ± | 44 | 1591 | ± | 102 | ||||
| RER (VCO2/VO2) | KD + KS | 0.83 | ± | 0.01 | 0.77 | ± | 0.01 a | <0.001 * | <0.001 * | 0.68 |
| KD + PL | 0.86 | ± | 0.02 | 0.78 | ± | 0.01 a | ||||
| LFD | 0.88 | ± | 0.02 | 0.85 | ± | 0.01 b | ||||
| Timepoint | 3 × 2 ANOVA Effects | |||||||||
|---|---|---|---|---|---|---|---|---|---|---|
| Category | Diet | WK0 | WK6 | Time | Group | Group* Time | ||||
| Serum Biomarkers | ||||||||||
| AST (U/L) | KD | 21.4 | ± | 1.60 | 17.9 | ± | 1.87 | 0.10 | 0.024 * | 0.71 |
| LFD | 27.6 | ± | 2.16 | 22.8 | ± | 1.93 | ||||
| ALT (U/L) | KD | 34.3 | ± | 4.68 | 24.0 | ± | 2.96 | 0.06 | 0.33 | 0.55 |
| LFD | 40.4 | ± | 6.95 | 25.4 | ± | 2.93 | ||||
| AST/ALT Ratio | KD | 0.70 | ± | 0.12 | 0.77 | ± | 0.08 | 0.26 | 0.57 | 0.45 |
| LFD | 0.73 | ± | 0.08 | 0.93 | ± | 0.11 | ||||
| HOMA-IR | KD | 4.56 | ± | 0.90 | 1.48 | ± | 0.54 | 0.03 * | 0.94 | 0.21 |
| LFD | 3.45 | ± | 1.06 | 2.46 | ± | 0.64 | ||||
| Bilirubin (U/L) | KD | 0.51 | ± | 0.06 | 0.49 | ± | 0.06 | 0.16 | 0.10 | 0.06 |
| LFD | 0.64 | ± | 0.07 | 0.98 | ± | 0.25 | ||||
| ALP (U/L) | KD | 61.4 | ± | 6.1 | 52.3 | ± | 3.60 | 0.01 * | 0.25 | 0.98 |
| LFD | 76.6 | ± | 10.0 | 66.6 | ± | 10.7 | ||||
| Albumin (mg/dL) | KD | 4.44 | ± | 0.12 | 4.53 | ± | 0.07 | 0.53 | 0.42 | 0.86 |
| LFD | 4.64 | ± | 0.18 | 4.70 | ± | 0.21 | ||||
| Glucose (mg/dL) | KD | 97.3 | ± | 6.2 | 84.7 | ± | 2.81 | 0.35 | 0.45 | 0.21 |
| LFD | 84.8 | ± | 6.6 | 86.2 | ± | 3.34 | ||||
| Ketones (mmol/L BHB) | KD | 0.36 | ± | 0.12 | 1.59 | ± | 0.33 | 0.002 * | 0.02 * | 0.004 * |
| LFD | 0.09 | ± | 0.01 | 0.17 | ± | 0.02 | ||||
| HSI | KD | 37.9 | ± | 4.90 | 35.8 | ± | 3.50 | 0.20 | 0.56 | 0.07 |
| LFD | 37.8 | ± | 1.80 | 38.2 | ± | 0.02 | ||||
| Anthropometry | ||||||||||
| Weight (kg) | KD | 98.3 | ± | 3.6 | 89.9 | ± | 2.66 | <0.001 * | 0.78 | 0.10 |
| LFD | 94.4 | ± | 7.8 | 89.7 | ± | 8.84 | ||||
| DXA FM (kg) | KD | 75.1 | ± | 3.8 | 65.0 | ± | 3.48 | <0.001 * | 0.66 | 0.20 |
| LFD | 79.3 | ± | 8.2 | 71.8 | ± | 9.02 | ||||
| RMR (kcal/day) | KD | 2068 | ± | 111 | 1790 | ± | 119 | 0.16 | 0.23 | 0.39 |
| LFD | 1789 | ± | 132 | 1719 | ± | 140 | ||||
| RER (VCO2/VO2) | KD | 0.85 | ± | 0.02 | 0.76 | ± | 0.01 | 0.02 * | 0.02 * | 0.03 * |
| LFD | 0.87 | ± | 0.02 | 0.85 | ± | 0.01 | ||||
Publisher’s Note: MDPI stays neutral with regard to jurisdictional claims in published maps and institutional affiliations. |
© 2021 by the authors. Licensee MDPI, Basel, Switzerland. This article is an open access article distributed under the terms and conditions of the Creative Commons Attribution (CC BY) license (http://creativecommons.org/licenses/by/4.0/).
Share and Cite
Crabtree, C.D.; Kackley, M.L.; Buga, A.; Fell, B.; LaFountain, R.A.; Hyde, P.N.; Sapper, T.N.; Kraemer, W.J.; Scandling, D.; Simonetti, O.P.; et al. Comparison of Ketogenic Diets with and without Ketone Salts versus a Low-Fat Diet: Liver Fat Responses in Overweight Adults. Nutrients 2021, 13, 966. https://doi.org/10.3390/nu13030966
Crabtree CD, Kackley ML, Buga A, Fell B, LaFountain RA, Hyde PN, Sapper TN, Kraemer WJ, Scandling D, Simonetti OP, et al. Comparison of Ketogenic Diets with and without Ketone Salts versus a Low-Fat Diet: Liver Fat Responses in Overweight Adults. Nutrients. 2021; 13(3):966. https://doi.org/10.3390/nu13030966
Chicago/Turabian StyleCrabtree, Christopher D., Madison L. Kackley, Alexandru Buga, Brandon Fell, Richard A. LaFountain, Parker N. Hyde, Teryn N. Sapper, William J. Kraemer, Debbie Scandling, Orlando P. Simonetti, and et al. 2021. "Comparison of Ketogenic Diets with and without Ketone Salts versus a Low-Fat Diet: Liver Fat Responses in Overweight Adults" Nutrients 13, no. 3: 966. https://doi.org/10.3390/nu13030966
APA StyleCrabtree, C. D., Kackley, M. L., Buga, A., Fell, B., LaFountain, R. A., Hyde, P. N., Sapper, T. N., Kraemer, W. J., Scandling, D., Simonetti, O. P., & Volek, J. S. (2021). Comparison of Ketogenic Diets with and without Ketone Salts versus a Low-Fat Diet: Liver Fat Responses in Overweight Adults. Nutrients, 13(3), 966. https://doi.org/10.3390/nu13030966