
Socioeconomic Characteristics and Trends in the Consumption of Ultra-Processed Foods in Korea from 2010 to 2018


Abstract
:1. Introduction
2. Materials and Methods
2.1. Data Source and Study Population
2.2. Food Classification According to the NOVA Classification Criteria
2.3. Sociodemographic Variables
2.4. Statistical Analysis
3. Results
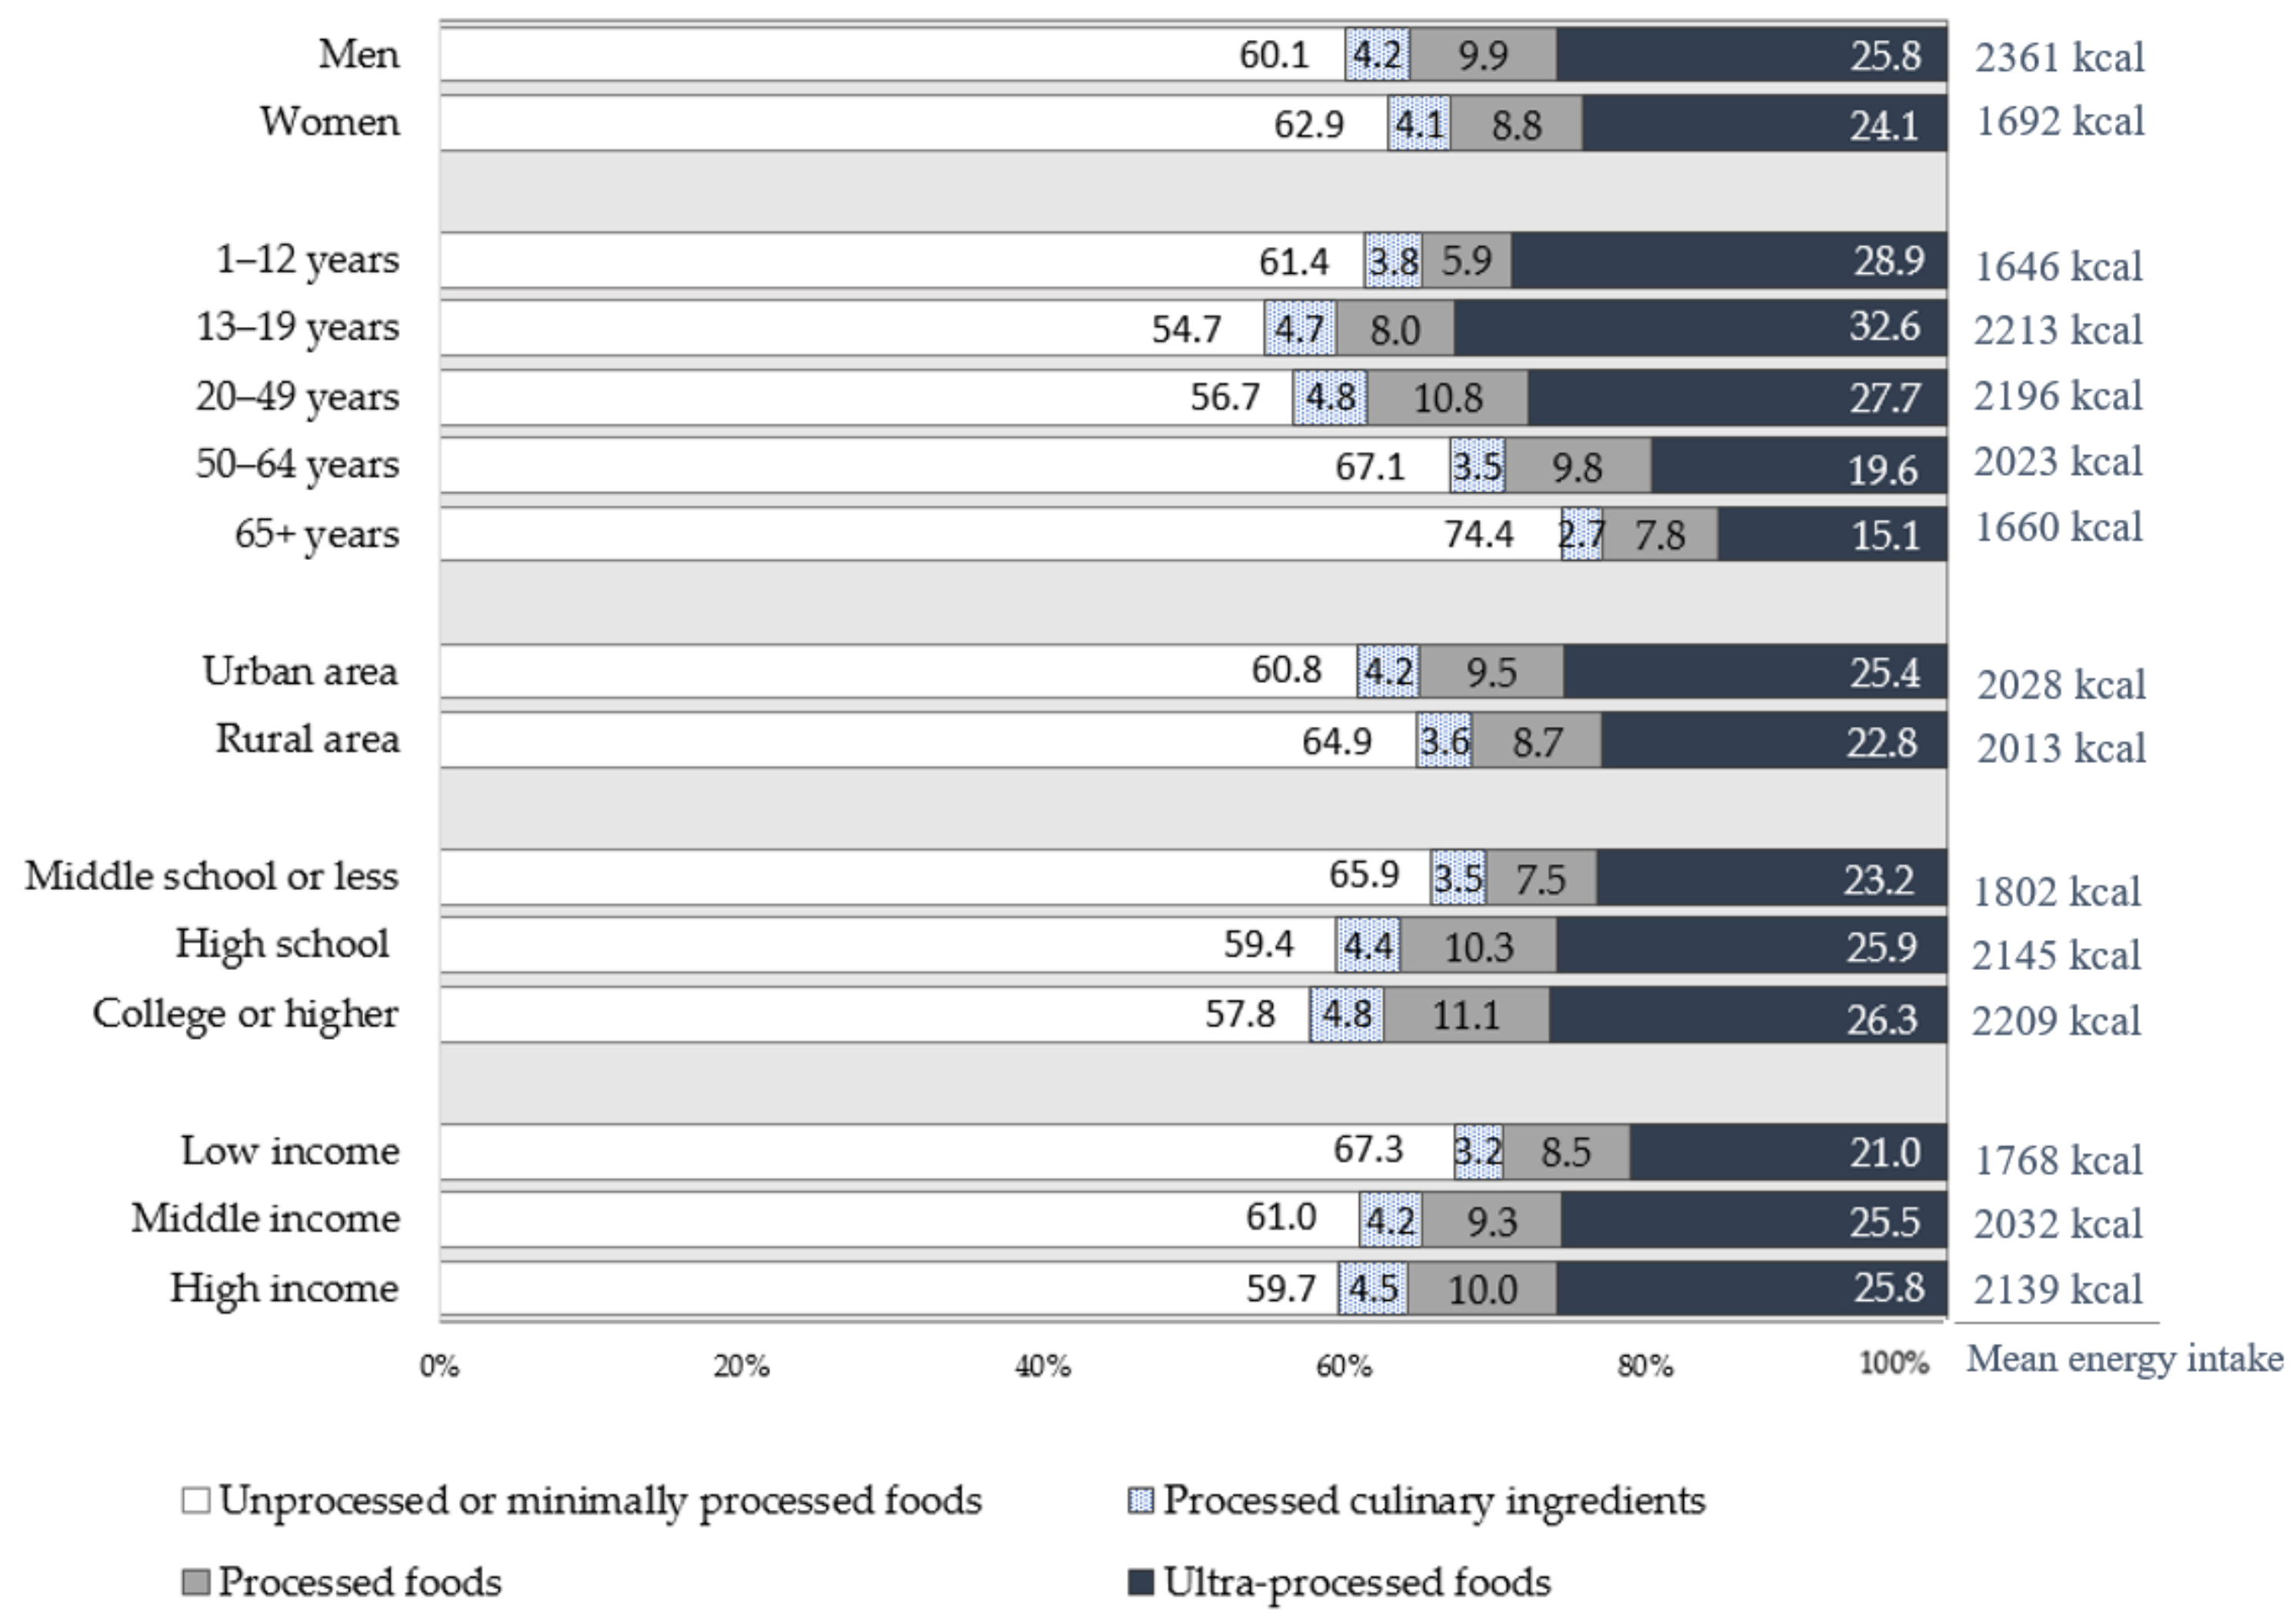
3.1. Dietary Energy Intake according to the NOVA Food Groups
3.2. Association between Socioeconomic Characteristics and the Dietary Contribution of Ultra-Processed Foods
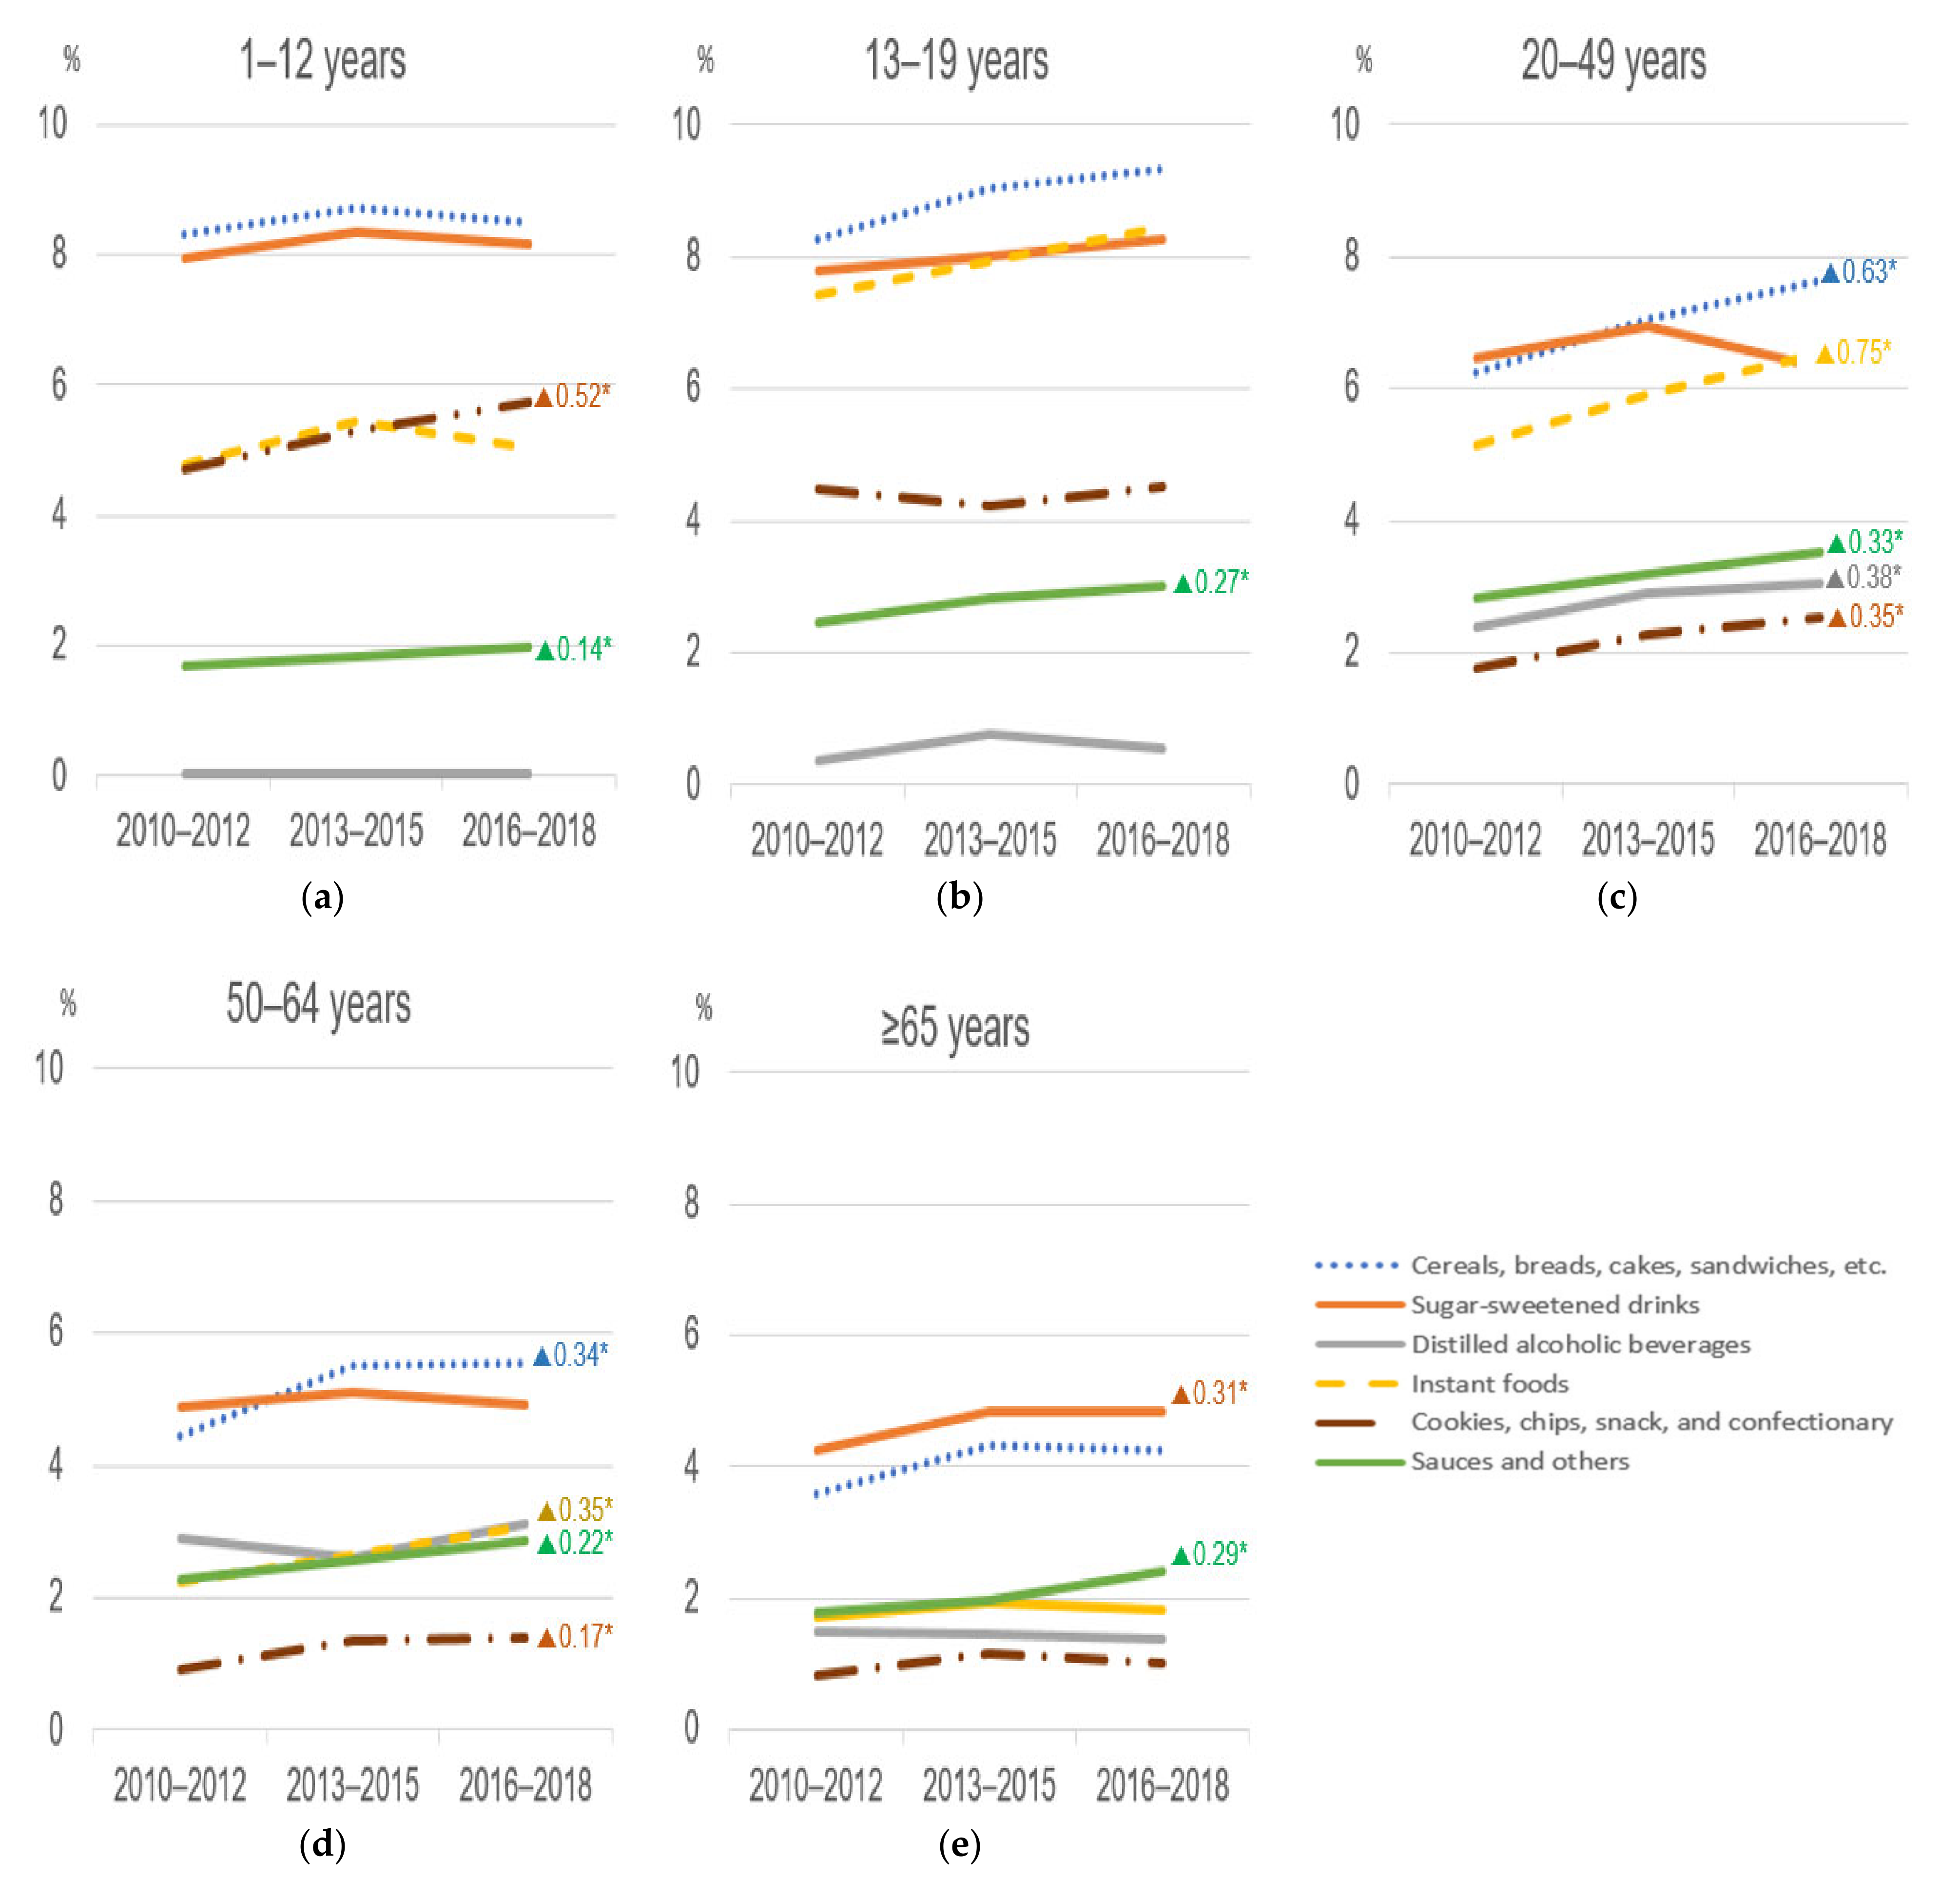
3.3. Time Trends in the Dietary Contribution of Ultra-Processed Foods
4. Discussion
5. Conclusions
Supplementary Materials
Author Contributions
Funding
Institutional Review Board Statement
Informed Consent Statement
Data Availability Statement
Conflicts of Interest
References
- Monteiro, C.A.; Cannon, G.; Levy, R.B.; Moubarac, J.C.; Louzada, M.L.; Rauber, F.; Khandpur, N.; Cediel, G.; Neri, D.; Martinez-Steele, E.; et al. Ultra-processed foods: What they are and how to identify them. Public Health Nutr. 2019, 22, 936–941. [Google Scholar] [CrossRef]
- Moodie, R.; Stuckler, D.; Monteiro, C.; Sheron, N.; Neal, B.; Thamarangsi, T.; Lincoln, P.; Casswell, S. Profits and pandemics: Prevention of harmful effects of tobacco, alcohol, and ultra-processed food and drink industries. Lancet 2013, 381, 670–679. [Google Scholar] [CrossRef]
- Moubarac, J.C.; Batal, M.; Louzada, M.L.; Martinez Steele, E.; Monteiro, C.A. Consumption of ultra-processed foods predicts diet quality in Canada. Appetite 2017, 108, 512–520. [Google Scholar] [CrossRef]
- Louzada, M.; Ricardo, C.Z.; Steele, E.M.; Levy, R.B.; Cannon, G.; Monteiro, C.A. The share of ultra-processed foods determines the overall nutritional quality of diets in Brazil. Public Health Nutr. 2018, 21, 94–102. [Google Scholar] [CrossRef] [PubMed] [Green Version]
- Fardet, A. Minimally processed foods are more satiating and less hyperglycemic than ultra-processed foods: A preliminary study with 98 ready-to-eat foods. Food Funct. 2016, 7, 2338–2346. [Google Scholar] [CrossRef] [PubMed]
- Laster, J.; Frame, L.A. Beyond the Calories-Is the Problem in the Processing? Curr. Treat. Options Gastroenterol. 2019, 17, 577–586. [Google Scholar] [CrossRef]
- Poti, J.M.; Braga, B.; Qin, B. Ultra-processed Food Intake and Obesity: What Really Matters for Health-Processing or Nutrient Content? Curr. Obes. Rep. 2017, 6, 420–431. [Google Scholar] [CrossRef]
- Monteiro, C.A.; Cannon, G.; Moubarac, J.C.; Levy, R.B.; Louzada, M.L.C.; Jaime, P.C. The UN Decade of Nutrition, the NOVA food classification and the trouble with ultra-processing. Public Health Nutr. 2018, 21, 5–17. [Google Scholar] [CrossRef] [Green Version]
- Schnabel, L.; Kesse-Guyot, E.; Alles, B.; Touvier, M.; Srour, B.; Hercberg, S.; Buscail, C.; Julia, C. Association Between Ultraprocessed Food Consumption and Risk of Mortality Among Middle-aged Adults in France. JAMA Intern. Med. 2019, 179, 490–498. [Google Scholar] [CrossRef]
- Julia, C.; Martinez, L.; Allès, B.; Touvier, M.; Hercberg, S.; Méjean, C.; Kesse-Guyot, E. Contribution of ultra-processed foods in the diet of adults from the French NutriNet-Santé study. Public Health Nutr. 2018, 21, 27–37. [Google Scholar] [CrossRef] [PubMed] [Green Version]
- Martínez Steele, E.; Popkin, B.M.; Swinburn, B.; Monteiro, C.A. The share of ultra-processed foods and the overall nutritional quality of diets in the US: Evidence from a nationally representative cross-sectional study. Popul. Health Metr. 2017, 15, 6. [Google Scholar] [CrossRef] [Green Version]
- Elizabeth, L.; Machado, P.; Zinöcker, M.; Baker, P.; Lawrence, M. Ultra-Processed Foods and Health Outcomes: A Narrative Review. Nutrients 2020, 12, 1955. [Google Scholar] [CrossRef]
- Srour, B.; Fezeu, L.K.; Kesse-Guyot, E.; Alles, B.; Debras, C.; Druesne-Pecollo, N.; Chazelas, E.; Deschasaux, M.; Hercberg, S.; Galan, P.; et al. Ultraprocessed Food Consumption and Risk of Type 2 Diabetes Among Participants of the NutriNet-Sante Prospective Cohort. JAMA Intern. Med. 2019, 180, 283–291. [Google Scholar] [CrossRef]
- Srour, B.; Fezeu, L.K.; Kesse-Guyot, E.; Allès, B.; Méjean, C.; Andrianasolo, R.M.; Chazelas, E.; Deschasaux, M.; Hercberg, S.; Galan, P.; et al. Ultra-processed food intake and risk of cardiovascular disease: Prospective cohort study (NutriNet-Santé). BMJ 2019, 365, l1451. [Google Scholar] [CrossRef] [Green Version]
- Vandevijvere, S.; Jaacks, L.M.; Monteiro, C.A.; Moubarac, J.C.; Girling-Butcher, M.; Lee, A.C.; Pan, A.; Bentham, J.; Swinburn, B. Global trends in ultraprocessed food and drink product sales and their association with adult body mass index trajectories. Obes. Rev. 2019, 20 (Suppl. S2), 10–19. [Google Scholar] [CrossRef]
- Baraldi, L.G.; Martinez Steele, E.; Canella, D.S.; Monteiro, C.A. Consumption of ultra-processed foods and associated sociodemographic factors in the USA between 2007 and 2012: Evidence from a nationally representative cross-sectional study. BMJ Open 2018, 8, e020574. [Google Scholar] [CrossRef] [Green Version]
- Rauber, F.; da Costa Louzada, M.L.; Steele, E.M.; Millett, C.; Monteiro, C.A.; Levy, R.B. Ultra-Processed Food Consumption and Chronic Non-Communicable Diseases-Related Dietary Nutrient Profile in the UK (2008–2014). Nutrients 2018, 10, 587. [Google Scholar] [CrossRef] [PubMed] [Green Version]
- Marrón-Ponce, J.A.; Flores, M.; Cediel, G.; Monteiro, C.A.; Batis, C. Associations between Consumption of Ultra-Processed Foods and Intake of Nutrients Related to Chronic Non-Communicable Diseases in Mexico. J. Acad. Nutr. Diet. 2019, 119, 1852–1865. [Google Scholar] [CrossRef] [PubMed]
- Khandpur, N.; Cediel, G.; Obando, D.A.; Jaime, P.C.; Parra, D.C. Sociodemographic factors associated with the consumption of ultra-processed foods in Colombia. Rev. Saude Publica 2020, 54, 19. [Google Scholar] [CrossRef] [PubMed] [Green Version]
- Baker, P.; Friel, S. Food systems transformations, ultra-processed food markets and the nutrition transition in Asia. Glob. Health 2016, 12, 80. [Google Scholar] [CrossRef] [Green Version]
- Baker, P.; Machado, P.; Santos, T.; Sievert, K.; Backholer, K.; Hadjikakou, M.; Russell, C.; Huse, O.; Bell, C.; Scrinis, G.; et al. Ultra-processed foods and the nutrition transition: Global, regional and national trends, food systems transformations and political economy drivers. Obes. Rev. 2020, 21, e13126. [Google Scholar] [CrossRef]
- Marrón-Ponce, J.A.; Tolentino-Mayo, L.; Hernández, F.M.; Batis, C. Trends in Ultra-Processed Food Purchases from 1984 to 2016 in Mexican Households. Nutrients 2018, 11, 45. [Google Scholar] [CrossRef] [Green Version]
- Moubarac, J.C.; Batal, M.; Martins, A.P.; Claro, R.; Levy, R.B.; Cannon, G.; Monteiro, C. Processed and ultra-processed food products: Consumption trends in Canada from 1938 to 2011. Can. J. Diet. Pract. Res. 2014, 75, 15–21. [Google Scholar] [CrossRef] [PubMed]
- Latasa, P.; Louzada, M.; Martinez Steele, E.; Monteiro, C.A. Added sugars and ultra-processed foods in Spanish households (1990–2010). Eur. J. Clin. Nutr. 2018, 72, 1404–1412. [Google Scholar] [CrossRef] [PubMed] [Green Version]
- Djupegot, I.L.; Nenseth, C.B.; Bere, E.; Bjørnarå, H.B.T.; Helland, S.H.; Øverby, N.C.; Torstveit, M.K.; Stea, T.H. The association between time scarcity, sociodemographic correlates and consumption of ultra-processed foods among parents in Norway: A cross-sectional study. BMC Public Health 2017, 17, 447. [Google Scholar] [CrossRef]
- Monteiro, C.A.; Moubarac, J.C.; Cannon, G.; Ng, S.W.; Popkin, B. Ultra-processed products are becoming dominant in the global food system. Obes. Rev. 2013, 14 (Suppl. S2), 21–28. [Google Scholar] [CrossRef]
- Martins, A.P.; Levy, R.B.; Claro, R.M.; Moubarac, J.C.; Monteiro, C.A. Increased contribution of ultra-processed food products in the Brazilian diet (1987–2009). Rev. Saude Publica 2013, 47, 656–665. [Google Scholar] [CrossRef]
- James, P.; Seward, M.W.; O’Malley, A.J.; Subramanian, S.V.; Block, J.P. Changes in the food environment over time: Examining 40 years of data in the Framingham Heart Study. Int. J. Behav. Nutr. Phys. Act. 2017, 14, 84. [Google Scholar] [CrossRef] [PubMed] [Green Version]
- Larson, N.I.; Neumark-Sztainer, D.R.; Story, M.T.; Wall, M.M.; Harnack, L.J.; Eisenberg, M.E. Fast food intake: Longitudinal trends during the transition to young adulthood and correlates of intake. J. Adolesc. Health 2008, 43, 79–86. [Google Scholar] [CrossRef]
- Deshmukh-Taskar, P.; Nicklas, T.A.; Yang, S.J.; Berenson, G.S. Does food group consumption vary by differences in socioeconomic, demographic, and lifestyle factors in young adults? The Bogalusa Heart Study. J. Am. Diet. Assoc. 2007, 107, 223–234. [Google Scholar] [CrossRef] [Green Version]
- Marrón-Ponce, J.A.; Sánchez-Pimienta, T.G.; Louzada, M.; Batis, C. Energy contribution of NOVA food groups and sociodemographic determinants of ultra-processed food consumption in the Mexican population. Public Health Nutr. 2018, 21, 87–93. [Google Scholar] [CrossRef] [Green Version]
- Cediel, G.; Reyes, M.; da Costa Louzada, M.L.; Martinez Steele, E.; Monteiro, C.A.; Corvalán, C.; Uauy, R. Ultra-processed foods and added sugars in the Chilean diet (2010). Public Health Nutr. 2018, 21, 125–133. [Google Scholar] [CrossRef] [Green Version]
- Shim, J.S.; Shim, S.Y.; Cha, H.J.; Kim, J.; Kim, H.C. Association between Ultra-Processed Food Consumption and Dietary Intake and Diet Quality in Korean Adults. J. Acad. Nutr. Diet. 2021. (Article is under review). [Google Scholar]
- Lee, H.S.; Duffey, K.J.; Popkin, B.M. South Korea’s entry to the global food economy: Shifts in consumption of food between 1998 and 2009. Asia Pac. J. Clin. Nutr. 2012, 21, 618–629. [Google Scholar] [PubMed]
- Kim, S.; Moon, S.; Popkin, B.M. The nutrition transition in South Korea. Am. J. Clin. Nutr. 2000, 71, 44–53. [Google Scholar] [CrossRef] [PubMed] [Green Version]
- Singh, G.M.; Micha, R.; Khatibzadeh, S.; Lim, S.; Ezzati, M.; Mozaffarian, D. Estimated Global, Regional, and National Disease Burdens Related to Sugar-Sweetened Beverage Consumption in 2010. Circulation 2015, 132, 639–666. [Google Scholar] [CrossRef] [Green Version]
- Kweon, S.; Kim, Y.; Jang, M.J.; Kim, Y.; Kim, K.; Choi, S.; Chun, C.; Khang, Y.H.; Oh, K. Data resource profile: The Korea National Health and Nutrition Examination Survey (KNHANES). Int. J. Epidemiol. 2014, 43, 69–77. [Google Scholar] [CrossRef] [PubMed] [Green Version]
- Korea Centers for Disease Control and Prevention. Korea Health Statistics 2018: Korea National Health and Nutrition Examination Survey (KNHANES-VII-3); Korea Centers for Disease Control and Prevention: Chungju City, Korea, 2019.
- Ministry of Health and Welfare; Korea Centers for Disease Control and Prevention. Guidelines for Nutrition Survey: Korea National Health and Nutrition Examination Survey 6th (2013–2015); Ministry of Health and Welfare: Sejong, Korea; Korea Centers for Disease Control and Prevention: Chungju City, Korea, 2015.
- National Institute of Agricultural Sciences. Korean Food Composition Table (Version 9.1); National Institute of Agricultural Sciences: Wanju-gun, Korea, 2019. [Google Scholar]
- Korea Centers for Disease Control and Prevention. 2016–2018 Guidelbook for Using the Data from Korea National Health and Nutrition Examination Survey; Korea Centers for Disease Control and Prevention: Chungju City, Korea, 2020.
- Adams, J.; White, M. Characterisation of UK diets according to degree of food processing and associations with socio-demographics and obesity: Cross-sectional analysis of UK National Diet and Nutrition Survey (2008–2012). Int. J. Behav. Nutr. Phys. Act. 2015, 12, 160. [Google Scholar] [CrossRef] [Green Version]
- Grzymisławska, M.; Puch, E.A.; Zawada, A.; Grzymisławski, M. Do nutritional behaviors depend on biological sex and cultural gender? Adv. Clin. Exp. Med. 2020, 29, 165–172. [Google Scholar] [CrossRef] [Green Version]
- Setyowati, D.; Andarwulan, N.; Giriwono, P.E. Processed and ultraprocessed food consumption pattern in the Jakarta Individual Food Consumption Survey 2014. Asia Pac. J. Clin. Nutr. 2018, 27, 840–847. [Google Scholar] [CrossRef]
- Ozcariz, S.G.I.; Pudla, K.J.; Martins, A.P.B.; Peres, M.A.; González-Chica, D.A. Sociodemographic disparities in the consumption of ultra-processed food and drink products in Southern Brazil: A population-based study. J. Public Health 2019, 27, 649–658. [Google Scholar] [CrossRef]
- Sadeghirad, B.; Duhaney, T.; Motaghipisheh, S.; Campbell, N.R.; Johnston, B.C. Influence of unhealthy food and beverage marketing on children’s dietary intake and preference: A systematic review and meta-analysis of randomized trials. Obes. Rev. 2016, 17, 945–959. [Google Scholar] [CrossRef]
- Silva, M.A.; Milagres, L.C.; Castro, A.P.P.; Filgueiras, M.S.; Rocha, N.P.; Hermsdorff, H.H.M.; Longo, G.Z.; Novaes, J.F. The consumption of ultra-processed products is associated with the best socioeconomic level of the children’s families. Cien. Saude Colet. 2019, 24, 4053–4060. [Google Scholar] [CrossRef] [PubMed] [Green Version]
- Simões, B.D.S.; Barreto, S.M.; Molina, M.; Luft, V.C.; Duncan, B.B.; Schmidt, M.I.; Benseñor, I.J.M.; Cardoso, L.O.; Levy, R.B.; Giatti, L. Consumption of ultra-processed foods and socioeconomic position: A cross-sectional analysis of the Brazilian Longitudinal Study of Adult Health (ELSA-Brasil). Cad. Saude Publica 2018, 34, e00019717. [Google Scholar] [CrossRef] [Green Version]
- Zagorsky, J.L.; Smith, P.K. The association between socioeconomic status and adult fast-food consumption in the U.S. Econ. Hum. Biol. 2017, 27, 12–25. [Google Scholar] [CrossRef]
- Machado, P.P.; Steele, E.M.; Levy, R.B.; Sui, Z.; Rangan, A.; Woods, J.; Gill, T.; Scrinis, G.; Monteiro, C.A. Ultra-processed foods and recommended intake levels of nutrients linked to non-communicable diseases in Australia: Evidence from a nationally representative cross-sectional study. BMJ Open 2019, 9, e029544. [Google Scholar] [CrossRef] [Green Version]
- Statistics Korea. Statics by Theme. Available online: https://kosis.kr/eng/ (accessed on 28 January 2021).
- Kim, S. Changes in Food Consumption in Korea; Food and Fertilizer Technology Center: Taipei, Taiwan, 2018. [Google Scholar]
- Mendonça, R.D.; Lopes, A.C.; Pimenta, A.M.; Gea, A.; Martinez-Gonzalez, M.A.; Bes-Rastrollo, M. Ultra-Processed Food Consumption and the Incidence of Hypertension in a Mediterranean Cohort: The Seguimiento Universidad de Navarra Project. Am. J. Hypertens. 2017, 30, 358–366. [Google Scholar] [CrossRef] [PubMed] [Green Version]
- Juul, F.; Martinez-Steele, E.; Parekh, N.; Monteiro, C.A.; Chang, V.W. Ultra-processed food consumption and excess weight among US adults. Br. J. Nutr. 2018, 120, 90–100. [Google Scholar] [CrossRef] [PubMed] [Green Version]
- Monteiro, C.A.; Moubarac, J.C.; Levy, R.B.; Canella, D.S.; Louzada, M.; Cannon, G. Household availability of ultra-processed foods and obesity in nineteen European countries. Public Health Nutr. 2018, 21, 18–26. [Google Scholar] [CrossRef] [PubMed] [Green Version]
- Nardocci, M.; Polsky, J.Y.; Moubarac, J.C. Consumption of ultra-processed foods is associated with obesity, diabetes and hypertension in Canadian adults. Can. J. Public Health 2020, 1–9. [Google Scholar] [CrossRef]
- Sandoval-Insausti, H.; Jiménez-Onsurbe, M.; Donat-Vargas, C.; Rey-García, J.; Banegas, J.R.; Rodríguez-Artalejo, F.; Guallar-Castillón, P. Ultra-Processed Food Consumption Is Associated with Abdominal Obesity: A Prospective Cohort Study in Older Adults. Nutrients 2020, 12, 2368. [Google Scholar] [CrossRef]
- Costa de Miranda, R.; Rauber, F.; Levy, R.B. Impact of ultra-processed food consumption on metabolic health. Curr. Opin. Lipidol. 2021, 32, 24–37. [Google Scholar] [CrossRef]
- Scaranni, P.; Cardoso, L.O.; Chor, D.; Melo, E.C.P.; Matos, S.M.A.; Giatti, L.; Barreto, S.M.; Fonseca, M. Ultra-processed foods, changes in blood pressure, and incidence of hypertension: Results of Brazilian Longitudinal Study of Adult Health (ELSA-Brasil). Public Health Nutr. 2021, 1–22. [Google Scholar] [CrossRef]
- Fiolet, T.; Srour, B.; Sellem, L.; Kesse-Guyot, E.; Allès, B.; Méjean, C.; Deschasaux, M.; Fassier, P.; Latino-Martel, P.; Beslay, M.; et al. Consumption of ultra-processed foods and cancer risk: Results from NutriNet-Santé prospective cohort. BMJ 2018, 360, k322. [Google Scholar] [CrossRef] [PubMed] [Green Version]
- Gourd, E. Ultra-processed foods might increase cancer risk. Lancet Oncol. 2018, 19, e186. [Google Scholar] [CrossRef]
- Bonaccio, M.; Di Castelnuovo, A.; Costanzo, S.; De Curtis, A.; Persichillo, M.; Sofi, F.; Cerletti, C.; Donati, M.B.; de Gaetano, G.; Iacoviello, L. Ultra-processed food consumption is associated with increased risk of all-cause and cardiovascular mortality in the Moli-sani Study. Am. J. Clin. Nutr. 2021, 113, 446–455. [Google Scholar] [CrossRef]
- Zhong, G.C.; Gu, H.T.; Peng, Y.; Wang, K.; Wu, Y.Q.; Hu, T.Y.; Jing, F.C.; Hao, F.B. Association of ultra-processed food consumption with cardiovascular mortality in the US population: Long-term results from a large prospective multicenter study. Int. J. Behav. Nutr. Phys. Act. 2021, 18, 21. [Google Scholar] [CrossRef]
- Schulte, E.M.; Avena, N.M.; Gearhardt, A.N. Which foods may be addictive? The roles of processing, fat content, and glycemic load. PLoS ONE 2015, 10, e0117959. [Google Scholar] [CrossRef] [PubMed]
- Partridge, D.; Lloyd, K.A.; Rhodes, J.M.; Walker, A.W.; Johnstone, A.M.; Campbell, B.J. Food additives: Assessing the impact of exposure to permitted emulsifiers on bowel and metabolic health-introducing the FADiets study. Nutr. Bull. 2019, 44, 329–349. [Google Scholar] [CrossRef] [Green Version]
- Roca-Saavedra, P.; Mendez-Vilabrille, V.; Miranda, J.M.; Nebot, C.; Cardelle-Cobas, A.; Franco, C.M.; Cepeda, A. Food additives, contaminants and other minor components: Effects on human gut microbiota-a review. J. Physiol. Biochem. 2018, 74, 69–83. [Google Scholar] [CrossRef] [PubMed]
- Martínez Steele, E.; Khandpur, N.; da Costa Louzada, M.L.; Monteiro, C.A. Association between dietary contribution of ultra-processed foods and urinary concentrations of phthalates and bisphenol in a nationally representative sample of the US population aged 6 years and older. PLoS ONE 2020, 15, e0236738. [Google Scholar] [CrossRef] [PubMed]
- Winkler, H.C.; Suter, M.; Naegeli, H. Critical review of the safety assessment of nano-structured silica additives in food. J. Nanobiotechnol. 2016, 14, 44. [Google Scholar] [CrossRef] [PubMed] [Green Version]
- Paula Neto, H.A.; Ausina, P.; Gomez, L.S.; Leandro, J.G.B.; Zancan, P.; Sola-Penna, M. Effects of Food Additives on Immune Cells As Contributors to Body Weight Gain and Immune-Mediated Metabolic Dysregulation. Front. Immunol. 2017, 8, 1478. [Google Scholar] [CrossRef] [PubMed] [Green Version]
- Food and Agriculture Organization. Ultra-Processed Foods, Diet Quality, and Health Using the NOVA Classification System; Food and Agriculture Organization: Rome, Italy, 2019. [Google Scholar]
- Shim, J.S.; Oh, K.; Kim, H.C. Dietary assessment methods in epidemiologic studies. Epidemiol. Health 2014, 36, e2014009. [Google Scholar] [CrossRef] [PubMed]
- Hébert, J.R. Social Desirability Trait: Biaser or Driver of Self-Reported Dietary Intake? J. Acad. Nutr. Diet. 2016, 116, 1895–1898. [Google Scholar] [CrossRef] [PubMed]
- Lafay, L.; Mennen, L.; Basdevant, A.; Charles, M.A.; Borys, J.M.; Eschwège, E.; Romon, M. Does energy intake underreporting involve all kinds of food or only specific food items? Results from the Fleurbaix Laventie Ville Santé (FLVS) study. Int. J. Obes. Relat. Metab. Disord. 2000, 24, 1500–1506. [Google Scholar] [CrossRef] [PubMed] [Green Version]
- Food and Agriculture Organization. Guidelines on the Collection of Information on Food Processing through Food Consumption Surveys; Food and Agriculture Organization: Rome, Italy, 2015. [Google Scholar]


| Dietary Contribution of Ultra-Processed Foods to Total Energy Intake (%) | ||||
|---|---|---|---|---|
| Variables | Crude Mean (95% CI) | Adjusted Mean (95% CI) 1 | ||
| Sex | ||||
| Male | 25.7 | (25.5–26.1) | 25.8 | (25.5–26.1) |
| Female | 24.1 | (23.8–24.4) * | 25.0 | (24.4–25.6) * |
| Age (years) | ||||
| 1–12 | 28.9 | (28.5–29.4) | 30.7 | (30.0–31.3) |
| 13–19 | 32.6 | (31.9–33.4) | 33.8 | (32.9–34.6) |
| 20–49 | 27.7 | (27.3–28.0) | 26.6 | (26.1–27.0) |
| 50–64 | 19.6 | (19.2–19.9) | 19.7 | (19.3–20.1) |
| ≥65 | 15.1 | (14.8–15.8) * | 16.3 | (15.8–16.7) * |
| Residence | ||||
| Urban | 25.4 | (25.1–25.6) | 25.8 | (25.5–26.1) |
| Rural | 22.8 | (22.1–23.4) * | 25.0 | (24.4–25.6) * |
| Education | ||||
| Middle school or less | 23.2 | (22.8–23.5) | 23.4 | (23.0–23.8) |
| High school | 25.9 | (25.5–26.3) | 26.4 | (25.9–26.9) |
| College or higher | 26.3 | (26.0–26.7) * | 26.3 | (25.8–26.9) * |
| Household income | ||||
| Low (Q1) | 21.0 | (20.4–21.6) | 25.5 | (24.9–26.1) |
| Middle (Q2–Q3) | 25.5 | (25.2–25.8) | 25.4 | (25.0–25.8) |
| High (Q4) | 25.8 | (25.4–26.2) * | 25.3 | (24.8–25.7) |
| Dietary Contribution of Ultra-Processed Foods to Total Energy Intake (%) | Changes per Cycle | p for Trend | |||
|---|---|---|---|---|---|
| Variables | 2010–2012 | 2013–2015 | 2016–2018 | ||
| Total | 23.1 (22.7–23.5) | 25.5 (25.1–25.9) | 26.1 (25.7–26.5) | 1.52 | <0.0001 |
| Sex | |||||
| Male | 23.7 (23.2–24.2) | 26.5 (25.9–27.0) | 27.1 (26.6–27.6) | 1.72 | <0.0001 |
| Female | 22.5 (22.0–23.0) | 24.6 (24.2–25.1) | 25.2 (24.6–25.7) | 1.32 | <0.0001 |
| Age (years) | |||||
| 1–12 | 27.5 (26.7–28.3) | 29.8 (29.9–30.6) | 29.6 (28.9–30.4) | 1.06 | 0.0002 |
| 13–19 | 30.9 (29.7–32.1) | 32.9 (31.7–34.2) | 34.4 (33.1–35.6) | 1.74 | 0.0001 |
| 20–49 | 24.8 (24.3–25.4) | 28.4 (27.8–29.0) | 29.8 (29.2–30.4) | 2.47 | <0.0001 |
| 50–64 | 17.6 (17.0–18.2) | 19.8 (19.2–20.4) | 20.9 (20.3–21.5) | 1.64 | <0.0001 |
| ≥65 | 13.7 (13.1–14.3) | 15.7 (15.1–16.2) | 15.8 (15.2–16.4) | 0.98 | <0.0001 |
| Residence | |||||
| Urban | 23.7 (23.2–24.1) | 25.8 (25.4–26.3) | 26.5 (26.1–26.9) | 1.40 | <0.0001 |
| Rural | 20.7 (19.6–21.7) | 24.1 (23.1–25.2) | 24.0 (22.8–25.2) | 1.72 | <0.0001 |
| Education | |||||
| Middle school or less | 21.7 (21.2–22.2) | 24.0 (23.4–24.6) | 24.0 (23.4–24.6) | 1.18 | <0.0001 |
| High school | 24.0 (23.3–24.7) | 26.5 (25.8–27.3) | 27.3 (26.6–28.0) | 1.67 | <0.0001 |
| College or higher | 24.4 (23.8–25.1) | 26.6 (26.0–27.3) | 27.4 (26.8–28.0) | 1.45 | <0.0001 |
| Household income | |||||
| Low (Q1) | 20.3 (19.2–21.4) | 20.7 (19.8–21.6) | 22.0 (20.9–23.1) | 0.82 | 0.0361 |
| Middle (Q2–Q3) | 23.4 (22.9–23.9) | 26.5 (26.0–27.1) | 26.7 (26.1–27.2) | 1.62 | <0.0001 |
| High (Q4) | 23.9 (23.3–24.6) | 26.0 (25.3–26.6) | 27.2 (26.5–27.8) | 1.60 | <0.0001 |
Publisher’s Note: MDPI stays neutral with regard to jurisdictional claims in published maps and institutional affiliations. |
© 2021 by the authors. Licensee MDPI, Basel, Switzerland. This article is an open access article distributed under the terms and conditions of the Creative Commons Attribution (CC BY) license (http://creativecommons.org/licenses/by/4.0/).
Share and Cite
Shim, J.-S.; Shim, S.-Y.; Cha, H.-J.; Kim, J.; Kim, H.C. Socioeconomic Characteristics and Trends in the Consumption of Ultra-Processed Foods in Korea from 2010 to 2018. Nutrients 2021, 13, 1120. https://doi.org/10.3390/nu13041120
Shim J-S, Shim S-Y, Cha H-J, Kim J, Kim HC. Socioeconomic Characteristics and Trends in the Consumption of Ultra-Processed Foods in Korea from 2010 to 2018. Nutrients. 2021; 13(4):1120. https://doi.org/10.3390/nu13041120
Chicago/Turabian StyleShim, Jee-Seon, Sun-Young Shim, Hee-Jeung Cha, Jinhee Kim, and Hyeon Chang Kim. 2021. "Socioeconomic Characteristics and Trends in the Consumption of Ultra-Processed Foods in Korea from 2010 to 2018" Nutrients 13, no. 4: 1120. https://doi.org/10.3390/nu13041120
APA StyleShim, J.-S., Shim, S.-Y., Cha, H.-J., Kim, J., & Kim, H. C. (2021). Socioeconomic Characteristics and Trends in the Consumption of Ultra-Processed Foods in Korea from 2010 to 2018. Nutrients, 13(4), 1120. https://doi.org/10.3390/nu13041120