
Diet–Cognition Associations Differ in Mild Cognitive Impairment Subtypes

 , ,
, , 
Abstract
:
1. Introduction
2. Materials and Methods
2.1. Study Population
2.2. Assessment of Food Consumption
2.3. Assessment of Cognitive Function
2.4. Assessment of Covariates
2.5. Statistical Analysis
3. Results
3.1. Characteristics of Study Population
3.2. Cognitive Function by Demographics and Health-Related Factors
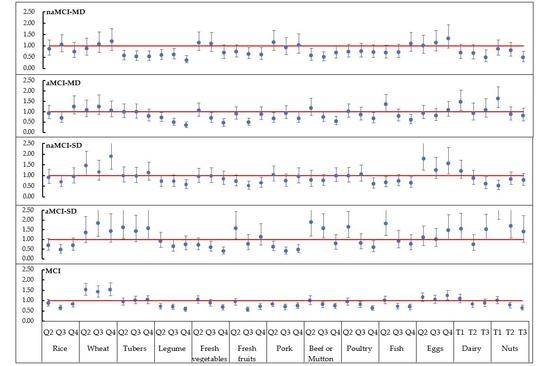
3.3. Association of Food Consumptions with MCI and Its Subtypes
3.4. Association between Food Consumptions and Cognitive Domains
4. Discussion
5. Conclusions
Supplementary Materials
Author Contributions
Funding
Institutional Review Board Statement
Informed Consent Statement
Data Availability Statement
Acknowledgments
Conflicts of Interest
References
- Nichols, E.; Szoeke, C.E.I.; Vollset, S.E.; Abbasi, N.; Abd-Allah, F.; Abdela, J.; Aichour, M.T.E.; Akinyemi, R.O.; Alahdab, F.; Asgedom, S.W.; et al. Global, regional, and national burden of Alzheimer’s disease and other dementias, 1990–2016: A systematic analysis for the Global Burden of Disease Study 2016. Lancet Neurol. 2019, 18, 88–106. [Google Scholar] [CrossRef] [Green Version]
- Jia, L.; Du, Y.; Chu, L.; Zhang, Z.; Li, F.; Lyu, D.; Li, Y.; Li, Y.; Zhu, M.; Jiao, H.; et al. Prevalence, risk factors, and management of dementia and mild cognitive impairment in adults aged 60 years or older in China: A cross-sectional study. Lancet Public Health 2020, 5, e661–e671. [Google Scholar] [CrossRef]
- Davis, M.; O’Connell, T.; Johnson, S.; Cline, S.; Merikle, E.; Martenyi, F.; Simpson, K. Estimating Alzheimer’s Disease Progression Rates from Normal Cognition Through Mild Cognitive Impairment and Stages of Dementia. Curr. Alzheimer Res. 2018, 15, 777–788. [Google Scholar] [CrossRef]
- Ding, D.; Zhao, Q.; Guo, Q.; Meng, H.; Wang, B.; Luo, J.; Mortimer, J.A.; Borenstein, A.R.; Hong, Z. Prevalence of mild cognitive impairment in an urban community in China: A cross-sectional analysis of the Shanghai Aging Study. Alzheimer’s Dement. 2015, 11, 300–309 e302. [Google Scholar] [CrossRef]
- Liu-Seifert, H.; Schumi, J.; Miao, X.; Tian, Y.; Rabbia, M.; Andersen, S.W.; Wilson, S.; Li, W.; Entsuah, R. Disease Modification in Alzheimer’s Disease: Current Thinking. Ther. Innov. Regul. Sci. 2020, 54, 396–403. [Google Scholar] [CrossRef] [PubMed]
- Flanagan, E.; Lamport, D.; Brennan, L.; Burnet, P.; Calabrese, V.; Cunnane, S.C.; Wilde, M.C.; Dye, L.; Farrimond, J.A.; Emerson Lombardo, N.; et al. Nutrition and the ageing brain: Moving towards clinical applications. Ageing Res. Rev. 2020, 62, 101079. [Google Scholar] [CrossRef]
- Solfrizzi, V.; Custodero, C.; Lozupone, M.; Imbimbo, B.P.; Valiani, V.; Agosti, P.; Schilardi, A.; D’Introno, A.; La Montagna, M.; Calvani, M.; et al. Relationships of Dietary Patterns, Foods, and Micro- and Macronutrients with Alzheimer’s Disease and Late-Life Cognitive Disorders: A Systematic Review. J. Alzheimer’s Dis 2017, 59, 815–849. [Google Scholar] [CrossRef] [Green Version]
- Ngabirano, L.; Samieri, C.; Feart, C.; Gabelle, A.; Artero, S.; Duflos, C.; Berr, C.; Mura, T. Intake of Meat, Fish, Fruits, and Vegetables and Long-Term Risk of Dementia and Alzheimer’s Disease. J. Alzheimers Dis. 2019, 68, 711–722. [Google Scholar] [CrossRef] [PubMed]
- Loef, M.; Walach, H. Fruit, vegetables and prevention of cognitive decline or dementia: A systematic review of cohort studies. J. Nutr. Health Aging 2012, 16, 626–630. [Google Scholar] [CrossRef]
- Ritchie, K.; Carriere, I.; Ritchie, C.W.; Berr, C.; Artero, S.; Ancelin, M.L. Designing prevention programmes to reduce incidence of dementia: Prospective cohort study of modifiable risk factors. Br. Med. J. 2010, 341, c3885. [Google Scholar] [CrossRef] [PubMed] [Green Version]
- Hughes, T.F.; Andel, R.; Small, B.J.; Borenstein, A.R.; Mortimer, J.A.; Wolk, A.; Johansson, B.; Fratiglioni, L.; Pedersen, N.L.; Gatz, M. Midlife fruit and vegetable consumption and risk of dementia in later life in Swedish twins. Am. J. Geriatr. Psychiatry 2010, 18, 413–420. [Google Scholar] [CrossRef] [Green Version]
- Barberger-Gateau, P.; Raffaitin, C.; Letenneur, L.; Berr, C.; Tzourio, C.; Dartigues, J.F.; Alperovitch, A. Dietary patterns and risk of dementia: The Three-City cohort study. Neurology 2007, 69, 1921–1930. [Google Scholar] [CrossRef] [PubMed]
- Devore, E.E.; Kang, J.H.; Breteler, M.M.; Grodstein, F. Dietary intakes of berries and flavonoids in relation to cognitive decline. Ann. Neurol. 2012, 72, 135–143. [Google Scholar] [CrossRef]
- Lamport, D.J.; Saunders, C.; Butler, L.T.; Spencer, J.P. Fruits, vegetables, 100% juices, and cognitive function. Nutr. Rev. 2014, 72, 774–789. [Google Scholar] [CrossRef] [PubMed]
- Zhang, Y.; Chen, J.; Qiu, J.; Li, Y.; Wang, J.; Jiao, J. Intakes of fish and polyunsaturated fatty acids and mild-to-severe cognitive impairment risks: A dose-response meta-analysis of 21 cohort studies. Am. J. Clin. Nutr. 2016, 103, 330–340. [Google Scholar] [CrossRef] [PubMed]
- Li, M.; Shi, Z. A Prospective Association of Nut Consumption with Cognitive Function in Chinese Adults aged 55+ China Health and Nutrition Survey. J. Nutr. Health Aging 2019, 23, 211–216. [Google Scholar] [CrossRef]
- Taylor, M.K.; Sullivan, D.K.; Swerdlow, R.H.; Vidoni, E.D.; Morris, J.K.; Mahnken, J.D.; Burns, J.M. A high-glycemic diet is associated with cerebral amyloid burden in cognitively normal older adults. Am. J. Clin. Nutr. 2017, 106, 1463–1470. [Google Scholar] [CrossRef]
- Zhang, H.; Hardie, L.; Bawajeeh, A.O.; Cade, J. Meat Consumption, Cognitive Function and Disorders: A Systematic Review with Narrative Synthesis and Meta-Analysis. Nutrients 2020, 12, 1528. [Google Scholar] [CrossRef]
- Petersen, R.C. Mild cognitive impairment as a diagnostic entity. J. Intern. Med. 2004, 256, 183–194. [Google Scholar] [CrossRef]
- Zhao, X.; Yuan, L.; Feng, L.; Xi, Y.; Yu, H.; Ma, W.; Zhang, D.; Xiao, R. Association of dietary intake and lifestyle pattern with mild cognitive impairment in the elderly. J. Nutr. Health Aging 2015, 19, 164–168. [Google Scholar] [CrossRef] [PubMed]
- Dong, L.; Xiao, R.; Cai, C.; Xu, Z.; Wang, S.; Pan, L.; Yuan, L. Diet, lifestyle and cognitive function in old Chinese adults. Arch. Gerontol. Geriatr. 2016, 63, 36–42. [Google Scholar] [CrossRef]
- Qin, B.; Plassman, B.L.; Edwards, L.J.; Popkin, B.M.; Adair, L.S.; Mendez, M.A. Fish intake is associated with slower cognitive decline in Chinese older adults. J. Nutr. 2014, 144, 1579–1585. [Google Scholar] [CrossRef] [Green Version]
- Yuan, L.; Liu, J.; Ma, W.; Dong, L.; Wang, W.; Che, R.; Xiao, R. Dietary pattern and antioxidants in plasma and erythrocyte in patients with mild cognitive impairment from China. Nutrition 2016, 32, 193–198. [Google Scholar] [CrossRef]
- Julayanont, P.; Brousseau, M.; Chertkow, H.; Phillips, N.; Nasreddine, Z.S. Montreal Cognitive Assessment Memory Index Score (MoCA-MIS) as a predictor of conversion from mild cognitive impairment to Alzheimer’s disease. J. Am. Geriatr. Soc. 2014, 62, 679–684. [Google Scholar] [CrossRef]
- Lu, J.; Li, D.; Li, F.; Zhou, A.; Wang, F.; Zuo, X.; Jia, X.F.; Song, H.; Jia, J. Montreal cognitive assessment in detecting cognitive impairment in Chinese elderly individuals: A population-based study. J. Geriatr. Psychiatry Neurol. 2011, 24, 184–190. [Google Scholar] [CrossRef]
- Petersen, R.C. Mild Cognitive Impairment. Continuum 2016, 22, 404–418. [Google Scholar] [CrossRef] [PubMed]
- Winblad, B.; Palmer, K.; Kivipelto, M.; Jelic, V.; Fratiglioni, L.; Wahlund, L.O.; Nordberg, A.; Backman, L.; Albert, M.; Almkvist, O.; et al. Mild cognitive impairment—Beyond controversies, towards a consensus: Report of the International Working Group on Mild Cognitive Impairment. J. Intern. Med. 2004, 256, 240–246. [Google Scholar] [CrossRef]
- Ainsworth, B.E.; Haskell, W.L.; Whitt, M.C.; Irwin, M.L.; Swartz, A.M.; Strath, S.J.; O’Brien, W.L.; Bassett, D.R., Jr.; Schmitz, K.H.; Emplaincourt, P.O.; et al. Compendium of physical activities: An update of activity codes and MET intensities. Med. Sci. Sports Exerc. 2000, 32, S498–S504. [Google Scholar] [CrossRef] [PubMed] [Green Version]
- Hirshkowitz, M.; Whiton, K.; Albert, S.M.; Alessi, C.; Bruni, O.; DonCarlos, L.; Hazen, N.; Herman, J.; Katz, E.S.; Kheirandish-Gozal, L.; et al. National Sleep Foundation’s sleep time duration recommendations: Methodology and results summary. Sleep Health 2015, 1, 40–43. [Google Scholar] [CrossRef] [PubMed]
- Chen, C.; Lu, F.C. The guidelines for prevention and control of overweight and obesity in Chinese adults. Biomed. Environ. Sci. BES 2004, 17, 1–36. [Google Scholar] [PubMed]
- National Health and Family Planning Commission of the People’s Republic of China; Criteria of Weight for Adults, WS/T 428-2013; Standards Press of China: Beijing, China, 2013.
- Manly, J.J.; Bell-McGinty, S.; Tang, M.X.; Schupf, N.; Stern, Y.; Mayeux, R. Implementing diagnostic criteria and estimating frequency of mild cognitive impairment in an urban community. Arch. Neurol. 2005, 62, 1739–1746. [Google Scholar] [CrossRef]
- Palmer, K.; Backman, L.; Winblad, B.; Fratiglioni, L. Mild cognitive impairment in the general population: Occurrence and progression to Alzheimer disease. Am. J. Geriatr. Psychiatry 2008, 16, 603–611. [Google Scholar] [CrossRef] [PubMed]
- Ritchie, K.; Artero, S.; Touchon, J. Classification criteria for mild cognitive impairment: A population-based validation study. Neurology 2001, 56, 37–42. [Google Scholar] [CrossRef] [PubMed] [Green Version]
- Hanninen, T.; Hallikainen, M.; Tuomainen, S.; Vanhanen, M.; Soininen, H. Prevalence of mild cognitive impairment: A population-based study in elderly subjects. Acta Neurol. Scand. 2002, 106, 148–154. [Google Scholar] [CrossRef]
- Qin, H.Y.; Zhao, X.D.; Zhu, B.G.; Hu, C.P. Demographic Factors and Cognitive Function Assessments Associated with Mild Cognitive Impairment Progression for the Elderly. Biomed. Res. Int. 2020, 2020, 3054373. [Google Scholar] [CrossRef] [Green Version]
- Rao, D.; Luo, X.; Tang, M.; Shen, Y.; Huang, R.; Yu, J.; Ren, J.; Cheng, X.; Lin, K. Prevalence of mild cognitive impairment and its subtypes in community-dwelling residents aged 65 years or older in Guangzhou, China. Arch. Gerontol Geriatr 2018, 75, 70–75. [Google Scholar] [CrossRef]
- Lopez, O.L.; Becker, J.T.; Jagust, W.J.; Fitzpatrick, A.; Carlson, M.C.; DeKosky, S.T.; Breitner, J.; Lyketsos, C.G.; Jones, B.; Kawas, C.; et al. Neuropsychological characteristics of mild cognitive impairment subgroups. J. Neurol. Neurosurg. Psychiatry 2006, 77, 159–165. [Google Scholar] [CrossRef] [Green Version]
- Jungwirth, S.; Weissgram, S.; Zehetmayer, S.; Tragl, K.H.; Fischer, P. VITA: Subtypes of mild cognitive impairment in a community-based cohort at the age of 75 years. Int. J. Geriatr. Psychiatry 2005, 20, 452–458. [Google Scholar] [CrossRef] [PubMed]
- Busse, A.; Hensel, A.; Guhne, U.; Angermeyer, M.C.; Riedel-Heller, S.G. Mild cognitive impairment: Long-term course of four clinical subtypes. Neurology 2006, 67, 2176–2185. [Google Scholar] [CrossRef]
- Feart, C.; Samieri, C.; Barberger-Gateau, P. Mediterranean diet and cognitive health: An update of available knowledge. Curr. Opin. Clin. Nutr. Metab. Care 2015, 18, 51–62. [Google Scholar] [CrossRef]
- Bamberger, M.E.; Harris, M.E.; McDonald, D.R.; Husemann, J.; Landreth, G.E. A cell surface receptor complex for fibrillar beta-amyloid mediates microglial activation. J. Neurosci. 2003, 23, 2665–2674. [Google Scholar] [CrossRef] [Green Version]
- O’Brien, J.; Okereke, O.; Devore, E.; Rosner, B.; Breteler, M.; Grodstein, F. Long-term intake of nuts in relation to cognitive function in older women. J. Nutr. Health Aging 2014, 18, 496–502. [Google Scholar] [CrossRef] [PubMed] [Green Version]
- Pastor-Valero, M.; Furlan-Viebig, R.; Menezes, P.R.; da Silva, S.A.; Vallada, H.; Scazufca, M. Education and WHO recommendations for fruit and vegetable intake are associated with better cognitive function in a disadvantaged Brazilian elderly population: A population-based cross-sectional study. PLoS ONE 2014, 9, e94042. [Google Scholar] [CrossRef]
- Wu, L.; Sun, D.; Tan, Y. Intake of Fruit and Vegetables and the Incident Risk of Cognitive Disorders: A Systematic Review and Meta-Analysis of Cohort Studies. J. Nutr. Health Aging 2017, 21, 1284–1290. [Google Scholar] [CrossRef] [PubMed]
- Devore, E.E.; Grodstein, F.; van Rooij, F.J.; Hofman, A.; Rosner, B.; Stampfer, M.J.; Witteman, J.C.; Breteler, M.M. Dietary intake of fish and omega-3 fatty acids in relation to long-term dementia risk. Am. J. Clin. Nutr. 2009, 90, 170–176. [Google Scholar] [CrossRef] [Green Version]
- Grant, W.B. Diet and risk of dementia: Does fat matter? The Rotterdam Study. Neurology 2003, 60, 2020–2021. [Google Scholar] [CrossRef] [PubMed]
- Tan, B.L.; Norhaizan, M.E. Effect of High-Fat Diets on Oxidative Stress, Cellular Inflammatory Response and Cognitive Function. Nutrients 2019, 11, 2579. [Google Scholar] [CrossRef] [Green Version]
- Staubo, S.C.; Aakre, J.A.; Vemuri, P.; Syrjanen, J.A.; Mielke, M.M.; Geda, Y.E.; Kremers, W.K.; Machulda, M.M.; Knopman, D.S.; Petersen, R.C.; et al. Mediterranean diet, micronutrients and macronutrients, and MRI measures of cortical thickness. Alzheimer’s Dement. 2017, 13, 168–177. [Google Scholar] [CrossRef] [Green Version]
- La Rue, A.; Koehler, K.M.; Wayne, S.J.; Chiulli, S.J.; Haaland, K.Y.; Garry, P.J. Nutritional status and cognitive functioning in a normally aging sample: A 6-y reassessment. Am. J. Clin. Nutr. 1997, 65, 20–29. [Google Scholar] [CrossRef]
- Sunram-Lea, S.I.; Owen, L. The impact of diet-based glycaemic response and glucose regulation on cognition: Evidence across the lifespan. Proc. Nutr. Soc. 2017, 76, 466–477. [Google Scholar] [CrossRef] [PubMed] [Green Version]
- Kim, K.Y.; Yun, J.M. Association between diets and mild cognitive impairment in adults aged 50 years or older. Nutr. Res. Pract. 2018, 12, 415–425. [Google Scholar] [CrossRef] [PubMed]
- Huang, L.; Wang, H.; Wang, Z.; Zhang, J.; Zhang, B.; Ding, G. Regional Disparities in the Association between Cereal Consumption and Metabolic Syndrome: Results from the China Health and Nutrition Survey. Nutrients 2019, 11, 764. [Google Scholar] [CrossRef] [PubMed] [Green Version]
- Dong, F.; Howard, A.G.; Herring, A.H.; Popkin, B.M.; Gordon-Larsen, P. White Rice Intake Varies in Its Association with Metabolic Markers of Diabetes and Dyslipidemia Across Region among Chinese Adults. Ann. Nutr. Metab. 2015, 66, 209–218. [Google Scholar] [CrossRef] [Green Version]
- Bangen, K.J.; Clark, A.L.; Werhane, M.; Edmonds, E.C.; Nation, D.A.; Evangelista, N.; Libon, D.J.; Bondi, M.W.; Delano-Wood, L.; Alzheimer’s Disease Neuroimaging, I. Cortical Amyloid Burden Differences Across Empirically-Derived Mild Cognitive Impairment Subtypes and Interaction with APOE varepsilon4 Genotype. J. Alzheimer’s Dis. 2016, 52, 849–861. [Google Scholar] [CrossRef] [Green Version]
- Guan, H.; Liu, T.; Jiang, J.; Tao, D.; Zhang, J.; Niu, H.; Zhu, W.; Wang, Y.; Cheng, J.; Kochan, N.A.; et al. Classifying MCI Subtypes in Community-Dwelling Elderly Using Cross-Sectional and Longitudinal MRI-Based Biomarkers. Front. Aging Neurosc. 2017, 9, 309. [Google Scholar] [CrossRef] [PubMed]
- Lam, C.L.M.; Yiend, J.; Lee, T.M.C. Imaging and neuropsychological correlates of white matter lesions in different subtypes of Mild Cognitive Impairment: A systematic review. NeuroRehabilitation 2017, 41, 189–204. [Google Scholar] [CrossRef] [Green Version]
- Kida, J.; Nemoto, K.; Ikejima, C.; Bun, S.; Kakuma, T.; Mizukami, K.; Asada, T. Impact of Depressive Symptoms on Conversion from Mild Cognitive Impairment Subtypes to Alzheimer’s Disease: A Community-Based Longitudinal Study. J. Alzheimer’s Dis. 2016, 51, 405–415. [Google Scholar] [CrossRef]
- Raphael, K. Recall bias: A proposal for assessment and control. Int. J. Epidemiol. 1987, 16, 167–170. [Google Scholar] [CrossRef] [Green Version]

| Foods | Q1/T0 | Q2/T1 | Q3/T2 | Q4/T3 |
|---|---|---|---|---|
| Rice (g/day) | 10.0 (3.3, 21.4) | 74.6 (45.7, 100.0) | 180.0 (150.0, 200.0) | 300.0 (300.0, 450.0) |
| Wheat (g/day) | 7.1 (0.0, 14.3) | 50.0 (40.0, 60.0) | 100.0 (100.0, 120.0) | 300.0 (200.0, 360.0) |
| Tubers (g/day) | 0.0 (0.0, 3.9) | 13.1 (9.3, 15.0) | 28.6 (24.8, 35.0) | 67.1 (51.4, 100.0) |
| Legumes (g/day) | 3.3 (0.0, 7.1) | 20.0 (14.3, 25.4) | 44.2 (37.1, 57.1) | 113.1 (85.7, 158.9) |
| Fresh vegetables (g/day) | 47.4 (30.0, 63.6) | 117.0 (98.4, 140.0) | 228.0 (195.6, 259.9) | 408.2 (342.5, 530.2) |
| Fresh fruit (g/day) | 6.7 (0.0, 11.4) | 27.1 (21.5, 33.2) | 57.5 (48.7, 70.8) | 144.3 (107.1, 205.7) |
| Pork (g/day) | 2.7 (0.0, 5.0) | 14.3 (11.5, 17.9) | 32.9 (28.6, 42.9) | 100.0 (71.4, 161.0) |
| Beef or mutton (g/day) | 0.0 (0.0, 0.0) | 0.5 (0.3, 0.7) | 2.5 (1.6, 3.3) | 10.0 (8.0, 16.7) |
| Poultry (g/week) | 0.0 (0.0, 0.0) | 18.4 (11.7, 23.3) | 50.0 (46.7, 70.0) | 150.0 (100.0, 220.0) |
| Fish (g/week) | 0.0 (0.0, 0.0) | 23.3 (11.7, 28.0) | 80.0 (51.5, 100.0) | 300.0 (200.0, 432.0) |
| Eggs (g/day) | 6.3 (0.0, 8.7) | 20.0 (15.4, 21.7) | 42.9 (32.0, 50.0) | 60.5 (60.0, 81.8) |
| Dairy (g/day) | 0.0 (0.0, 0.0) | 21.4 (8.6, 31.2) | 80.0 (57.5, 100.0) | 206.3 (163.8, 257.1) |
| Nuts (g/week) | 0.0 (0.0, 0.0) | 5.8 (2.9, 9.6) | 23.3 (18.7, 42.0) | 140.0 (93.3, 210.0) |
| Foods | MCI | p Value | MCI Subtypes | p Value | ||||
|---|---|---|---|---|---|---|---|---|
| Yes | No | aMCI-SD | naMCI-SD | aMCI-MD | naMCI-MD | |||
| Rice | <0.001 | 0.005 | ||||||
| Q1 | 586 (51.0) | 564 (49.0) | 73 (6.3) | 90 (7.8) | 127 (11.0) | 91 (7.9) | ||
| Q2 | 504 (44.8) | 620 (55.2) | 53 (4.7) | 76 (6.8) | 75 (6.7) | 54 (4.8) | ||
| Q3 | 374 (36.3) | 657 (63.7) | 37 (3.6) | 65 (6.3) | 61 (5.9) | 75 (7.3) | ||
| Q4 | 370 (36.9) | 634 (63.1) | 42 (4.2) | 66 (6.6) | 92 (9.2) | 39 (3.9) | ||
| Wheat | <0.001 | 0.045 | ||||||
| Q1 | 330 (31.6) | 713 (68.4) | 32 (3.1) | 55 (5.3) | 78 (7.5) | 59 (5.7) | ||
| Q2 | 479 (44.4) | 600 (55.6) | 47 (4.4) | 72 (6.7) | 75 (7.0) | 49 (4.5) | ||
| Q3 | 495 (44.9) | 607 (55.1) | 72 (6.5) | 68 (6.2) | 85 (7.7) | 64 (5.8) | ||
| Q4 | 530 (48.8) | 555 (51.2) | 54 (5.0) | 102 (9.4) | 117 (10.8) | 87 (8.0) | ||
| Tubers | 0.698 | <0.001 | ||||||
| Q1 | 444 (42.0) | 613 (58.0) | 33 (3.1) | 74 (7.0) | 95 (9.0) | 101 (9.6) | ||
| Q2 | 455 (41.6) | 638 (58.4) | 60 (5.5) | 76 (7.0) | 93 (8.5) | 54 (4.9) | ||
| Q3 | 473 (44.0) | 602 (56.0) | 54 (5.0) | 72 (6.7) | 87 (8.1) | 52 (4.8) | ||
| Q4 | 462 (42.6) | 622 (57.4) | 58 (5.4) | 75 (6.9) | 80 (7.4) | 52 (4.8) | ||
| Legumes | <0.001 | <0.001 | ||||||
| Q1 | 533 (50.1) | 531 (49.9) | 47 (4.4) | 86 (8.1) | 149 (14.0) | 105 (9.9) | ||
| Q2 | 468 (42.8) | 625 (57.2) | 63 (5.8) | 78 (7.1) | 104 (9.5) | 63 (5.8) | ||
| Q3 | 438 (40.7) | 637 (59.3) | 41 (3.8) | 74 (6.9) | 59 (5.5) | 55 (5.1) | ||
| Q4 | 395 (36.7) | 682 (63.3) | 54 (5.0) | 59 (5.5) | 43 (4.0) | 36 (3.3) | ||
| Fresh vegetables | <0.001 | 0.007 | ||||||
| Q1 | 504 (46.8) | 573 (53.2) | 68 (6.3) | 82 (7.6) | 121 (11.2) | 75 (7.0) | ||
| Q2 | 513 (47.6) | 564 (52.4) | 53 (4.9) | 73 (6.8) | 119 (11.0) | 74 (6.9) | ||
| Q3 | 448 (41.6) | 629 (58.4) | 46 (4.3) | 72 (6.7) | 69 (6.4) | 69 (6.4) | ||
| Q4 | 369 (34.2) | 709 (65.8) | 38 (3.5) | 70 (6.5) | 46 (4.3) | 41 (3.8) | ||
| Fresh fruit | <0.001 | 0.004 | ||||||
| Q1 | 536 (49.8) | 540 (50.2) | 45 (4.2) | 99 (9.2) | 133 (12.4) | 96 (8.9) | ||
| Q2 | 492 (45.8) | 582 (54.2) | 62 (5.8) | 69 (6.4) | 95 (8.8) | 62 (5.8) | ||
| Q3 | 384 (35.4) | 700 (64.6) | 41 (3.8) | 59 (5.4) | 54 (5.0) | 57 (5.3) | ||
| Q4 | 422 (39.3) | 653 (60.7) | 57 (5.3) | 70 (6.5) | 73 (6.8) | 44 (4.1) | ||
| Pork | <0.001 | 0.009 | ||||||
| Q1 | 546 (50.3) | 540 (49.7) | 76 (7.0) | 83 (7.6) | 118 (10.9) | 69 (6.4) | ||
| Q2 | 482 (45.1) | 586 (54.9) | 51 (4.8) | 86 (8.1) | 75 (7.0) | 78 (7.3) | ||
| Q3 | 404 (37.6) | 671 (62.4) | 35 (3.3) | 59 (5.5) | 99 (9.2) | 58 (5.4) | ||
| Q4 | 402 (37.2) | 678 (62.8) | 43 (4.0) | 69 (6.4) | 63 (5.8) | 54 (5.0) | ||
| Beef or mutton | <0.001 | <0.001 | ||||||
| Q1 | 758 (46.5) | 872 (53.5) | 59 (3.6) | 123 (7.5) | 173 (10.6) | 141 (8.7) | ||
| Q2 | 243 (46.6) | 278 (53.4) | 37 (7.1) | 29 (5.6) | 68 (13.1) | 26 (5.0) | ||
| Q3 | 442 (40.9) | 640 (59.1) | 72 (6.7) | 66 (6.1) | 71 (6.6) | 44 (4.1) | ||
| Q4 | 391 (36.3) | 685 (63.7) | 37 (3.4) | 79 (7.3) | 43 (4.0) | 48 (4.5) | ||
| Poultry | <0.001 | 0.063 | ||||||
| Q1 | 534 (49.4) | 548 (50.6) | 53 (4.9) | 83 (7.7) | 114 (10.5) | 85 (7.9) | ||
| Q2 | 503 (46.9) | 570 (53.1) | 74 (6.9) | 80 (7.5) | 114 (10.6) | 67 (6.2) | ||
| Q3 | 420 (40.4) | 620 (59.6) | 42 (4.0) | 79 (7.6) | 65 (6.3) | 50 (4.8) | ||
| Q4 | 377 (33.8) | 737 (66.2) | 36 (3.2) | 55 (4.9) | 62 (5.6) | 57 (5.1) | ||
| Fish | <0.001 | <0.001 | ||||||
| Q1 | 522 (48.5) | 555 (51.5) | 42 (3.9) | 100 (9.3) | 107 (9.9) | 79 (7.3) | ||
| Q2 | 527 (49.6) | 535 (50.4) | 78 (7.3) | 62 (5.8) | 126 (11.9) | 52 (4.9) | ||
| Q3 | 416 (38.7) | 658 (61.3) | 45 (4.2) | 74 (6.9) | 67 (6.2) | 50 (4.7) | ||
| Q4 | 369 (33.7) | 727 (66.3) | 40 (3.6) | 61 (5.6) | 55 (5.0) | 78 (7.1) | ||
| Eggs | 0.007 | 0.018 | ||||||
| Q1 | 415 (38.5) | 664 (61.5) | 44 (4.1) | 56 (5.2) | 102 (9.5) | 64 (5.9) | ||
| Q2 | 480 (43.3) | 629 (56.7) | 48 (4.3) | 99 (8.9) | 79 (7.1) | 58 (5.2) | ||
| Q3 | 447 (42.7) | 599 (57.3) | 50 (4.8) | 69 (6.6) | 76 (7.3) | 66 (6.3) | ||
| Q4 | 492 (45.8) | 583 (54.2) | 63 (5.9) | 73 (6.8) | 98 (9.1) | 71 (6.6) | ||
| Dairy | 0.242 | <0.001 | ||||||
| T0 | 1049 (43.2) | 1378 (56.8) | 99 (4.1) | 172 (7.1) | 223 (9.2) | 187 (7.7) | ||
| T1 | 289 (44.2) | 365 (55.8) | 38 (5.8) | 54 (8.3) | 63 (9.6) | 27 (4.1) | ||
| T2 | 236 (39.2) | 366 (60.8) | 21 (3.5) | 43 (7.1) | 31 (5.1) | 26 (4.3) | ||
| T3 | 260 (41.5) | 366 (58.5) | 47 (7.5) | 28 (4.5) | 38 (6.1) | 19 (3.0) | ||
| Nuts | <0.001 | <0.001 | ||||||
| T0 | 874 (46.8) | 993 (53.2) | 54 (2.9) | 151 (8.1) | 166 (8.9) | 140 (7.5) | ||
| T1 | 376 (46.2) | 438 (53.8) | 72 (8.8) | 34 (4.2) | 96 (11.8) | 48 (5.9) | ||
| T2 | 317 (38.8) | 501 (61.2) | 44 (5.4) | 59 (7.2) | 51 (6.2) | 45 (5.5) | ||
| T3 | 267 (33.0) | 543 (67.0) | 35 (4.3) | 53 (6.5) | 42 (5.2) | 26 (3.2) | ||
| Foods | MCI | MCI Subtypes | |||
|---|---|---|---|---|---|
| aMCI-SD | naMCI-SD | aMCI-MD | naMCI-MD | ||
| Rice | |||||
| Q2 | 0.87 (0.73, 1.05) | 0.69 (0.45, 1.06) | 0.90 (0.62, 1.29) | 0.93 (0.66, 1.31) | 0.86 (0.58, 1.27) |
| Q3 | 0.65 (0.54, 0.78) † | 0.47 (0.30, 0.75) † | 0.69 (0.48, 1.00) | 0.70 (0.49, 1.01) | 1.05 (0.73, 1.50) |
| Q4 | 0.83 (0.68, 1.00) † | 0.69 (0.45, 1.08) | 0.94 (0.65, 1.37) | 1.25 (0.90, 1.76) | 0.74 (0.48, 1.15) |
| Wheat | |||||
| Q2 | 1.52 (1.26, 1.83) † | 1.35 (0.83, 2.19) | 1.46 (0.99, 2.15) | 1.09 (0.76, 1.57) | 0.88 (0.58, 1.34) |
| Q3 | 1.43 (1.18, 1.73) † | 1.84 (1.16, 2.91) † | 1.15 (0.78, 1.72) | 1.25 (0.87, 1.80) | 1.08 (0.72, 1.62) |
| Q4 | 1.52 (1.25, 1.85) † | 1.41 (0.86, 2.32) | 1.89 (1.29, 2.77) † | 1.06 (0.75, 1.51) | 1.19 (0.79, 1.77) |
| Tubers | |||||
| Q2 | 0.93 (0.77, 1.12) | 1.61 (1.02, 2.55) † | 0.99 (0.69, 1.41) | 0.99 (0.71, 1.38) | 0.56 (0.39, 0.81) † |
| Q3 | 1.02 (0.85, 1.22) | 1.42 (0.89, 2.26) | 0.96 (0.67, 1.38) | 0.98 (0.70, 1.38) | 0.53 (0.36, 0.77) † |
| Q4 | 1.03 (0.85, 1.23) | 1.57 (0.99, 2.52) | 1.12 (0.78, 1.62) | 0.79 (0.56, 1.12) | 0.52 (0.36, 0.77) † |
| Legumes | |||||
| Q2 | 0.72 (0.60, 0.86) † | 0.91 (0.60, 1.38) | 0.71 (0.50, 1.01) | 0.71 (0.53, 0.96) † | 0.59 (0.41, 0.84) † |
| Q3 | 0.68 (0.57, 0.82) † | 0.63 (0.39, 0.99) † | 0.71 (0.50, 1.02) | 0.49 (0.34, 0.69) † | 0.61 (0.42, 0.88) † |
| Q4 | 0.57 (0.48, 0.69) † | 0.75 (0.48, 1.17) | 0.55 (0.38, 0.80) † | 0.35 (0.24, 0.51) † | 0.37 (0.25, 0.57) † |
| Fresh vegetables | |||||
| Q2 | 1.03 (0.86, 1.23) | 0.72 (0.48, 1.08) | 0.94 (0.66, 1.34) | 1.06 (0.78, 1.43) | 1.13 (0.79, 1.62) |
| Q3 | 0.88 (0.73, 1.06) | 0.60 (0.39, 0.91) † | 0.96 (0.67, 1.37) | 0.69 (0.49, 0.97) † | 1.10 (0.76, 1.59) |
| Q4 | 0.66 (0.54, 0.80)† | 0.39 (0.25, 0.62) † | 0.83 (0.58, 1.20) | 0.46 (0.31, 0.67) † | 0.69 (0.45, 1.06) |
| Fresh fruit | |||||
| Q2 | 0.93 (0.77, 1.11) | 1.58 (1.02, 2.45) † | 0.72 (0.51, 1.02) | 0.89 (0.65, 1.23) | 0.73 (0.51, 1.05) |
| Q3 | 0.56 (0.47, 0.68) † | 0.77 (0.48, 1.25) | 0.51 (0.35, 0.73) † | 0.49 (0.34, 0.70) † | 0.64 (0.44, 0.92) † |
| Q4 | 0.71 (0.58, 0.85) † | 1.14 (0.72, 1.81) | 0.64 (0.45, 0.92) † | 0.88 (0.62, 1.24) | 0.62 (0.41, 0.93) † |
| Pork | |||||
| Q2 | 0.83 (0.70, 1.00) † | 0.61 (0.41, 0.91) † | 1.03 (0.73, 1.45) | 0.68 (0.49, 0.96) † | 1.16 (0.80, 1.67) |
| Q3 | 0.68 (0.56, 0.82) † | 0.39 (0.25, 0.61) † | 0.73 (0.50, 1.06) | 0.93 (0.67, 1.29) | 0.92 (0.62, 1.36) |
| Q4 | 0.74 (0.61, 0.89) † | 0.48 (0.32, 0.74) † | 0.93 (0.64, 1.35) | 0.68 (0.48, 0.98) † | 1.02 (0.68, 1.54) |
| Beef or mutton | |||||
| Q2 | 0.99 (0.81, 1.23) | 1.89 (1.18, 3.02) † | 0.79 (0.50, 1.24) | 1.18 (0.84, 1.65) | 0.56 (0.35, 0.89) † |
| Q3 | 0.80 (0.67, 0.94) † | 1.57 (1.07, 2.32) † | 0.75 (0.53, 1.05) | 0.74 (0.54, 1.02) | 0.50 (0.34, 0.73) † |
| Q4 | 0.74 (0.62, 0.88) † | 0.79 (0.50, 1.25) | 0.99 (0.71, 1.37) | 0.54 (0.37, 0.79) † | 0.69 (0.47, 1.00) |
| Poultry | |||||
| Q2 | 0.94 (0.79, 1.12) | 1.64 (1.10, 2.45) † | 0.98 (0.69, 1.39) | 1.01 (0.74, 1.38) | 0.74 (0.51, 1.07) |
| Q3 | 0.81 (0.67, 0.97) † | 0.82 (0.52, 1.29) | 1.05 (0.73, 1.49) | 0.85 (0.59, 1.21) | 0.75 (0.51, 1.12) |
| Q4 | 0.62 (0.52, 0.75) † | 0.59 (0.37, 0.94) † | 0.61 (0.41, 0.89) † | 0.67 (0.47, 0.96) † | 0.72 (0.49, 1.06) |
| Fish | |||||
| Q2 | 1.01 (0.84, 1.21) | 1.82 (1.19, 2.78) † | 0.68 (0.47, 0.97) † | 1.35 (0.99, 1.84) | 0.70 (0.47, 1.04) |
| Q3 | 0.72 (0.60, 0.87) † | 0.91 (0.57, 1.46) | 0.74 (0.52, 1.05) | 0.79 (0.56, 1.13) | 0.72 (0.48, 1.07) |
| Q4 | 0.68 (0.56, 0.82) † | 0.76 (0.47, 1.24) | 0.65 (0.45, 0.94) † | 0.60 (0.41, 0.87) † | 1.10 (0.76, 1.59) |
| Eggs | |||||
| Q2 | 1.15 (0.96, 1.38) | 1.10 (0.70, 1.70) | 1.78 (1.25, 2.56) † | 0.93 (0.67, 1.31) | 1.00 (0.67, 1.47) |
| Q3 | 1.05 (0.88, 1.26) | 1.01 (0.65, 1.57) | 1.26 (0.86, 1.85) | 0.81 (0.57, 1.14) | 1.14 (0.78, 1.68) |
| Q4 | 1.23 (1.03, 1.48) † | 1.48 (0.97, 2.27) | 1.57 (1.07, 2.31) † | 1.08 (0.78, 1.50) | 1.32 (0.90, 1.94) |
| Dairy | |||||
| T1 | 1.08 (0.89, 1.30) | 1.54 (1.01, 2.35) † | 1.21 (0.86, 1.72) | 1.47 (1.05, 2.05) † | 0.69 (0.45, 1.08) |
| T2 | 0.82 (0.67, 1.00) † | 0.75 (0.45, 1.26) | 0.86 (0.59, 1.25) | 0.93 (0.60, 1.42) | 0.67 (0.42, 1.06) |
| T3 | 0.87 (0.72, 1.07) | 1.51 (1.00, 2.29) † | 0.60 (0.38, 0.93) † | 1.09 (0.73, 1.63) | 0.49 (0.29, 0.82) † |
| Nuts | |||||
| T1 | 1.00 (0.84, 1.20) | 3.01 (2.03, 4.47) † | 0.51 (0.34, 0.77) † | 1.63 (1.20, 2.21) † | 0.87 (0.60, 1.26) |
| T2 | 0.77 (0.64, 0.92) | 1.69 (1.09, 2.62) † | 0.83 (0.59, 1.17) | 0.87 (0.60, 1.24) | 0.79 (0.54, 1.16) |
| T3 | 0.65 (0.54, 0.78) † | 1.40 (0.87, 2.24) | 0.77 (0.54, 1.09) | 0.80 (0.55, 1.17) | 0.48 (0.30, 0.75) † |
| Foods | Global Cognitive Function | Cognition Domain Scores | |||||
|---|---|---|---|---|---|---|---|
| MIS | EIS | VIS | LIS | AIS | OIS | ||
| Rice | |||||||
| Q1 | 19.55 ± 6.17 | 10.00 ± 4.59 | 7.61 ± 3.34 | 4.97 ± 1.75 | 4.36 ± 1.35 | 12.09 ± 4.31 | 5.23 ± 1.22 |
| Q2 | 22.03 ± 5.74 | 11.19 ± 4.00 | 9.04 ± 3.13 | 5.49 ± 1.56 | 4.59 ± 1.36 | 13.19 ± 3.95 | 5.57 ± 0.92 |
| Q3 | 22.68 ± 6.44 | 11.80 ± 3.95 | 9.17 ± 3.45 | 5.44 ± 1.85 | 4.65 ± 1.45 | 13.90 ± 3.85 | 5.60 ± 0.88 |
| Q4 | 22.05 ± 6.22 | 11.40 ± 4.09 | 9.06 ± 3.24 | 5.17 ± 1.91 | 4.40 ± 1.50 | 13.59 ± 3.69 | 5.59 ± 0.84 |
| Wheat | |||||||
| Q1 | 22.71 ± 6.63 | 11.77 ± 4.02 | 9.28 ± 3.51 | 5.40 ± 1.90 | 4.54 ± 1.51 | 13.67 ± 4.00 | 5.60 ± 0.87 |
| Q2 | 21.95 ± 5.76 | 11.18 ± 3.89 | 8.92 ± 3.13 | 5.41 ± 1.70 | 4.59 ± 1.37 | 13.38 ± 3.77 | 5.63 ± 0.81 |
| Q3 | 21.82 ± 5.92 | 11.09 ± 4.23 | 8.88 ± 3.20 | 5.31 ± 1.74 | 4.56 ± 1.39 | 13.39 ± 3.90 | 5.59 ± 0.92 |
| Q4 | 19.68 ± 6.31 | 10.27 ± 4.60 | 7.71 ± 3.38 | 4.95 ± 1.74 | 4.30 ± 1.40 | 12.22 ± 4.27 | 5.15 ± 1.24 |
| Tubers | |||||||
| Q1 | 21.07 ± 6.74 * | 11.07 ± 4.22 * | 8.45 ± 3.61 * | 5.08 ± 1.93 | 4.33 ± 1.50 | 12.74 ± 4.22 | 5.38 ± 1.08 |
| Q2 | 21.81 ± 6.28 | 11.24 ± 4.19 | 8.85 ± 3.33 | 5.35 ± 1.76 | 4.56 ± 1.44 | 13.35 ± 3.89 | 5.51 ± 0.97 |
| Q3 | 21.74 ± 6.10 | 11.03 ± 4.30 | 8.79 ± 3.27 | 5.35 ± 1.72 | 4.60 ± 1.35 | 13.28 ± 4.01 | 5.55 ± 0.95 |
| Q4 | 21.49 ± 5.88 | 10.93 ± 4.20 | 8.68 ± 3.19 | 5.28 ± 1.69 | 4.51 ± 1.38 | 13.25 ± 3.97 | 5.53 ± 0.97 |
| Legumes | |||||||
| Q1 | 19.47 ± 6.68 | 9.94 ± 4.67 | 7.74 ± 3.52 | 4.70 ± 1.95 | 4.08 ± 1.52 | 11.95 ± 4.34 | 5.26 ± 1.19 |
| Q2 | 21.44 ± 6.36 | 10.98 ± 4.41 | 8.64 ± 3.42 | 5.25 ± 1.73 | 4.57 ± 1.40 | 13.16 ± 4.06 | 5.47 ± 1.02 |
| Q3 | 22.16 ± 5.88 | 11.52 ± 3.78 | 9.01 ± 3.20 | 5.50 ± 1.64 | 4.57 ± 1.38 | 13.44 ± 3.81 | 5.54 ± 0.91 |
| Q4 | 23.02 ± 5.50 | 11.82 ± 3.74 | 9.39 ± 3.05 | 5.61 ± 1.64 | 4.77 ± 1.29 | 14.08 ± 3.57 | 5.70 ± 0.76 |
| Fresh vegetables | |||||||
| Q1 | 20.37 ± 6.29 | 10.28 ± 4.62 | 8.16 ± 3.28 | 5.05 ± 1.75 | 4.30 ± 1.48 | 12.35 ± 4.11 | 5.39 ± 1.12 |
| Q2 | 20.61 ± 6.45 | 10.52 ± 4.39 | 8.24 ± 3.49 | 5.14 ± 1.82 | 4.38 ± 1.43 | 12.53 ± 4.26 | 5.41 ± 1.08 |
| Q3 | 21.91 ± 6.18 | 11.44 ± 3.94 | 8.88 ± 3.35 | 5.31 ± 1.76 | 4.55 ± 1.40 | 13.49 ± 3.82 | 5.48 ± 0.97 |
| Q4 | 23.23 ± 5.67 | 12.04 ± 3.67 | 9.49 ± 3.13 | 5.55 ± 1.74 | 4.77 ± 1.32 | 14.27 ± 3.60 | 5.69 ± 0.75 |
| Fresh fruit | |||||||
| Q1 | 19.62 ± 6.48 | 10.31 ± 4.56 | 7.70 ± 3.43 | 4.78 ± 1.89 | 4.15 ± 1.54 | 12.08 ± 4.22 | 5.25 ± 1.16 |
| Q2 | 21.02 ± 6.01 | 10.73 ± 4.18 | 8.46 ± 3.25 | 5.11 ± 1.77 | 4.43 ± 1.39 | 12.96 ± 3.87 | 5.51 ± 0.97 |
| Q3 | 22.66 ± 6.05 | 11.66 ± 3.86 | 9.28 ± 3.26 | 5.54 ± 1.71 | 4.68 ± 1.37 | 13.71 ± 3.87 | 5.59 ± 0.93 |
| Q4 | 22.81 ± 5.94 | 11.58 ± 4.14 | 9.34 ± 3.21 | 5.63 ± 1.60 | 4.74 ± 1.29 | 13.87 ± 3.89 | 5.63 ± 0.86 |
| Pork | |||||||
| Q1 | 19.98 ± 6.11 | 10.17 ± 4.57 | 7.97 ± 3.23 | 5.04 ± 1.76 | 4.28 ± 1.46 | 12.24 ± 4.20 | 5.32 ± 1.15 |
| Q2 | 21.30 ± 6.29 | 11.02 ± 4.05 | 8.60 ± 3.38 | 5.22 ± 1.79 | 4.49 ± 1.45 | 12.96 ± 3.98 | 5.44 ± 1.07 |
| Q3 | 22.18 ± 6.35 | 11.19 ± 4.26 | 9.02 ± 3.43 | 5.42 ± 1.76 | 4.59 ± 1.38 | 13.52 ± 4.04 | 5.58 ± 0.91 |
| Q4 | 22.66 ± 5.96 | 11.89 ± 3.81 | 9.18 ± 3.25 | 5.38 ± 1.78 | 4.63 ± 1.37 | 13.92 ± 3.68 | 5.64 ± 0.78 |
| Beef or mutton | |||||||
| Q1 | 20.38 ± 6.61 | 10.65 ± 4.52 | 8.03 ± 3.50 | 5.03 ± 1.83 | 4.29 ± 1.47 | 12.32 ± 4.37 | 5.34 ± 1.13 |
| Q2 | 20.40 ± 6.14 | 10.60 ± 4.44 | 8.14 ± 3.31 | 5.00 ± 1.78 | 4.31 ± 1.43 | 12.57 ± 4.07 | 5.42 ± 1.01 |
| Q3 | 22.18 ± 5.80 | 11.18 ± 4.06 | 9.14 ± 3.09 | 5.41 ± 1.74 | 4.67 ± 1.37 | 13.83 ± 3.60 | 5.59 ± 0.91 |
| Q4 | 23.16 ± 5.75 | 11.82 ± 3.70 | 9.52 ± 3.15 | 5.60 ± 1.67 | 4.74 ± 1.33 | 14.05 ± 3.54 | 5.66 ± 0.79 |
| Poultry | |||||||
| Q1 | 20.25 ± 6.22 | 10.57 ± 4.36 | 7.97 ± 3.37 | 5.09 ± 1.78 | 4.32 ± 1.43 | 12.38 ± 4.28 | 5.34 ± 1.11 |
| Q2 | 20.41 ± 6.28 | 10.55 ± 4.42 | 8.26 ± 3.28 | 4.92 ± 1.84 | 4.30 ± 1.49 | 12.78 ± 3.96 | 5.38 ± 1.09 |
| Q3 | 22.32 ± 6.02 | 11.30 ± 3.89 | 9.16 ± 3.28 | 5.47 ± 1.68 | 4.66 ± 1.33 | 13.63 ± 3.72 | 5.57 ± 0.91 |
| Q4 | 23.11 ± 6.04 | 11.84 ± 4.08 | 9.38 ± 3.29 | 5.58 ± 1.73 | 4.72 ± 1.38 | 13.84 ± 3.95 | 5.68 ± 0.81 |
| Fish | |||||||
| Q1 | 20.13 ± 6.05 | 10.50 ± 4.30 | 7.92 ± 3.24 | 5.07 ± 1.72 | 4.25 ± 1.40 | 12.10 ± 4.25 | 5.34 ± 1.13 |
| Q2 | 20.64 ± 6.23 | 10.31 ± 4.49 | 8.36 ± 3.28 | 5.14 ± 1.76 | 4.41 ± 1.46 | 12.72 ± 4.05 | 5.45 ± 1.02 |
| Q3 | 22.71 ± 6.12 | 11.56 ± 4.16 | 9.30 ± 3.27 | 5.56 ± 1.66 | 4.73 ± 1.37 | 13.84 ± 3.85 | 5.59 ± 0.91 |
| Q4 | 22.61 ± 6.21 | 11.88 ± 3.74 | 9.18 ± 3.43 | 5.29 ± 1.92 | 4.61 ± 1.40 | 13.96 ± 3.64 | 5.58 ± 0.89 |
| Eggs | |||||||
| Q1 | 21.53 ± 6.48 | 11.01 ± 4.30 | 8.76 ± 3.39 * | 5.14 ± 1.93 | 4.45 ± 1.47 | 13.14 ± 4.01 | 5.54 ± 0.96 |
| Q2 | 21.92 ± 6.02 | 11.32 ± 4.03 | 8.85 ± 3.27 | 5.35 ± 1.76 | 4.58 ± 1.38 | 13.56 ± 3.75 | 5.52 ± 0.94 |
| Q3 | 21.63 ± 6.18 | 11.14 ± 4.25 | 8.68 ± 3.30 | 5.37 ± 1.72 | 4.54 ± 1.42 | 13.08 ± 4.13 | 5.48 ± 1.04 |
| Q4 | 21.04 ± 6.33 | 10.80 ± 4.32 | 8.49 ± 3.46 | 5.20 ± 1.69 | 4.43 ± 1.40 | 12.84 ± 4.20 | 5.43 ± 1.03 |
| Dairy | |||||||
| T0 | 20.94 ± 6.46 | 10.96 ± 4.34 | 8.32 ± 3.45 | 5.10 ± 1.83 | 4.39 ± 1.44 | 12.82 ± 4.16 | 5.40 ± 1.06 |
| T1 | 21.15 ± 6.17 | 10.55 ± 4.27 | 8.67 ± 3.29 | 5.18 ± 1.81 | 4.44 ± 1.44 | 12.99 ± 3.87 | 5.50 ± 0.99 |
| T2 | 22.79 ± 5.98 | 11.71 ± 3.82 | 9.29 ± 3.24 | 5.58 ± 1.69 | 4.71 ± 1.38 | 13.89 ± 3.85 | 5.65 ± 0.90 |
| T3 | 23.00 ± 5.36 | 11.39 ± 4.00 | 9.58 ± 2.90 | 5.70 ± 1.50 | 4.78 ± 1.30 | 13.95 ± 3.63 | 5.68 ± 0.76 |
| Nuts | |||||||
| T0 | 20.69 ± 6.16 | 10.80 ± 4.30 | 8.15 ± 3.32 | 5.14 ± 1.72 | 4.38 ± 1.41 | 12.46 ± 4.17 | 5.39 ± 1.08 |
| T1 | 20.80 ± 6.36 | 10.36 ± 4.40 | 8.53 ± 3.39 | 5.02 ± 1.96 | 4.37 ± 1.46 | 13.09 ± 4.00 | 5.48 ± 0.99 |
| T2 | 22.27 ± 6.10 | 11.43 ± 4.06 | 9.20 ± 3.29 | 5.35 ± 1.79 | 4.58 ± 1.42 | 13.68 ± 3.61 | 5.55 ± 0.95 |
| T3 | 23.44 ± 6.03 | 12.03 ± 3.83 | 9.59 ± 3.22 | 5.72 ± 1.62 | 4.83 ± 1.35 | 14.32 ± 3.77 | 5.68 ± 0.80 |
| Foods | Global Cognitive Function | Cognition Domain Scores | ||||||||||||
|---|---|---|---|---|---|---|---|---|---|---|---|---|---|---|
| MIS | EIS | VIS | LIS | AIS | OIS | |||||||||
| β | p Value | β | p Value | β | p Value | β | p Value | β | p Value | β | p Value | β | p Value | |
| Rice | ||||||||||||||
| Q2 | 0.79 | 0.008 | 0.51 | 0.016 | 0.44 | 0.002 | 0.08 | 0.257 | 0.00 | 0.952 | −0.10 | 0.609 | 0.00 | 0.963 |
| Q3 | 2.26 | <0.001 | 1.19 | <0.001 | 1.00 | <0.001 | 0.25 | <0.001 | 0.26 | <0.001 | 1.10 | <0.001 | 0.00 | 0.564 |
| Q4 | 0.51 | 0.056 | 0.21 | 0.378 | 0.49 | 0.003 | −0.19 | 0.028 | −0.12 | 0.116 | 0.32 | 0.109 | 0.00 | 1.000 |
| Wheat | ||||||||||||||
| Q2 | −0.88 | 0.003 | −0.50 | 0.004 | −0.60 | <0.001 | 0.00 | 0.952 | −0.10 | 0.194 | −0.30 | 0.087 | 0.00 | 1.000 |
| Q3 | −1.01 | <0.001 | −0.37 | 0.013 | −0.47 | 0.002 | −0.19 | 0.021 | −0.03 | 0.626 | −0.45 | 0.007 | 0.00 | 1.000 |
| Q4 | −1.16 | <0.001 | −0.19 | 0.307 | −0.64 | <0.001 | −0.06 | 0.531 | −0.02 | 0.787 | −0.38 | 0.106 | 0.00 | 1.000 |
| Tubers | ||||||||||||||
| Q2 | −0.03 | 0.917 | −0.18 | 0.299 | 0.06 | 0.688 | 0.00 | 0.974 | 0.13 | 0.092 | −0.01 | 0.973 | 0.00 | 0.945 |
| Q3 | −0.01 | 0.964 | −0.27 | 0.267 | 0.00 | 0.990 | 0.04 | 0.616 | 0.13 | 0.062 | 0.02 | 0.916 | 0.00 | 1.000 |
| Q4 | −0.11 | 0.693 | −0.24 | 0.161 | 0.07 | 0.642 | −0.01 | 0.898 | 0.08 | 0.269 | 0.14 | 0.442 | 0.00 | 0.979 |
| Legumes | ||||||||||||||
| Q2 | 0.68 | 0.018 | 0.30 | 0.153 | 0.39 | 0.015 | 0.32 | <0.001 | 0.28 | <0.001 | 0.36 | 0.055 | 0.00 | 1.000 |
| Q3 | 1.12 | <0.001 | 0.64 | 0.002 | 0.35 | 0.009 | 0.47 | <0.001 | 0.19 | 0.013 | 0.25 | 0.186 | 0.00 | 1.000 |
| Q4 | 1.57 | <0.001 | 1.04 | <0.001 | 0.61 | <0.001 | 0.60 | <0.001 | 0.29 | <0.001 | 1.09 | <0.001 | 0.00 | 1.000 |
| Fresh vegetables | ||||||||||||||
| Q2 | 0.22 | 0.462 | −0.03 | 0.868 | −0.07 | 0.672 | 0.06 | 0.503 | −0.09 | 0.201 | −0.04 | 0.823 | 0.00 | 0.988 |
| Q3 | 0.65 | 0.032 | 0.76 | <0.001 | 0.12 | 0.458 | 0.03 | 0.807 | −0.04 | 0.585 | 0.75 | <0.001 | 0.00 | 0.926 |
| Q4 | 1.58 | <0.001 | 1.14 | <0.001 | 0.64 | <0.001 | 0.27 | 0.010 | 0.15 | 0.041 | 1.16 | <0.001 | 0.00 | 1.000 |
| Fresh fruit | ||||||||||||||
| Q2 | 0.00 | 1.000 | −0.20 | 0.232 | −0.01 | 0.962 | 0.07 | 0.280 | 0.06 | 0.325 | 0.11 | 0.573 | 0.00 | 0.981 |
| Q3 | 1.54 | <0.001 | 0.76 | <0.001 | 0.79 | <0.001 | 0.44 | <0.001 | 0.26 | 0.001 | 0.86 | <0.001 | 0.00 | 1.000 |
| Q4 | 1.16 | <0.001 | 0.41 | 0.054 | 0.56 | <0.001 | 0.41 | <0.001 | 0.15 | 0.055 | 0.83 | <0.001 | 0.00 | 1.000 |
| Pork | ||||||||||||||
| Q2 | 1.03 | <0.001 | 0.40 | 0.032 | 0.30 | 0.039 | −0.01 | 0.861 | 0.22 | 0.001 | 0.56 | 0.003 | 0.00 | 1.000 |
| Q3 | 1.70 | <0.001 | 0.83 | <0.001 | 0.69 | <0.001 | 0.19 | 0.020 | 0.22 | 0.002 | 0.88 | <0.001 | 0.00 | 0.874 |
| Q4 | 1.46 | <0.001 | 1.10 | <0.001 | 0.45 | 0.014 | 0.02 | 0.769 | 0.11 | 0.116 | 0.89 | <0.001 | 0.00 | 1.000 |
| Beef or mutton | ||||||||||||||
| Q2 | −0.42 | 0.169 | −0.53 | 0.069 | −0.28 | 0.150 | −0.18 | 0.066 | −0.06 | 0.437 | 0.18 | 0.431 | 0.00 | 0.923 |
| Q3 | 0.42 | 0.144 | −0.14 | 0.310 | 0.38 | 0.004 | 0.12 | 0.095 | 0.20 | 0.002 | 0.79 | <0.001 | 0.00 | 1.000 |
| Q4 | 0.66 | 0.016 | 0.06 | 0.723 | 0.20 | 0.130 | 0.08 | 0.260 | 0.07 | 0.273 | 0.42 | 0.023 | 0.00 | 0.969 |
| Poultry | ||||||||||||||
| Q2 | 0.00 | 0.993 | −0.05 | 0.780 | −0.01 | 0.939 | −0.17 | 0.021 | 0.03 | 0.695 | 0.42 | 0.018 | 0.00 | 1.000 |
| Q3 | 0.68 | 0.010 | 0.00 | 1.000 | 0.26 | 0.042 | 0.01 | 0.875 | 0.08 | 0.238 | 0.38 | 0.028 | 0.00 | 0.994 |
| Q4 | 1.69 | <0.001 | 0.75 | <0.001 | 0.61 | <0.001 | 0.00 | 1.000 | 0.25 | <0.001 | 0.67 | <0.001 | 0.00 | 1.000 |
| Fish | ||||||||||||||
| Q2 | 0.09 | 0.755 | −0.08 | 0.717 | 0.18 | 0.286 | −0.05 | 0.507 | 0.11 | 0.060 | 0.69 | <0.001 | 0.00 | 0.948 |
| Q3 | 1.51 | <0.001 | 0.74 | <0.001 | 0.64 | <0.001 | 0.26 | 0.003 | 0.25 | <0.001 | 1.15 | <0.001 | 0.00 | 1.000 |
| Q4 | 1.60 | <0.001 | 0.87 | <0.001 | 0.66 | <0.001 | 0.06 | 0.545 | 0.23 | 0.004 | 1.33 | <0.001 | 0.00 | 1.000 |
| Eggs | ||||||||||||||
| Q2 | 0.01 | 0.985 | 0.12 | 0.493 | −0.04 | 0.775 | 0.28 | <0.001 | 0.14 | 0.046 | 0.34 | 0.066 | 0.00 | 1.000 |
| Q3 | 0.10 | 0.682 | 0.30 | 0.120 | −0.13 | 0.328 | 0.21 | 0.010 | 0.10 | 0.110 | −0.03 | 0.846 | 0.00 | 1.000 |
| Q4 | −0.44 | 0.127 | −0.01 | 0.957 | −0.28 | 0.088 | −0.01 | 0.877 | 0.04 | 0.561 | −0.12 | 0.536 | 0.00 | 1.000 |
| Dairy | ||||||||||||||
| T1 | −0.86 | 0.001 | −1.00 | <0.001 | −0.25 | 0.099 | −0.29 | <0.001 | −0.18 | 0.020 | −0.62 | 0.001 | 0.00 | 1.000 |
| T2 | 0.26 | 0.405 | −0.08 | 0.551 | 0.05 | 0.757 | 0.10 | 0.193 | 0.10 | 0.196 | −0.10 | 0.632 | 0.00 | 0.998 |
| T3 | 0.18 | 0.568 | −0.17 | 0.382 | 0.22 | 0.165 | 0.14 | 0.068 | 0.08 | 0.387 | 0.10 | 0.610 | 0.00 | 1.000 |
| Nuts | ||||||||||||||
| T1 | −0.58 | 0.048 | −0.65 | 0.003 | −0.02 | 0.899 | 0.00 | 1.000 | −0.17 | 0.012 | 0.41 | 0.018 | 0.00 | 1.000 |
| T2 | 0.49 | 0.048 | 0.25 | 0.144 | 0.35 | 0.008 | 0.06 | 0.458 | 0.02 | 0.706 | 0.60 | <0.001 | 0.00 | 1.000 |
| T3 | 1.87 | <0.001 | 0.71 | <0.001 | 0.64 | <0.001 | 0.50 | <0.001 | 0.34 | <0.001 | 1.39 | <0.001 | 0.00 | 1.000 |
Publisher’s Note: MDPI stays neutral with regard to jurisdictional claims in published maps and institutional affiliations. |
© 2021 by the authors. Licensee MDPI, Basel, Switzerland. This article is an open access article distributed under the terms and conditions of the Creative Commons Attribution (CC BY) license (https://creativecommons.org/licenses/by/4.0/).
Share and Cite
Huang, Q.; Jia, X.; Zhang, J.; Huang, F.; Wang, H.; Zhang, B.; Wang, L.; Jiang, H.; Wang, Z. Diet–Cognition Associations Differ in Mild Cognitive Impairment Subtypes. Nutrients 2021, 13, 1341. https://doi.org/10.3390/nu13041341
Huang Q, Jia X, Zhang J, Huang F, Wang H, Zhang B, Wang L, Jiang H, Wang Z. Diet–Cognition Associations Differ in Mild Cognitive Impairment Subtypes. Nutrients. 2021; 13(4):1341. https://doi.org/10.3390/nu13041341
Chicago/Turabian StyleHuang, Qiumin, Xiaofang Jia, Jiguo Zhang, Feifei Huang, Huijun Wang, Bing Zhang, Liusen Wang, Hongru Jiang, and Zhihong Wang. 2021. "Diet–Cognition Associations Differ in Mild Cognitive Impairment Subtypes" Nutrients 13, no. 4: 1341. https://doi.org/10.3390/nu13041341