
Polymorphisms Contributing to Calcium Status: A Systematic Review


Abstract
:1. Introduction
2. Materials and Methods
2.1. Search Methods
2.2. Inclusion Criteria
2.3. Exclusion Criteria
2.4. Data Collection and Analysis
2.4.1. Selection of Studies
2.4.2. Data Extraction
2.5. Assessment of Study Quality
3. Results
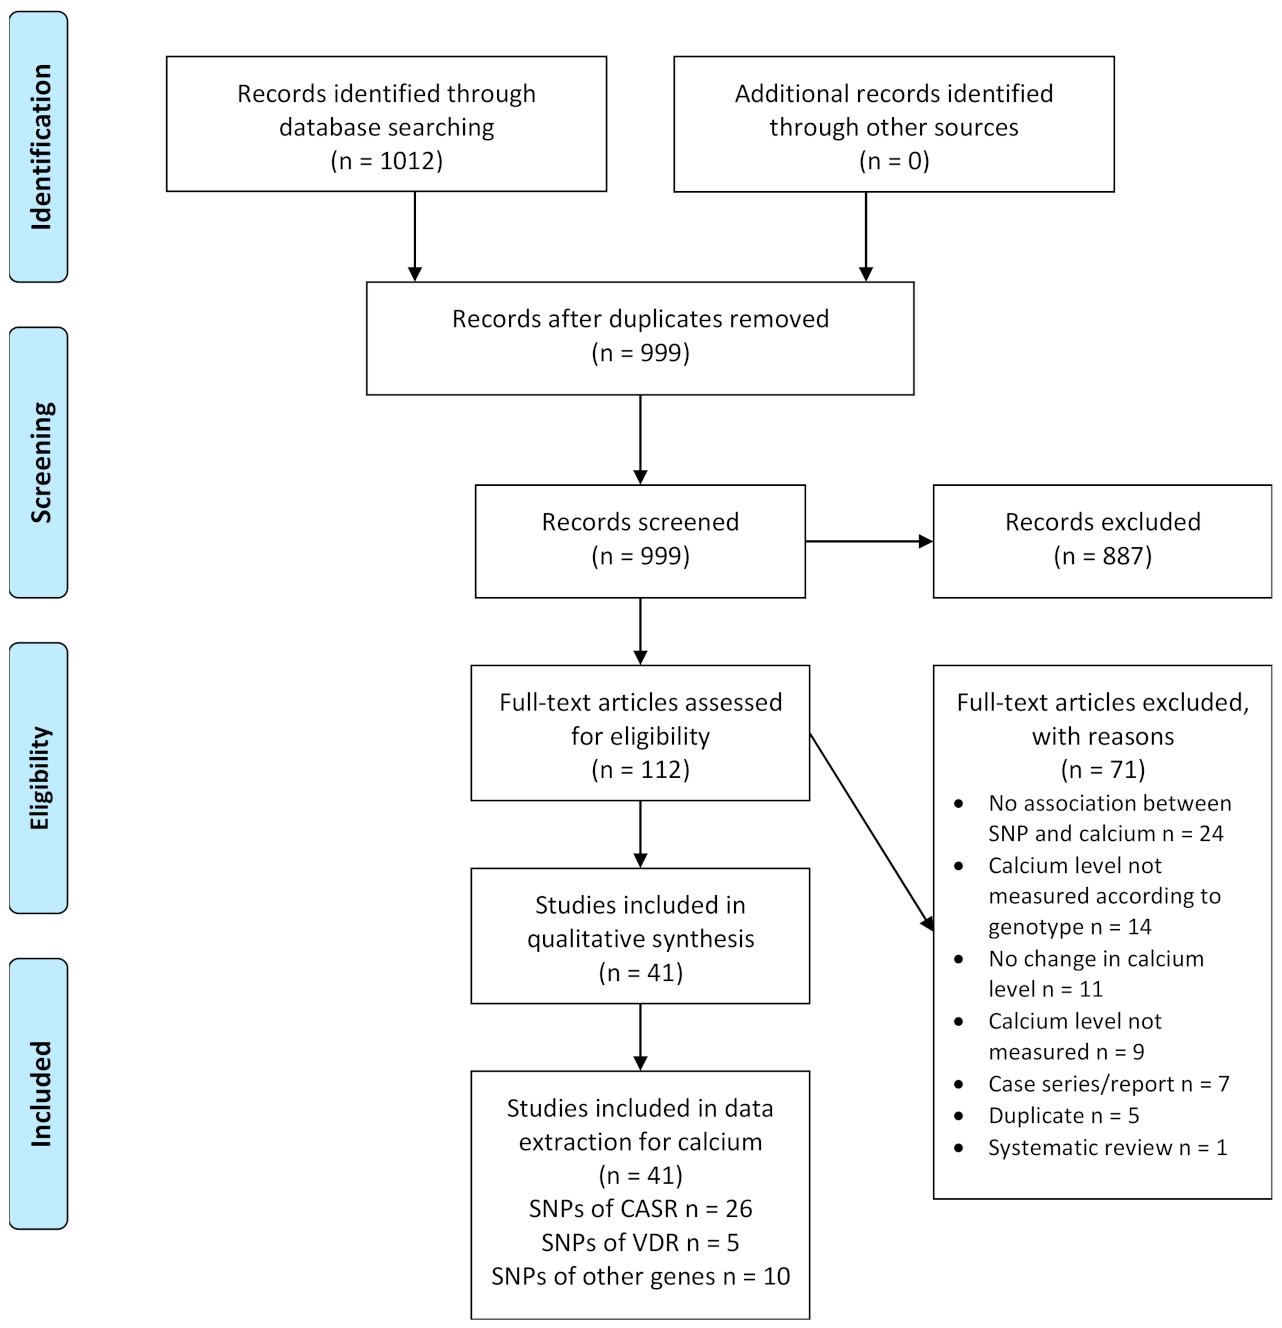
3.1. Results of the Search
3.2. Assessment of Study Quality
3.3. Description of Included Studies
3.4. Description of Participants in Included Studies
3.5. Calcium and Polymorphism of the Calcium-Sensing Receptor (CASR)
3.6. Calcium and Polymorphism of the Vitamin D Receptor (VDR)
3.7. Calcium and Polymorphism of Other Genes
4. Discussion
5. Conclusions
Supplementary Materials
Author Contributions
Funding
Institutional Review Board Statement
Informed Consent Statement
Acknowledgments
Conflicts of Interest
References
- Institute of Medicine (US) Committee to Review Dietary Reference Intakes for Vitamin D and Calcium. Dietary Reference Intakes for Calcium and Vitamin D; Ross, A.C., Taylor, C.L., Yaktine, A.L., Del Valle, H.B., Eds.; National Academies Press: Washington, DC, USA, 2011; p. 3, Overview of Vitamin D. Available online: https://www.ncbi.nlm.nih.gov/books/NBK56060/ (accessed on 3 July 2021).
- Shaker, J.L.; Deftos, L. Calcium and Phosphate Homeostasis. In Endotext; Feingold, K.R., Anawalt, B., Boyce, A., Chrousos, G., de Herder, W.W., Dhatariya, K., Dungan, K., Grossman, A., Hershman, J.M., Hofland, J., et al., Eds.; MDText.com, Inc.: South Dartmouth, MA, USA, 2018. Available online: https://www.ncbi.nlm.nih.gov/books/NBK279023/ (accessed on 3 July 2021).
- Bonny, O.; Bochud, M. Genetics of calcium homeostasis in humans: Continuum between monogenic diseases and continuous phenotypes. Nephrol. Dial. Transplant. 2014, 29, iv55–iv62. [Google Scholar] [CrossRef] [PubMed] [Green Version]
- Pu, F.; Chen, N.; Xue, S. Calcium intake, calcium homeostasis and health. Food Sci. Hum. Wellness 2016, 5, 8–16. [Google Scholar] [CrossRef] [Green Version]
- Ross, A.C.; Manson, J.E.; Abrams, S.A.; Aloia, J.F.; Brannon, P.M.; Clinton, S.K.; Durazo-Arvizu, R.A.; Gallagher, J.C.; Gallo, R.L.; Jones, G.; et al. The 2011 report on dietary reference intakes for calcium and vitamin D from the Institute of Medicine: What clinicians need to know. J. Clin. Endocrinol. Metab. 2011, 96, 53–58. [Google Scholar] [CrossRef] [PubMed]
- Bove-Fenderson, E.; Mannstadt, M. Hypocalcemic disorders. Best Pract. Research Clin. Endocrinol. Metab. 2018, 32, 639–656. [Google Scholar] [CrossRef]
- Khoury, N.; Carmichael, K.A. Evaluation and therapy of hypercalcemia. Mo. Med. 2011, 108, 99–103. [Google Scholar]
- Annerbo, M.; Lind, L.; Bjorklund, P.; Hellman, P. Association between calcium sensing receptor polymorphisms and serum calcium in a Swedish well-characterized cohort. Endocr. Rev. 2015, 36. [Google Scholar]
- Cerani, A.; Zhou, S.; Richards, J.B.; Forgetta, V.; Morris, J.A.; Trajanoska, K.; Rivadeneira, F.; Larsson, S.; Michaelsson, K. Genetic predisposition to increased serum calcium on bone mineral density and the risk of fracture in individuals with normal calcium levels: A Mendelian randomization study. J. Bone Miner. Res. 2019, 34, 237. [Google Scholar] [CrossRef] [Green Version]
- Arcidiacono, T.; Rainone, F.; Paloschi, V.; Scillitani, A.; Terranegra, A.; Dogliotti, E.; Guarnieri, V.; Aloia, A.; Borghi, L.; Guerra, A.; et al. Polymorphisms of the calcium-sensing receptor gene and stones in primary hyperparathyroidism. Arch. Ital. Di Urol. E Androl. 2009, 81, 148. [Google Scholar]
- Scillitani, A.; Guarnieri, V.; De Geronimo, S.; Muscarella, L.A.; Battista, C.; D’Agruma, L.; Bertoldo, F.; Florio, C.; Minisola, S.; Hendy, G.N.; et al. Blood ionized calcium is associated with clustered polymorphisms in the carboxyl-terminal tail of the calcium-sensing receptor. J. Clin. Endocrinol. Metab. 2004, 89, 5634–5638. [Google Scholar] [CrossRef] [Green Version]
- Nakano, Y.; Oshima, T.; Sasaki, S.; Yamaoka, K.; Matsumoto, T.; Hirao, H.; Ozono, R.; Matsuura, H.; Kajiyama, G.; Kambe, M. Vitamin D receptor gene polymorphism is associated with serum total and ionized calcium concentration. J. Mol. Med. 2000, 78, 575–579. [Google Scholar] [CrossRef]
- Ames, S.K.; Ellis, K.J.; Gunn, S.K.; Copeland, K.C.; Abrams, S.A. Vitamin D receptor gene Fok1 polymorphism predicts calcium absorption and bone mineral density in children. J. Bone Miner. Res. 1999, 14, 740–746. [Google Scholar] [CrossRef]
- Brown, E.M.; MacLeod, R.J. Extracellular calcium sensing and extracellular calcium signaling. Physiol. Rev. 2001, 81, 239–297. [Google Scholar] [CrossRef]
- Campos-Verdes, L.M.; Costa-Silva, D.R.; da Silva-Sampaio, J.P.; Barros-Oliveira, M.D.C.; Escórcio-Dourado, C.S.; Martins, L.M.; Sampaio, F.A.; Revoredo, C.; Alves-Ribeiro, F.A.; da Silva, B.B. Review of Polymorphism of the Calcium-Sensing Receptor Gene and Breast Cancer Risk. Cancer Investig. 2018, 36, 1–7. [Google Scholar] [CrossRef]
- Magno, A.L.; Ward, B.K.; Ratajczak, T. The calcium-sensing receptor: A molecular perspective. Endocr. Rev. 2011, 32, 3–30. [Google Scholar] [CrossRef] [Green Version]
- Vezzoli, G.; Terranegra, A.; Arcidiacono, T.; Biasion, R.; Coviello, D.; Syren, M.L.; Paloschi, V.; Giannini, S.; Mignogna, G.; Rubinacci, A.; et al. R990G polymorphism of calcium-sensing receptor does produce a gain-of-function and predispose to primary hypercalciuria. Kidney Int. 2007, 71, 1155–1162. [Google Scholar] [CrossRef]
- Yun, F.H.; Wong, B.Y.; Chase, M.; Shuen, A.Y.; Canaff, L.; Thongthai, K.; Siminovitch, K.; Hendy, G.N.; Cole, D.E. Genetic variation at the calcium-sensing receptor (CASR) locus: Implications for clinical molecular diagnostics. Clin. Biochem. 2007, 40, 551–561. [Google Scholar] [CrossRef]
- Wang, L.; Widatalla, S.E.; Whalen, D.S.; Ochieng, J.; Sakwe, A.M. Association of calcium sensing receptor polymorphisms at rs1801725 with circulating calcium in breast cancer patients. BMC Cancer 2017, 17. [Google Scholar] [CrossRef]
- Page, M.J.; McKenzie, J.E.; Bossuyt, P.M.; Boutron, I.; Hoffmann, T.C.; Mulrow, C.D.; Shamseer, L.; Tetzlaff, J.M.; Akl, E.A.; Brennan, S.E.; et al. The PRISMA 2020 statement: An updated guideline for reporting systematic reviews. BMJ 2021, 372, n71. [Google Scholar] [CrossRef]
- Ouzzani, M.; Hammady, H.; Fedorowicz, Z.; Elmagarmid, A. Rayyan-a web and mobile app for systematic reviews. Syst. Rev. 2016, 5, 210. [Google Scholar] [CrossRef] [Green Version]
- Sohani, Z.N.; Meyre, D.; de Souza, R.J.; Joseph, P.G.; Gandhi, M.; Dennis, B.B.; Norman, G.; Anand, S.S. Assessing the quality of published genetic association studies in meta-analyses: The quality of genetic studies (Q-Genie) tool. BMC Genet. 2015, 16, 50. [Google Scholar] [CrossRef] [Green Version]
- Chang, X.; Li, J.; Guo, Y.; Wei, Z.; Mentch, F.D.; Hou, C.; Zhao, Y.; Qiu, H.; Kim, C.; Sleiman, P.M.A.; et al. Genome-wide association study of serum minerals levels in children of different ethnic background. PLoS ONE 2015, 10. [Google Scholar] [CrossRef] [Green Version]
- Guha, M.; Bankura, B.; Ghosh, S.; Pattanayak, A.K.; Ghosh, S.; Pal, D.K.; Puri, A.; Kundu, A.K.; Das, M. Polymorphisms in CaSR and CLDN14 genes associated with increased risk of kidney stone disease in patients from the eastern part of India. PLoS ONE 2015, 10. [Google Scholar] [CrossRef] [Green Version]
- Jung, J.; Foroud, T.M.; Eckert, G.J.; Flury-Wetherill, L.; Edenberg, H.J.; Xuei, X.; Zaidi, S.A.; Pratt, J.H. Association of the calcium-sensing receptor gene with blood pressure and urinary calcium in african-americans. J. Clin. Endocrinol. Metab. 2009, 94, 1042–1048. [Google Scholar] [CrossRef] [Green Version]
- Kapur, K.; Johnson, T.; Beckmann, N.D.; Sehmi, J.; Tanaka, T.; Kutalik, Z.; Styrkarsdottir, U.; Zhang, W.; Marek, D.; Gudbjartsson, D.F.; et al. Genome-wide meta-analysis for serum calcium identifies significantly associated SNPs near the calcium-sensing receptor (CASR) gene. PLoS Genet. 2010, 6, 1–12. [Google Scholar] [CrossRef] [Green Version]
- Laaksonen, M.M.L.; Outila, T.A.; Kärkkäinen, M.U.M.; Kemi, V.E.; Rita, H.J.; Perola, M.; Valsta, L.M.; Lamberg-Allardt, C.J.E. Associations of vitamin D receptor, calcium-sensing receptor and parathyroid hormone gene polymorphisms with calcium homeostasis and peripheral bone density in adult Finns. J. Nutr. Nutr. 2009, 2, 55–63. [Google Scholar] [CrossRef]
- Larsson, S.C.; Burgess, S.; Michaëlsson, K. Association of genetic variants related to serum calcium levels with coronary artery disease and myocardial infarction. JAMA J. Am. Med. Assoc. 2017, 318, 371–380. [Google Scholar] [CrossRef]
- März, W.; Seelhorst, U.; Wellnitz, B.; Tiran, B.; Obermayer-Pietsch, B.; Renner, W.; Boehm, B.O.; Ritz, E.; Hoffmann, M.M. Alanine to serine polymorphism at position 986 of the calcium-sensing receptor associated with coronary heart disease, myocardial infarction, all-cause, and cardiovascular mortality. J. Clin. Endocrinol. Metab. 2007, 92, 2363–2369. [Google Scholar] [CrossRef] [Green Version]
- Vezzoli, G.; Scillitani, A.; Corbetta, S.; Terranegra, A.; Dogliotti, E.; Guarnieri, V.; Arcidiacono, T.; Macrina, L.; Mingione, A.; Brasacchio, C.; et al. Risk of nephrolithiasis in primary hyperparathyroidism is associated with two polymorphisms of the calcium-sensing receptor gene. J. Nephrol. 2014, 28, 67–72. [Google Scholar] [CrossRef]
- Vezzoli, G.; Scillitani, A.; Corbetta, S.; Terranegra, A.; Dogliotti, E.; Guarnieri, V.; Arcidiacono, T.; Paloschi, V.; Rainone, F.; Eller-Vainicher, C.; et al. Polymorphisms at the regulatory regions of the CASR gene influence stone risk in primary hyperparathyroidism. Eur. J. Endocrinol. Suppl. 2011, 164, 421–427. [Google Scholar] [CrossRef] [Green Version]
- Vezzoli, G.; Tanini, A.; Ferrucci, L.; Soldati, L.; Bianchin, C.; Franceschelli, F.; Malentacchi, C.; Porfirio, B.; Adamo, D.; Falchetti, A.; et al. Influence of calcium-sensing receptor gene on urinary calcium excretion in stone-forming patients. J. Am. Soc. Nephrol. 2002, 13, 2517–2523. [Google Scholar] [CrossRef] [Green Version]
- Arcidiacono, T.; Simonini, M.; Lanzani, C.; Citterio, L.; Salvi, E.; Barlassina, C.; Spotti, D.; Cusi, D.; Manunta, P.; Vezzoli, G. Claudin-14 gene polymorphisms and urine calcium excretion. Clin. J. Am. Soc. Nephrol. 2018, 13, 1542–1549. [Google Scholar] [CrossRef] [PubMed] [Green Version]
- Gianfagna, F.; Cugino, D.; Ahrens, W.; Bailey, M.E.S.; Bammann, K.; Herrmann, D.; Koni, A.C.; Kourides, Y.; Marild, S.; Molnár, D.; et al. Understanding the Links among neuromedin U Gene, beta2-adrenoceptor Gene and Bone Health: An Observational Study in European Children. PLoS ONE 2013, 8. [Google Scholar] [CrossRef] [PubMed] [Green Version]
- Howles, S.A.; Wiberg, A.; Goldsworthy, M.; Bayliss, A.L.; Gluck, A.K.; Ng, M.; Grout, E.; Tanikawa, C.; Kamatani, Y.; Terao, C.; et al. Genetic variants of calcium and vitamin D metabolism in kidney stone disease. Nat. Commun. 2019, 10. [Google Scholar] [CrossRef] [PubMed] [Green Version]
- Hwang, D.Y.; Chien, S.C.; Hsu, Y.W.; Kao, C.C.; Cheng, S.Y.; Lu, H.C.; Wu, M.S.; Chang, J.M. Genetic polymorphisms of ORAI1 and chronic kidney disease in Taiwanese population. BioMed Res. Int. 2014, 2014. [Google Scholar] [CrossRef]
- Kim, O.Y.; Kwak, S.Y.; Lim, H.; Shin, M.J. Genotype effects of glucokinase regulator on lipid profiles and glycemic status are modified by circulating calcium levels: Results from the Korean Genome and Epidemiology Study. Nutr. Res. 2018, 60, 96–105. [Google Scholar] [CrossRef]
- Koek, W.N.H.; Van Meurs, J.B.; Van Der Eerden, B.C.J.; Rivadeneira, F.; Zillikens, M.C.; Hofman, A.; Obermayer-Pietsch, B.; Lips, P.; Pols, H.A.; Uitterlinden, A.G.; et al. The T-13910C polymorphism in the lactase phlorizin hydrolase gene is associated with differences in serum calcium levels and calcium intake. J. Bone Miner. Res. 2010, 25, 1980–1987. [Google Scholar] [CrossRef]
- Bochud, M.; Marques-Vidal, P.; Waeber, G.; Vollenweider, P. Calcium and vitamin D supplements modify the effect of the rs11716910 CASR variant on serum calcium in the population-based CoLaus study. Clin. Chem. Lab. Med. 2011, 49, A15–A16. [Google Scholar] [CrossRef] [Green Version]
- Cole, D.E.C.; Peltekova, V.D.; Rubin, L.A.; Hawker, G.A.; Vieth, R.; Liew, C.C.; Hwang, D.M.; Evrovski, J.; Hendy, G.N. A986S polymorphism of the calcium-sensing receptor and circulating calcium concentrations. Lancet 1999, 353, 112–115. [Google Scholar] [CrossRef]
- Cole, D.E.C.; Vieth, R.; Trang, H.M.; Wong, B.Y.L.; Hendy, G.N.; Rubin, L.A. Association between total serum calcium and the A986S polymorphism of the calcium-sensing receptor gene. Mol. Genet. Metab. 2001, 72, 168–174. [Google Scholar] [CrossRef]
- Corbetta, S.; Eller-Vainicher, C.; Filopanti, M.; Saeli, P.; Vezzoli, G.; Arcidiacono, T.; Loli, P.; Syren, M.L.; Soldati, L.; Beck-Peccoz, P.; et al. R990G polymorphism of the calcium-sensing receptor and renal calcium excretion in patients with primary hyperparathyroidism. Eur. J. Endocrinol. 2006, 155, 687–692. [Google Scholar] [CrossRef]
- Jorde, R.; Schirmer, H.; Njølstad, I.; Løchen, M.L.; Bøgeberg Mathiesen, E.; Kamycheva, E.; Figenschau, Y.; Grimnes, G. Serum calcium and the calcium-sensing receptor polymorphism rs17251221 in relation to coronary heart disease, type 2 diabetes, cancer and mortality: The Tromsø Study. Eur. J. Epidemiol. 2013, 28, 569–578. [Google Scholar] [CrossRef]
- Lorentzon, M.; Lorentzon, R.; Lerner, U.H.; Nordström, P. Calcium sensing receptor gene polymorphism, circulating calcium concentrations and bone mineral density in healthy adolescent girls. Eur. J. Endocrinol. 2001, 144, 257–261. [Google Scholar] [CrossRef] [Green Version]
- Majid, H.; Khan, A.H.; Moatter, T. R990G polymorphism of calcium sensing receptor gene is associated with high parathyroid hormone levels in subjects with vitamin D deficiency: A cross-sectional study. BioMed Res. Int. 2015, 2015. [Google Scholar] [CrossRef]
- O’Seaghdha, C.M.; Yang, Q.; Glazer, N.L.; Leak, T.S.; Dehghan, A.; Smith, A.V.; Kao, W.L.; Lohman, K.; Hwang, S.J.; Johnson, A.D.; et al. Common variants in the calcium-sensing receptor gene are associated with total serum calcium levels. Hum. Mol. Genet. 2010, 19, 4296–4303. [Google Scholar] [CrossRef] [Green Version]
- Shakhssalim, N.; Basiri, A.; Houshmand, M.; Pakmanesh, H.; Golestan, B.; Azadvari, M.; Aryan, H.; Kashi, A.H. Genetic polymorphisms in calcitonin receptor gene and risk for recurrent kidney calcium stone disease. Urol. Int. 2014, 92, 356–362. [Google Scholar] [CrossRef]
- Shakhssalim, N.; Kazemi, B.; Basiri, A.; Houshmand, M.; Pakmanesh, H.; Golestan, B.; Eilanjegh, A.F.; Kashi, A.H.; Kilani, M.; Azadvari, M. Association between calcium-sensing receptor gene polymorphisms and recurrent calcium kidney stone disease: A comprehensive gene analysis. Scand. J. Urol. Nephrol. 2010, 44, 406–412. [Google Scholar] [CrossRef]
- Ferrari, S.; Manen, D.; Bonjour, J.P.; Slosman, D.; Rizzoli, R. Bone mineral mass and calcium and phosphate metabolism in young men: Relationships with vitamin D receptor allelic polymorphisms. J. Clin. Endocrinol. Metab. 1999, 84, 2043–2048. [Google Scholar] [CrossRef]
- Bellia, C.; Agnello, L.; Lo Sasso, B.; Milano, S.; Bivona, G.; Scazzone, C.; Pivetti, A.; Novo, G.; Palermo, C.; Bonomo, V.; et al. Fetuin-A is Associated to Serum Calcium and AHSG T256S Genotype but Not to Coronary Artery Calcification. Biochem. Genet. 2016, 54, 222–231. [Google Scholar] [CrossRef]
- Masi, L.; Del Monte, F.; Gozzini, A.; De Feo, M.L.; Gheri, R.G.; Neri, A.; Falchetti, A.; Amedei, A.; Imbriaco, R.; Mavilia, C.; et al. A novel polymorphism at the GNAS1 gene associated with low circulating calcium levels. Clin. Cases Miner. Bone Metab. 2007, 4, 139–145. [Google Scholar]
- Siomou, E.; Pavlou, M.; Papadopoulou, Z.; Vlaikou, A.M.; Chaliasos, N.; Syrrou, M. Calcium-sensing receptor gene polymorphisms and idiopathic hypercalciuria in children. Pediatric Nephrol. 2017, 32, 1789. [Google Scholar] [CrossRef] [Green Version]
- Wang, O.; Meng, X.W.; Xing, X.P.; Xia, W.B.; Li, M.; Xu, L.; Zhou, X.Y.; Jiao, J.; Hu, Y.Y.; Liu, H.C. Association of calcium-sensing receptor gene polymorphism with serum calcium level in healthy young Han women in Beijing. Zhonghua Nei Ke Za Zhi [Chin. J. Intern. Med.] 2007, 46, 43–47. [Google Scholar]
- Jehan, F.; Voloc, A.; Esterle, L.; Walrant-Debray, O.; Nguyen, T.M.; Garabedian, M. Growth, calcium status and vitamin D receptor (VDR) promoter genotype in European children with normal or low calcium intake. J. Steroid Biochem. Mol. Biol. 2010, 121, 117–120. [Google Scholar] [CrossRef]
- Relan, V.; Khullar, M.; Singh, S.K.; Sharma, S.K. Association of vitamin d receptor genotypes with calcium excretion in nephrolithiatic subjects in northern India. Urol. Res. 2004, 32, 236–240. [Google Scholar] [CrossRef]
- Fujita, T.; Yasuda, S.; Kamata, M.; Kamata, Y.; Kumagai, Y.; Majima, M. A common polymorphism in the tissue kallikrein gene is associated with increased urinary excretions of calcium and sodium in Japanese volunteers. J. Hum. Genet. 2013, 58, 758–761. [Google Scholar] [CrossRef] [Green Version]
- Hannan, F.M.; Kallay, E.; Chang, W.; Brandi, M.L.; Thakker, R.V. The calcium-sensing receptor in physiology and in calcitropic and noncalcitropic diseases. Nat. Rev. Endocrinol. 2018, 15, 33–51. [Google Scholar] [CrossRef]
- Hunter, D.J. The influence of genetic polymorphism. J. Nutr. 2006, 136, 2711s–2713s. [Google Scholar] [CrossRef] [Green Version]
- Loktionov, A. Common gene polymorphisms and nutrition: Emerging links with pathogenesis of multifactorial chronic diseases (review). J. Nutr. Biochem. 2003, 14, 426–451. [Google Scholar] [CrossRef]
- Day, K.J.; Adamski, M.M.; Dordevic, A.L.; Murgia, C. Genetic Variations as Modifying Factors to Dietary Zinc Requirements-A Systematic Review. Nutrients 2017, 9, 148. [Google Scholar] [CrossRef] [PubMed] [Green Version]
- Sepulveda-Villegas, M.; Elizondo-Montemayor, L.; Trevino, V. Identification and analysis of 35 genes associated with vitamin D deficiency: A systematic review to identify genetic variants. J. Steroid Biochem. Mol. Biol. 2020, 196, 105516. [Google Scholar] [CrossRef] [PubMed]
- Shane, B. Folate and vitamin B12 metabolism: Overview and interaction with riboflavin, vitamin B6, and polymorphisms. Food Nutr. Bull. 2008, 29, S5–S16. [Google Scholar] [CrossRef] [PubMed]
- Beer, S.; Tieder, M.; Kohelet, D.; Liberman, O.A.; Vure, E.; Bar-Joseph, G.; Gabizon, D.; Borochowitz, Z.U.; Varon, M.; Modai, D. Vitamin D resistant rickets with alopecia: A form of end organ resistance to 1,25 dihydroxy vitamin D. Clin. Endocrinol. 1981, 14, 395–402. [Google Scholar] [CrossRef]
- Heaney, R.P. Chapter 34-Vitamin D: Role in the Calcium and Phosphorus Economies. In Vitamin D, 3rd ed.; Feldman, D., Pike, J.W., Adams, J.S., Eds.; Academic Press: San Diego, CA, USA, 2011; pp. 607–624. [Google Scholar] [CrossRef]
- Fang, A.P.; Li, K.J.; Shi, H.Y.; He, J.J.; Li, H. Habitual dietary calcium intakes and calcium metabolism in healthy adults Chinese: A systematic review and meta-analysis. Asia Pac. J. Clin. Nutr. 2016, 25, 776–784. [Google Scholar] [CrossRef]
- Buchowski, M.S.; Aslam, M.; Dossett, C.; Dorminy, C.; Choi, L.; Acra, S. Effect of dairy and non-dairy calcium on fecal fat excretion in lactose digester and maldigester obese adults. Int. J. Obes. 2010, 34, 127–135. [Google Scholar] [CrossRef] [Green Version]
- Kjølbæk, L.; Lorenzen, J.K.; Larsen, L.H.; Astrup, A. Calcium intake and the associations with faecal fat and energy excretion, and lipid profile in a free-living population. J. Nutr. Sci. 2017, 6, e50. [Google Scholar] [CrossRef] [Green Version]
- Murshed, M. Mechanism of Bone Mineralization. Cold Spring Harb. Perspect. Med. 2018, 8. [Google Scholar] [CrossRef]
- Abrams, S.A.; Griffin, I.J.; Hawthorne, K.M.; Chen, Z.; Gunn, S.K.; Wilde, M.; Darlington, G.; Shypailo, R.J.; Ellis, K.J. Vitamin D receptor Fok1 polymorphisms affect calcium absorption, kinetics, and bone mineralization rates during puberty. J. Bone Miner. Res. 2005, 20, 945–953. [Google Scholar] [CrossRef]

| Study Reference (Study Design) | 1. Rationale for Study | 2. Selection and Definition of Outcome of Interest (Cases/Disease Status or a Quantitative Trait) | 3. Selection and Comparability of Comparison Groups (if Applicable) | 4. Technical Classification of the Exposure | 5. Non-Technical Classification of the Exposure | 6. Other Sources of Bias | 7. Sample Size and Power | 8. A priori Planning of Analyses | 9. Statistical Methods and Control for Confounding | 10. Testing of Assumptions and Inferences for Genetic Analyses | 11. Appropriateness of Inferences Drawn from Results | Total Score |
|---|---|---|---|---|---|---|---|---|---|---|---|---|
| CASR | ||||||||||||
| Annerbo 2015 # [8] (Cross-sectional) | 4 | 4 | 0 | 4 | 2 | 1 | 1 | 4 | 2 | 4 | 7 | 33 |
| Arcidiacono 2009 # [10] (Case-control) | 4 | 4 | 4 | 4 | 2 | 1 | 1 | 4 | 2 | 2 | 7 | 35 |
| Bochud 2011 # [39] (Cross-sectional) | 6 | 6 | 0 | 4 | 2 | 1 | 1 | 4 | 6 | 3 | 7 | 40 |
| Cerani 2019 [9] (Mendalian randomisation study) | 6 | 6 | 4 | 4 | 2 | 4 | 4 | 5 | 6 | 5 | 7 | 53 |
| Chang 2015 [23] (Genome-wide association study) | 6 | 4 | 0 | 6 | 3 | 2 | 6 | 5 | 6 | 3 | 7 | 48 |
| Cole 1999 [40] (Cross-sectional) | 6 | 5 | 0 | 3 | 2 | 2 | 2 | 4 | 5 | 4 | 5 | 38 |
| Cole 2001 [41] (Cross-sectional) | 7 | 5 | 0 | 3 | 2 | 2 | 4 | 3 | 4 | 3 | 5 | 38 |
| Corebetta 2006 [42] (Case-control) | 6 | 6 | 6 | 5 | 2 | 2 | 2 | 4 | 5 | 2 | 5 | 45 |
| Guha 2015 [24] (Case-control) | 6 | 5 | 7 | 4 | 2 | 2 | 6 | 5 | 4 | 2 | 6 | 49 |
| Jorde 2013 [43] (Case-control) | 7 | 6 | 5 | 4 | 2 | 3 | 2 | 4 | 3 | 2 | 6 | 44 |
| Jung 2009 [25] (Population-and family-based association study) | 6 | 6 | 0 | 6 | 2 | 2 | 5 | 3 | 4 | 5 | 6 | 45 |
| Kapur 2010 [26] (Meta-analysis of genome-wide association study) | 7 | 4 | 4 | 2 | 3 | 3 | 7 | 6 | 6 | 5 | 6 | 53 |
| Laaksonen 2009 [27] (Cross-sectional) | 6 | 6 | 0 | 4 | 3 | 3 | 2 | 3 | 6 | 4 | 6 | 43 |
| Larsson 2017 [28] (Mendalian randomisation study) | 6 | 5 | 4 | 4 | 3 | 6 | 6 | 7 | 5 | 5 | 6 | 57 |
| Lorentzon 2001 [44] (Association study) | 6 | 4 | 0 | 2 | 2 | 2 | 4 | 4 | 4 | 2 | 5 | 35 |
| Majid 2015 [45] (Cross-sectional) | 7 | 5 | 0 | 4 | 2 | 3 | 2 | 4 | 3 | 4 | 6 | 40 |
| März 2007 [29] (Case-control) | 6 | 6 | 4 | 3 | 6 | 2 | 4 | 5 | 4 | 2 | 6 | 48 |
| O’Seaghdha 2010 [46] (Genome-wide association study) | 7 | 5 | 0 | 2 | 2 | 2 | 3 | 5 | 5 | 3 | 6 | 40 |
| Scillitani 2004 [11] (Cross-sectional) | 7 | 5 | 0 | 2 | 2 | 2 | 3 | 2 | 6 | 4 | 6 | 39 |
| Shakhssalim 2010 [48] (Case-control) | 6 | 4 | 4 | 2 | 2 | 2 | 2 | 3 | 3 | 4 | 4 | 36 |
| Siomou 2017 [52] (Case-control) | 4 | 4 | 3 | 2 | 2 | 5 | 2 | 2 | 2 | 2 | 4 | 32 |
| Vezzoli 2014 [30] (Cross-sectional) | 7 | 5 | 0 | 3 | 2 | 2 | 4 | 5 | 4 | 4 | 6 | 42 |
| Vezzoli 2011 [31] (Case-control) | 7 | 5 | 5 | 5 | 2 | 2 | 7 | 5 | 3 | 4 | 5 | 50 |
| Vezzoli 2002 [32] (Case-control) | 7 | 6 | 6 | 5 | 2 | 2 | 3 | 5 | 6 | 5 | 6 | 53 |
| Wang 2017 [19] (Case-control) | 7 | 5 | 5 | 2 | 2 | 5 | 7 | 6 | 7 | 4 | 6 | 56 |
| Wang 2007 # [53] (Cross-sectional) | 3 | 3 | 0 | 3 | 2 | 2 | 2 | 3 | 2 | 2 | 4 | 26 |
| VDR | ||||||||||||
| Ames 1999 [13] (Cross-sectional) | 7 | 5 | 0 | 4 | 2 | 2 | 2 | 4 | 5 | 3 | 6 | 40 |
| Ferrari 1999 [49] (Cross-sectional) | 4 | 5 | 0 | 3 | 2 | 4 | 3 | 4 | 5 | 2 | 4 | 36 |
| Jehan 2010 [54] (Association study) | 6 | 4 | 0 | 3 | 2 | 2 | 3 | 2 | 2 | 3 | 4 | 31 |
| Nakano 2000 [12] (Case-control) | 3 | 5 | 6 | 6 | 2 | 4 | 3 | 5 | 4 | 3 | 5 | 46 |
| Relan 2004 [55] (Case-control) | 4 | 4 | 4 | 3 | 2 | 2 | 3 | 3 | 1 | 2 | 5 | 33 |
| Different Gene Polymorphisms | ||||||||||||
| Arcidiacono 2018 [33] (Cross-sectional) | 7 | 5 | 0 | 4 | 2 | 5 | 4 | 6 | 6 | 6 | 7 | 52 |
| Bellia 2016 [50] (Cross-sectional) | 4 | 5 | 0 | 5 | 2 | 1 | 2 | 5 | 3 | 5 | 6 | 38 |
| Fujita 2013 [56] (Cross-sectional) | 4 | 2 | 0 | 2 | 1 | 1 | 2 | 2 | 2 | 3 | 4 | 23 |
| Gianfagna 2013 [34] (Cross-sectional) | 6 | 5 | 0 | 3 | 2 | 4 | 4 | 6 | 6 | 6 | 6 | 48 |
| Howles 2019 [35] (Genome-wide association study) | 7 | 4 | 0 | 6 | 2 | 3 | 4 | 5 | 5 | 6 | 7 | 49 |
| Hwang 2014 [36] (Case-control) | 7 | 4 | 4 | 5 | 4 | 4 | 2 | 6 | 7 | 4 | 7 | 54 |
| Kim 2018 [37] (Cross-sectional) | 7 | 4 | 0 | 7 | 4 | 6 | 7 | 6 | 7 | 6 | 7 | 61 |
| Koek 2010 [38] (Cross-sectional) | 7 | 5 | 0 | 6 | 4 | 3 | 5 | 6 | 6 | 6 | 7 | 55 |
| Masi 2007 [51] (Cross-sectional) | 7 | 6 | 0 | 4 | 2 | 1 | 1 | 6 | 2 | 3 | 7 | 39 |
| Shakhssalim 2014 [47] (Case-control) | 7 | 6 | 6 | 5 | 2 | 1 | 1 | 6 | 2 | 2 | 7 | 45 |
| Study Reference Country Study Design | Description of Study Population | SNPs Associated with Phenotype (Gene, rs#, Nucleotide Change, Amino Acid Change) | Frequency of SNP in Study Population | Description of SNP and Phenotype | Association of SNP with Calcium Change |
|---|---|---|---|---|---|
| Annerbo 2015 # [8] Sweden Cross-sectional | N = 1016 (515 males, 501 females) Age: 70 years Ethnicity: N/A Inclusion: healthy individuals Exclusion: N/A | CASR rs1801725 (NCBI G/T, A986S, Ala > Ser) CASR rs1042636 (NCBI A/G, R990G, Arg > Gly) CASR rs1801726 (NCBI G/A,C, Q1011E) | Carriers of T/G A/A G/C, present in 2% of the cohort, G/G A/A C/C present in 52.3% of the cohort | Small but significant changes in calcium level for carriers of the T allele in rs1801725 | Carriers of the T allele in rs1801725 had significantly higher serum calcium levels 2.38 vs. 2.36 mmol/L (9.54 vs. 9.46 mg/dL), p = 0.016, carriers of T/G A/A G/C had significantly higher serum calcium compared to the most common haplotype G/G A/A C/C 2.37 vs. 2.36 mmol/L (9.50 vs. 9.46 mg/dL), p < 0.001 |
| Arcidiacono 2009 # [10] Italy Case-control | N = 296 cases (155 kidney stone formers, 141 non-stone formers), 453 controls Age: N/A Ethnicity: N/A Inclusion: primary hyperparathyroidism (PHPT) patients as cases, healthy controls Exclusion: N/A | CASR rs1042636 (NCBI A/G, R990G, Arg > Gly) CASR rs7652589 (NCBI A/G) CASR rs4678013 (NCBI T/G) CASR rs1501899 (NCBI A/G,T) | Allele frequency was not significantly different in PHPT patients and controls. 990G variant allele more frequent in stone-forming than non-stone-forming patients (7.4% vs. 1.8%, RR = 4.4, p = 0.001) | SNPs/haplotype modifying CASR gene promoter activity favour stone formation in PHPT patients and reduce CASR expression in parathyroid and kidney tubular cells | Patients carrying GGG/GGG had higher serum ionized calcium than patients with any other haplotypes 1.50 ± 0.178 vs. 1.46 ± 0.122 mmol/L (6.01 ± 0.71 vs. 5.85 ± 0.489 mg/dL), p = 0.04. PHPT patients carrying one or two copies of 990 G variant allele had higher renal calcium excretion than homozygotes for 990R allele, p = 0.035 |
| Bochud 2011 # [39] Switzerland Cross-sectional | N = 5319 Age: N/A (adults) Ethnicity: Caucasian Inclusion: participants from the population-based CoLaus study Exclusion: N/A | CASR rs11716910 (A/G) | N/A | Association of SNP with albumin-corrected serum calcium levels in the absence, but not in the presence, of calcium and/or vitamin D supplements | CASR SNP most strongly associated with serum calcium: 2.22 mmol/L (8.90 mg/dL) for AA, 2.21 mmol/L (8.86 mg/dL) for AG and 2.20 mmol/L (8.82 mg/dL) for GG genotype, p for trend < 0.0001 |
| Cerani 2019 [9] Cohorts from UK, USA, Europe, China Mendelian randomisation study | N = 61,079 Age: 18.9–76.4 years (mean age in cohorts) Ethnicity: mixed (Northern European, North western European, European American, Southern Chinese) Inclusion: N/A Exclusion: N/A | CASR rs1801725 (NCBI G/T, A986S, Ala > Ser) DGKD rs1550532 (NCBI C/A,G) GATA3 rs10491003 (NCBI C/G,T) CARS rs7481584 (NCBI G/A) DGKH, VWA8 rs7336933 (NCBI G/A) CYP24A1 rs1570669 (NCBI A/C,G,T) VKORC1L1 rs17711722 (NCBI C/T) | Ca increasing allele and allele frequency: CASR (T) 0.15; DGKD (C) 0.32; GATA3 (T) 0.09; CARS (G) 0.72; DGKH, VWA8 (G) 0.85; CYP24A1 (G) 0.34; VKORC1L1 (T) 0.47 | Genetic predisposition to increased serum calcium levels in individuals with normal calcium levels is not associated with an increase in estimated bone mineral density and does not provide clinically relevant protection against fracture | Serum calcium effect for calcium-increasing allele: CASR 0.0178 mmol/L (0.0713 mg/dL), p = 9 × 10−86; DGKD 0.0045 mmol/L (0.0180 mg/dL), p = 8 × 10⁻¹¹; nearby GATA3 0.0068 mmol/L (0.0273 mg/dL), p = 5 × 10⁻⁹; CARS 0.0045 mmol/L (0.0180 mg/dL), p = 1 × 10⁻¹⁰; DGKH, VWA8 0.0055 mmol/L (0.0220 mg/dL), p = 9 × 10⁻¹⁰; near CYP24A1 0.0045 mmol/L (0.0180 mg/dL), p = 9 × 10⁻¹²; near VKORC1L1 0.00375 mmol/L (0.0150 mg/dL), p = 8 × 10⁻⁹ |
| Chang 2015 [23] USA Genome-wide association study (GWAS) | N = 9034 (4765 males, 4269 females) Age: 9.9 years Ethnicity: European-American and African-American Inclusion: N/A Exclusion: N/A | CASR rs1801725 (T/G, A986S, Ala > Ser) GCKR rs780094 (A/G) GATA3 rs10491003 (A/G) | N/A | CASR mediated calcium regulation in both African-American and European-American children and association of calcium level with GCKR and GATA3 in European-American children | African-American children: association of CASR SNP with serum calcium level for minor allele T; European-American children: association of SNP with serum calcium level for CASR SNP for minor allele T, GCKR SNP with minor allele A, and GATA3 with minor allele A |
| Cole 1999 [40] Canada Cross-sectional | N = 163 females Age: 18–35 years Ethnicity: Caucasian Inclusion: healthy women Exclusion: women who were not white and whose relatives were already enrolled in the parent study | CASR rs1801725 (NCBI G/T, A986S, Ala > Ser) | 115 (70.6%) were homozygous for GG (AA) genotype, 43 (26.3%) women were heterozygous for GT (AS) genotype and 5 (3.1%) were homozygous for TT (SS) genotype | The CASR A986S variant has a significant effect on extracellular calcium | Significant correlation between CASR genotype and serum calcium corrected for albumin: AS heterozygotes 2.45 ± 0.02 mmol/L (9.82 ± 0.08 mg/dL) vs. AA homozygotes 2.38 ± 0.01 mmol/L (9.54 ± 0.04 mg/dL), p = 0.013, no difference between SS 2.45 ± 0.04 mmol/L (9.81 ± 0.16 mg/dL) and AS genotype; no differences between genotypes for total serum calcium |
| Cole 2001 [41] Canada Cross-sectional | N = 387 females Age: 18–35 years Ethnicity: Caucasian Inclusion: healthy women Exclusion: subjects reporting other than Caucasian ethnicity and relatives already in the parent study | CASR rs1801725 (NCBI G/T, A986S, Ala > Ser) | Frequencies of TT (SS), GT (AS), and GG (AA) genotypes were 6 (1.6%), 107 (27.6), and 274 (70.8%), respectively | Significant association between a common CASR A986S polymorphism and concentrations of a serum electrolyte | Mean serum calcium was significantly greater in AS heterozygotes 2.36 ± 0.01 mmol/L (9.45 ± 0.05 mg/dL), p = 0.002, or SS homozygotes 2.46 ± 0.07 mmol/L (9.88 ± 0.29 mg/dL), p = 0.015, in comparison to those with the AA homozygous genotype 2.30 ± 0.01 mmol/L (9.23 ± 0.04 mg/dL) |
| Corebetta 2006 [42] Italy Case-control | N = 94 cases (14 males, 80 females), 137 controls Age: 66 ± 12 years Ethnicity: Caucasian Inclusion: cases: PHPT patients, controls: age- and sex-matched, Caucasians without personal and family history of kidney stones, normal serum creatinine, calcium and phosphate, and 24 h urinary calcium levels, and not taking any drugs Exclusion: N/A | CASR rs1042636 (NCBI A/G R990G, Arg > Gly) | CASR R909G cases (n = 94): RR n = 83, RG n = 9, GG n = 2; controls (n = 137): RR n = 128, RG n = 8, GG n = 1 | 24 h urinary calcium was significantly higher in R/G + G/G vs. R/R patients with PHPT | Cases: lower 24 h urinary calcium (mmol/24 h) for RR genotype (6.77 ± 4.31) vs. RG + GG (9.05 ± 2.05), p = 0.012, no differences between genotypes for ionized calcium or serum calcium levels Controls: no data |
| Guha 2015 [24] India Case-control | N = 400 (255 males, 145 females) Age: 39.93 ± 11.73 years (range 18–60 years) Ethnicity: Indian Inclusion: cases: patients with at least one calcium kidney stone, controls: age- and sex- matched healthy subjects without personal and familial history of kidney stone, normal serum creatinine and calcium concentrations and no evidence of diseases at physical examination Exclusion: patients taking any drug affecting electrolyte or citrate handling (steroids, vitamin D, etc.), with endocrine or other disorders in addition to stone disease, abnormal serum creatinine, abnormal serum electrolyte concentration, recurrent urinary infections, evidence of cystic disorders of the kidney and nephropathy etc. | CASR rs1801725 (G/T, A986S, Ala > Ser) CASR rs1042636 (A/G, R990G, Arg > Gly) | CASR rs1801725: GG n = 278 (n = 116 cases, n = 162 controls), GT n = 119 (n = 82 cases, n = 37 controls), TT n = 3 (n = 2 cases, n = 1 controls); CASR rs1042636: AA n = 216 (n = 86 cases, n = 130 controls), AG n = 168 (n = 99 cases, n = 69 controls), GG n = 16 (n = 15 cases, n = 1 controls) | Common variants in CASR were associated with kidney stone disease in the eastern part of India | Higher serum calcium levels mmol/L (mg/dL) for CASR rs1801725 (Ala986Ser) GT + TT genotype 2.43 ± 0.05 cases, 2.41 ± 0.06 controls (9.72 ± 0.18, 9.64 ± 0.25 respectively) compared with GG genotype 2.30 ± 0.05 cases, 2.35 ± 0.05 controls (9.20 ± 0.20, 9.45 ± 0.21 respectively), p < 0.001, higher urinary calcium excretion (mmol/24 h) for rs1042636 (Arg990Gly) AG+GG genotype compared with AA genotype only for cases (8.10 ± 0.51 vs. 7.58 ± 0.57, p < 0.001) |
| Jorde 2013 [43] Norway Case-control | N = 9404 (4448 males, 4956 females) Age: 59.6 ± 13.7 years (in 1994) Ethnicity: N/A Inclusion: selected participants from the Tromsø Study 1994 and randomly selected controls Exclusion: N/A | CASR rs17251221 (A/G) | Genotype frequency CASR rs17251221: AA n = 7467 (79.4%), GA n = 1829 (19.5%), GG n = 108 (1.1%) | The minor GG homozygote genotype (high serum calcium) had a significant twofold increased risk (HR 2.32, 95% CI 1.24, 4.36) for prostate cancer compared to the major AA genotype | Significant association of CASR rs17251221 with serum calcium levels mmol/L (mg/dL) between AA genotype 2.38 ± 0.10 (9.54 ± 0.40) vs. GG genotype 2.42 ± 0.11(9.70 ± 0.44), p < 0.001, but not GA genotype 2.40 ± 0.10 (9.62 ± 0.40) |
| Jung 2009 [25] USA Population-and family-based association study | N = 106 (49 males, 57 females) Age: 18–36 years Ethnicity: African-American Inclusion: normotensive and in good health, none were taking medication with the exception that some of the female subjects used oral contraceptives Exclusion: N/A | CASR rs6438712 (A/G) CASR rs4678172 (G/T) CASR rs9874845 (A/T) CASR rs4678059 (A/T) CASR rs1965357 (C/T) CASR rs937626 (A/G) | Minor allele frequency: rs6438712 A 0.28; rs4678172 T 0.29; rs9874845 A 0.31; rs4678059 A 0.12; rs1965357 G 0.15; rs937626 G 0.34 | Functional heterogeneity in CASR may affect the level of blood pressure in African-Americans. SNPs associated with urinary calcium excretion in both population- and family-based association studies | From 15 CASR SNPs examined, 6 were associated with lower urinary calcium (uCa) excretion. Calcium excretion rate, log uCa (mg/h) for participants carrying the minor allele: rs6438712 A 0.03; rs4678172 T 0.02; rs9874845 A 0.02; rs4678059 A < 0.0001; rs1965357 C 0.0007; rs937626 G 0.02 (p ≤ 0.001) |
| Kapur 2010 [26] Switzerland Meta-analysis of genome-wide association study | N = 12,865 Age: 50.7–70.4 years Ethnicity: European and Indian Asian descent Inclusion: participants from the CoLaus study (population-based sample from Lausanne, Switzerland), the London Life Sciences Prospective Population Study (LOLIPOP, population-based cohort study), the InCHIANTI study (population-based epidemiological study), the Baltimore longitudinal study on Aging (BLSA, population-based study), the deCODE study Exclusion: N/A | CASR rs1801725 (NCBI G/T, A986S, Ala > Ser) | T allele frequencies 16.76% in European and 19.98% Indian Asian cohorts | Common CASR variants modulate serum calcium levels in the adult general population. The rs1801725 T allele (A986S) is associated with higher serum calcium, but no significant association between rs1801725 and the calcium-related outcomes (coronary heart disease, myocardial infarction, hypertension, stroke, osteoarthritis, osteoporosis and kidney stones) | CASR rs1801725 explains 1.26% of the variance in serum calcium. At an average serum calcium level of 2.25 mmol/L (9.02 mg/dL), each rs1801725 T allele yields an increase of 0.01874 mmol/L (0.0751 mg/dL), or 21% of one standard deviation of serum calcium levels in a normal population. |
| Laaksonen 2009 [27] Finland Cross-sectional | N = 350 (135 males, 215 females) Age: 30–42 years Ethnicity: Caucasian Inclusion: healthy adults, subgroup from the population-based FINRISK survey Exclusion: N/A | CASR rs1801725 (NCBI G/T, A986S, Ala > Ser) | Male (n = 104): AA n = 82 (79%), AS n = 19 (18%), SS n = 3 (3%); female (n = 182): AA n = 143 (78.5%), AS n = 36 (20%), SS n = 3 (1.5%) | The CASR 986S allele was associated with higher serum ionized calcium. Vitamin D receptor (VDR), CASR and parathyroid hormone (PTH) polymorphisms contribute to the genetic regulation of calcium homeostasis and peripheral bone density | Higher serum ionized calcium mmol/L (mg/dL) for individuals with AS or SS genotype (mean: 95% CI, both sexes): AA 1.200: 1.196–1.204 (4.809: 4.793–4.825, AS 1.214: 1.206–1.222 (4.866: 4.833–4.898), SS 1.239: 1.214–1.264 (4.966: 4.866–5.066) (adjusted for BMI, S-25OHD and calcium intake, ANOVA, p < 0.001) |
| Larsson 2017 [28] Sweden Mendelian randomization study | Up to 60,801 coronary artery disease (CAD) cases (approximately 70% with myocardial infarction) and 123,504 non-cases from 48 cohort and case-control studies Age: 45–75 years Ethnicity: European (77%), South Asian (13%), and East Asian (6%) ancestry Inclusion: case status was determined using a broad definition of CAD, including myocardial infarction (approximately 70% of the total number of cases), acute coronary syndrome, chronic stable angina, or coronary artery stenosis greater than 50% Exclusion: N/A | CASR rs1801725 (NCBI G/T, A986S, Ala > Ser) CYP24A1 rs1570669 (NCBI A/C,G,T) DGKD rs1550532 (NCBI C/A,G) CARS rs7481584 (NCBI G/A) DGKH/KIAA0564 rs7336933/NCBI G/A) GATA3 rs10491003 (NCBI C/G,T) | Frequency of the calcium-raising allele: CASR (rs1801725): T 0.14 CYP24A1 (rs1570669): G 0.36 DGKD (rs1550532): C 0.31 CARS (rs7481584): G 0.69 DGKH/KIAA0564 (rs7336933): G 0.86 GATA3 (rs10491003): T 0.09 | A genetic predisposition to higher serum calcium levels was associated with increased risk of CAD and myocardial infarction. Meta-analysis (combining the 6 SNPs): 0.5 mg/mL increase in serum calcium levels resulted in OR 1.25 (95% CI 1.08–1.45; p = 0.003) for CAD and OR 1.24 (95% CI 1.05–1.46; p = 0.009) for myocardial infarction | Serum calcium level increased by mmol/L (mg/dL) per additional: T allele for CASR (rs1801725): 0.018 (0.071) G allele for CYP24A1 (rs1570669): 0.005 (0.018) C allele for DGKD (rs1550532): 0.005 (0.018) G allele for CARS (rs7481584): 0.005 (0.018) G allele for DGKH/KIAA0564 (rs7336933): 0.006 (0.022) T allele for GATA3 (rs10491003): 0.006 (0.022), p < 0.001 |
| Lorentzon 2001 [44] Sweden Association study | N = 97 females Age: 16.9 ± 1.2 years Ethnicity: Caucasian Inclusion: at least 2 years post menarche, no disease or medication known to affect bone metabolism Exclusion: N/A | CASR rs1801725 (NCBI G/T, A986S, Ala > Ser) | Subjects without S n = 69, with S n = 28, genotype frequencies: AA 71%, AS 26%, SS 3% | Subjects with the S allele had higher levels of plasma calcium (corrected for albumin) and lower bone mineral density at the lumbar spine compared with subjects lacking the S allele | Plasma calcium corrected for albumin mmol/L (mg/dL): 2.14 ± 0.06 (8.58 ± 0.24) for subjects without S (n = 68) vs. 2.17 ± 0.06 (8.70 ± 0.24) for subjects with S (n = 26), p < 0.05, no difference in plasma calcium between genotypes |
| Majid 2015 [45] Pakistan Cross-sectional | N = 140 females Age: 18–38 years Ethnicity: N/A Inclusion: adult premenopausal females with known vitamin D deficiency (VDD), intact parathyroid hormone (iPTH), and calcium levels Exclusion: medical disorder of bone minerals, such as PHPT or hypoparathyroidism, any medications known to affect calcium metabolism, such as calcium tablets or bisphosphonate, and vitamin D supplements, individuals on hormonal therapy, and pregnant females | CASR rs1801725 (NCBI G/T, A986S, Ala > Ser) CASR rs1042636 (A/G, R990G, Arg > Gly) | Frequency of A986S alleles: GG 68%, GT 25%, TT 7% R990G alleles: AA 80%, AG 8.9%, GG 11.1% | Patients with VDD with the GG genotype of R990G SNP are prone to have higher iPTH levels and lower calcium compared with AG and AA genotype subjects | Serum calcium level mmol/L (mg/dL) significantly associated with CASR rs1042636 (R990G) genotype: AA 2.3 ± 0.1 (9.1 ± 0.3) (n = 112), AG 2.3 ± 0.1 (9.1 ± 0.3) (n = 12), GG 2.1 ± 0.1 (8.5 ± 0.4) (n = 16), p = 0.002, no association for CASR A986S genotypes |
| März 2007 [29] Germany Case-control | N = 3259 (2280 males, 979 females) Age: cases (CAD): males 63 ± 10, females 66 ± 10, controls (no CAD): males 55 ±1 2, female 62 ± 10 years Ethnicity: Caucasian Inclusion: white patients hospitalized for coronary angiography from the Ludwigshafen Risk and Cardiovascular Health (LURIC) study Exclusion: acute illness other than acute coronary syndromes, chronic noncardiac diseases, and a history of malignancy within the five past years | CASR rs1801725 (NCBI G/T, A986S, Ala > Ser) | Controls (no CAD): AA n = 517 (74%), AS n = 168 (24%), SS n = 13 (2%) Cases (CAD): AA n = 1799 (70%), AS n = 6699 (27%), SS n = 63 (3%); CAD + myocardial infarction (MI): AA n = 9407 (69%), AS n = 378 (28%), SS n = 40 (3%) | CASR polymorphism affects calcium homeostasis and is associated with CAD, MI, all cause, and cardiovascular mortality | Carrier of S allele (AS or SS) had significantly higher calcium levels, p < 0.001, and albumin-adjusted calcium levels, p < 0.001, compared with AA homozygotes, independent of presence or absence of CAD |
| O’Seaghdha 2010 [46] N/A Genome-wide association studies | N = 20,611 (46.8% males, 69.4% females) Age: 43.6 ± 9.8 to 77 ± 5.4 years Ethnicity: individuals of European ancestry Inclusion: participants from 6 studies: the family-based Framingham Heart Study (FHS), the prospective population-based Atherosclerosis Risk in Communities (ARIC) study, the Cardiovascular Health Study (CHS), population-based Rotterdam Study (RS), the community-based prospective cohort study Health ABC (HABC), the Age Gene/Environment Susceptibility (AGES)-Reykjavik Study Exclusion: N/A | CASR rs17251221 (A/G) | Minor allele G frequency: 14% | Variation in CASR influences serum calcium concentration. G allele of rs17251221 also associated with higher serum magnesium levels, lower serum phosphate levels and lower bone mineral density at the lumbar spine | SNP is associated with 0.015 mmol/L (0.06 mg/dL) higher serum calcium levels per copy of the minor G allele and accounted for 0.54% of the variance in serum calcium concentrations |
| Scillitani 2004 [11] Italy Cross-sectional | N = 377 (184 males, 137 premenopausal, 56 postmenopausal females) Age: men median age (range): 43 years (18–65), premenopausal women: 37 years (18–52), postmenopausal women: 53 years (48–65) Ethnicity: Caucasian Inclusion: Caucasian healthy adults retrospectively recruited from a blood donor clinic Exclusion: taking medication or known to be affected by diseases affecting calcium metabolism | CASR rs1801725 (NCBI G/T, A986S, Ala > Ser) CASR rs1042636 (NCBI A/G, R990G, Arg > Gly) CASR NCBI rs1801726 (G/A,C, Q1011E, Gln > Glu) | Genotype frequency: A986S: AA n = 223, AS n= 126, SS n = 27 R990G: RR n = 345, RG n = 31 Q1011E: QQ n = 335, QE n = 21 | Association of increased ionized calcium with allele variants of CASR | A986S: common AA genotype had significantly lower ionized calcium mmol/L (mg/dL) than subjects with one or two S alleles 1.221 ± 0.003 vs. 1.239 ± 0.003 (4.894 ± 0.012 vs. 4.966 ± 0.012), p = 0.0001 R990G: common RR (AA) genotype had higher ionized calcium mmol/L (mg/dL) than those with 990G allele 1.230 ± 0.002 vs. 1.213 ± 0.007 (4.930 ± 0.008 vs. 4.862 ± 0.028), p = 0.032 Q1011E: common QQ (CC) genotype had lower ionized calcium mmol/L (mg/dL) than those with QE (CG) genotype 1.227 ± 0.002 vs. 1.255 ± 0.008 (4.918 ± 0.008 vs. 5.030 ± 0.032), p = 0.002 |
| Shakhssalim 2010 [48] Iran Case-control | N = 206 males (99 cases, 107 controls) Age: 30–55 years Ethnicity: N/A Inclusion: cases: idiopathic recurrent calcium kidney stone-forming men without any systematic disorders, controls: healthy volunteer men Exclusion: cases: history of known metabolic, gastrointestinal, hepatic, renal or endocrinological diseases | CASR rs1801725 (NCBI G/T, A986S, Ala > Ser) CASR rs1042636 (NCBI A/G, R990G, Arg > Gly) CASR rs1801726 (NCBI G/A,C, Q1011E, Gln > Glu) | A989S cases: AA n = 71 (71.7%), AS n = 26 (26.3%), SS n = 2 (2%), controls: AA n = 93 (86.9%), AS n = 14 (13.1%), SS n = 0 (0%) R990G cases: RR n = 87 (87.9%), RG n = 10 (10.1%), GG n = 2 (2%), controls: RR n = 105 (98.1%), RG n = 2 (1.9%), GG n = 0 (0%) E1011Q cases: EE n = 0 (0%), EQ n = 5 (5.1%), QQ n = 94 (94.9%), controls: EE n = 0 (0%), EQ n = 0 (0%), QQ n = 107 (100%) | 986S, 990G and 1011Q alleles were associated with a recurrent calcium kidney stone-forming state. 986S and 1011Q alleles, but not 986S, were associated with hypercalcemia | Cases and controls combined. R990G: RR genotype showed higher serum ionized calcium mmol/L (mg/dL) compared with RG or GG 1.15 ± 0.04 vs. 1.13 ± 0.03 (4.62 ± 0.18 vs. 4.52 ± 0.10), p = 0.01; Q1011E: QQ showed lower total serum calcium mmol/L (mg/dL) compared with EQ 2.41 ± 0.15 vs. 2.60 ± 0.15 (9.67 ± 0.60 vs. 10.44 ± 0.59), p = 0.01; R990G and Q1011E: no difference in mean calcium 24 h urine (mg/24 h) between genotypes; A989S: no difference between wild type and mutant for serum calcium or 24 h urinary calcium excretion |
| Siomou 2017 [52] Greece Case-control | N = 112 (50 cases, 62 controls) Age: children Ethnicity: N/A Inclusion: cases: children with idiopathic hypercalciuria, controls: age-and gender matched Exclusion: N/A | CASR rs1801725 (G/T, A986S, Ala > Ser) CASR rs1042636 (A/G, R990G, Arg > Gly) CASR rs1801726 (C/G, Q1011E, Gln > Glu) | A986S: minor T allele higher in cases than controls (30% vs. 10%, p = 0.0001), GT/ΤΤ higher in cases than controls (54% vs. 19%, p = 0.00015); R990G: minor G allele higher in cases than controls (6% vs. 2%, p = 0.058), GA genotype higher in cases than controls (12% vs. 3%, p = 0.054); Q1011E: SNPs frequency similar in both cases and controls | Polymorphisms A986S and R990G of the CASR gene were associated with idiopathic hypercalciuria but not with the severity of hypercalciuria | Positive association in the T allele with renal calcium excretion, independent of age and serum levels of calcium, intact parathormone and 25-hydroxy-vitamin D (beta: 0.12, 95% CI 0.05–0.33, p < 0.0001), no results reported for rs1042636 and rs1801726 |
| Vezzoli 2014 [30] Italy Observational (cross-sectional) | N = 296 (48 males, 248 females; 155 PHPT patients with stones, 141 without stones) Age: PHPT patients with stone 56 ± 1.1 years, without stone 63 ± 1.1 years Ethnicity: N/A Inclusion: patients with sporadic PHPT Exclusion: patients with biochemical findings or a family history suggesting FHH, or with parathyroid carcinoma, or taking drugs or having diseases influencing bone metabolism other than PHPT | CASR rs1501899 (G/A) CASR rs1042636 (NCBI A/G, R990G, Arg > Gly) | Minor allele frequency for rs1501899 (AA or GA): PHPT patients with stones n = 95 (61.3%), without stones n = 67 (47.5%); Arg990Gly (Gly): PHPT patients with stones n = 22 (14.2%), without stones n = 5 (3.5%) | Serum ionized calcium and calcium excretion were higher in patients carrying the minor allele in both SNPs compared with wild-type. Rs1501899 and Arg990Gly SNPs may predispose PHPT patients to nephrolithiasis and to a more severe phenotype of PHPT | Patients carrying the minor alleles in both SNPs rs1501899 (AA or GA) and rs1042636 (990Gly/990Arg or 990Gly/990Gly had higher serum ionized calcium 1.59 ± 0.072 mmol/L (6.37 ± 0.289 mg/dL) compared with patients carrying wild-type alleles at both SNPs 1.47 ± 0.012 mmol/L (5.89 ± 0.048 mg/dL), p = 0.03, and higher urine calcium (µmol/mmol creatinine) 231 ± 37.5 vs. 151 ± 9.6, p = 0.05 |
| Vezzoli 2011 [31] Ital Case-control, genotype–phenotype association study | N = 332 PHPT patients (62 males, 270 females), 453 healthy controls (180 males, 273 females) Age: 30–55 years Ethnicity: N/A Inclusion: patients with sporadic PHPT, controls: healthy volunteers who had a normal clinical examination Exclusion: patients with hormonal and biochemical findings or a family history suggesting FHH, patients with parathyroid carcinoma, low serum creatinine of 1.2 mg/dL or less | CASR rs7652589 (G/A) CASR rs1501899 (G/A) | Allele frequency of rs7652589 A controls: 33.4%, PHPT patients: 32.2%, rs7652589 G controls: 66.6%, PHPT patients: 67.8% rs1501899 A controls: 31.5%, PHPT patients: 32.1%, rs1501899 G controls: 68.5%, PHPT patients: 67.9% haplotype including both SNPs AA controls: 30.4%, PHPT patients: 31.5%, AG and GA controls: 4.3%, PHPT patients: 2%, GG controls: 65.3%, PHPT patients: 66.6% | PHPT patients with AA/AA or AA/GG diplotype had higher serum concentrations of ionized calcium than patients with GG/GG diplotype. SNPs in the regulatory region of CASR gene may increase the risk for kidney stone formation in PHPT patients | Higher serum ionized calcium mmol/L (mg/dL) for PHPT patients with diplotype AA/AA or AA/GG vs. GG/GG 1.50 ± 0.015 vs. 1.47 ± 0.011 (6.01 ± 0.060 vs. 5.89 ± 0.044), p = 0.04, and higher urine calcium (µmmol/mmol creatinine) for diplotype AA/AA or AA/GG vs. GG/GG (183 ± 12.2 vs. 150 ± 11.4, p = 0.049) |
| Vezzoli 2002 [32] Italy Case-control | N = 97 normocalciuric stone formers (65 males, 32 females), 134 hypercalciuric stone formers (78 males, 56 females), 101 normocalciuric healthy controls (58 males, 43 females) Age: normocalciuric stone formers 45 ± 1.5 years, hypercalciuric stone formers 47 ± 1.1 years, healthy controls 46 ± 1.2 years Ethnicity: White subjects Inclusion: stone formers: at least one calcium kidney stone, normal plasma creatinine, sodium, potassium, and calcium concentrations, stones in urinary tract smaller than 5 mm in diameter; hypercalciuric: 24-h calcium excretion greater than 7.5 mmol in male patients or 6.25 mmol in female patients or greater than 0.1 mmol/kg of body weight independently of gender; controls: selected from the InCHIANTI study, absence of hypercalciuria, age between 20 and 60 years, no clinical diagnosis of hypertension, diabetes, dyslipidemia, stroke, coronary heart disease, kidney stones, and no treatment with drugs affecting calcium metabolism, like calcium salts or vitamin D Exclusion: Stone formers: obstructive nephropathy or urinary tract dilatation, any treatment for kidney stones (thiazide, citrate, or others) for at least 3 months before the study, other diseases than kidney stone, any long-term medications | CASR rs1801725 (NCBI G/T, A986S, Ala > Ser) CASR rs1042636 (NCBI A/G, R990G, Arg > Gly) CASR rs1801726 (NCBI G/C, Q1011E, Gln > Glu) | Stone formers and healthy controls Group 1 n = 133 (57.6%): Ala986, Arg990, and Gln1011 homozygotes Group 2 n = 74 (32.0%): 986Ser homozygotes and Ala986Ser heterozygotes Group 3 n = 15 (6.5%): 990Gly homozygotes and Arg990Gly heterozygotes Group 4 n = 9 (3.9%): Gln1011Glu heterozygotes | Calcium excretion was higher in subjects bearing haplotype 3 and haplotype 3 explained 4.1% of the total variance of renal calcium excretion (multiple regression) | Higher urinary calcium excretion (mmol/24 h) in group 3 (9.18 ± 0.95) in stone formers and healthy controls compared with group 1 (6.05 ± 0.22), group 2 (6.44 ± 0.35), and group 4 (5.05 ± 0.86) (p = 0.003); no differences in plasma calcium between groups; higher urinary calcium excretion (mmol/24 h) in group 3 (9.68 ± 0.87) vs. group 1 (6.91 ± 0.26) in stone formers (p = 0.005), but no other groups, no differences in plasma calcium between groups |
| Wang 2017 [19] USA Retrospective case-control study, genome-wide association study | N = 583 females (199 cases, 384 age-matched controls) Age: 54.9 ± 4.4 years Ethnicity: African American and Caucasian Inclusion: breast cancer cases: defined from databases using ICD-9 code 174 (neoplasms of the female breast), tumour registries, calcium assay data, gender (= female), race (= Caucasian or African American) and genome-wide association studies (GWAS) genotyping data; controls: age-matched records with calcium and GWAS data, no evidence of any form of malignancy Exclusion: N/A | CASR rs1801725, (G/T, A986S, Ala > Ser) | G/G genotype (A986A) n = 458 (79%); G/T genotype (A986S) (20%); T/T genotype (S986S) n = 10 (2%); similar distribution between controls and breast cancer cases | Mean circulating calcium levels significantly higher in all subjects expressing the G/T and T/T genotypes of CASR compared to the wild type receptor (G/G) | Higher circulating calcium levels mmol/L (mg/dL) in control and breast cancer subjects carrying G/T (AS) genotype (n = 115) 2.31 ± 0.12 (9.25 ± 0.48), p = 0.006, and T/T (SS) genotype (n = 10) 2.37 ± 0.13 (9.48 ± 0.50), p = 0.024, compared with G/G (AA) genotype (n = 458) 2.27 ± 0.13 (9.13 ± 0.51) |
| Wang 2007 # [53] China Cross-sectional | N = 202 females Age: 27 ± 5 years Ethnicity: Han Chinese Inclusion: healthy young women of Han nationality in Beijing area Exclusion: N/A | CASR rs1042636 (NCBI A/G, R990G, Arg > Gly) | Frequencies of genotypes for rs1042636 R990G: RR 21.3%, GR 51.0% and GG 27.7% (G allele more common) | R990G polymorphism was associated with serum calcium and subjects with R allele had higher levels of serum calcium | Significant differences in serum calcium mmol/L (mg/dL) for rs1042636 R990G: GG 2.44 ± 0.10 (9.78 ± 0.40), GR 2.46 ± 0.08 (9.86 ± 0.32) and RR 2.48 ± 0.08 (9.94 ± 0.32), p = 0.042; calcium adjusted by albumin mmol/L (mg/dL): GG 2.30 ± 0.10 (9.22 ± 0.40), GR 2.32 ± 0.09 (9.30 ± 0.36) and RR 2.32 ± 0.10 (9.30 ± 0.40), p = 0.02 |
| Study Reference Country Study Design | Description of Study Population | SNPs Associated with Phenotype (Gene, rs#, Nucleotide Change, Amino Acid Change) | Frequency of SNP in Study Population | Description of SNP and Phenotype | Association of SNP with Calcium Change |
|---|---|---|---|---|---|
| Ames 1999 [13] USA Cross-sectional | N = 72 (8 males, 64 females) Age: 7.5–12 years Ethnicity: 38 Caucasian, 18 African-American, 16 Mexican-American Inclusion: prepubertal and pubertal healthy children (Tanner stage 1–3), 5th and 95th percentiles for weight for age and height for age, diets containing ~1200 mg of calcium per day Exclusion: N/A Note: diet adapted to ~1200 mg of calcium per day 2 weeks prior to study and throughout the study period | VDR Fok1 rs2228570 (C/T) | Overall: 41.6% FF (wild type), 44.5% Ff, and 13.9% ff (mutant); Caucasians and Mexican-Americans: 33.3% FF, 48.2% Ff, 18.5% ff; African-American: 66.6% FF, 33.4% Ff | The FF wild type genotype was associated with greater calcium absorption (average 150 mg more calcium per day compared with the mutant ff genotype) and higher bone mineral density (BMD) | FF genotype (wild type) had 41.5% greater calcium absorption than ff (mutant) homozygotes, p = 0.04, and 17% greater calcium absorption than the Ff heterozygotes, p = 0.19 |
| Ferrari 1999 [49] Switzerland Cross-sectional | N = 104 males Age: 24.3 ± 3.1 years (range 20.7–38.7 years) Ethnicity: Caucasian Inclusion: healthy subjects Exclusion: known acute or chronic diseases or medications that could affect intestinal absorption, kidney function, or bone turnover Note: 25 subjects (bb n = 15, BB n = 10) received first a low (calcium and phosphorus restriction through dietary counselling and intake of magnesium- and aluminium-containing phosphorus binder for 5 days), then a washout period followed by a high (consumption of products rich in calcium and phosphate plus additional 1000 mg phosphorus/day for 5 days) calcium-phosphorus diet for a total duration of 15 days. | VDR Bsm1 NCBI rs1544410 (A/G) | Bsm1: bb n = 46 (44%), Bb n = 37 (36%), BB n = 21 (20%) | Dietary modification of calcium-phosphate intake and VDR Bsm1 polymorphism were associated with alternations in fasting urinary calcium and renal calcium excretion | Influence of dietary modification for calcium (μmol/L glomerular filtration rate (GFR)) in fasting urine: baseline bb 0.025 ± 0.003 versus BB 0.020 ± 0.003, restriction bb 0.017 ± 0.001 vs. BB 0.017 ± 0.002, supplementation bb 0.022 ± 0.003 vs. BB 0.018 ± 0.002 (p = 0.04); and daily renal calcium excretion (mg/day): baseline bb 208 ± 14 vs. BB 198 ± 20, restriction bb 152 ± 8 vs. BB 128 ± 19, supplementation bb 198 ± 17 vs. BB 140 ± 15, p = 0.05, no influence on serum ionized calcium. No differences between VDR Bsm1 genotypes and serum ionized calcium, urinary calcium or daily calcium excretion without dietary modifications. |
| Jehan 2010 [54] Moldavia Association study | N = 204 (118 males, 86 females) Age: 7–16 years (boys 11.2 ± 1.7 years, girls 11.5 ± 1.8 years) Ethnicity: Caucasian Inclusion: healthy children and adolescents, calcium intake 493 mg/day including 69 mg/day as milk and dairy products Exclusion: children with known chronic diseases and/or body measures below or above 2 SDs | VDR rs4516035 (−1012 G/A) | GG: n = 43 (21.1%), GA: n = 90 (44.1%), AA: n = 71 (34.8%) | Height during growth is in part controlled by VDR expression and may be hampered in children and adolescents bearing a G/G genotype | Significant association of VDR rs4516035 with serum calcium mmol/L (mg/dL) levels (adjusted for serum protein levels): GG genotype 2.13 ± 0.05 (8.54 ± 0.20), GA genotype 2.24 ± 0.04 (8.98 ± 0.16), AA genotype 2.27 ± 0.04 (9.10 ± 0.16) (GG vs. AA, p = 0.0336, GG vs. GA, p = 0.0544) |
| Nakano 2000 [12] Japan Case-control | N = 247 (cases: 77 males, 70 females, controls: 54 males, 46 females) Age: cases 55 ± 10 years, controls 51 ± 17 years Ethnicity: Japanese Inclusion: cases: essential hypertension (systolic blood pressure > 160 mmHg and/or diastolic blood pressure > 95 mmHg); controls: normotensive (systolic blood pressure < 140 mmHg and/or diastolic blood pressure < 90 mmHg) no history of hypertension, not taken any antihypertensive medications or other medications that could affect blood pressure Exclusion: secondary causes of hypertension, diabetes mellitus, heart, liver, and kidney diseases | VDR Bsm1 NCBI rs1544410 (A/G) | Genotype frequency normotensives (n = 100): bb (mutant) 56%, Bb 36%, BB (wild type) 8%; hypertensives (n = 138): bb 60.1%, Bb 32.6%, BB 7.4% | BB (wild type) genotype of the VDR gene is associated with lower serum calcium levels, but not useful as a predictive marker for hypertension. | Lower serum total calcium mmol/L (mg/dL) for BB (wild type) genotype compared with mutant bb, p < 0.05. Normotensive: bb 4.5 ± 0.3 vs. BB 4.4 ± 0.5 (18.0 ± 1.2 vs. 17.6 ± 2.0), Bb 4.5 ± 0.4 (18.0 ± 1.6); hypertensives: bb 4.6 ± 0.3 vs. BB 4.4 ± 0.5 (18.4 ± 1.2 vs. 17.6 ± 2.0), Bb 4.6 ± 0.4 (18.4 ± 1.6). Lower serum ionized calcium mmol/L (mg/dL) for BB genotype compared with bb, p < 0.05. Normotensive: bb 1.17 ± 0.04 vs. BB 1.15 ± 0.04 (4.69 ± 0.16 vs. 4.61 ± 0.16), Bb 1.16 ± 0.04 (4.65 ± 0.16); hypertensives: bb 1.16 ± 0.04 vs. BB 1.14 ± 0.05 (4.65 ± 0.16 vs. 4.57 ± 0.20) (Bb 1.16 ± 0.04 (4.65 ± 0.16) |
| Relan 2004 [55] India Case-control | N = 250 (150 cases: 105 males, 45 females, 100 controls: 76 males, 24 females) Age: cases 39.38 ± 1.12 years (range 18–65 years), controls 43.25 ± 2.05 years Ethnicity: Indian Inclusion: cases: nephrolithiatic patients; controls: no evidence of stone disease and without any family history of stone disease Exclusion: N/A | VDR Bsm1 NCBI rs1544410 (A/G) VDR Fok1 rs2228570 (NCBI C/T) | Allele frequency of the VDR BsmI restriction site: controls (n = 100): B wild type allele 60%, b mutant allele 40%; nephrolithiatic subjects (n = 150): B allele 52.7%, b allele 47.3%; hypercalciuric nephrolithiatic subjects (n = 47): B allele 38.3%, b allele 61.7%. VDR Fok1 restriction site: controls (n = 100): F wild type allele 55.4%, f mutant allele 44.4%; nephrolithiatic subjects (n = 150): F allele 40.9%, f allele 59.1%; hypercalciuric nephrolithiatic subjects (n = 47): F allele 56.63%, f allele 40.47%. | VDR polymorphisms may be associated with increased renal calcium excretion in hypercalciuric nephrolithiatic subjects (bb genotype and Ff and FF genotypes exhibit higher renal calcium excretion) | VDR Bsm1: significantly higher 24 h urinary calcium (mg/24 h) excretion, p = 0.001, in nephrolithiatic subjects with the bb homozygous mutant genotype (262.61 ± 24.28) compared with the Bb (165.76 ± 17.26) and homozygous BB (205.68 ± 14.29) genotypes. Hypercalciuric nephrolithiatic subjects, 24 h urinary calcium excretion significantly higher in bb genotype, p < 0.05, compared with Bb and BB genotypes. Serum calcium levels comparable in all genotypes in both nephrolithiatic and hypercalciuric nephrolithiatic subjects. VDR Fok1: nephrolithiatic subjects with homozygous (FF) or heterozygous (Ff) genotypes showed significantly higher, p < 0.05, calcium excretion compared to the ff genotype. Hypercalciuric nephrolithiatic subjects, heterozygotes (Ff) excrete more calcium than the ff genotype. Serum calcium was significantly higher, p < 0.05, in hypercalciuric nephrolithiatic subjects with the ff genotype compared with FF or Ff genotypes. |
| Study Reference Country Study Design | Description of Study Population | SNPs Associated with Phenotype (Gene, rs#, Nucleotide Change, Amino Acid Change) | Frequency of SNP in Study Population | Description of SNP and Phenotype | Association of SNP with Calcium Change |
|---|---|---|---|---|---|
| Arcidiacono 2018 [33] Italy Retrospective observational (cross-sectional) | N = 393 (317 males, 76 females) Age: 45 ± 10 years Ethnicity: N/A Inclusion:: never-treated, recently discovered patients with essential hypertension with high/normal blood pressure level or grade 1 or 2 hypertension Exclusion: patients with secondary causes of hypertension, endocrine disorders, body mass index > 32 kg/m2, or chronic and acute concomitant diseases (cardiocerebrovascular diseases, diabetes mellitus, or hepatic and kidney diseases) and women taking contraceptive pills | 31 SNPs in the 3′ region of claudin-14 gene CLDN14 rs219755 (G/A) | N/A | Claudin-14 genotype at the 39 region is associated with calcium excretion in 24-h urine | rs219755 (G/A) showed the strongest association with 24-h urinary calcium excretion (mg/24 h): AA 124 ± 73, GA 194 ± 100, GG 225 ± 124, p < 0.001 |
| Bellia 2016 [50] Italy Cross-sectional | N = 393 (317 males, 76 females) Age: 60 ± 10.6 years Ethnicity: Caucasian Inclusion:: patients with one or more cardiovascular risk factor and asymptomatic for coronary vasculopathy Exclusion: any severe chronic disease, hepatic disease, chronic kidney disease (CKD), respiratory insufficiency, malignancy, and infectious disease | AHSG rs4918 (G/C, T256S, Thr > Ser) | GG (TT) 64%, GC (TS) 28%, CC (SS) 8% | Serum levels of Fetuin-A are linked to serum calcium homeostasis and AHSG genotype but not with coronary artery calcification (CAC) severity in subjects without coronary vasculopathy | Subjects carrying the CC (SS) genotype had lower levels of serum calcium mmol/L (mg/dL) 2.3 ± 0.03 (9.1 ± 0.1) compared with GG (TT) 2.3 ± 0.1 (9.4 ± 0.5) and GC (TS) 2.4 ± 0.1 (9.8 ± 0.5 mg/dL), p = 0.038 |
| Fujita 2013 [56] Japan Cross-sectional | N = 73 (27 males, 46 females) Age: 20–45 years Ethnicity: Japanese Inclusion:: healthy Japanese volunteers Exclusion: N/A | hKLK1 (promoter region, H allele: with nucleotide substitution -130(G)11) rs# not available | H allele frequency 24% | The common allele H polymorphism in Japanese may contribute to decreased reabsorptions of calcium and sodium in the kidney | Higher fractional urinary calcium excretion for subjects with H allele compared with subjects without H allele (0.9% ± 0.5 vs. 0.6% ± 0.5), p = 0.03, higher urinary calcium excretion in mg per mg creatinine for subjects with H allele compared with subjects without H allele (0.14 ± 0.09 vs. 0.09 ± 0.08), p = 0.03 |
| Gianfagna 2013 [34] Belgium, Cyprus, Estonia, Germany, Hungary, Italy, Spain, Sweden Cross-sectional | N = 2267 (1188 males, 1079 females) Age: 6.2 ± 1.8 years Ethnicity: Caucasian Inclusion:: children participating in the large European multi-centre study IDEFICS with complete data on age, sex, parental questionnaire, height, weight, hip and waist circumferences, birthplace and language spoken at home as well as with provided saliva samples Exclusion: N/A | NMU rs9999653 (major/minor C/T) | CC 21.5%, CT 49.1%, TT 29.4% | The NMU gene plays a role through interaction with ADRB2 gene in bone strength regulation (more evident in preschool girls) | NMU rs9999653 CC genotype was associated with lower serum calcium (n = 605), p = 0.01 |
| Howles 2019 [35] UK, Japan Genome-wide association study | UK Biobank: 6536 cases, 388,508 controls; Biobank Japan: 5587 cases, 28,870 controls (from 4 population-based cohort studies); validation cohort: 440 patients Age: 40–69 years (UK Biobank) Ethnicity: Multi-ethnic Inclusion:: UK Biobank: history of nephrolithiasis; Biobank Japan: diagnosis of nephrolithiasis; validation cohort: kidney stone formers Exclusion: UK Biobank: disorder of calcium homeostasis, malabsorption, or other condition known to predispose to kidney stone disease; Biobank Japan: bladder stones | CYP24A1 rs17216707 (T/C) DGKD rs838717(A/G) | CYP24A1 (rs17216707) effect allele frequency T: UK Biobank 0.81, Biobank Japan 0.92; DGKD (rs838717) prevalence not described | In only nephrolithiasis patients, the CYP24A1-associated locus correlated with serum calcium concentration and a number of nephrolithiasis episodes while the DGKD-associated locus correlated with urinary calcium excretion | In validation cohort of kidney stone formers: significant higher serum calcium mmol/L (mg/dL) for CYP24A1 (rs17216707) TT genotype 2.36 ± 0.01 (9.46 ± 0.04), n = 260 compared with TC genotype 2.32 ± 0.01 (9.30 ± 0.04), n = 109, but not CC genotype 2.34 ± 0.02 (9.38 ± 0.08), n = 15; significant lower 24 hr renal calcium excretion (mmol) in male patients carrying the DGKD (rs838717) AA genotype (4.54 ± 0.45, n = 33) compared with GG (7.27 ± 0.91, n = 25), but not AG genotype (5.45 ± 0.48, n = 57) |
| Hwang 2014 [36] Taiwan Case-control | N = 579 CKD patients (323 males, 256 females) Age: 6.2 ± 1.8 years Ethnicity: Taiwanese Inclusion:: >18 years of age with chronic kidney disease (CKD), detailed clinical history recorded as part of the CKD Care Program Exclusion: N/A Note: CKD patients divided into early-stage CKD (eGFR above 45 mL/min/1.73m2) and late-stage CKD (lower eGFR) | ORAI1 rs12313273 (C/T) | Genotype frequency in ORAI1 rs12313273: CC n = 50 (8.7%), CT n = 245 (42.5%), TT n = 281 (48.8%) | rs12313273 polymorphism was significantly associated with elevated serum calcium levels, which has been linked to increased risk of death in CKD patients | Significant association of ORAI1 rs12313273 with serum calcium levels mmol/L (mg/dL) in CKD patients: CC genotype 2.33 ± 0.15 vs. CT 2.30 ± 0.14 vs. TT 2.27 ± 0.26 (9.32 ± 0.61 vs. 9.23 ± 0.57 vs. 9.08 ± 1.03), p = 0.0389; no differences between early and late stage |
| Kim 2018 [37] Korea Cross-sectional | N = 7815 (3629 males, 4186 females) Age: 51.7 ± 0.1 years Ethnicity: Korean Inclusion:: participants from the Ansung-Ansan cohort (community-based cohort) Exclusion: N/A | GCKR SNPs rs780093 (T/C); rs780094 (T/C); rs1260326 (T/C) | Genotype frequency for rs780093: TT n = 2247 (28.8%), TC n = 3895 (49.8%), CC n = 1673 (21.4%) rs780094: TT n = 2264 (29.0%), TC n = 3888 (49.8%), CC n = 1663 (21.3%) rs1260326: TT n = 2321 (29.7%), TC n = 3873 (49.6%), CC n = 1621 (20.7%) | Minor C allele carriers, particularly CC homozygotes, had lower serum calcium levels than TT homozygotes for all 3 SNPs. GCKR SNPs are associated with lipid profiles and glycaemic status in the Korean population (modified by basal circulating calcium levels in normal or high ranges) | Significantly decreased serum calcium level in participants with CC genotype (minor allele) compared with TT genotype but not TC for rs780093, rs780094, rs1260326 |
| Koek 2010 [38] Netherlands Cross-sectional | N = 6146 (2369 males, 3777 females) Age: 55 years and older Ethnicity: Caucasian Inclusion:: participants from the Rotterdam study (large prospective population-based cohort study) Exclusion: N/A | LPH rs498823 (G/C, T-13910C, Thr > Cys) | Males: GG (TT) n = 1248 (48%), GC (TC) n = 1061 (41%), CC (CC) n = 281 (11%) females: GG (TT) n = 1816 (48%), GC (TC) n = 1577 (42%), CC (CC) n = 384 (10%) | Calcium intake and serum ionized serum calcium were significantly lower in C-homozygotes; no association between T-13910C polymorphism and VDR, bone mineral density or fractur | Dietary calcium intake (mg/day) lower in C-homozygotes (mean, SD): GG (TT) 1151 ± 352, GC (TC) 1120 ±3 69, CC (CC) 1058 ± 339, p trend = 3.0 × 10⁻⁵; lower ionized serum calcium mmol/L (mg/dL) in C-homozygotes (mean, SD): GG (TT) 1.29 ± 0.6 (5.17 ± 2.40), GC (TC) 1.29 ± 0.05 (5.17 ± 0.20), CC (CC) 1.28 ± 0.07 (5.13 ± 0.28), p = 0.02, but no difference in total serum calcium between genotypes |
| Masi 2007 [51] Italy Cross-sectional | N = 100 (25 males, 75 females) Age: 57 ± 8 years (range 47–76 years) Ethnicity: Caucasian Inclusion:: healthy Caucasian volunteers, no history of hypocalcemia Exclusion: N/A | GNAS1 (nucleotide c.433-18T > C) rs# not available | TT n = 82 (82%), TC n = 15 (15%), CC n = 3 (3%) | A significant association with low serum calcium levels was found in healthy subjects carrying the novel GNAS1 T > C polymorphism | Lower serum calcium (mg/day) for individuals with C allele: TT 9.1 ± 0.9, TC 8.3 ± 0.87, CC 8.1 ± 0.25 (TT vs. TC p = 0.03; TT vs. CC p = 0.04) |
| Shakhssalim [47] 2014 Iran Case-control | N = 206 males (105 cases, 101 controls) Age: 30–55 years Ethnicity: N/A Inclusion:: cases: men with history of recurrent calcium urinary stones; controls: healthy volunteers without any personal or family history of urolithiasis Exclusion: cases and controls: histories of known metabolic, gastrointestinal, hepatic, renal and endocrinological diseases or any anatomic abnormality or obstruction in the urinary tract, taking any drugs which may affect urine composition | CALCR (3′UTR + 18C > T; rs# not reported) (9 SNPs studied, but only one associated with different calcium levels) | 3′UTR + 18C > T: minor allele frequency in the population under study 7%; frequency in cases: wild type n = 73 (72.3%), heterozygotes n = 27 (26.7%), homozygotes n = 1 (1%); controls: wild type n = 101 (100%), hetero- and homozygotes n = 0 (0%) | Potential association of polymorphisms in the CALCR and the risk of kidney stone disease | 3′UTR + 18C > T polymorphism in stone formers: significant difference in urine calcium concentration (mg/L 24 h) between wild type and C > T hetero- or homozygotes (mean ± SD): 117.13 ± 60.55 vs. 152.92 ± 72.18, p = 0.03), no difference in urine calcium mg/24 h or total serum calcium between wild type and hetero- or homozygotes |
Publisher’s Note: MDPI stays neutral with regard to jurisdictional claims in published maps and institutional affiliations. |
© 2021 by the authors. Licensee MDPI, Basel, Switzerland. This article is an open access article distributed under the terms and conditions of the Creative Commons Attribution (CC BY) license (https://creativecommons.org/licenses/by/4.0/).
Share and Cite
da Silva Lopes, K.; Abe, S.K. Polymorphisms Contributing to Calcium Status: A Systematic Review. Nutrients 2021, 13, 2488. https://doi.org/10.3390/nu13082488
da Silva Lopes K, Abe SK. Polymorphisms Contributing to Calcium Status: A Systematic Review. Nutrients. 2021; 13(8):2488. https://doi.org/10.3390/nu13082488
Chicago/Turabian Styleda Silva Lopes, Katharina, and Sarah Krull Abe. 2021. "Polymorphisms Contributing to Calcium Status: A Systematic Review" Nutrients 13, no. 8: 2488. https://doi.org/10.3390/nu13082488
APA Styleda Silva Lopes, K., & Abe, S. K. (2021). Polymorphisms Contributing to Calcium Status: A Systematic Review. Nutrients, 13(8), 2488. https://doi.org/10.3390/nu13082488