
Diet, Sleep, and Mental Health: Insights from the UK Biobank Study


Abstract
:1. Introduction
2. Materials and Methods
2.1. Study Population
2.2. Assessment of Diet and Calculation of Diet-Related Scores
2.3. Assessment of Sleep and Calculation of Healthy Sleep Score
2.4. Assessment of Mental Health and Calculation of Composite Mental Health Score
2.5. Statistical Analyses
3. Results
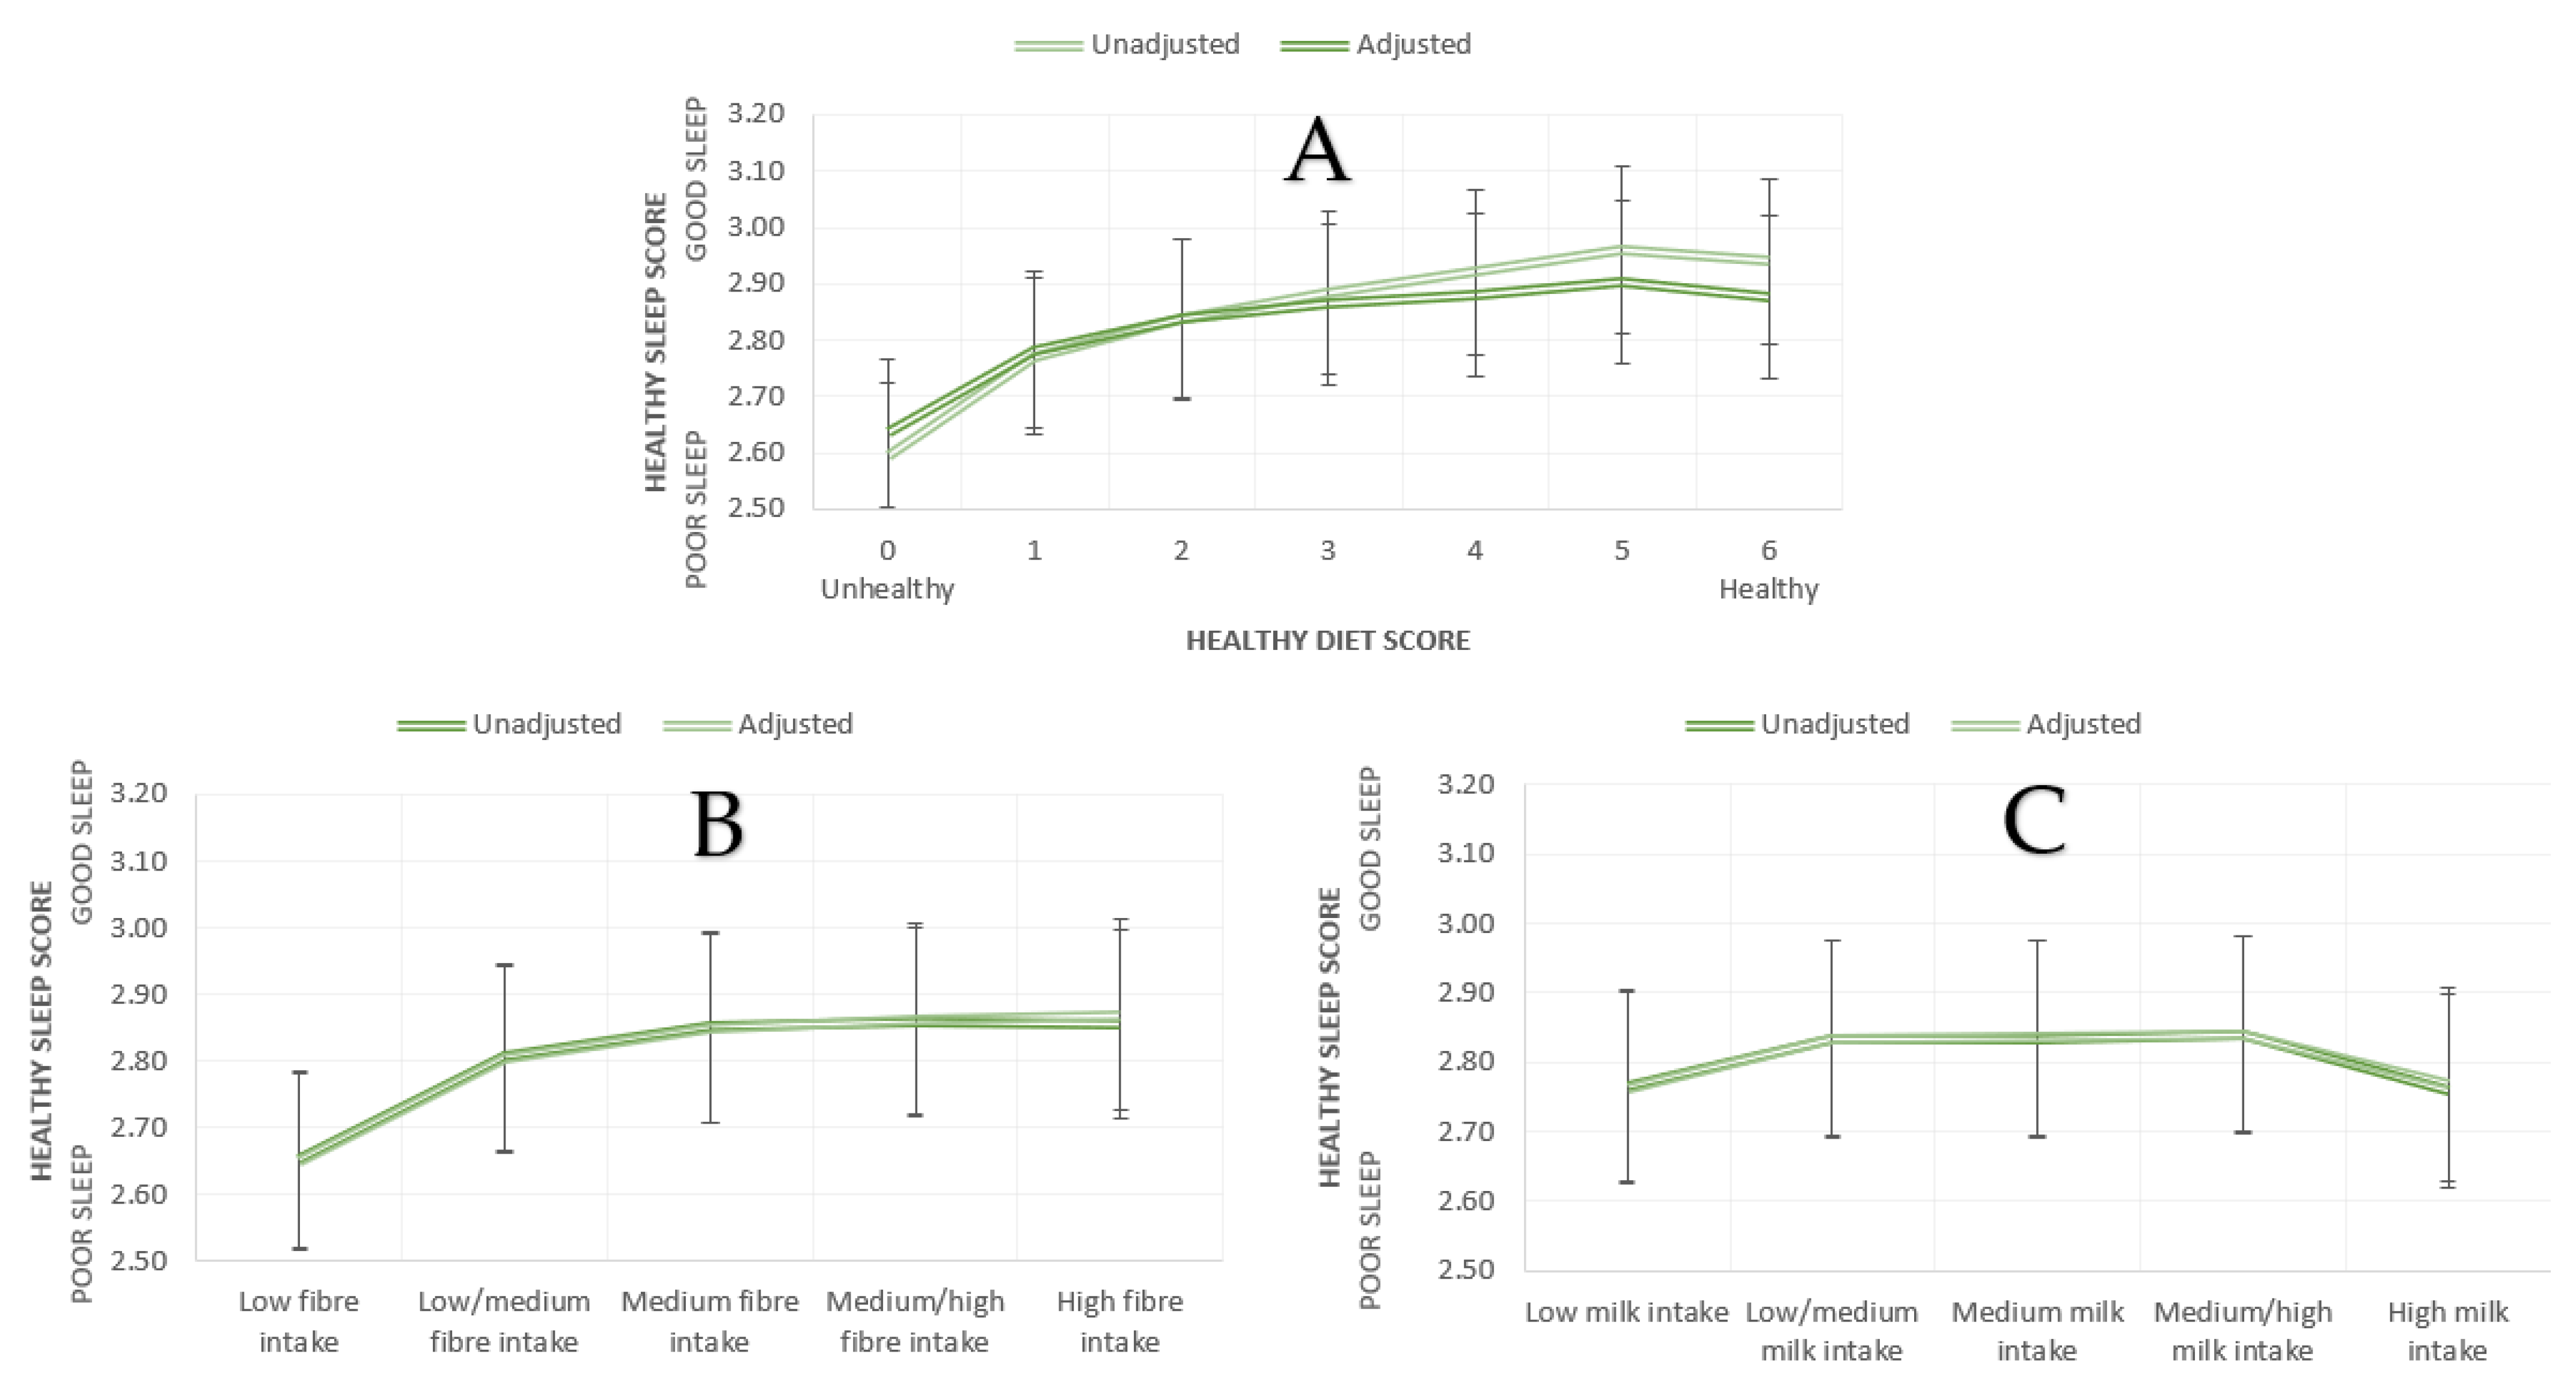
3.1. Diet and Sleep
3.1.1. Associations between Diet Quality on Sleep
3.1.2. Associations between Food Groups and Sleep
3.1.3. Fibre, Milk, and Sleep
3.2. Diet and Mental Health
3.2.1. Associations between Quality on Mental Health
3.2.2. Associations between Food Groups and Mental Health
3.2.3. Fibre, Milk, and Mental Health
4. Discussion
4.1. Healthy Diet and Food Groups
4.2. Fibre and Milk
4.3. Strengths and Limitations
5. Conclusions
Supplementary Materials
Author Contributions
Funding
Institutional Review Board Statement
Informed Consent Statement
Data Availability Statement
Acknowledgments
Conflicts of Interest
References
- Koyanagi, A.; Stickley, A. The Association between Sleep Problems and Psychotic Symptoms in the General Population: A Global Perspective. Sleep 2015, 38, 1875–1885. [Google Scholar]
- Léger, D.; Poursain, B.; Neubauer, D.; Uchiyama, M. An international survey of sleeping problems in the general population. Curr. Med. Res. Opin. 2008, 24, 307–317. [Google Scholar] [CrossRef]
- Stranges, S.; Tigbe, W.; Gómez-Olivé, F.X.; Thorogood, M.; Kandala, N.-B. Sleep Problems: An Emerging Global Epidemic? Findings from the INDEPTH WHO-SAGE Study among More Than 40,000 Older Adults from 8 Countries across Africa and Asia. Sleep 2012, 35, 1173–1181. [Google Scholar] [CrossRef] [Green Version]
- WHO. Depression and Other Common Mental Disorders Global Health Estimates. 2017. Available online: https://apps.who.int/iris/bitstream/handle/10665/254610/WHO-MSD-MER-2017.2-eng.pdf (accessed on 18 June 2021).
- Lamers, F.; van Oppen, P.; Comijs, H.C.; Smit, J.H.; Spinhoven, P.; van Balkom, A.J.; Nolen, W.A.; Zitman, F.G.; Beekman, A.T.; Penninx, B.W. Comorbidity patterns of anxiety and depressive disorders in a large cohort study: The Netherlands Study of Depression and Anxiety (NESDA). J. Clin. Psychiatry 2011, 72, 341–348. [Google Scholar] [CrossRef]
- Soehner, A.M.; Harvey, A.G. Prevalence and functional consequences of severe insomnia symptoms in mood and anxiety disorders: Results from a nationally representative sample. Sleep 2012, 35, 1367–1375. [Google Scholar] [CrossRef] [Green Version]
- Gillin, J.C.; Duncan, W.; Pettigrew, K.D.; Frankel, B.L.; Snyder, F. Successful separation of depressed, normal, and insomniac subjects by EEG sleep data. Arch. Gen. Psychiatry 1979, 36, 85–90. [Google Scholar] [CrossRef]
- Neckelmann, D.; Mykletun, A.; Dahl, A.A. Chronic insomnia as a risk factor for developing anxiety and depression. Sleep 2007, 30, 873–880. [Google Scholar] [CrossRef] [PubMed] [Green Version]
- Breslau, N.; Roth, T.; Rosenthal, L.; Andreski, P. Sleep disturbance and psychiatric disorders: A longitudinal epidemiological study of young Adults. Biol. Psychiatry 1996, 39, 411–418. [Google Scholar] [CrossRef]
- Chisholm, D.; Sweeny, K.; Sheehan, P.; Rasmussen, B.; Smit, F.; Cuijpers, P.; Saxena, S. Scaling-up treatment of depression and anxiety: A global return on investment analysis. Lancet Psychiatry 2016, 3, 415–424. [Google Scholar] [CrossRef] [Green Version]
- RAND. Why Sleep Matters: Quantifying the Economic Costs of Insufficient Sleep. n.d. Available online: https://www.rand.org/randeurope/research/projects/the-value-of-the-sleep-economy.html (accessed on 18 June 2021).
- Cipriani, A.; Furukawa, T.A.; Salanti, G.; Chaimani, A.; Atkinson, L.Z.; Ogawa, Y.; Leucht, S.; Ruhe, H.G.; Turner, E.H.; Higgins, J.P.T.; et al. Comparative efficacy and acceptability of 21 antidepressant drugs for the acute treatment of adults with major depressive disorder: A systematic review and network meta-analysis. Lancet 2018, 391, 1357–1366. [Google Scholar] [CrossRef] [Green Version]
- Cuijpers, P.; Cristea, I.A.; Karyotaki, E.; Reijnders, M.; Huibers, M.J.H. How effective are cognitive behavior therapies for major depression and anxiety disorders? A meta-analytic update of the evidence. World Psychiatry Off. J. World Psychiatr. Assoc. (WPA) 2016, 15, 245–258. [Google Scholar] [CrossRef]
- De Bruin, E.J.; Bögels, S.M.; Oort, F.J.; Meijer, A.M. Efficacy of Cognitive Behavioral Therapy for Insomnia in Adolescents: A Randomized Controlled Trial with Internet Therapy, Group Therapy and a Waiting List Condition. Sleep 2015, 38, 1913–1926. [Google Scholar] [CrossRef] [PubMed]
- Sarris, J.; Logan, A.C.; Akbaraly, T.N.; Amminger, G.P.; Balanzá-Martínez, V.; Freeman, M.P.; Hibbeln, J.; Matsuoka, Y.; Mischoulon, D.; Mizoue, T.; et al. Nutritional medicine as mainstream in psychiatry. Lancet Psychiatry 2015, 2, 271–274. [Google Scholar] [CrossRef]
- Sarris, J.; Logan, A.C.; Akbaraly, T.N.; Paul Amminger, G.; Balanzá-Martínez, V.; Freeman, M.P.; Hibbeln, J.; Matsuoka, Y.; Mischoulon, D.; Mizoue, T.; et al. International Society for Nutritional Psychiatry Research consensus position statement: Nutritional medicine in modern psychiatry. World Psychiatry 2015, 14, 370–371. [Google Scholar] [CrossRef] [PubMed]
- Doherty, R.; Madigan, S.; Warrington, G.; Ellis, J. Sleep and Nutrition Interactions: Implications for Athletes. Nutrients 2019, 11, 822. [Google Scholar] [CrossRef] [Green Version]
- Hosker, D.K.; Elkins, R.M.; Potter, M.P. Promoting Mental Health and Wellness in Youth through Physical Activity, Nutrition and Sleep. Child. Adolesc. Psychiatr. Clin. N. Am. 2019, 28, 171–193. [Google Scholar] [CrossRef]
- Melanson, K.J. Nutrition Review: Relationships of Nutrition with Depression and Anxiety. Am. J. Lifestyle Med. 2007, 1, 171–174. [Google Scholar] [CrossRef]
- Peuhkuri, K.; Sihvola, N.; Korpela, R. Diet promotes sleep duration and quality. Nutr. Res. 2012, 32, 309–319. [Google Scholar] [CrossRef]
- Marx, W.; Moseley, G.; Berk, M.; Jacka, F. Nutritional psychiatry: The present state of the evidence. Proc. Nutr. Soc. 2017, 76, 427–436. [Google Scholar] [CrossRef] [Green Version]
- Marx, W.; Lane, M.; Hockey, M.; Aslam, H.; Berk, M.; Walder, K.; Borsini, A.; Firth, J.; Pariante, C.M.; Berding, K.; et al. Diet and depression: Exploring the biological mechanisms of action. Mol. Psychiatry 2020, 26, 134–150. [Google Scholar] [CrossRef]
- Cryan, J.F.; Dinan, T.G. Mind-altering microorganisms: The impact of the gut microbiota on brain and behaviour. Nat. Rev. Neurosci. 2012, 13, 701–712. [Google Scholar] [CrossRef]
- Teichman, E.M.; O’Riordan, K.J.; Gahan, C.G.M.; Dinan, T.G.; Cryan, J.F. When Rhythms Meet the Blues: Circadian Interactions with the Microbiota-Gut-Brain Axis. Cell Metab. 2020, 31, 448–471. [Google Scholar] [CrossRef] [PubMed]
- Lai, J.S.; Hiles, S.; Bisquera, A.; Hure, A.J.; McEvoy, M.; Attia, J. A systematic review and meta-analysis of dietary patterns and depression in community-dwelling adults. Am. J. Clin. Nutr. 2013, 99, 181–197. [Google Scholar] [CrossRef] [PubMed] [Green Version]
- O’Neil, A.; Quirk, S.h.E.; Housden, S.; Brennan, S.h.L.; Williams, L.J.; Pasco, J.A.; Berk, M.; Jacka, F.N. Relationship between diet and mental health in children and adolescents: A systematic review. Am. J. Public Health 2014, 104, e31–e42. [Google Scholar] [CrossRef]
- Mumme, K.; Conlon, C.; von Hurst, P.; Jones, B.; Stonehouse, W.; Heath, A.M.; Coad, J.; Haskell-Ramsay, C.; de Seymour, J.; Beck, K. Dietary Patterns, Their Nutrients, and Associations with Socio-Demographic and Lifestyle Factors in Older New Zealand Adults. Nutrients 2020, 12, 3425. [Google Scholar] [CrossRef]
- Lattimer, J.M.; Haub, M.D. Effects of dietary fiber and its components on metabolic health. Nutrients 2010, 2, 1266–1289. [Google Scholar] [CrossRef] [PubMed] [Green Version]
- Maier, T.V.; Lucio, M.; Lee, L.H.; VerBerkmoes, N.C.; Brislawn, C.J.; Bernhardt, J.; Lamendella, R.; McDermott, J.E.; Bergeron, N.; Heinzmann, S.S.; et al. Impact of Dietary Resistant Starch on the Human Gut Microbiome, Metaproteome, and Metabolome. mBio 2017, 8, e01343-17. [Google Scholar] [CrossRef] [Green Version]
- Garcia-Mantrana, I.; Selma-Royo, M.; Alcantara, C.; Collado, M.C. Shifts on Gut Microbiota Associated to Mediterranean Diet Adherence and Specific Dietary Intakes on General Adult Population. Front. Microbiol. 2018, 9, 890. [Google Scholar] [CrossRef] [PubMed]
- Ghosh, T.S.; Rampelli, S.; Jeffery, I.B.; Santoro, A.; Neto, M.; Capri, M.; Giampieri, E.; Jennings, A.; Candela, M.; Turroni, S.; et al. Mediterranean diet intervention alters the gut microbiome in older people reducing frailty and improving health status: The NU-AGE 1-year dietary intervention across five European countries. Gut 2020, 69, 1218–1228. [Google Scholar] [CrossRef] [Green Version]
- Murphy, E.A.; Velazquez, K.T.; Herbert, K.M. Influence of high-fat diet on gut microbiota: A driving force for chronic disease risk. Curr. Opin. Clin. Nutr. Metab. Care 2015, 18, 515–520. [Google Scholar] [CrossRef] [PubMed]
- Allen, A.P.; Dinan, T.G.; Clarke, G.; Cryan, J.F. A psychology of the human brain-gut-microbiome axis. Soc. Pers. Psychol Compass 2017, 11, e12309. [Google Scholar] [CrossRef] [PubMed] [Green Version]
- Godos, J.; Ferri, R.; Caraci, F.; Cosentino, F.I.I.; Castellano, S.; Galvano, F.; Grosso, G. Adherence to the Mediterranean Diet is Associated with Better Sleep Quality in Italian Adults. Nutrients 2019, 11, 976. [Google Scholar] [CrossRef] [PubMed] [Green Version]
- Sanlier, N.; Sabuncular, G. Relationship between nutrition and sleep quality, focusing on the melatonin biosynthesis. Sleep Biol. Rhythm. 2020, 18, 89–99. [Google Scholar] [CrossRef]
- St-Onge, M.P.; Mikic, A.; Pietrolungo, C.E. Effects of Diet on Sleep Quality. Adv. Nutr. 2016, 7, 938–949. [Google Scholar] [CrossRef]
- Hu, F.B. Dietary pattern analysis: A new direction in nutritional epidemiology. Curr. Opin. Lipidol. 2002, 13, 3–9. [Google Scholar] [CrossRef]
- Opie, R.S.; O’Neil, A.; Itsiopoulos, C.; Jacka, F.N. The impact of whole-of-diet interventions on depression and anxiety: A systematic review of randomised controlled trials. Public Health Nutr. 2015, 18, 2074–2093. [Google Scholar] [CrossRef] [PubMed]
- Psaltopoulou, T.; Sergentanis, T.N.; Panagiotakos, D.B.; Sergentanis, I.N.; Kosti, R.; Scarmeas, N. Mediterranean diet, stroke, cognitive impairment, and depression: A meta-analysis. Ann. Neurol. 2013, 74, 580–591. [Google Scholar] [CrossRef]
- Firth, J.; Marx, W.; Dash, S.; Carney, R.; Teasdale, S.B.; Solmi, M.; Stubbs, B.; Schuch, F.B.; Carvalho, A.F.; Jacka, F.; et al. The Effects of Dietary Improvement on Symptoms of Depression and Anxiety: A Meta-Analysis of Randomized Controlled Trials. Psychosom. Med. 2019, 81, 265–280. [Google Scholar] [CrossRef]
- Jacka, F.N.; Pasco, J.A.; Mykletun, A.; Williams, L.J.; Hodge, A.M.; O’Reilly, S.L.; Nicholson, G.C.; Kotowicz, M.A.; Berk, M. Association of Western and traditional diets with depression and anxiety in women. Am. J. Psychiatry 2010, 167, 305–311. [Google Scholar] [CrossRef] [Green Version]
- Sánchez-Villegas, A.; Toledo, E.; de Irala, J.; Ruiz-Canela, M.; Pla-Vidal, J.; Martínez-González, M.A. Fast-food and commercial baked goods consumption and the risk of depression. Public Health Nutr. 2012, 15, 424–432. [Google Scholar] [CrossRef] [PubMed] [Green Version]
- Jacka, F.N.; O’Neil, A.; Opie, R.S.; Itsiopoulos, C.; Cotton, S.; Mohebbi, M.; Castle, D.; Dash, S.; Mihalopoulos, C.; Chatterton, M.L.; et al. A randomised controlled trial of dietary improvement for adults with major depression (the ‘SMILES’ trial). BMC Med. 2017, 15, 23. [Google Scholar] [CrossRef] [Green Version]
- Sánchez-Villegas, A.; Cabrera-Suárez, B.; Molero, P.; González-Pinto, A.; Chiclana-Actis, C.; Cabrera, C.; Lahortiga-Ramos, F.; Florido-Rodríguez, M.; Vega-Pérez, P.; Vega-Pérez, R.; et al. Preventing the recurrence of depression with a Mediterranean diet supplemented with extra-virgin olive oil. The PREDI-DEP trial: Study protocol. BMC Psychiatry 2019, 19, 63. [Google Scholar] [CrossRef]
- Parletta, N.; Zarnowiecki, D.; Cho, J.; Wilson, A.; Bogomolova, S.; Villani, A.; Itsiopoulos, C.; Niyonsenga, T.; Blunden, S.; Meyer, B.J.; et al. A Mediterranean-style dietary intervention supplemented with fish oil improves diet quality and mental health in people with depression: A randomized controlled trial (HELFIMED). Nutr. Neurosci. 2019, 22, 474–487. [Google Scholar] [CrossRef] [Green Version]
- Bot, M.; Brouwer, I.A.; Roca, M.; Kohls, E.; Penninx, B.; Watkins, E.; van Grootheest, G.; Cabout, M.; Hegerl, U.; Gili, M.; et al. Effect of Multinutrient Supplementation and Food-Related Behavioral Activation Therapy on Prevention of Major Depressive Disorder Among Overweight or Obese Adults With Subsyndromal Depressive Symptoms: The MooDFOOD Randomized Clinical Trial. JAMA 2019, 321, 858–868. [Google Scholar] [CrossRef] [Green Version]
- Li, F.; Liu, X.; Zhang, D. Fish consumption and risk of depression: A meta-analysis. J. Epidemiol. Community Health 2016, 70, 299–304. [Google Scholar] [CrossRef]
- Liu, X.; Yan, Y.; Li, F.; Zhang, D. Fruit and vegetable consumption and the risk of depression: A meta-analysis. Nutrition 2016, 32, 296–302. [Google Scholar] [CrossRef]
- El Ansari, W.; Adetunji, H.; Oskrochi, R. Food and mental health: Relationship between food and perceived stress and depressive symptoms among university students in the United Kingdom. Cent. Eur. J. Public Health 2014, 22, 90–97. [Google Scholar] [CrossRef] [Green Version]
- Miki, T.; Eguchi, M.; Kurotani, K.; Kochi, T.; Kuwahara, K.; Ito, R.; Kimura, Y.; Tsuruoka, H.; Akter, S.; Kashino, I.; et al. Dietary fiber intake and depressive symptoms in Japanese employees: The Furukawa Nutrition and Health Study. Nutrition 2016, 32, 584–589. [Google Scholar] [CrossRef] [PubMed] [Green Version]
- Sudlow, C.; Gallacher, J.; Allen, N.; Beral, V.; Burton, P.; Danesh, J.; Downey, P.; Elliott, P.; Green, J.; Landray, M.; et al. UK Biobank: An Open Access Resource for Identifying the Causes of a Wide Range of Complex Diseases of Middle and Old Age. PLoS Med. 2015, 12, e1001779. [Google Scholar] [CrossRef] [PubMed] [Green Version]
- Lourida, I.; Hannon, E.; Littlejohns, T.J.; Langa, K.M.; Hypponen, E.; Kuzma, E.; Llewellyn, D.J. Association of Lifestyle and Genetic Risk with Incidence of Dementia. JAMA 2019, 322, 430–437. [Google Scholar] [CrossRef] [PubMed]
- Bradbury, K.E.; Young, H.J.; Guo, W. Dietary assessment in UK Biobank: An evaluation of the performance of the touchscreen dietary questionnaire. J. Nutr. Sci. 2018, 7, e6. [Google Scholar] [CrossRef] [Green Version]
- Bradbury, K.E.; Murphy, N.; Key, T.J. Diet and colorectal cancer in UK Biobank: A prospective study. Int. J. Epidemiol. 2019, 49, 246–258. [Google Scholar] [CrossRef] [PubMed] [Green Version]
- Fan, M.; Sun, D.; Zhou, T.; Heianza, Y.; Lv, J.; Li, L.; Qi, L. Sleep patterns, genetic susceptibility, and incident cardiovascular disease: A prospective study of 385 292 UK biobank participants. Eur. Heart J. 2020, 41, 1182–1189. [Google Scholar] [CrossRef] [PubMed] [Green Version]
- Bennett, E.; Peters, S.A.E.; Woodward, M. Sex differences in macronutrient intake and adherence to dietary recommendations: Findings from the UK Biobank. BMJ Open 2018, 8, e020017. [Google Scholar] [CrossRef]
- PHE. National Diet and Nutrition Survey: Results from Years 5–6 Combined of the Rolling Programme for 2012 and 2013 to 2013 and 2014, 2016 Cited 2020. Available online: https://assets.publishing.service.gov.uk/government/uploads/system/uploads/attachment_data/file/551352/NDNS_Y5_6_UK_Main_Text.pdf (accessed on 18 June 2021).
- Noorwali, E.A.; Hardie, L.J.; Cade, J.E. Recommended sleep duration is associated with higher consumption of fruits and vegetables; cross-sectional and prospective analyses from the UK Women’s Cohort Study. Sleep Sci. Pract. 2018, 2, 13. [Google Scholar] [CrossRef]
- Lana, A.; Struijk, E.A.; Arias-Fernandez, L.; Graciani, A.; Mesas, A.E.; Rodriguez-Artalejo, F.; Lopez-Garcia, E. Habitual Meat Consumption and Changes in Sleep Duration and Quality in Older Adults. Aging Dis. 2019, 10, 267–277. [Google Scholar] [CrossRef] [Green Version]
- Wurtman, R.J.; Wurtman, J.J.; Regan, M.M.; McDermott, J.M.; Tsay, R.H.; Breu, J.J. Effects of normal meals rich in carbohydrates or proteins on plasma tryptophan and tyrosine ratios. Am. J. Clin. Nutr. 2003, 77, 128–132. [Google Scholar] [CrossRef] [PubMed]
- González, R.; Ballester, I.; López-Posadas, R.; Suárez, M.D.; Zarzuelo, A.; Martínez-Augustin, O.; Sánchez de Medina, F. Effects of flavonoids and other polyphenols on inflammation. Crit. Rev. Food Sci. Nutr. 2011, 51, 331–362. [Google Scholar] [CrossRef]
- Widmer, R.J.; Flammer, A.J.; Lerman, L.O.; Lerman, A. The Mediterranean diet, its components, and cardiovascular disease. Am. J. Med. 2015, 128, 229–238. [Google Scholar] [CrossRef] [Green Version]
- Ma, Y.; Hebert, J.R.; Li, W.; Bertone-Johnson, E.R.; Olendzki, B.; Pagoto, S.L.; Tinker, L.; Rosal, M.C.; Ockene, I.S.; Ockene, J.K.; et al. Association between dietary fiber and markers of systemic inflammation in the Women’s Health Initiative Observational Study. Nutrition 2008, 24, 941–949. [Google Scholar] [CrossRef] [Green Version]
- Wisnuwardani, R.W.; De Henauw, S.; Ferrari, M.; Forsner, M.; Gottrand, F.; Huybrechts, I.; Kafatos, A.G.; Kersting, M.; Knaze, V.; Manios, Y.; et al. Total Polyphenol Intake Is Inversely Associated with a Pro/Anti-Inflammatory Biomarker Ratio in European Adolescents of the HELENA Study. J. Nutr. 2020, 150, 1610–1618. [Google Scholar] [CrossRef] [PubMed]
- Sureda, A.; Bibiloni, M.D.M.; Julibert, A.; Bouzas, C.; Argelich, E.; Llompart, I.; Pons, A.; Tur, J.A. Adherence to the Mediterranean Diet and Inflammatory Markers. Nutrients 2018, 10, 62. [Google Scholar] [CrossRef] [PubMed] [Green Version]
- Chai, W.; Morimoto, Y.; Cooney, R.V.; Franke, A.A.; Shvetsov, Y.B.; Le Marchand, L.; Haiman, C.A.; Kolonel, L.N.; Goodman, M.T.; Maskarinec, G. Dietary Red and Processed Meat Intake and Markers of Adiposity and Inflammation: The Multiethnic Cohort Study. J. Am. Coll. Nutr. 2017, 36, 378–385. [Google Scholar] [CrossRef] [PubMed]
- Ferrie, J.E.; Kivimäki, M.; Akbaraly, T.N.; Singh-Manoux, A.; Miller, M.A.; Gimeno, D.; Kumari, M.; Davey Smith, G.; Shipley, M.J. Associations between change in sleep duration and inflammation: Findings on C-reactive protein and interleukin 6 in the Whitehall II Study. Am. J. Epidemiol. 2013, 178, 956–961. [Google Scholar] [CrossRef] [PubMed] [Green Version]
- Phillips, C.M.; Shivappa, N.; Hebert, J.R.; Perry, I.J. Dietary inflammatory index and mental health: A cross-sectional analysis of the relationship with depressive symptoms, anxiety and well-being in adults. Clin. Nutr. 2018, 37, 1485–1491. [Google Scholar] [CrossRef]
- Cantarel, B.L.; Lombard, V.; Henrissat, B. Complex Carbohydrate Utilization by the Healthy Human Microbiome. PLoS ONE 2012, 7, e28742. [Google Scholar] [CrossRef] [Green Version]
- Hakansson, A.; Molin, G. Gut microbiota and inflammation. Nutrients 2011, 3, 637–682. [Google Scholar] [CrossRef]
- Rosinger, A.Y.; Chang, A.M.; Buxton, O.M.; Li, J.; Wu, S.; Gao, X. Short sleep duration is associated with inadequate hydration: Cross-cultural evidence from US and Chinese adults. Sleep 2019, 42. [Google Scholar] [CrossRef] [Green Version]
- Suh, H.; Lieberman, H.R.; Jansen, L.T.; Colburn, A.T.; Adams, J.D.; Seal, A.D.; Butts, C.L.; Kirkland, T.M.; Melander, O.; Vanhaecke, T. Cellular dehydration acutely degrades mood mainly in women: A counterbalanced, crossover trial. Br. J. Nutr. 2020, 1–9. [Google Scholar] [CrossRef] [PubMed]
- Scholey, A.; Downey, L.A.; Ciorciari, J.; Pipingas, A.; Nolidin, K.; Finn, M.; Wines, M.; Catchlove, S.; Terrens, A.; Barlow, E. Acute neurocognitive effects of epigallocatechin gallate (EGCG). Appetite 2012, 58, 767–770. [Google Scholar] [CrossRef]
- Juneja, L.R.; Chu, D.-C.; Okubo, T.; Nagato, Y.; Yokogoshi, H. L-theanine—A unique amino acid of green tea and its relaxation effect in humans. Trends Food Sci. Technol. 1999, 10, 199–204. [Google Scholar] [CrossRef]
- Clark, I.; Landolt, H.P. Coffee, caffeine, and sleep: A systematic review of epidemiological studies and randomized controlled trials. Sleep Med. Rev. 2017, 31, 70–78. [Google Scholar] [CrossRef] [Green Version]
- Roehrs, T.; Roth, T. Caffeine: Sleep and daytime sleepiness. Sleep Med. Rev. 2008, 12, 153–162. [Google Scholar] [CrossRef]
- Lara, D.R. Caffeine, mental health, and psychiatric disorders. J. Alzheimers Dis. 2010, 20, S239–S248. [Google Scholar] [CrossRef]
- St-Onge, M.P.; Roberts, A.; Shechter, A.; Choudhury, A.R. Fiber and Saturated Fat Are Associated with Sleep Arousals and Slow Wave Sleep. J. Clin. Sleep Med. 2016, 12, 19–24. [Google Scholar] [CrossRef] [Green Version]
- Lee, J.H.; Chung, S.J.; Seo, W.H. Association between Self-Reported Sleep Duration and Dietary Nutrients in Korean Adolescents: A Population-Based Study. Children 2020, 7, 221. [Google Scholar] [CrossRef] [PubMed]
- Swann, O.G.; Kilpatrick, M.; Breslin, M.; Oddy, W.H. Dietary fiber and its associations with depression and inflammation. Nutr. Rev. 2020, 78, 394–411. [Google Scholar] [CrossRef] [PubMed]
- Ramin, S.; Mysz, M.A.; Meyer, K.; Capistrant, B.; Lazovich, D.; Prizment, A. A prospective analysis of dietary fiber intake and mental health quality of life in the Iowa Women’s Health Study. Maturitas 2020, 131, 1–7. [Google Scholar] [CrossRef] [PubMed] [Green Version]
- Mullington, J.M.; Simpson, N.S.; Meier-Ewert, H.K.; Haack, M. Sleep loss and inflammation. Best Pract. Res. Clin. Endocrinol. Metab. 2010, 24, 775–784. [Google Scholar] [CrossRef] [Green Version]
- Michaëlsson, K.; Wolk, A.; Langenskiöld, S.; Basu, S.; Warensjö Lemming, E.; Melhus, H.; Byberg, L. Milk intake and risk of mortality and fractures in women and men: Cohort studies. BMJ Br. Med. J. 2014, 349, g6015. [Google Scholar] [CrossRef] [Green Version]
- Michaëlsson, K.; Wolk, A.; Melhus, H.; Byberg, L. Milk, Fruit and Vegetable, and Total Antioxidant Intakes in Relation to Mortality Rates: Cohort Studies in Women and Men. Am. J. Epidemiol. 2017, 185, 345–361. [Google Scholar] [CrossRef] [Green Version]
- Cândido, F.G.; Valente, F.X.; Grześkowiak, Ł.M.; Moreira, A.P.B.; Rocha, D.; Alfenas, R.C.G. Impact of dietary fat on gut microbiota and low-grade systemic inflammation: Mechanisms and clinical implications on obesity. Int. J. Food Sci. Nutr. 2018, 69, 125–143. [Google Scholar] [CrossRef] [PubMed]
- Voigt, R.M.; Forsyth, C.B.; Green, S.J.; Engen, P.A.; Keshavarzian, A. Chapter Nine–Circadian rhythm and the gut microbiome. In International Review of Neurobiology; Cryan, J.F., Clarke, G., Eds.; Academic Press: Cambridge, MA, USA, 2016; pp. 193–205. [Google Scholar]
- Dinan, T.G.; Stanton, C.; Cryan, J.F. Psychobiotics: A novel class of psychotropic. Biol. Psychiatry 2013, 74, 720–726. [Google Scholar] [CrossRef] [PubMed]
- Jakes, R.W.; Day, N.E.; Luben, R.; Welch, A.; Bingham, S.; Mitchell, J.; Hennings, S.; Rennie, K.; Wareham, N.J. Adjusting for energy intake–what measure to use in nutritional epidemiological studies? Int. J. Epidemiol. 2004, 33, 1382–1386. [Google Scholar] [CrossRef] [PubMed] [Green Version]
- Swanson, J.M. The UK Biobank and selection bias. Lancet 2012, 380, 110. [Google Scholar] [CrossRef]


| N | Mean ± SD | Mean adj. (SE) | ||
|---|---|---|---|---|
| Healthy Diet Score | 0 (unhealthy) | 65723 | 2.59 ± 1.15 | 2.64 (0.004) |
| 1 | 165603 | 2.77 ± 1.10 | 2.78 (0.003) | |
| 2 | 149435 | 2.84 ± 1.10 | 2.84 (0.003) | |
| 3 | 81980 | 2.88 ± 1.09 | 2.86 (0.004) | |
| 4 | 31207 | 2.92 ± 1.10 | 2.88 (0.006) | |
| 5 | 7688 | 2.96 ± 1.11 | 2.90 (0.012) | |
| 6 (healthy) | 856 | 2.94 ± 1.11 | 2.88 (0.037) | |
| Partial Fibre Groups | Low | 100303 | 2.65 ± 1.12 | 2.65 (0.003) |
| Low/medium | 100199 | 2.81 ± 1.10 | 2.80 (0.003) | |
| Medium | 100024 | 2.85 ± 1.09 | 2.85 (0.003) | |
| Medium/high | 100386 | 2.86 ± 1.09 | 2.86 (0.003) | |
| High | 100281 | 2.85 ± 1.11 | 2.87 (0.003) | |
| Milk Intake Groups | Low | 96543 | 2.77 ± 1.11 | 2.76 (0.004) |
| Low/medium | 100710 | 2.83 ± 1.10 | 2.83 (0.003) | |
| Medium | 94754 | 2.83 ± 1.09 | 2.84 (0.004) | |
| Medium/high | 95455 | 2.84 ± 1.09 | 2.84 (0.004) | |
| High | 96896 | 2.76 ± 1.12 | 2.77 (0.003) |
| Unadjusted | Adjusted | |||||||||||||
|---|---|---|---|---|---|---|---|---|---|---|---|---|---|---|
| Healthy Diet Score | Healthy Diet Score | |||||||||||||
| 0 | 1 | 2 | 3 | 4 | 5 | 6 | 0 | 1 | 2 | 3 | 4 | 5 | 6 | |
| 0 | 1 | −0.18 * | −0.24 * | −0.29 * | −0.33 * | −0.37 * | −0.35 * | 1 | −0.15 * | −0.20 * | −0.23 * | −0.24 * | −0.27 * | −0.24 * |
| 1 | 1 | −0.07 * | −0.11 * | −0.15 * | −0.19 * | −0.17 * | 1 | −0.06 * | −0.08 * | −0.10 * | −0.12 * | −0.09 | ||
| 2 | 1 | −0.05 * | −0.09 * | −0.12 * | −0.10 | 1 | −0.03 * | −0.04 * | −0.07 * | −0.04 | ||||
| 3 | 1 | −0.04 * | −0.08 * | −0.06 | 1 | −0.02 | −0.04 * | −0.01 | ||||||
| 4 | 1 | −0.04 | −0.02 | 1 | −0.02 | 0.00 | ||||||||
| 5 | 1 | 0.02 | 1 | 0.02 | ||||||||||
| 6 | 1 | 1 | ||||||||||||
| Partial Fibre Groups | Partial Fibre Groups | |||||||||||||
| 1 | 2 | 3 | 4 | 5 | 1 | 2 | 3 | 4 | 5 | |||||
| 1. Low | 1 | −0.15 * | −0.20 * | −0.20 * | −0.20 * | 1 | −0.15 * | −0.20 * | −0.21 * | −0.22 * | ||||
| 2. Low/medium | 1 | −0.05 * | −0.05 * | −0.05 * | 1 | −0.05 * | −0.06 * | −0.07 * | ||||||
| 3. Medium | 1 | −0.00 | −0.00 | 1 | −0.01 | −0.02 * | ||||||||
| 4. Medium/high | 1 | 0.00 | 1 | −0.00 | ||||||||||
| 5. High | 1 | 1 | ||||||||||||
| Milk Intake Groups | Milk Intake Groups | |||||||||||||
| 1 | 2 | 3 | 4 | 5 | 1 | 2 | 3 | 4 | 5 | |||||
| 1. Low | 1 | −0.07 * | −0.07 * | −0.07 * | 0.00 | 1 | −0.07 * | −0.07 * | −0.08 * | −0.00 | ||||
| 2. Low/medium | 1 | 0.00 | −0.00 | 0.08 * | 1 | −0.00 | −0.00 | 0.06 * | ||||||
| 3. Medium | 1 | −0.00 | 0.08 * | 1 | −0.00 | 0.07 * | ||||||||
| 4. Medium/high | 1 | 0.08 * | 1 | 0.07 * | ||||||||||
| 5. High | 1 | 1 | ||||||||||||
| Model | B | SE | β | 95% CI | t | p | R2 | R2(adj) | Cohen’s f2 | |
|---|---|---|---|---|---|---|---|---|---|---|
| 1 | 0.008 | 0.008 | 0.008 | |||||||
| (Constant) | 2.874 | 0.006 | 2.862, 2.886 | 480.117 | 0.000 | |||||
| Vegetable intake | 0.001 | 0.000 | 0.004 | 0.000, 0.002 | 2.566 | 0.010 | ||||
| Fruit intake | 0.011 | 0.001 | 0.025 | 0.009, 0.012 | 16.811 | 0.000 | ||||
| Fish intake | 0.021 | 0.001 | 0.028 | 0.019, 0.023 | 18.864 | 0.000 | ||||
| Unprocessed red meat intake | −0.009 | 0.001 | −0.014 | −0.011, −0.007 | −9.179 | 0.000 | ||||
| Processed meat intake | −0.073 | 0.002 | −0.070 | −0.076, −0.070 | −44.996 | 0.000 | ||||
| 2 | 0.043 | 0.043 | 0.044 | |||||||
| (Constant) | 4.429 | 0.014 | 4.401, 4.457 | 310.269 | 0.000 | |||||
| Age | −0.011 | 0.000 | −0.078 | −0.011, −0.010 | −54.412 | 0.000 | ||||
| Sex (F = 0/M = 1) | −0.053 | 0.003 | −0.024 | −0.059, −0.046 | −16.212 | 0.000 | ||||
| BMI | −0.038 | 0.000 | −0.164 | −0.038, −0.037 | −115.352 | 0.000 | ||||
| Vegetable intake | 0.002 | 0.000 | 0.007 | 0.001, 0.003 | 4.905 | 0.000 | ||||
| Fruit intake | 0.011 | 0.001 | 0.027 | 0.010, 0.012 | 17.769 | 0.000 | ||||
| Fish intake | 0.026 | 0.001 | 0.034 | 0.024, 0.028 | 23.754 | 0.000 | ||||
| Unprocessed red meat intake | 0.004 | 0.001 | 0.006 | 0.002, 0.006 | 3.881 | 0.000 | ||||
| Processed meat intake | −0.053 | 0.002 | −0.051 | −0.056, −0.050 | −32.155 | 0.000 | ||||
| 3 | 0.092 | 0.092 | 0.100 | |||||||
| (Constant) | 4.962 | 0.014 | 4.934, 4.990 | 347.16 | 0.000 | |||||
| Age | −0.014 | 0.000 | −0.101 | −0.014, −0.013 | −71.628 | 0.000 | 0.015 | 0.015 | 0.007 | |
| Sex (F = 0/M = 1) | −0.121 | 0.003 | −0.055 | −0.127, −0.115 | −37.741 | 0.000 | 0.016 | 0.016 | 0.0008 | |
| BMI | −0.036 | 0.000 | −0.158 | −0.037, −0.036 | −114.032 | 0.000 | 0.026 | 0.026 | 0.027 | |
| Mental health Symptomatology | −0.077 | 0.000 | −0.225 | −0.078, −0.076 | −161.385 | 0.000 | 0.049 | 0.049 | 0.051 | |
| Vegetable intake | 0.001 | 0.000 | 0.004 | 0.000, 0.002 | 2.710 | 0.007 | 0.001 | 0.001 | 0.0005 | |
| Fruit intake | 0.010 | 0.001 | 0.023 | 0.008, 0.011 | 15.626 | 0.000 | 0.002 | 0.002 | 0.001 | |
| Fish intake | 0.021 | 0.001 | 0.027 | 0.018, 0.023 | 19.068 | 0.000 | 0.003 | 0.003 | 0.0005 | |
| Unprocessed red meat intake | −0.002 | 0.001 | −0.003 | −0.004, 0.000 | −1.880 | 0.060 | 0.004 | 0.004 | 0.001 | |
| Processed meat intake | −0.041 | 0.002 | −0.039 | −0.044, -0.037 | −25.366 | 0.000 | 0.008 | 0.008 | 0.004 | |
| 4 | 0.002 | 0.002 | 0.002 | |||||||
| (Constant) | 2.890 | 0.004 | 2.881, 2.898 | 650.149 | 0.000 | |||||
| Tea intake | −0.012 | 0.001 | −0.032 | −0.014, −0.011 | −20.018 | 0.000 | ||||
| Coffee intake | −0.021 | 0.001 | −0.040 | −0.023, −0.020 | −24.944 | 0.000 | ||||
| Water intake | 0.005 | 0.001 | 0.011 | 0.004, 0.007 | 6.951 | 0.000 | ||||
| 5 | 0.039 | 0.039 | 0.040 | |||||||
| (Constant) | 4.475 | 0.016 | 4.445, 4.506 | 288.374 | 0.000 | |||||
| Age | −0.008 | 0.000 | −0.062 | −0.009, −0.008 | −40.425 | 0.000 | ||||
| Sex (F = 0/M = 1) | −0.088 | 0.003 | −0.039 | −0.094, −0.081 | −25.730 | 0.000 | ||||
| BMI | −0.039 | 0.000 | −0.171 | −0.040, −0.039 | −112.166 | 0.000 | ||||
| Tea intake | −0.011 | 0.001 | −0.029 | −0.012, −0.010 | −18.425 | 0.000 | ||||
| Coffee intake | −0.015 | 0.001 | −0.029 | −0.017, −0.014 | −18.148 | 0.000 | ||||
| Water intake | 0.003 | 0.001 | 0.005 | 0.001, 0.004 | 3.363 | 0.001 | ||||
| 6 | 0.090 | 0.090 | 0.098 | |||||||
| (Constant) | 4.989 | 0.015 | 4.958, 5.019 | 322.467 | 0.000 | |||||
| Age | −0.012 | 0.000 | −0.088 | −0.012, −0.012 | −58.970 | 0.000 | 0.005 | 0.005 | 0.004 | |
| Sex (F = 0/M = 1) | −0.151 | 0.003 | −0.068 | −0.158, −0.145 | −45.243 | 0.000 | 0.003 | 0.003 | 0.002 | |
| BMI | −0.038 | 0.000 | −0.164 | −0.038, −0.037 | −110.441 | 0.000 | 0.029 | 0.029 | 0.029 | |
| MH Sym. | −0.079 | 0.001 | −0.229 | −0.080, −0.078 | −152.841 | 0.000 | 0.051 | 0.051 | 0.053 | |
| Tea intake | −0.006 | 0.001 | −0.016 | −0.007, −0.005 | −10.420 | 0.000 | 0.001 | 0.001 | 0.0005 | |
| Coffee intake | −0.012 | 0.001 | −0.023 | −0.014, −0.011 | −15.128 | 0.000 | 0.002 | 0.002 | 0.001 | |
| Water intake | 0.002 | 0.001 | 0.004 | 0.000, 0.003 | 2.628 | 0.009 | 0.000 | 0.000 | 0.0001 |
| N | Mean ± SD | Mean adj. (SE) | ||
|---|---|---|---|---|
| Healthy Diet Score | 0 (unhealthy) | 64,650 | 4.59 ± 3.30 | 4.68 (0.01) |
| 1 | 165,528 | 4.40 ± 3.22 | 4.44 (0.008) | |
| 2 | 149,364 | 4.35 ± 3.19 | 4.34 (0.008) | |
| 3 | 81,955 | 4.35 ± 3.19 | 4.28 (0.01) | |
| 4 | 31,198 | 4.36 ± 3.22 | 4.26 (0.01) | |
| 5 | 7685 | 4.32 ± 3.25 | 4.23 (0.03) | |
| 6 (healthy) | 855 | 4.23 ± 3.12 | 4.16 (0.10) | |
| Partial Fibre Groups | Low | 100,207 | 4.74 ± 3.31 | 4.68 (0.01) |
| Low/medium | 100,168 | 4.42 ± 3.21 | 4.39 (0.01) | |
| Medium | 99,997 | 4.32 ± 3.17 | 4.31 (0.01) | |
| Medium/high | 100,366 | 4.26 ± 3.17 | 4.28 (0.01) | |
| High | 100,245 | 4.26 ± 3.21 | 4.34 (0.01) | |
| Milk Intake Groups | Low | 96,441 | 4.39 ± 3.25 | 4.29 (0.01) |
| Low/medium | 100,674 | 4.34 ± 3.18 | 4.32 (0.01) | |
| Medium | 94,725 | 4.31 ± 3.18 | 4.33 (0.01) | |
| Medium/high | 95430 | 4.35 ± 3.18 | 4.40 (0.01) | |
| High | 96,875 | 4.61 ± 3.29 | 4.66 (0.01) |
| Unadjusted | Adjusted | |||||||||||||
|---|---|---|---|---|---|---|---|---|---|---|---|---|---|---|
| Healthy Diet Score | Healthy Diet Score | |||||||||||||
| 0 | 1 | 2 | 3 | 4 | 5 | 6 | 0 | 1 | 2 | 3 | 4 | 5 | 6 | |
| 0 | 1 | 0.20 * | 0.24 * | 0.24 * | 0.23 * | 0.27 * | 0.36 * | 1 | 0.23 * | 0.34 * | 0.40 * | 0.42 * | 0.44 * | 0.52 * |
| 1 | 1 | −0.05 * | 0.05 * | 0.04 | 0.07 | 0.17 | 1 | 0.11 * | 0.16 * | 0.18 * | 0.21 * | 0.28 | ||
| 2 | 1 | 0.00 | −0.01 | 0.03 | 0.12 | 1 | 0.06 * | 0.08 * | 0.10 | 0.18 | ||||
| 3 | 1 | −0.01 | 0.02 | 0.12 | 1 | 0.02 | 0.04 | 0.12 | ||||||
| 4 | 1 | 0.03 | 0.13 | 1 | 0.03 | 0.10 | ||||||||
| 5 | 1 | 0.10 | 1 | 0.07 | ||||||||||
| 6 | 1 | 1 | ||||||||||||
| Partial Fibre Groups | Partial Fibre Groups | |||||||||||||
| 1 | 2 | 3 | 4 | 5 | 1 | 2 | 3 | 4 | 5 | |||||
| 1. Low | 1 | 0.32 * | 0.42 * | 0.48 * | 0.48 * | 1 | 0.30 * | 0.38 * | 0.40 * | 0.34 * | ||||
| 2. Low/medium | 1 | 0.10 * | 0.16 * | 0.16 * | 1 | 0.08 * | 0.10 * | 0.05 * | ||||||
| 3. Medium | 1 | 0.06 * | 0.05 * | 1 | 0.02 | −0.03 | ||||||||
| 4. Medium/high | 1 | −0.00 | 1 | −0.05 * | ||||||||||
| 5. High | 1 | 1 | ||||||||||||
| Milk Intake Groups | Milk Intake Groups | |||||||||||||
| 1 | 2 | 3 | 4 | 5 | 1 | 2 | 3 | 4 | 5 | |||||
| 1. Low | 1 | 0.05 * | 0.08 * | 0.04 | −0.22 * | 1 | −0.04 | −0.04 * | −0.11 * | −0.38 * | ||||
| 2. Low/medium | 1 | 0.04 | −0.00 | −0.26 * | 1 | -0.00 | −0.08 * | −0.34 * | ||||||
| 3. Medium | 1 | −0.04 | −0.30 * | 1 | −0.07 * | −0.34 * | ||||||||
| 4. Medium/high | 1 | −0.26 * | 1 | −0.27 * | ||||||||||
| 5. High | 1 | 1 | ||||||||||||
| Model | B | SE | β | 95% CI | t | p | R2 | R2(adj) | Cohen’s f2 | |
|---|---|---|---|---|---|---|---|---|---|---|
| 1 | 0.005 | 0.005 | 0.005 | |||||||
| (Constant) | 5.057 | 0.017 | 5.023, 5.091 | 289.220 | 0.000 | |||||
| Vegetable intake | −0.012 | 0.001 | −0.012 | −0.014, −0.009 | −8.081 | 0.000 | ||||
| Fruit intake | −0.023 | 0.002 | −0.018 | −0.026, −0.019 | −12.128 | 0.000 | ||||
| Fish intake | −0.099 | 0.003 | −0.044 | −0.106, −0.093 | −30.318 | 0.000 | ||||
| Unprocessed red meat intake | −0.090 | 0.003 | −0.050 | −0.096, −0.085 | −32.254 | 0.000 | ||||
| Processed meat intake | 0.068 | 0.005 | 0.023 | 0.059, 0.078 | 14.496 | 0.000 | ||||
| 2 | 0.033 | 0.033 | 0.034 | |||||||
| (Constant) | 6.894 | 0.042 | 6.812, 6.976 | 164.757 | 0.000 | |||||
| Age | −0.040 | 0.001 | −0.100 | −0.041, −0.039 | −69.194 | 0.000 | ||||
| Sex (F = 0/M = 1) | −0.882 | 0.010 | −0.137 | −0.901, −0.863 | −92.381 | 0.000 | ||||
| BMI | 0.018 | 0.001 | 0.027 | 0.016, 0.020 | 18.652 | 0.000 | ||||
| Vegetable intake | −0.014 | 0.001 | −0.015 | −0.017, −0.011 | −9.999 | 0.000 | ||||
| Fruit intake | −0.021 | 0.002 | −0.017 | −0.025, −0.018 | −11.512 | 0.000 | ||||
| Fish intake | −0.074 | 0.003 | −0.033 | −0.081, −0.068 | −22.832 | 0.000 | ||||
| Unprocessed red meat intake | −0.070 | 0.003 | −0.039 | −0.076, −0.065 | −25.315 | 0.000 | ||||
| Processed meat intake | 0.157 | 0.005 | 0.052 | 0.148, 0.167 | 32.674 | 0.000 | ||||
| 3 | 0.083 | 0.083 | 0.090 | |||||||
| (Constant) | 9.83 | 0.045 | 9.743, 9.918 | 220.24 | 0.000 | |||||
| Age | −0.047 | 0.001 | −0.118 | −0.048, −0.046 | −83.429 | 0.000 | 0.010 | 0.010 | 0.010 | |
| Sex (F = 0/M = 1) | −0.917 | 0.009 | −0.142 | −0.935, −0.899 | −98.573 | 0.000 | 0.017 | 0.017 | 0.017 | |
| BMI | −0.007 | 0.001 | −0.011 | −0.009, −0.005 | −7.536 | 0.000 | 0.001 | 0.001 | 0.0006 | |
| Healthy Sleep Score | −0.663 | 0.004 | −0.227 | −0.671, −0.655 | −161.385 | 0.000 | 0.049 | 0.049 | 0.0520 | |
| Vegetable intake | −0.013 | 0.001 | −0.013 | −0.015, −0.010 | -9.126 | 0.000 | 0.001 | 0.001 | 0.0006 | |
| Fruit intake | −0.014 | 0.002 | −0.011 | −0.017, −0.010 | −7.675 | 0.000 | 0.000 | 0.000 | 0.0004 | |
| Fish intake | −0.057 | 0.003 | −0.025 | −0.063, −0.051 | −17.913 | 0.000 | 0.002 | 0.002 | 0.0022 | |
| Unprocessed red meat intake | −0.068 | 0.003 | −0.037 | −0.073, −0.063 | −25.084 | 0.000 | 0.002 | 0.002 | 0.0017 | |
| Processed meat intake | 0.122 | 0.005 | 0.040 | 0.113, 0.131 | 26.053 | 0.000 | 0.000 | 0.000 | 0.0004 | |
| 4 | 0.003 | 0.002 | 0.002 | |||||||
| (Constant) | 4.067 | 0.013 | 4.042, 4.093 | 313.881 | 0.000 | |||||
| Tea intake | 0.056 | 0.002 | 0.050 | 0.053, 0.060 | 31.025 | 0.000 | ||||
| Coffee intake | 0.027 | 0.002 | 0.017 | 0.022, 0.032 | 10.826 | 0.000 | ||||
| Water intake | 0.031 | 0.002 | 0.021 | 0.026, 0.035 | 13.665 | 0.000 | ||||
| 5 | 0.031 | 0.031 | 0.032 | |||||||
| (Constant) | 6.514 | 0.045 | 6.425, 6.603 | 143.367 | 0.000 | |||||
| Age | −0.046 | 0.001 | −0.115 | −0.047, −0.045 | −74.978 | 0.000 | ||||
| Sex (F = 0/M = 1) | −0.811 | 0.010 | −0.125 | −0.830, −0.791 | −81.347 | 0.000 | ||||
| BMI | 0.021 | 0.001 | 0.031 | 0.019, 0.023 | 20.060 | 0.000 | ||||
| Tea intake | 0.065 | 0.002 | 0.058 | 0.061, 0.068 | 36.147 | 0.000 | ||||
| Coffee intake | 0.037 | 0.002 | 0.024 | 0.032, 0.042 | 15.189 | 0.000 | ||||
| Water intake | -0.009 | 0.002 | −0.006 | −0.013, −0.004 | −3.821 | 0.000 | ||||
| 6 | 0.083 | 0.082 | 0.089 | |||||||
| (Constant) | 9.529 | 0.048 | 9.434, 9.624 | 196.818 | 0.000 | |||||
| Age | −0.051 | 0.001 | −0.130 | −0.053, −0.050 | −86.456 | 0.000 | 0.013 | 0.013 | 0.013 | |
| Sex (F = 0/M = 1) | −0.870 | 0.010 | −0.134 | −0.889, −0.851 | −89.587 | 0.000 | 0.015 | 0.015 | 0.015 | |
| BMI | −0.006 | 0.001 | −0.009 | −0.008, −0.004 | −5.818 | 0.000 | 0.001 | 0.001 | 0.0009 | |
| Healthy sleep score | −0.674 | 0.004 | −0.231 | −0.682, −0.665 | −152.841 | 0.000 | 0.051 | 0.051 | 0.054 | |
| Tea intake | 0.057 | 0.002 | 0.051 | 0.054, 0.061 | 32.762 | 0.000 | 0.002 | 0.002 | 0.001 | |
| Coffee intake | 0.027 | 0.002 | 0.018 | 0.022, 0.032 | 11.295 | 0.000 | 0.000 | 0.000 | 0.0001 | |
| Water intake | −0.007 | 0.002 | −0.005 | −0.011, −0.003 | −3.114 | 0.002 | 0.000 | 0.000 | 0.0004 |
Publisher’s Note: MDPI stays neutral with regard to jurisdictional claims in published maps and institutional affiliations. |
© 2021 by the authors. Licensee MDPI, Basel, Switzerland. This article is an open access article distributed under the terms and conditions of the Creative Commons Attribution (CC BY) license (https://creativecommons.org/licenses/by/4.0/).
Share and Cite
Hepsomali, P.; Groeger, J.A. Diet, Sleep, and Mental Health: Insights from the UK Biobank Study. Nutrients 2021, 13, 2573. https://doi.org/10.3390/nu13082573
Hepsomali P, Groeger JA. Diet, Sleep, and Mental Health: Insights from the UK Biobank Study. Nutrients. 2021; 13(8):2573. https://doi.org/10.3390/nu13082573
Chicago/Turabian StyleHepsomali, Piril, and John A. Groeger. 2021. "Diet, Sleep, and Mental Health: Insights from the UK Biobank Study" Nutrients 13, no. 8: 2573. https://doi.org/10.3390/nu13082573
APA StyleHepsomali, P., & Groeger, J. A. (2021). Diet, Sleep, and Mental Health: Insights from the UK Biobank Study. Nutrients, 13(8), 2573. https://doi.org/10.3390/nu13082573