
Investigation of the Relationship between the Mid_Thigh Adipose Tissue Distribution Measured by MRI and Serum Osteocalcin—A Sex-Based Approach

 , , ,
, , ,  and
and
Abstract
:1. Introduction
2. Materials and Methods
2.1. Subjects
2.2. Magnetic Resonance Imaging (MRI)
2.3. Image Processing
2.4. Laboratory Analysis
2.5. Statistics
3. Results
3.1. Serum and Anthropometric Parameters
3.2. Associations of Serum Osteocalcin Are Male-Related
4. Discussion
5. Conclusions
Author Contributions
Funding
Institutional Review Board Statement
Informed Consent Statement
Data Availability Statement
Conflicts of Interest
References
- Scuteri, A.; Laurent, S.; Cucca, F.; Cockcroft, J.; Cunha, P.G.; Manas, L.R.; Mattace Raso, F.U.; Muiesan, M.L.; Ryliskyte, L.; Rietzschel, E.; et al. Metabolic syndrome across Europe: Different clusters of risk factors. Eur. J. Prev. Cardiol. 2015, 22, 486–491. [Google Scholar] [CrossRef] [PubMed] [Green Version]
- O’Neill, S.; O’Driscoll, L. Metabolic syndrome: A closer look at the growing epidemic and its associated pathologies. Obes. Rev. 2015, 16, 1–12. [Google Scholar] [CrossRef] [PubMed] [Green Version]
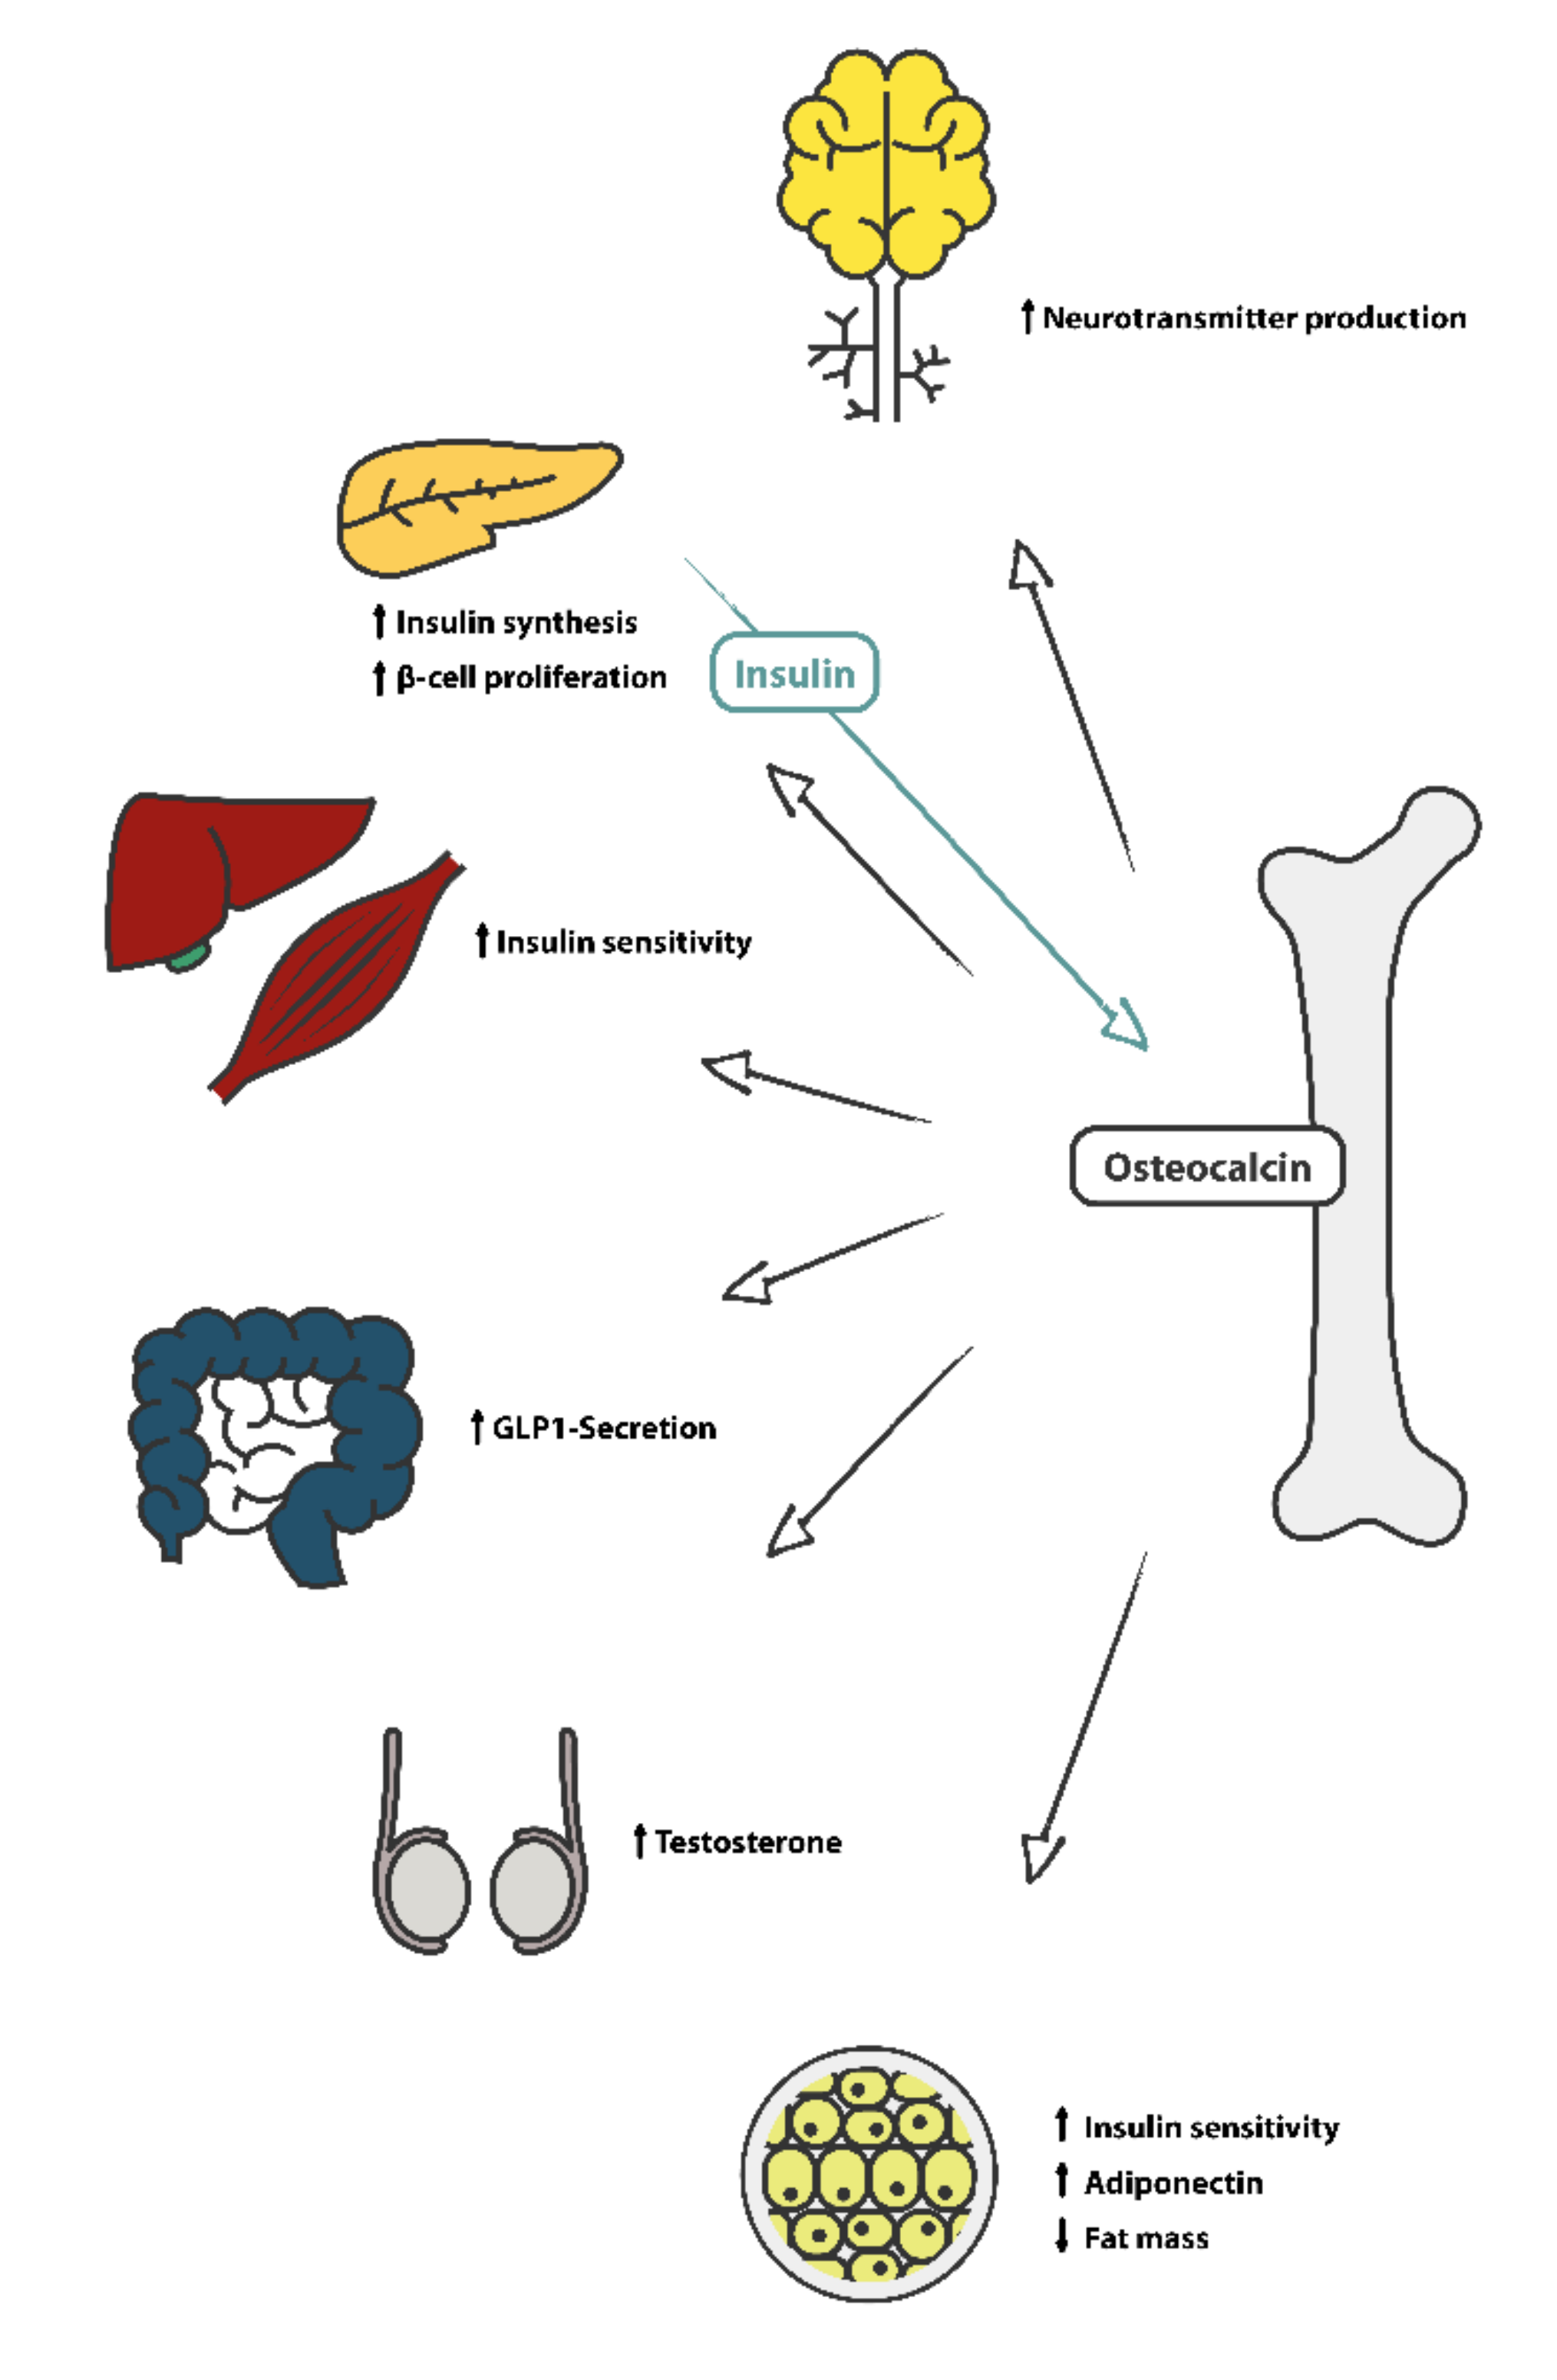
- Ferron, M.; Lacombe, J. Regulation of energy metabolism by the skeleton: Osteocalcin and beyond. Arch. Biochem. Biophys. 2014, 561, 137–146. [Google Scholar] [CrossRef] [PubMed]
- Lee, N.K.; Sowa, H.; Hinoi, E.; Ferron, M.; Ahn, J.D.; Confavreux, C.; Dacquin, R.; Mee, P.J.; McKee, M.D.; Jung, D.Y.; et al. Endocrine regulation of energy metabolism by the skeleton. Cell 2007, 130, 456–469. [Google Scholar] [CrossRef] [Green Version]
- Schwetz, V.; Pieber, T.; Obermayer-Pietsch, B. The endocrine role of the skeleton: Background and clinical evidence. Eur. J. Endocrinol. 2012, 166, 959–967. [Google Scholar] [CrossRef] [Green Version]
- Shimada, T.; Yamazaki, Y.; Takahashi, M.; Hasegawa, H.; Urakawa, I.; Oshima, T.; Ono, K.; Kakitani, M.; Tomizuka, K.; Fujita, T.; et al. Vitamin D receptor-independent FGF23 actions in regulating phosphate and vitamin D metabolism. Am. J. Physiol. Ren. Physiol. 2005, 289, F1088–1095. [Google Scholar] [CrossRef]
- Mizokami, A.; Kawakubo-Yasukochi, T.; Hirata, M. Osteocalcin and its endocrine functions. Biochem. Pharm. 2017, 132, 1–8. [Google Scholar] [CrossRef]
- Mizokami, A.; Mukai, S.; Gao, J.; Kawakubo-Yasukochi, T.; Otani, T.; Takeuchi, H.; Jimi, E.; Hirata, M. GLP-1 signaling is required for improvement of glucose tolerance by osteocalcin. J. Endocrinol. 2020, 244, 285–296. [Google Scholar] [CrossRef]
- Oury, F.; Sumara, G.; Sumara, O.; Ferron, M.; Chang, H.; Smith, C.E.; Hermo, L.; Suarez, S.; Roth, B.L.; Ducy, P.; et al. Endocrine regulation of male fertility by the skeleton. Cell 2011, 144, 796–809. [Google Scholar] [CrossRef] [Green Version]
- Mohammad Rahimi, G.R.; Niyazi, A.; Alaee, S. The effect of exercise training on osteocalcin, adipocytokines, and insulin resistance: A systematic review and meta-analysis of randomized controlled trials. Osteoporos. Int. 2021, 32, 213–224. [Google Scholar] [CrossRef]
- Zhang, Y.; Zhou, P.; Kimondo, J.W. Adiponectin and osteocalcin: Relation to insulin sensitivity. Biochem. Cell Biol. 2012, 90, 613–620. [Google Scholar] [CrossRef]
- Sabek, O.M.; Nishimoto, S.K.; Fraga, D.; Tejpal, N.; Ricordi, C.; Gaber, A.O. Osteocalcin Effect on Human β-Cells Mass and Function. Endocrinology 2015, 156, 3137–3146. [Google Scholar] [CrossRef] [Green Version]
- Guedes, J.A.C.; Esteves, J.V.; Morais, M.R.; Zorn, T.M.; Furuya, D.T. Osteocalcin improves insulin resistance and inflammation in obese mice: Participation of white adipose tissue and bone. Bone 2018, 115, 68–82. [Google Scholar] [CrossRef]
- Mera, P.; Laue, K.; Wei, J.; Berger, J.M.; Karsenty, G. Osteocalcin is necessary and sufficient to maintain muscle mass in older mice. Mol. Metab. 2016, 5, 1042–1047. [Google Scholar] [CrossRef]
- Boettcher, M.; Machann, J.; Stefan, N.; Thamer, C.; Haring, H.U.; Claussen, C.D.; Fritsche, A.; Schick, F. Intermuscular adipose tissue (IMAT): Association with other adipose tissue compartments and insulin sensitivity. J. Magn. Reson Imaging 2009, 29, 1340–1345. [Google Scholar] [CrossRef]
- Gallagher, D.; Kuznia, P.; Heshka, S.; Albu, J.; Heymsfield, S.B.; Goodpaster, B.; Visser, M.; Harris, T.B. Adipose tissue in muscle: A novel depot similar in size to visceral adipose tissue. Am. J. Clin. Nutr. 2005, 81, 903–910. [Google Scholar] [CrossRef] [Green Version]
- Yim, J.E.; Heshka, S.; Albu, J.; Heymsfield, S.; Kuznia, P.; Harris, T.; Gallagher, D. Intermuscular adipose tissue rivals visceral adipose tissue in independent associations with cardiovascular risk. Int. J. Obes. 2007, 31, 1400–1405. [Google Scholar] [CrossRef] [Green Version]
- Bergia, R.E., 3rd; Kim, J.E.; Campbell, W.W. Differential Relationship between Intermuscular Adipose Depots with Indices of Cardiometabolic Health. Int. J. Endocrinol. 2018, 2018, 2751250. [Google Scholar] [CrossRef] [Green Version]
- Goodpaster, B.H.; Krishnaswami, S.; Harris, T.B.; Katsiaras, A.; Kritchevsky, S.B.; Simonsick, E.M.; Nevitt, M.; Holvoet, P.; Newman, A.B. Obesity, regional body fat distribution, and the metabolic syndrome in older men and women. Arch. Intern. Med. 2005, 165, 777–783. [Google Scholar] [CrossRef] [Green Version]
- Hassler, E.M.; Deutschmann, H.; Almer, G.; Renner, W.; Mangge, H.; Herrmann, M.; Leber, S.; Michenthaler, M.; Staszewski, A.; Gunzer, F.; et al. Distribution of subcutaneous and intermuscular fatty tissue of the mid-thigh measured by MRI-A putative indicator of serum adiponectin level and individual factors of cardio-metabolic risk. PLoS ONE 2021, 16, e0259952. [Google Scholar] [CrossRef]
- Yanai, H.; Yoshida, H. Beneficial Effects of Adiponectin on Glucose and Lipid Metabolism and Atherosclerotic Progression: Mechanisms and Perspectives. Int. J. Mol. Sci. 2019, 20, 1190. [Google Scholar] [CrossRef] [Green Version]
- Mercuri, E.; Cini, C.; Pichiecchio, A.; Allsop, J.; Counsell, S.; Zolkipli, Z.; Messina, S.; Kinali, M.; Brown, S.C.; Jimenez, C.; et al. Muscle magnetic resonance imaging in patients with congenital muscular dystrophy and Ullrich phenotype. Neuromuscul. Disord. 2003, 13, 554–558. [Google Scholar] [CrossRef]
- Feng, X.; Luo, S.; Li, J.; Yue, D.; Xi, J.; Zhu, W.; Gao, X.; Guan, X.; Lu, J.; Liang, Z.; et al. Fatty infiltration evaluation and selective pattern characterization of lower limbs in limb-girdle muscular dystrophy type 2A by muscle magnetic resonance imaging. Muscle Nerve 2018, 58, 536–541. [Google Scholar] [CrossRef]
- Distefano, G.; Goodpaster, B.H. Effects of Exercise and Aging on Skeletal Muscle. Cold Spring Harb. Perspect. Med. 2018, 8, 119–128. [Google Scholar] [CrossRef] [Green Version]
- Giallauria, F.; Cittadini, A.; Smart, N.A.; Vigorito, C. Resistance training and sarcopenia. Monaldi Arch. Chest Dis. 2016, 84, 738. [Google Scholar] [CrossRef] [Green Version]
- Dixon, W.T. Simple proton spectroscopic imaging. Radiology 1984, 153, 189–194. [Google Scholar] [CrossRef]
- Muller, W.; Lohman, T.G.; Stewart, A.D.; Maughan, R.J.; Meyer, N.L.; Sardinha, L.B.; Kirihennedige, N.; Reguant-Closa, A.; Risoul-Salas, V.; Sundgot-Borgen, J.; et al. Subcutaneous fat patterning in athletes: Selection of appropriate sites and standardisation of a novel ultrasound measurement technique: Ad hoc working group on body composition, health and performance, under the auspices of the IOC Medical Commission. Br. J. Sports Med. 2016, 50, 45–54. [Google Scholar] [CrossRef] [Green Version]
- Schindelin, J.; Arganda-Carreras, I.; Frise, E.; Kaynig, V.; Longair, M.; Pietzsch, T.; Preibisch, S.; Rueden, C.; Saalfeld, S.; Schmid, B.; et al. Fiji: An open-source platform for biological-image analysis. Nat. Methods 2012, 9, 676–682. [Google Scholar] [CrossRef] [Green Version]
- Sachs, S.; Zarini, S.; Kahn, D.E.; Harrison, K.A.; Perreault, L.; Phang, T.; Newsom, S.A.; Strauss, A.; Kerege, A.; Schoen, J.A.; et al. Intermuscular adipose tissue directly modulates skeletal muscle insulin sensitivity in humans. Am. J. Physiol. Endocrinol. Metab. 2019, 316, E866–E879. [Google Scholar] [CrossRef] [Green Version]
- Foresta, C.; Strapazzon, G.; De Toni, L.; Gianesello, L.; Calcagno, A.; Pilon, C.; Plebani, M.; Vettor, R. Evidence for osteocalcin production by adipose tissue and its role in human metabolism. J. Clin. Endocrinol. Metab. 2010, 95, 3502–3506. [Google Scholar] [CrossRef] [Green Version]
- Bador, K.M.; Wee, L.D.; Halim, S.A.A.; Fadi, M.F.M.; Santhiran, P.; Rosli, N.F.; Mustafa, N. Serum osteocalcin in subjects with metabolic syndrome and central obesity. Diabetes Metab. Syndr. Clin. Res. Rev. 2016, 10, S42–S45. [Google Scholar] [CrossRef] [PubMed]
- Buday, B.; Pach, P.; Nagy, B.; Vitai, M.; Vecsei, Z.; Korányi, L. Serum osteocalcin is associated with improved metabolic state via adiponectin in females versus testosterone in males. Gender specific nature of the bone–energy homeostasis axis. Bone 2013, 57, 98–104. [Google Scholar] [CrossRef] [PubMed]
- Araneta, M.R.G.; von Mühlen, D.; Barrett-Connor, E. Sex differences in the association between adiponectin and BMD, bone loss, and fractures: The Rancho Bernardo study. J. Bone Miner. Res. 2009, 24, 2016–2022. [Google Scholar] [CrossRef] [PubMed] [Green Version]
- Del Pino, J.; Martín-Gómez, E.; Martín-Rodríguez, M.; López-Sosa, C.; Cordero, M.; Lanchares, J.L.; García-Talavera, J.R. Influence of sex, age, and menopause in serum osteocalcin (BGP) levels. Klin. Wochenschr. 1991, 69, 1135–1138. [Google Scholar] [CrossRef]
- Khwanchuea, R.; Punsawad, C. Sex differences in the relationship between body composition and biomarkers of bone and fat metabolism in obese boys and girls. Bone Rep. 2021, 14, 101087. [Google Scholar] [CrossRef]
- Dušková, M.; Kolátorová, L.; Jandíková, H.; Pospíšilová, H.; Stárka, L. Are there sex differences in the reaction of undercarboxylated osteocalcin to hypoglycemia? Physiol. Res. 2020, 69, S315–S320. [Google Scholar] [CrossRef]
- Diemar, S.S.; Mollehave, L.T.; Quardon, N.; Lylloff, L.; Thuesen, B.H.; Linneberg, A.; Jorgensen, N.R. Effects of age and sex on osteocalcin and bone-specific alkaline phosphatase-reference intervals and confounders for two bone formation markers. Arch. Osteoporos 2020, 15, 26. [Google Scholar] [CrossRef]
- Lukacs, J.L.; Booth, S.; Kleerekoper, M.; Ansbacher, R.; Rock, C.L.; Reame, N.E. Differential associations for menopause and age in measures of vitamin K, osteocalcin, and bone density: A cross-sectional exploratory study in healthy volunteers. Menopause 2006, 13, 799–808. [Google Scholar] [CrossRef]
- Mohammad Rahimi, G.R.; Bijeh, N.; Rashidlamir, A. Effects of exercise training on serum preptin, undercarboxylated osteocalcin and high molecular weight adiponectin in adults with metabolic syndrome. Exp. Physiol. 2020, 105, 449–459. [Google Scholar] [CrossRef]
- Dieli-Conwright, C.M.; Courneya, K.S.; Demark-Wahnefried, W.; Sami, N.; Lee, K.; Sweeney, F.C.; Stewart, C.; Buchanan, T.A.; Spicer, D.; Tripathy, D.; et al. Aerobic and resistance exercise improves physical fitness, bone health, and quality of life in overweight and obese breast cancer survivors: A randomized controlled trial. Breast Cancer Res. 2018, 20, 124. [Google Scholar] [CrossRef]
- Armamento-Villareal, R.; Aguirre, L.; Waters, D.L.; Napoli, N.; Qualls, C.; Villareal, D.T. Effect of Aerobic or Resistance Exercise, or Both, on Bone Mineral Density and Bone Metabolism in Obese Older Adults While Dieting: A Randomized Controlled Trial. J. Bone Min. Res. 2020, 35, 430–439. [Google Scholar] [CrossRef]
- Schmitz, K.H.; Courneya, K.S.; Matthews, C.; Demark-Wahnefried, W.; Galvão, D.A.; Pinto, B.M.; Irwin, M.L.; Wolin, K.Y.; Segal, R.J.; Lucia, A.; et al. American College of Sports Medicine Roundtable on Exercise Guidelines for Cancer Survivors. Med. Sci. Sports Exerc. 2010, 42, 1409–1426. [Google Scholar] [CrossRef]
- Gonzalez-Gil, A.M.; Elizondo-Montemayor, L. The Role of Exercise in the Interplay between Myokines, Hepatokines, Osteokines, Adipokines, and Modulation of Inflammation for Energy Substrate Redistribution and Fat Mass Loss: A Review. Nutrients 2020, 12, 1899. [Google Scholar] [CrossRef]
- Hiam, D.; Landen, S.; Jacques, M.; Voisin, S.; Alvarez-Romero, J.; Byrnes, E.; Chubb, P.; Levinger, I.; Eynon, N. Osteocalcin and its forms respond similarly to exercise in males and females. Bone 2021, 144, 115818. [Google Scholar] [CrossRef]
- Yang, D.; Yang, Y.; Li, Y.; Han, R. Physical Exercise as Therapy for Type 2 Diabetes Mellitus: From Mechanism to Orientation. Ann. Nutr. Metab. 2019, 74, 313–321. [Google Scholar] [CrossRef]
- Curtis, E.; Litwic, A.; Cooper, C.; Dennison, E. Determinants of Muscle and Bone Aging. J. Cell. Physiol. 2015, 230, 2618–2625. [Google Scholar] [CrossRef] [Green Version]
- Wu, R.; Delahunt, E.; Ditroilo, M.; Lowery, M.; De Vito, G. Effects of age and sex on neuromuscular-mechanical determinants of muscle strength. Age 2016, 38, 57. [Google Scholar] [CrossRef] [Green Version]
- Winters-Stone, K.M.; Snow, C.M. Site-specific response of bone to exercise in premenopausal women. Bone 2006, 39, 1203–1209. [Google Scholar] [CrossRef]
- Winters-Stone, K.M.; Dobek, J.; Nail, L.; Bennett, J.A.; Leo, M.C.; Naik, A.; Schwartz, A. Strength training stops bone loss and builds muscle in postmenopausal breast cancer survivors: A randomized, controlled trial. Breast Cancer Res. Treat. 2011, 127, 447–456. [Google Scholar] [CrossRef] [Green Version]
- Chan, H.; Lunt, H.; Thompson, H.; Heenan, H.F.; Frampton, C.M.A.; Florkowski, C.M. Plasma glucose measurement in diabetes: Impact and implications of variations in sample collection procedures with a focus on the first hour after sample collection. Clin. Chem. Lab. Med. 2014, 52, 1061–1068. [Google Scholar] [CrossRef]


| Anthropometric Measurements | Total (n = 128) | Female (n = 65) | Male (n = 63) | p-Value |
|---|---|---|---|---|
| Age (years) | 44.10 ± 11.13 | 46.12 ± 10.35 | 43.01 ± 11.59 | 0.090 |
| BMI kg/m2) | 23.87 ± 3.09 | 23.09 ± 3.35 | 24.67 ± 2.59 | 0.004 ** |
| Waist circumference (cm) | 82.34 ± 10.38 | 77.38 ± 9.41 | 87.46 ± 8.77 | 0.000 *** |
| Hip circumference (cm) | 100.01 ± 7.46 | 98.69 ± 8.12 | 101.37 ± 6.51 | 0.004 ** |
| Waist/hip ratio | 0.82 ± 0.08 | 0.78 ± 0.06 | 0.86 ± 0.07 | 0.000 *** |
| Waist/height ratio | 0.47 ± 0.05 | 0.46 ± 0.06 | 0.48 ± 0.05 | 0.030 * |
| Compartments and ratios | ||||
| Muscle cross-sectional area (cm2) | 282.60 ± 68.29 | 230.67 ± 29.13 | 336.18 ± 54.15 | 0.000 *** |
| SAT (cm2) | 5604.35 ± 2968.11 | 7542.11 ± 2740.52 | 3605.08 ± 1514.83 | 0.000 *** |
| IMAT (cm2) | 789.20 ± 524.67 | 1002.85 ± 598.84 | 568.76 ± 310.59 | 0.000 *** |
| SAT/(SAT + IMAT) | 0.88 ± 0.05 | 0.88 ± 0.05 | 0.87 ± 0.05 | 0.050 |
| MA/IMAT | 31.86 ± 42.61 | 16.58 ± 10.82 | 47.63 ± 55.68 | 0.000 *** |
| Laboratory measurements | ||||
| Osteocalcin (mg/dL) | 7.81 ± 3.24 | 6.98 ± 3.07 | 8.66 ± 3.22 | 0.002 ** |
| Insulin (µlU/mL) | 8.30 ± 11.10 | 8.04 ± 11.36 | 8.90 ± 11.00 | 0.120 |
| Lipid profile | ||||
| Total blood cholesterol (mg/dL) | 194.13 ± 33.57 | 200.18 ± 30.23 | 187.87 ± 35.86 | 0.040 * |
| HDL (mg/dL) | 69.24 ± 17.53 | 75.40 ± 18.37 | 62.89 ± 14.16 | 0.000 *** |
| LDL (mg/dL) | 102.90 ± 31.45 | 102.81 ± 29.80 | 102.60 ± 34.39 | 0.970 |
| Triglycerides (mg/dL) | 112.13 ± 89.74 | 111.77 ± 107.48 | 112.49 ± 67.61 | 0.960 |
| Adiponectin (µg/mL) | 11.31 ± 4.12 | 12.36 ± 4.64 | 10.23 ± 3.21 | 0.003 ** |
| Sport profile | ||||
| Endurance (min/w) | 236.52 ± 400.65 | 200.52 ± 436.03 | 273.67 ± 360.27 | 0.030 * |
| Resistance (min/w) | 83.45 ± 103.38 | 64.46 ± 85.81 | 103.05 ± 116.28 | 0.002 ** |
| Features | Sex | Osteocalcin (mg/dL) | p-Value | MA (cm2) | p-Value |
|---|---|---|---|---|---|
| Age | Female | 0.19 | 0.138 | −0.18 | 0.152 |
| Male | −0.31 | 0.014 * | −0.32 | 0.000 *** | |
| SAT/(SAT + IMAT) | Female | 0.12 | 0.343 | 0.21 | 0.100 |
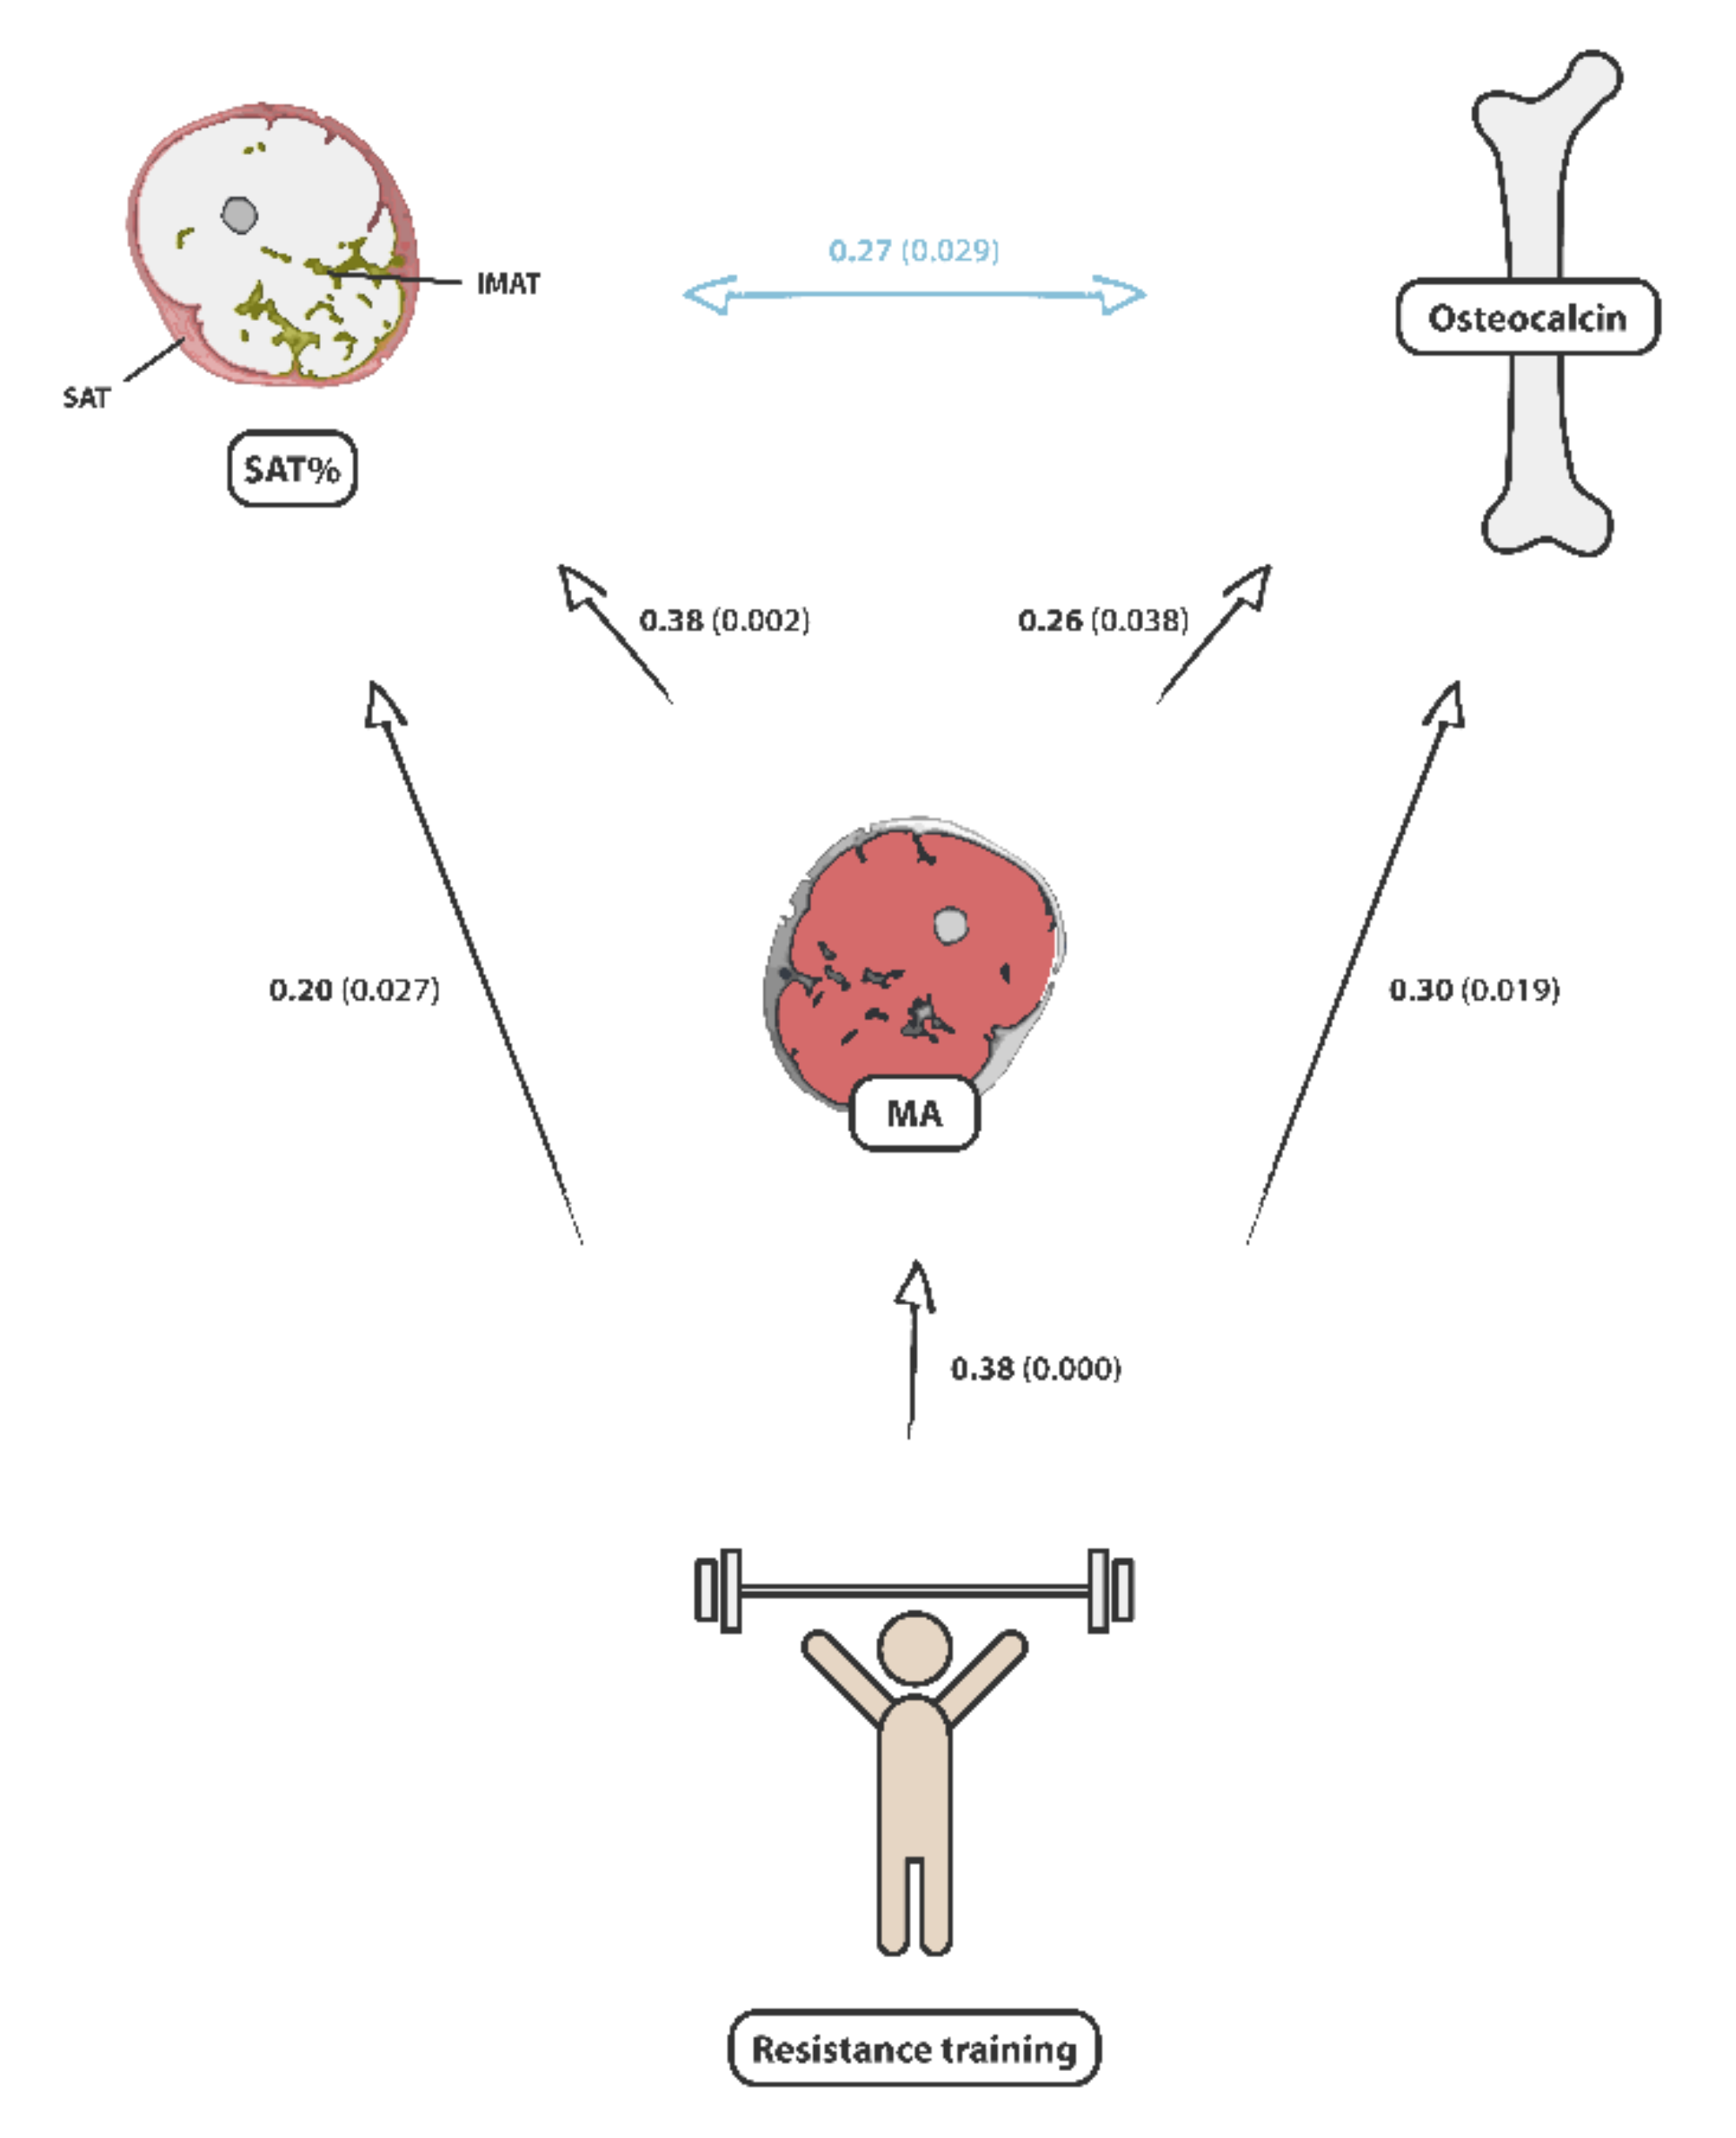
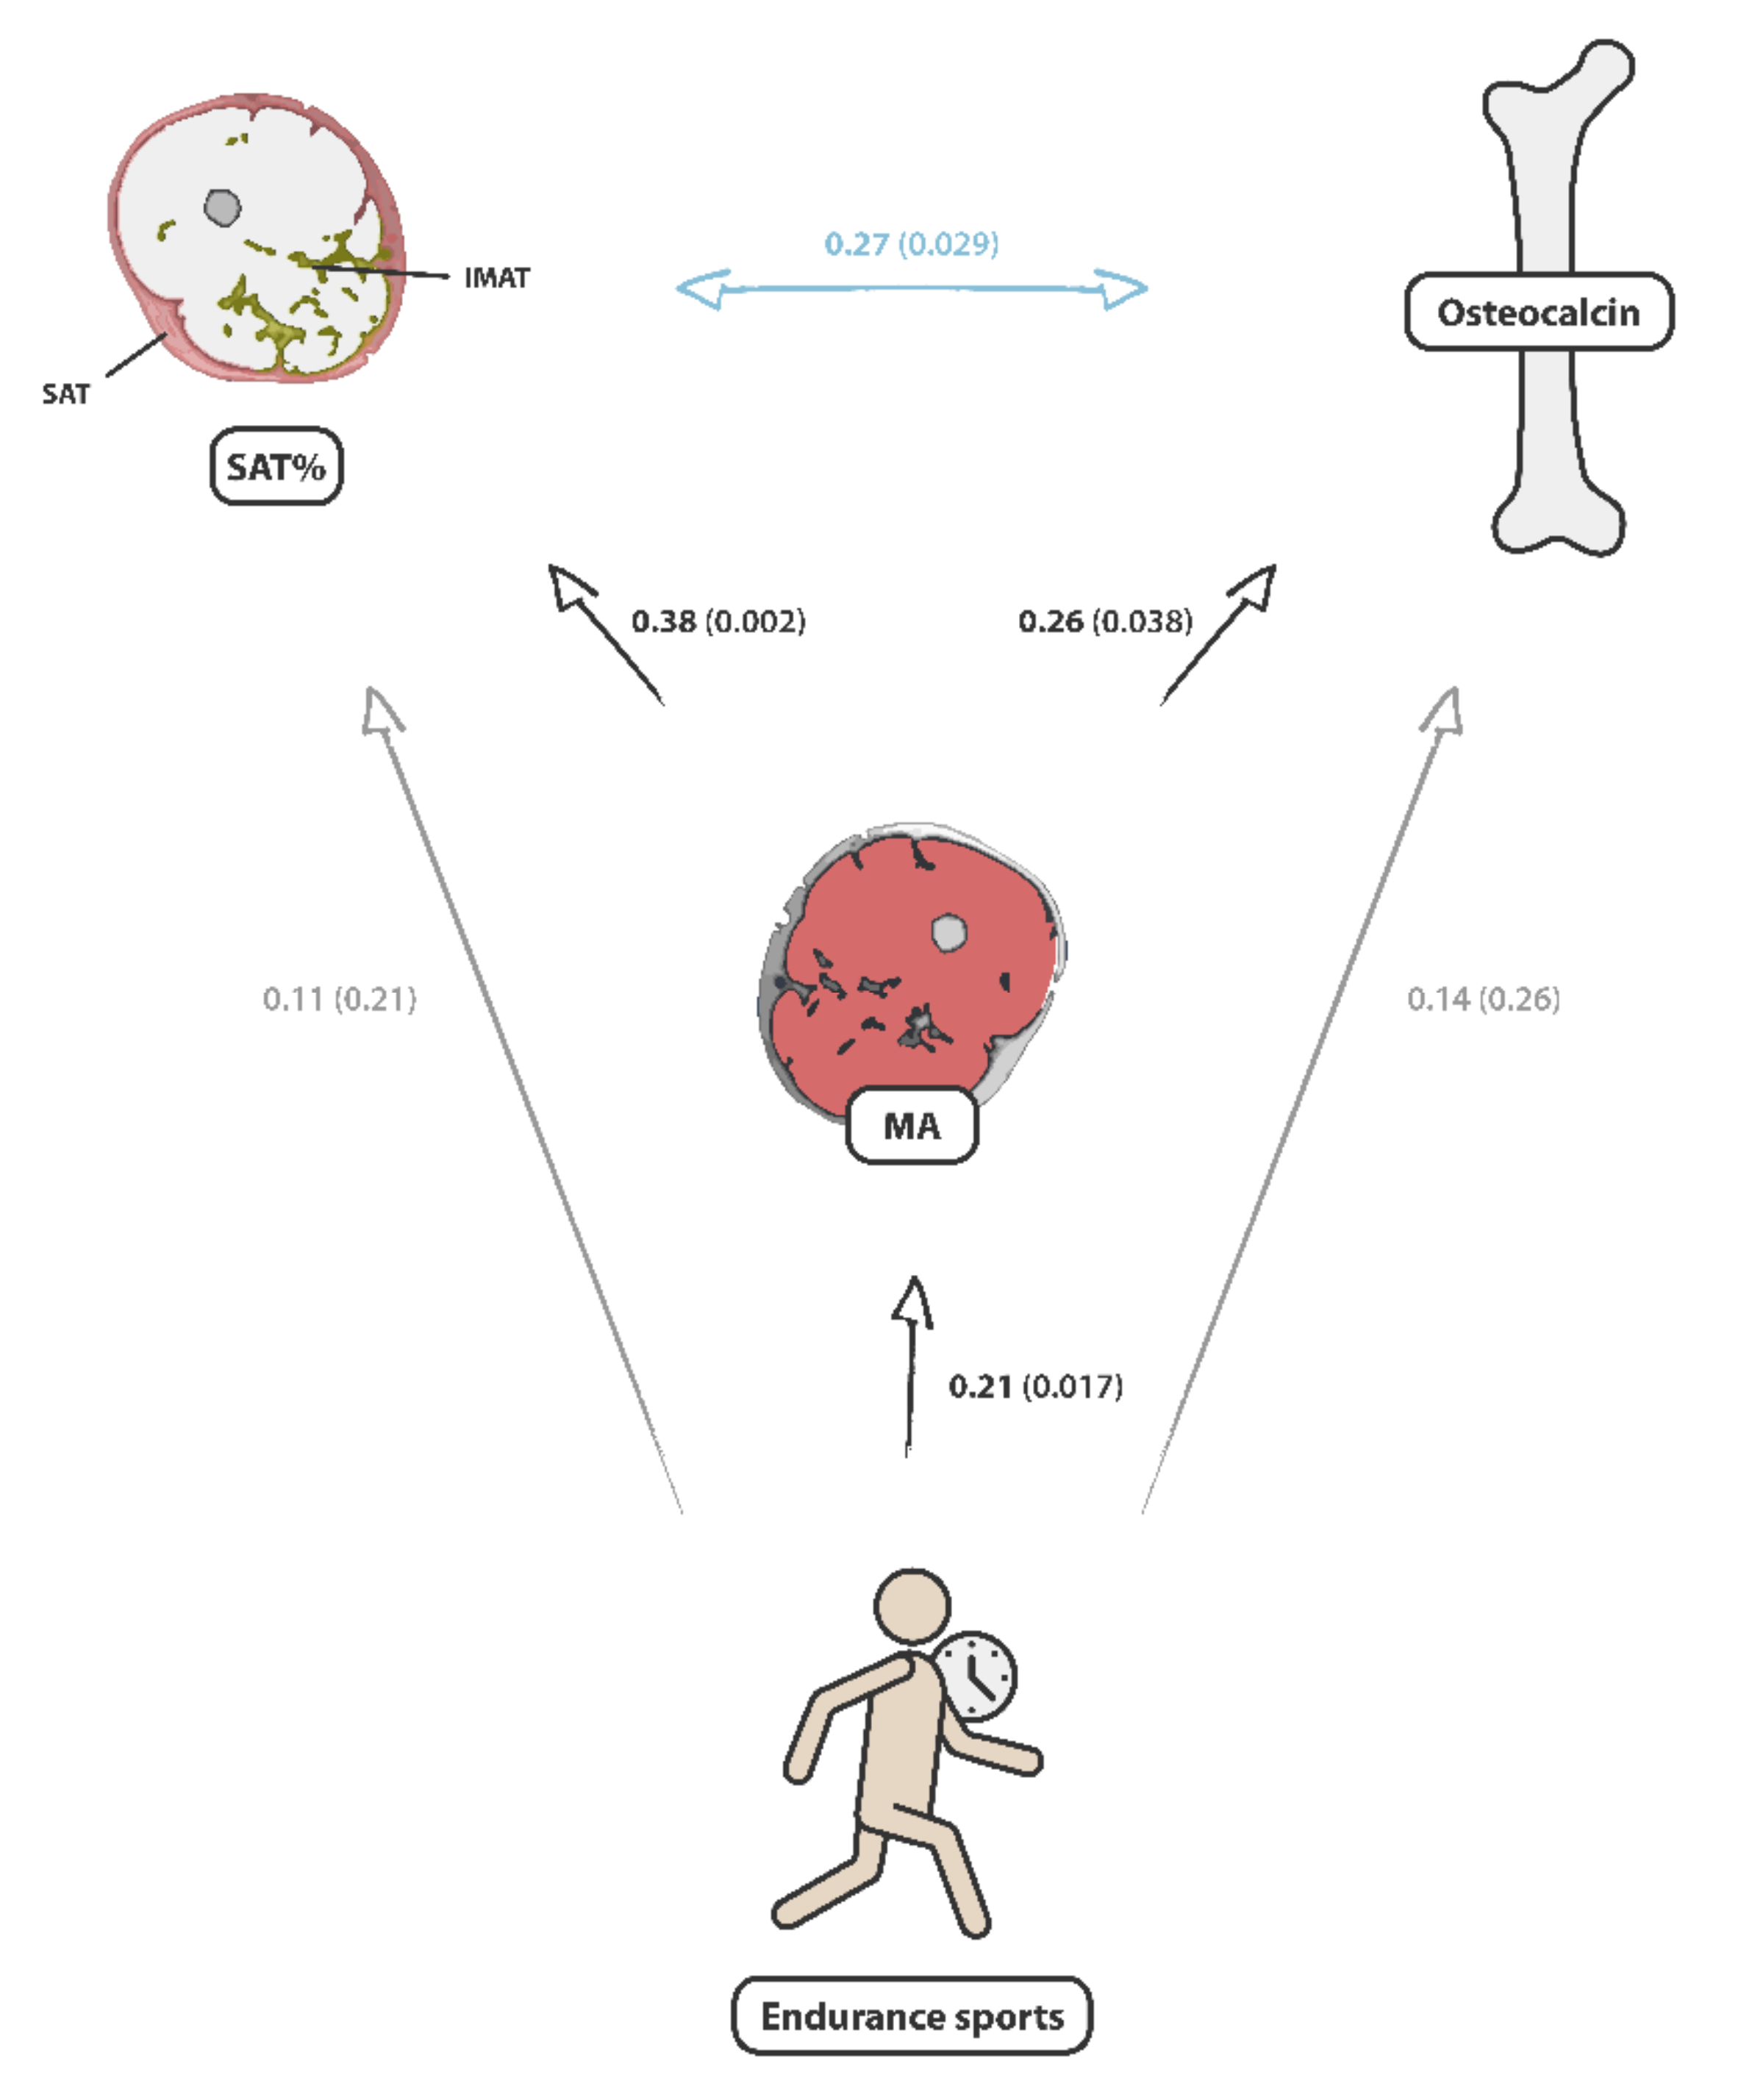
| Male | 0.27 | 0.029 * | 0.38 | 0.002 ** | |
| IMAT/(SAT + IMAT) | Female | −0.12 | 0.343 | −0.21 | 0.100 |
| Male | −0.27 | 0.029 * | −0.38 | 0.002 ** | |
| MA/IMAT | Female | 0.04 | 0.729 | ||
| Male | 0.23 | 0.075 | |||
| MA/(IMAT + MA) | Female | 0.10 | 0.427 | ||
| Male | 0.21 | 0.097 | |||
| Muscle cross-sectional area (cm2) | Female | −0.09 | 0.486 | ||
| Male | 0.26 | 0.038 * | |||
| Strength training (min/w) | Female | −0.08 | 0.519 | 0.24 | 0.059 |
| Male | 0.30 | 0.019 * | 0.38 | 0.000 *** | |
| Endurance sports (min/w) | Female | −0.00 | 0.983 | 0.23 | 0.065 |
| Male | 0.14 | 0.259 | 0.21 | 0.017 * | |
| Insulin (µlU/mL) | Female | 0.16 | 0.218 | −0.02 | 0.375 |
| Male | −0.32 | 0.010 * | −0.28 | 0.033 * | |
| Adiponectin (µg/mL) | Female | −0.17 | 0.893 | −0.09 | 0.482 |
| Male | 0.06 | 0.647 | −0.08 | 0.552 | |
| Total blood cholersterol (mg/dL) | Female | −0.08 | 0.523 | −0.11 | 0.381 |
| Male | −0.16 | 0.203 | −0.04 | 0.751 | |
| HDL (mg/dL) | Female | −0.13 | 0.308 | −0.05 | 0.681 |
| Male | 0.03 | 0.835 | 0.01 | 0.951 | |
| LDL (mg/dL) | Female | 0.20 | 0.124 | −0.07 | 0.599 |
| Male | −0.09 | 0.491 | −0.01 | 0.927 | |
| Triglycerides (mg/dL) | Female | −0.03 | 0.217 | −0.05 | 0.664 |
| Male | 0.24 | 0.062 | −0.10 | 0.436 |
Publisher’s Note: MDPI stays neutral with regard to jurisdictional claims in published maps and institutional affiliations. |
© 2021 by the authors. Licensee MDPI, Basel, Switzerland. This article is an open access article distributed under the terms and conditions of the Creative Commons Attribution (CC BY) license (https://creativecommons.org/licenses/by/4.0/).
Share and Cite
Hassler, E.; Almer, G.; Reishofer, G.; Deutschmann, H.; Renner, W.; Herrmann, M.; Leber, S.; Staszewski, A.; Gunzer, F.; Mangge, H. Investigation of the Relationship between the Mid_Thigh Adipose Tissue Distribution Measured by MRI and Serum Osteocalcin—A Sex-Based Approach. Nutrients 2022, 14, 112. https://doi.org/10.3390/nu14010112
Hassler E, Almer G, Reishofer G, Deutschmann H, Renner W, Herrmann M, Leber S, Staszewski A, Gunzer F, Mangge H. Investigation of the Relationship between the Mid_Thigh Adipose Tissue Distribution Measured by MRI and Serum Osteocalcin—A Sex-Based Approach. Nutrients. 2022; 14(1):112. https://doi.org/10.3390/nu14010112
Chicago/Turabian StyleHassler, Eva, Gunter Almer, Gernot Reishofer, Hannes Deutschmann, Wilfried Renner, Markus Herrmann, Stefan Leber, Alexander Staszewski, Felix Gunzer, and Harald Mangge. 2022. "Investigation of the Relationship between the Mid_Thigh Adipose Tissue Distribution Measured by MRI and Serum Osteocalcin—A Sex-Based Approach" Nutrients 14, no. 1: 112. https://doi.org/10.3390/nu14010112