Article

The Relationship between Blood Lipids and Risk of Atrial Fibrillation: Univariable and Multivariable Mendelian Randomization Analysis

1
Key Laboratory of Environmental Medicine Engineering, Department of Epidemiology & Biostatistics, School of Public Health, Southeast University, Ministry of Education, Nanjing 210009, China
2
Department of Cardiology, Zhongda Hospital, Southeast University, Nanjing 210009, China
*
Author to whom correspondence should be addressed.
Nutrients 2022, 14(1), 181; https://doi.org/10.3390/nu14010181
Submission received: 28 November 2021 / Revised: 28 December 2021 / Accepted: 29 December 2021 / Published: 31 December 2021
(This article belongs to the Section Lipids)

Abstract

:
We performed univariable and multivariable Mendelian randomization (MR) analysis to evaluate the association between blood lipids and risk of atrial fibrillation (AF), including low-density lipoprotein cholesterol (LDL-C), high-density lipoprotein cholesterol (HDL-C), triglyceride (TG), Apolipoprotein A1, and Apolipoprotein B. Methods: Data on the single nucleotide polymorphisms (SNPs) related to blood lipids were obtained from the UK Biobank study with more than 300,000 subjects of White British European ancestry, and data for AF were from the latest meta-analysis of Genome-wide association study (GWASs) with six independent cohorts with more than 1,000,000 subjects of European ancestry. The univariable MR analysis was conducted to explore whether genetic evidence of individual lipid-related traits was significantly associated with AF risks and multivariable MR analysis with three models was performed to assess the independent effects of lipid-related traits. Results: The IVW estimate showed that genetically predicted LDL-C (OR: 1.016, 95% CI: 0.962–1.073, p = 0.560), HDL-C (OR: 0.951, 95% CI: 0.895–1.010, p = 0.102), TG (OR: 0.961, 95% CI: 0.889–1.038, p = 0.313), Apolipoprotein A1 (OR: 0.978, 95% CI: 0.933–1.025, p = 0.356), and Apolipoprotein B (OR: 1.008, 95% CI: 0.959–1.070, p = 0.794) were not causally associated with the risk of AF. Sample mode (OR: 0.852, 95% CI: 0.731–0.993, p = 0.043) and weighted mode (OR: 0.907, 95% CI: 0.841–0.979, p = 0.013) showed that a 1-unit increase in TG (mmol/L) was causally associated with a 14.8% and 9.3% relative decrease in AF risk, respectively. The multivariable MR analysis with model 1, 2, and 3 indicated that TG, LDL-C, HDL-C, Apolipoprotein A1, and Apolipoprotein B were not associated with the lower risk for AF. Conclusions: Our multivariable Mendelian randomization analysis (MVMR) finding suggested no genetic evidence of lipid traits was significantly associated with AF risk. Furthermore, more work is warranted to confirm the potential association between lipid traits and AF risks.

1. Introduction

Atrial fibrillation (AF) is a common arrhythmia contributing to substantial social and medical burdens with significant health and socioeconomic impact [1]. The prevalence of AF is increasing, estimated to rise to 12.1 million in 2030 in the United States and 17.9 million in 2060 in the European Union [2]. AF is associated with high health system utilization, poor quality of life, and increased risk for hospitalization, heart failure, stroke, and death [3].
Significant effort has been made to define the underlying mechanisms of AF, such as fundamental electrophysiological and structural changes within the left atrium [4]. Notably, patients with high blood lipids levels can develop an inflammatory response in some cases [5], and hyperlipidemia appears to increase the risk of AF.
However, a few studies conducted to explore the relationship between blood lipids and AF have provided controversial results. In some observational studies, high levels of total cholesterol (TC) and low-density lipoprotein cholesterol (LDL-C) were unexpectedly identified to be inversely associated with the risk of AF [6,7,8,9,10]. However, the Multi-Ethnic Study of Atherosclerosis and the Framingham Heart Study found high-density lipoprotein cholesterol (HDL-C) and triglycerides (TG) were associated with the risk of AF except for LDL-C or TC [11]. Concurrently, low-level Apolipoprotein A1 and B were associated with increased risk of AF [12]. A systematic review of prospective studies found that serum TC, LDL-C, and HDL-C levels negatively correlated with risk of atrial fibrillation, while no significant correlation was found between TG levels and the incidence of AF [13]. Another meta-analysis reported a nonlinear association between TC and AF and a nonlinear association between LDL-C and the AF risks [14]. Notably, these studies included limited sample sizes with potential confounders.
Confirmation of a causal association is a challenging as the reverse causation and confounding between blood lipids and the risk of AF. Mendelian randomization (MR) has emerged as a powerful methodology for identifying the causation between exposures and diseases using genetic variants as instrument variables (IVs) [15]. MR analysis can largely overcome the confounders of individuals being randomly assigned genetic variants at the time of conception. Furthermore, the risk of reverse causation is also minimized, as the presence of a disease does not impact individuals’ genotypes [16].
In this study, we performed a univariable MR to explore whether genetic evidence of the lipid-related traits in individuals was significantly associated with AF risks. Meanwhile, each lipid-related entity can be expected to have its own influence or causal characteristics [17]. Therefore, we further preformed multivariable MR analysis with three models to evaluate the independent influence of lipid-related traits on AF using UKB data.

2. Materials and Methods

2.1. Data Resources and Study Design

Summary statistic data for LDL-C (N = 318,340) and HDL-C (N = 291,830), TG (N = 318,674), and Apolipoprotein A1 (N = 290,198) and Apolipoprotein B (N = 317,412) were from a meta-analyzed GWAS for 35 lab biomarkers from the UK Biobank (UKB) of White British European ancestry [18]. UK Biobank is a prospective cohort of over 500,000 men and women recruited and their health is being followed on a long term [19]. Data for AF were obtained from the latest meta-analysis of GWASs for AF with six independent cohorts (The Nord-Trøndelag Health Study, Michigan Genomics Initiative, DECODE, UK Biobank, DiscovEHR Collaboration Cohort, and AF Gen Consortium) with more than 1,000,000 subjects of European ancestry, including 60,620 cases with AF and 970,216 controls [20]. The details are presented in Table 1.
The univariable MR analysis were conducted to explore whether genetic evidence of individual lipid-related characteristics was significantly associated with AF risks and multivariable MR analysis with three models were conducted to assess the independent influence of lipid-related traits. In the model 1 of multivariable MR, pleiotropic effects across the included lipid traits were adjusted, including Apolipoprotein B, LDL-C, and TG for the causal associations with AF. In the model 2 of multivariable MR, pleiotropic effects across the included lipid traits including Apolipoprotein A1 and HDL-C were adjusted. Finally, in the model 3, we used the previously reported GWAS dataset for all circulating lipids traits [17].

2.2. Selection of Genetic Instrumental Variables

All genetic variants significantly associated with LDL-C and HDL-C, TG, and Apolipoprotein A1 and Apolipoprotein B levels (p < 5 × 10⁻⁸) were selected as IVs. The corresponding linkage disequilibrium was identified, we confirmed that the SNP was in a state of linkage disequilibrium, and the independence of the SNP was realized by cutting the SNP into a 10,000 kb window (r2 < 0.001) [21]. Then, the SNPs were removed that were related with potential confounders of the outcomes. In this study, blood pressure, blood sugar, BMI, chronic nephropathy, CAD, and CRP were identified as confounders (http://www.phenoscanner.medschl.cam.ac.uk/ accessed on 9 October 2021) [22]. SNP harmonization was performed to rectify the orientation of the alleles [15]. The details of IVs for LDL-C, HDL-C, TG, Apolipoprotein A1, and Apolipoprotein B in univariable MR analysis were presented in Supplementary Tables S1–S5. The SNPs of all lipid traits used in the multivariable MR analysis were acquired by clumping to a linkage disequilibrium threshold of r2 < 0.001. Finally, 301 SNPs were involved in model 1 of the multivariable MR analysis, 173 SNPs in model 2, and 437 SNPs in model 3. F statistic value for each instrument-exposure association was ranged from 28.422 to 49.559, demonstrating the smaller possibility of weak instrumental variable bias in the final results (Table 1).

2.3. Statistical Analysis

The way to obtain an MR estimate was to conduct an inverse variance weighted (IVW) meta-analysis of each Wald ratio [23]. When there was no evidence of targeted pleiotropy in the selected IVs (p for MR-Egger intercept > 0.05), the IVW approach was considered the most credible [24].
The weighted median method [25], sample mode method [26], weighted mode method [26], and MR-Egger method [25] were also utilized to evaluate the robust effects. The weighted median analysis can produce consistent estimates with at least 50% of the weight in the analysis coming from valid instrumental variables [27]. Cochran’s Q test was applied to assess heterogeneity of estimates of individual genetic variability. If the p value in the Cochran’s Q test was less than 0.05, the IVW with a multiplicative random-effects model in the eventual results was used; otherwise, a fixed-effects model was used [28]. The MR-Egger test was conducted to find out whether the main assumptions of MR were violated due to directional pleiotropy [25]. In MR-Egger test, the intercept evaluated the average pleiotropic effect of the genetic variation, and a value greater or less than zero indicated that the IVW estimate may be biased [29]. We also inspected potential directional pleiotropy based on the asymmetry of the funnel plots. Finally, MR-PRESSO was performed to validate the results in the IVW model, which detected and corrected the effects of outliers, generating reliable causal estimates of heterogeneity [30].

2.4. Sensitivity Analysis

The leave-one-out sensitivity analyses were conducted to evaluate the stability of results. R-squared was calculated to estimate the proportion of variance in outcomes, and the F-statistic value was calculated to mitigate the bias and predict the intensity of IVs.
Given the genetic and phenotypic relevance of lipid properties as a prior study reported [17], we further used multivariable IVW method with three models to disentangle the effects of different lipid-traits on AF. Furthermore, we performed a linear regression-based approach to estimate each risk factor separately [31].
All analyses were performed using the package “Two-Sample-MR” (version 0.5.6, Bristol, UK) and “MR-PRESSO” (version 1.0, New York, NY, USA) in R (version 4.0.5, Vienna, Austria).

3. Results

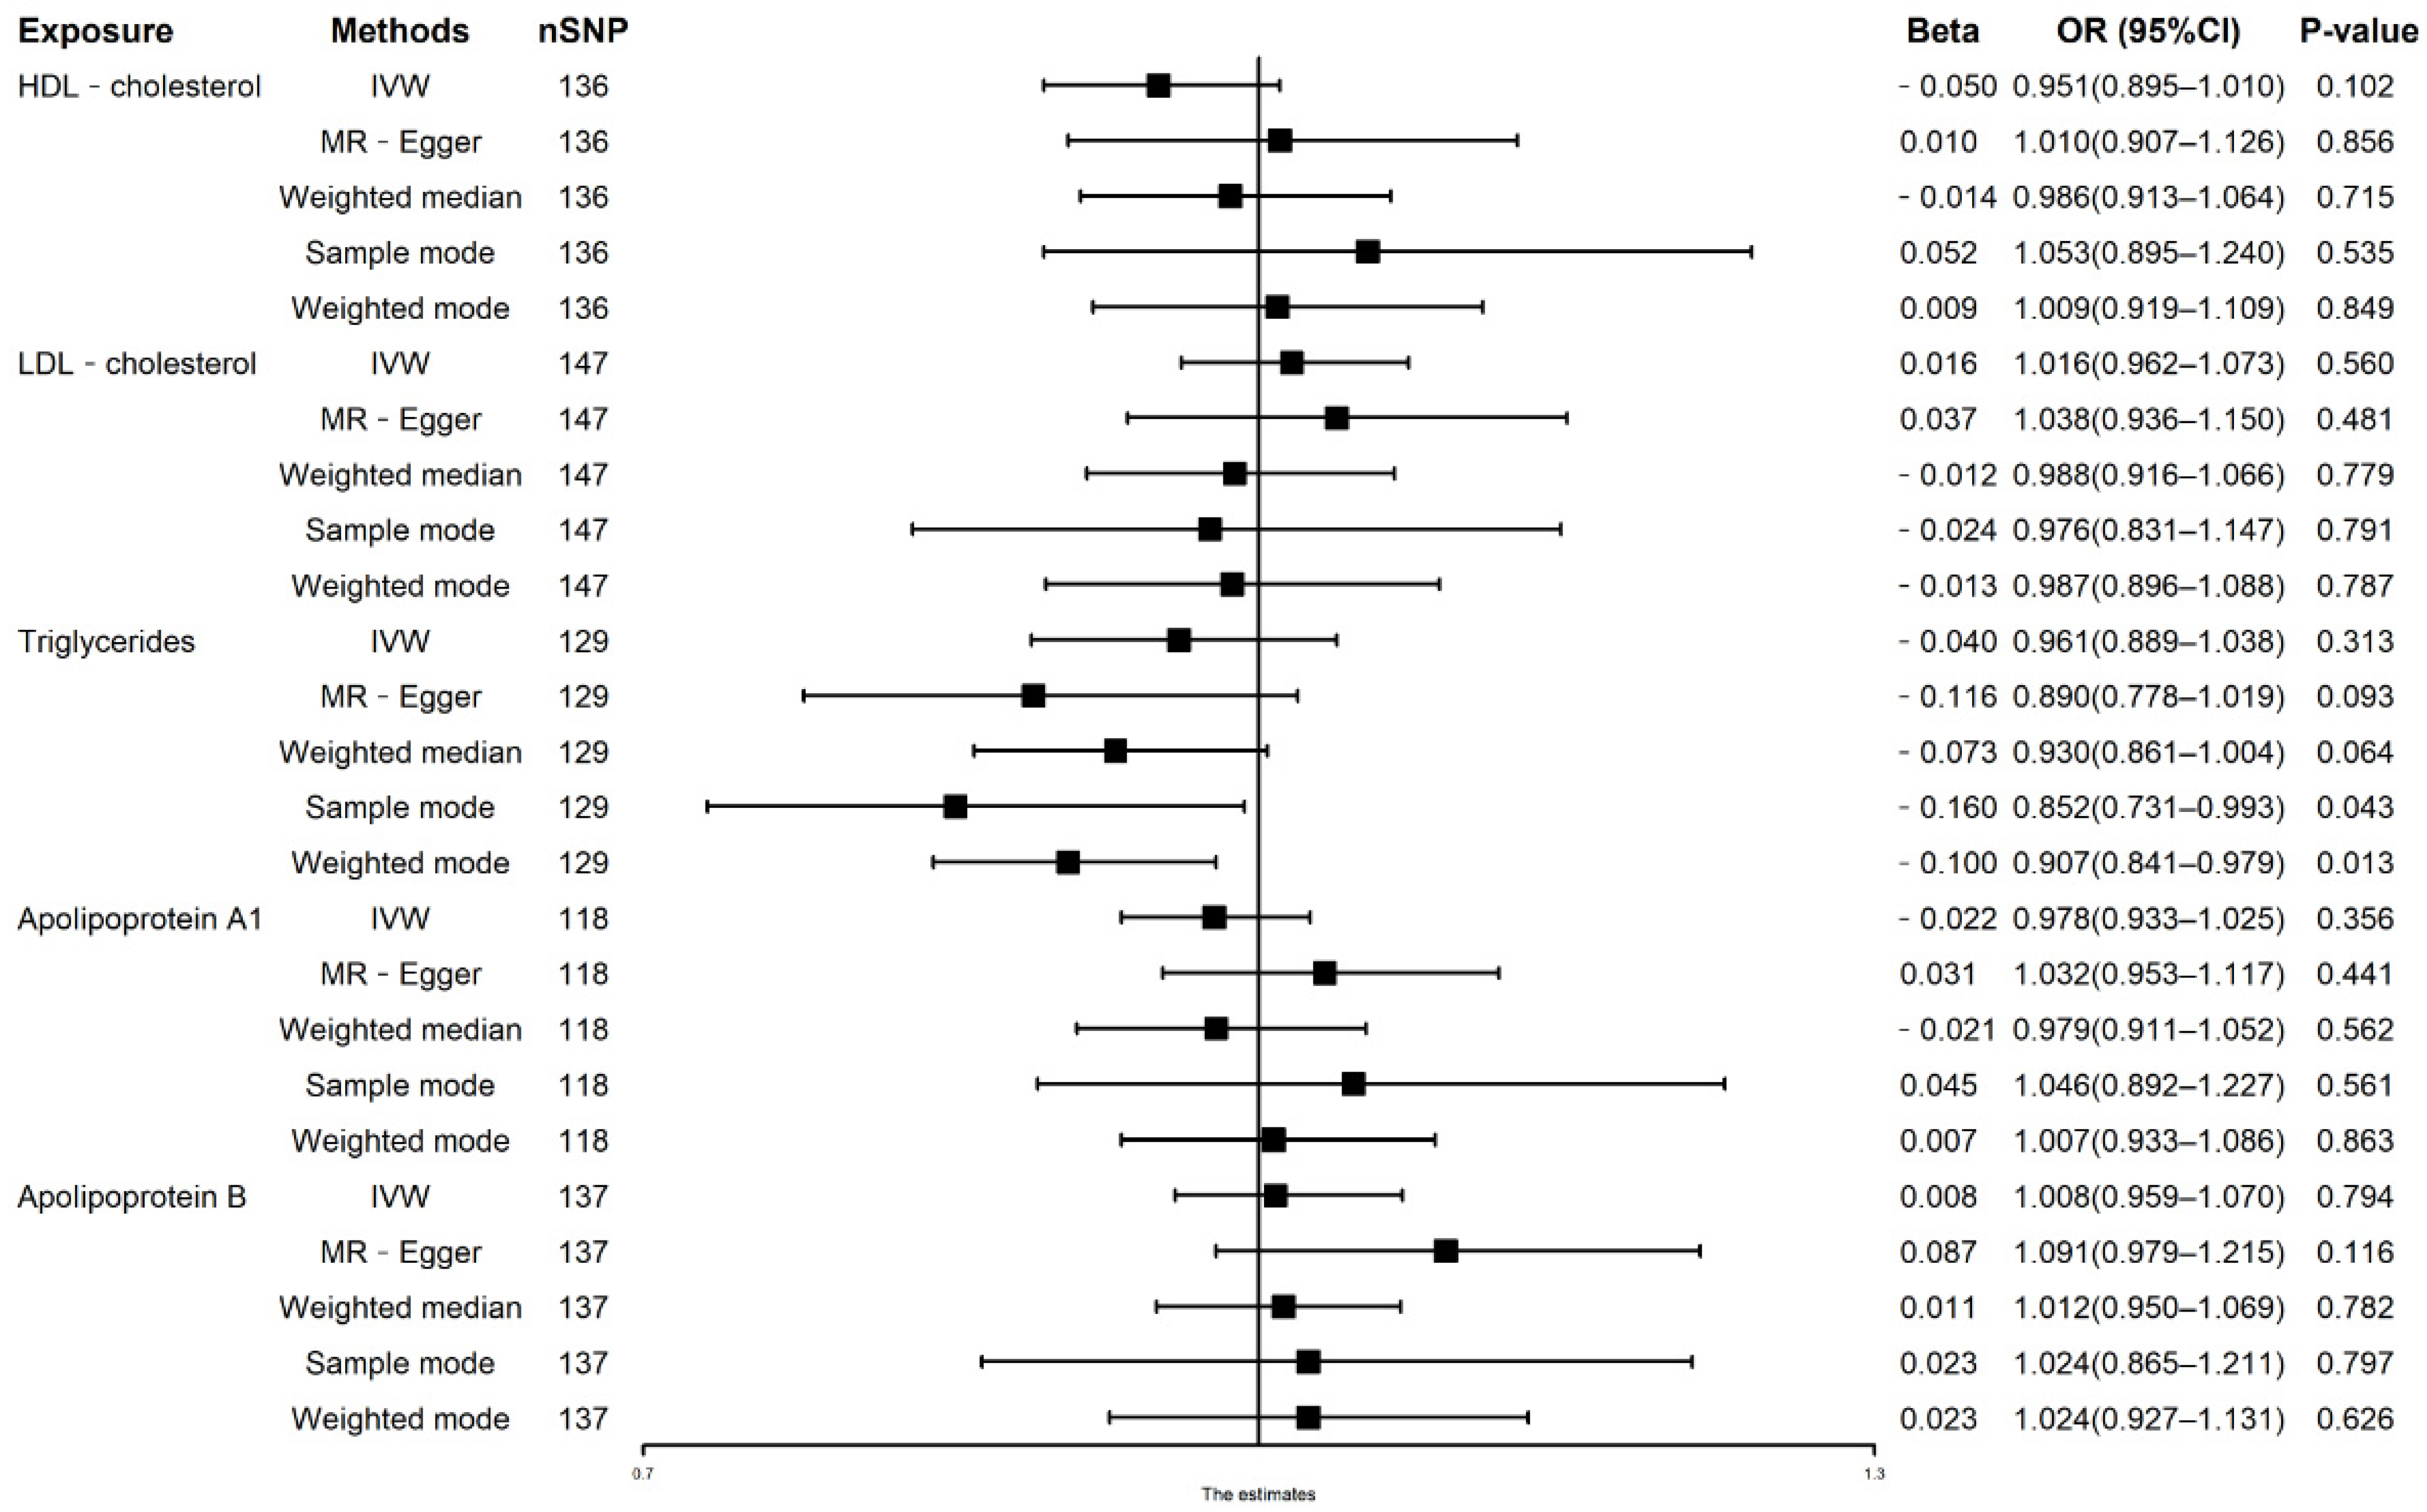
3.1. Univariable MR Analysis of Lipid Traits on AF Risks

Figure 1 reports the univariable MR estimated of lipid traits on AF risks. The IVW estimate showed that genetically predicted LDL-C (OR: 1.016, 95% CI: 0.962–1.073, p = 0.560), HDL-C (OR: 0.951, 95% CI: 0.895–1.010, p = 0.102), TG (OR: 0.961, 95% CI: 0.889–1.038, p = 0.313), Apolipoprotein A1 (OR: 0.978, 95% CI: 0.933–1.025, p = 0.356), and Apolipoprotein B (OR: 1.008, 95% CI: 0.959–1.070, p = 0.794) were not significantly associated with the risk of AF (Figure 1). The results were consistent in weighted median methods and weighted mode methods (Figure 1). However, sample mode (OR: 0.852, 95% CI: 0.731–0.993, p = 0.043) and weighted mode (OR: 0.907, 95% CI: 0.841–0.979, p = 0.013) showed that a 1-unit increase in TG (mmol/L) was causally associated with a 14.8% and 9.3% relative decrease in AF risk, respectively. Furthermore, the MR-PRESSO process verified the negative results (Table 2).
There were potential heterogeneities but no directional pleiotropies for the analysis results (Supplementary Table S6). The scatter plots and forest plots were displayed in Supplementary Figures S1A–E and S2A–E. The funnel plots were symmetrical (Supplementary Figure S3A–E) and the leave-one-out method indicated that no SNP was substantially driving the association between lipids traits and AF risks (Supplementary Figure S4A–E).

3.2. Multivariable MR Analysis in Model 1

In model 1 with mutual adjustment for LDL-C, TG, and Apolipoprotein B, the association between LDL-C and risk of AF was still non-significant (N = 301, OR = 0.972, 95% CI: 0.505–1.439, p = 0.891). It also showed that genetically predicted TG and Apolipoprotein B were not significantly associated with risk of AF (Figure 2, Supplementary Table S7). This negative effect was also found in a linear regression-based approach (Supplementary Table S8).

3.3. Multivariable MR Analysis in Model 2

In model 2 with mutual adjustment for HDL-C and Apolipoprotein A1, the association between Apolipoprotein A1 and risk of AF was still non-significant (N = 173, OR = 1.006, 95% CI: 0.867–1.145, p = 0.950, Figure 2, Supplementary Table S7). The result was consistent in complementary analyses using a linear regression-based approach (Supplementary Table S8).

3.4. Multivariable MR Analysis in Model 3

In model 3 with mutual adjustment for LDL-C, TG, and Apolipoprotein A1, HDL-C, and Apolipoprotein A1, there was no association between lipid with the risk of AF (Figure 2, Supplementary Table S7). The result was consistent in complementary analyses using a linear regression-based approach (Supplementary Table S8).

4. Discussion

Using an integrated approach, including conventional multivariate MR, our study aimed to test for a cause effect between genetically determined lipid traits and AF risks. However, our study showed there was no cause effect between them.
Observational studies have provided discrepant results on the relationship between LDL-C, HDL-C, TG, Apolipoprotein A1, and Apolipoprotein B and AF risk. For example, in a pool analysis of two community-based cohorts, HDL-C and TG were associated with the risk of AF but not LDL-C or TC [11]. In the Niigata Preventive Medicine Study, high levels of TC, LDL-C, and HDL-C were found to be associated with an increased risk of AF among Japanese [6], while, in addition to HDL-C and TG, higher levels of TC and LDL-C were found related with the increased risk of AF among Chinese [32]. Lacking adjustments including obesity, geographical and ethnic variations, and other CVD risk factors may partly explain inconsistencies among studies. A meta-analysis of large cohort studies reported that serum TC, LDL-C, and HDL-C levels negatively correlated with risk of AF, while no significant correlation was found between TG levels and incident AF [13].
It seems there was a “cholesterol paradox” in AF [10]. The potential mechanisms of the identified inversed causal effects of LDL-C and TC were as follows. Firstly, it is an alteration of cardiac ion channels caused by cholesterol [33,34,35,36]. Some studies have suggested that cholesterol regulates the distribution and function of the Kv1.5 K+, Kir2.1 K+, and Na+ channel, and participates in the etiopathogenesis of AF. Secondly, it might be confounded by hyperthyroidism status, which was found to reduce LDL-C levels and associated with risk of AF [37,38,39]. Another confounding factor might be the natriuretic peptides (NT-proBNP or BNP). It has been described that there is a negative correlation between LDL-C levels and NT-proBNP [40], and natriuretic peptides are powerful predictors of AF risk [11,41,42,43]. Thirdly, patients with elevated TC levels have an anti-inflammatory effect in certain situations, which might also be related in the etiopathogenesis of AF [44]. With the univariable MR analysis, we have proven that genetically predicted TG was associated with the lower risk for AF. This might be explained by the confounder factors including other lipid traits. Furthermore, multivariable MR analysis indicated that there was no correlation between lipid and AF risks and the potential mechanisms of lipid and AF are not yet fully elucidated.
Both LDL-C and TG are transported in atherogenic lipoproteins, each of which contains Apolipoprotein B molecule [45,46]. Some cross-sectional studies [47,48] and prospective observational studies [49] suggested Apolipoprotein B might be a more accurate cardiovascular risk marker than total cholesterol or LDL-C levels. The MR studies have added evidence that the quantity of Apolipoprotein B particles within the arterial lumen is the most immediate indicator of atherosclerotic damage, and that Apo B particles cause damage to the arterial wall. Given correlation among lipid-related characteristics, multivariable MR analysis with three models, were designed to test the independent effects of each lipid trait. However, our results indicated that high Apolipoprotein B levels were not associated with the increased risk of AF both in univariable and multivariable MR analysis. Increased TG levels have been shown in epidemiological and clinical studies to be a biomarker of cardiovascular (CV) risk [50], but we found that there was no causal relationship between TG and AF risks.
Our MVMR analyses provided the genetic evidence that none of the lipid traits was significantly associated with AF risks. There are some strengths in our study. Firstly, data were obtained from different samples, genetic associations can be gained from large GWAS, which considerably improves the statistical power for the detection of small effects in complex phenotypes [51]. Secondly, the genetic variants were distributed on separate chromosomes, and underlying gene-gene interaction might have little influence on the effects [52].
There are several limitations to our study. Firstly, there was heterogeneity among our results. Due to the GWAS data, any potential nonlinear relationships or stratification effects which differs by health status, age, or gender cannot be examined. This may be the resource of heterogeneity. Secondly, despite the lack of targeted pleiotropy indication in the analysis, we could not exclude the association, which is almost completely mediated through other causal pathways. Thirdly, we did not explore the association between blood lipids and different AF subtypes. Finally, our datasets included mostly European populations which limited applicability of results for non-European populations.

5. Conclusions

In conclusion, our MVMR analyses provided genetic evidence that no genetically determined lipid traits were significantly associated with AF risks. more work is warranted to confirm the potential association between lipid traits and AF risks.

Supplementary Materials

The following are available online at https://www.mdpi.com/article/10.3390/nu14010181/s1, Figure S1: Scatter plot of MR effect size for causal associations between lipid traits and atrial fibrillation, Figure S2: Forest plot of MR effect size using MR-Egger and IVW methods for causal associations between lipid traits and atrial fibrillation, Figure S3: Funnel plot of causal associations between lipid traits and atrial fibrillation, Figure S4: Leave-one-out plot to assess if a single variant is driving the association between lipid traits and atrial fibrillation, Table S1: Harmonized dataset of univariate Mendelian randomization for the effect of LDL-cholesterol on atrial fibrillation, Table S2: Harmonized dataset of univariate Mendelian randomization for the effect of HDL-cholesterol on atrial fibrillation, Table S3: Harmonized dataset of univariate Mendelian randomization for the effect of Triglycerides on atrial fibrillation, Table S4: Harmonized dataset of univariate Mendelian randomization for the effect of Apolipoprotein A1 on atrial fibrillation, Table S5: Harmonized dataset of univariate Mendelian randomization for the effect of Apolipoprotein B on atrial fibrillation, Table S6: Associations of HDL cholesterol, LDL cholesterol, triglycerides, apolipoprotein A1, and apolipoprotein B with AF in Univariable Mendelian randomization analysis, Table S7: Associations of lipid traits with AF in multivariable MR with inverse-variance weighted method with three models, Table S8: Associations of lipid traits with AF in multivariable MR with a linear regression-based method with three models.

Author Contributions

Formal analysis, S.Y.; Methodology, R.P.; Resources, L.W.; Software, S.Y., R.P. and H.Z.; Supervision, L.W.; Validation, L.W.; Visualization, S.Y.; Writing–original draft, S.Y.; Writing–review & editing, R.P. and L.W. All authors have read and agreed to the published version of the manuscript.

Funding

This study was supported by the National Natural Science Foundation of China (81673259), Natural Science Foundation of Jiangsu Province, China (BK20161435) and Jiangsu Commission of Health (H2019079).

Institutional Review Board Statement

Not applicable.

Informed Consent Statement

Informed consent was obtained from all subjects involved in the study.

Data Availability Statement

GWAS dataset are available at ieu open GWAS project (https://gwas.mrcieu.ac.uk/, last accessed 10 September 2021).

Acknowledgments

We are grateful for Feihong Chen and Ying Sun for her helpful advice of methodology and statistics.

Conflicts of Interest

The authors declare that there is no conflict of interest.

Abbreviations

AF, atrial fibrillation; MR, Mendelian randomization; IVW, inverse variance weighted; SNPs, single nucleotide polymorphisms; GWAS, genome-wide association; IVs, instrument variables; UKB, UK Biobank; MR-PRESSO, MR pleiotropy residual sum and outlier test; LDL-C, low-density lipoprotein cholesterol; HDL-C, high-density lipoprotein cholesterol; TG, triglyceride; TC, total cholesterol.

References

  1. Chung, M.K.; Refaat, M.; Shen, W.K.; Kutyifa, V.; Cha, Y.M.; Di Biase, L.; Baranchuk, A.; LampertC, R.; Natale, A.; Fisher, J.; et al. Atrial Fibrillation: JACC Council Perspectives. J. Am. Coll. Cardiol. 2020, 75, 1689–1713. [Google Scholar] [CrossRef]
  2. Benjamin, E.J.; Muntner, P.; Alonso, A.; Bittencourt, M.S.; Callaway, C.W.; Carson, A.P.; Chamberlain, A.M.; Chang, A.R.; Cheng, S.; Das, S.R.; et al. Heart Disease and Stroke Statistics-2019 Update: A Report From the American Heart Association. Circulation 2019, 13, e56–e528. [Google Scholar] [CrossRef]
  3. Georgiopoulos, G.; Ntritsos, G.; Stamatelopoulos, K.; Tsioufis, C.; Aimo, A.; Masi, S.; Evangelou, E. The relationship between blood pressure and risk of atrial fibrillation: A Mendelian randomization study. Eur. J. Prev. Cardiol. 2021, 28, 1617. [Google Scholar] [CrossRef] [PubMed]
  4. Wijesurendra, R.S.; Casadei, B. Mechanisms of atrial fibrillation. Heart 2019, 105, 1860–1867. [Google Scholar] [CrossRef]
  5. Lüscher, T.F. Frontiers in lipid research: Lipoprotein(a), apolipoprotein C-III and E, and PCSK9 and inflammation. Eur. Heart J. 2019, 40, 2741–2744. [Google Scholar] [CrossRef] [PubMed]
  6. Watanabe, H.; Tanabe, N.; Yagihara, N.; Watanabe, T.; Aizawa, Y.; Kodama, M. Association between lipid profile and risk of atrial fibrillation. Circ. J. 2011, 75, 2767–2774. [Google Scholar] [CrossRef] [PubMed] [Green Version]
  7. Lopez, F.L.; Agarwal, S.K.; Maclehose, R.F.; Soliman, E.Z.; Sharrett, A.R.; Huxley, R.R.; Konety, S.; Ballantyne, C.M.; Alonso, A. Blood lipid levels, lipid-lowering medications, and the incidence of atrial fibrillation: The atherosclerosis risk in communities study. Circ. Arrhythm. Electrophysiol. 2012, 5, 155–162. [Google Scholar] [CrossRef] [PubMed] [Green Version]
  8. Psaty, B.M.; Manolio, T.A.; Kuller, L.H.; Kronmal, R.A.; Cushman, M.; Fried, L.P.; White, R.; Furberg, C.D.; Rautaharju, P.M. Incidence of and risk factors for atrial fibrillation in older adults. Circulation 1997, 96, 2455–2461. [Google Scholar] [CrossRef] [PubMed]
  9. Iguchi, Y.; Kimura, K.; Shibazaki, K.; Aoki, J.; Kobayashi, K.; Sakai, K.; Sakamoto, Y. Annual incidence of atrial fibrillation and related factors in adults. Am. J. Cardiol. 2010, 106, 1129–1133. [Google Scholar] [CrossRef]
  10. Mora, S.; Akinkuolie, A.O.; Sandhu, R.K.; Conen, D.; Albert, C.M. Paradoxical association of lipoprotein measures with incident atrial fibrillation. Circ. Arrhythm. Electrophysiol. 2014, 7, 612–619. [Google Scholar] [CrossRef] [Green Version]
  11. Alonso, A.; Yin, X.; Roetker, N.S.; Magnani, J.W.; Kronmal, R.A.; Ellinor, P.T.; Chen, L.Y.; Lubitz, S.A.; McClelland, R.L.; McManus, D.D.; et al. Blood lipids and the incidence of atrial fibrillation: The Multi-Ethnic Study of Atherosclerosis and the Framingham Heart Study. J. Am. Heart Assoc. 2014, 3, e001211. [Google Scholar] [CrossRef] [Green Version]
  12. Pol, T.; Held, C.; Westerbergh, J.; Lindbäck, J.; Alexander, J.H.; Alings, M.; Erol, C.; Goto, S.; Halvorsen, S.; Huber, K.; et al. Dyslipidemia and Risk of Cardiovascular Events in Patients With Atrial Fibrillation Treated With Oral Anticoagulation Therapy: Insights From the ARISTOTLE (Apixaban for Reduction in Stroke and Other Thromboembolic Events in Atrial Fibrillation) Trial. J. Am. Heart Assoc. 2018, 7, e007444. [Google Scholar] [CrossRef] [Green Version]
  13. Guan, B.; Li, X.; Xue, W.; Tse, G.; Waleed, K.B.; Liu, Y.; Zheng, M.; Wu, S.; Xia, Y.; Ding, Y. Blood lipid profiles and risk of atrial fibrillation: A systematic review and meta-analysis of cohort studies. J. Clin. Lipidol. 2020, 14, 133–142.e133. [Google Scholar] [CrossRef]
  14. Yao, Y.; Liu, F.; Wang, Y.; Liu, Z. Lipid levels and risk of new-onset atrial fibrillation: A systematic review and dose-response meta-analysis. Clin. Cardiol. 2020, 43, 935–943. [Google Scholar] [CrossRef]
  15. Emdin, C.A.; Khera, A.V.; Kathiresan, S. Mendelian Randomization. JAMA 2017, 318, 1925–1926. [Google Scholar] [CrossRef]
  16. Sheehan, N.A.; Didelez, V.; Burton, P.R.; Tobin, M.D. Mendelian randomisation and causal inference in observational epidemiology. PLoS Med. 2008, 5, e177. [Google Scholar] [CrossRef] [Green Version]
  17. Yuan, S.; Tang, B.; Zheng, J.; Larsson, S.C. Circulating Lipoprotein Lipids, Apolipoproteins and Ischemic Stroke. Ann. Neurol. 2020, 88, 1229–1236. [Google Scholar] [CrossRef] [PubMed]
  18. Sinnott-Armstrong, N.; Tanigawa, Y.; Amar, D.; Mars, N.; Benner, C.; Aguirre, M.; Venkataraman, G.R.; Wainberg, M.; Ollila, H.M.; Kiiskinen, T.; et al. Genetics of 35 blood and urine biomarkers in the UK Biobank. Nat. Genet. 2021, 53, 185–194. [Google Scholar] [CrossRef] [PubMed]
  19. Collins, R. What makes UK Biobank special? Lancet 2012, 379, 1173–1174. [Google Scholar] [CrossRef]
  20. Nielsen, J.B.; Thorolfsdottir, R.B.; Fritsche, L.G.; Zhou, W.; Skov, M.W.; Graham, S.E.; Herron, T.J.; McCarthy, S.; Schmidt, E.M.; Sveinbjornsson, G.; et al. Biobank-driven genomic discovery yields new insight into atrial fibrillation biology. Nat. Genet. 2018, 50, 1234–1239. [Google Scholar] [CrossRef] [PubMed]
  21. Park, S.; Lee, S.; Kim, Y.; Lee, Y.; Kang, M.W.; Kim, K.; Kim, Y.C.; Han, S.S.; Lee, H.H.; Lee, J.P.; et al. Atrial fibrillation and kidney function: A bidirectional Mendelian randomization study. Eur. Heart J. 2021, 42, 2816–2823. [Google Scholar] [CrossRef] [PubMed]
  22. Staley, J.R.; Blackshaw, J.; Kamat, M.A.; Ellis, S.; Surendran, P.; Sun, B.B.; Paul, D.S.; Freitag, D.; Burgess, S.; Danesh, J.; et al. PhenoScanner: A database of human genotype-phenotype associations. Bioinformatics 2016, 32, 3207–3209. [Google Scholar] [CrossRef] [PubMed] [Green Version]
  23. Yang, J.; Ferreira, T.; Morris, A.P.; Medland, S.E.; Madden, P.A.; Heath, A.C.; Martin, N.G.; Montgomery, G.W.; Weedon, M.N.; Loos, R.J.; et al. Conditional and joint multiple-SNP analysis of GWAS summary statistics identifies additional variants influencing complex traits. Nat. Genet. 2012, 44, 361–363, 369–375. [Google Scholar] [CrossRef]
  24. Holmes, M.V.; Ala-Korpela, M.; Smith, G.D. Mendelian randomization in cardiometabolic disease: Challenges in evaluating causality. Nat. Rev. Cardiol. 2017, 14, 577–590. [Google Scholar] [CrossRef] [Green Version]
  25. Bowden, J.; Davey Smith, G.; Haycock, P.C.; Burgess, S. Consistent Estimation in Mendelian Randomization with Some Invalid Instruments Using a Weighted Median Estimator. Genet. Epidemiol. 2016, 40, 304–314. [Google Scholar] [CrossRef] [Green Version]
  26. Hartwig, F.P.; Davey Smith, G.; Bowden, J. Robust inference in summary data Mendelian randomization via the zero modal pleiotropy assumption. Int. J. Epidemiol. 2017, 46, 1985–1998. [Google Scholar] [CrossRef] [Green Version]
  27. Burgess, S.; Bowden, J.; Fall, T.; Ingelsson, E.; Thompson, S.G. Sensitivity Analyses for Robust Causal Inference from Mendelian Randomization Analyses with Multiple Genetic Variants. Epidemiology 2017, 28, 30–42. [Google Scholar] [CrossRef] [Green Version]
  28. Bowden, J.; Del Greco, M.F.; Minelli, C.; Davey Smith, G.; Sheehan, N.; Thompson, J. A framework for the investigation of pleiotropy in two-sample summary data Mendelian randomization. Stat. Med. 2017, 36, 1783–1802. [Google Scholar] [CrossRef] [Green Version]
  29. Bowden, J.; Davey Smith, G.; Burgess, S. Mendelian randomization with invalid instruments: Effect estimation and bias detection through Egger regression. Int. J. Epidemiol. 2015, 44, 512–525. [Google Scholar] [CrossRef] [Green Version]
  30. Verbanck, M.; Chen, C.Y.; Neale, B.; Do, R. Detection of widespread horizontal pleiotropy in causal relationships inferred from Mendelian randomization between complex traits and diseases. Nat. Genet. 2018, 50, 693–698. [Google Scholar] [CrossRef] [PubMed]
  31. Burgess, S.; Thompson, S.G. Multivariable Mendelian randomization: The use of pleiotropic genetic variants to estimate causal effects. Am. J. Epidemiol. 2015, 181, 251–260. [Google Scholar] [CrossRef] [Green Version]
  32. Li, X.; Gao, L.; Wang, Z.; Guan, B.; Guan, X.; Wang, B.; Han, X.; Xiao, X.; Waleed, K.B.; Chandran, C.; et al. Lipid profile and incidence of atrial fibrillation: A prospective cohort study in China. Clin. Cardiol. 2018, 41, 314–320. [Google Scholar] [CrossRef] [PubMed] [Green Version]
  33. Balse, E.; El-Haou, S.; Dillanian, G.; Dauphin, A.; Eldstrom, J.; Fedida, D.; Coulombe, C.; Hatem, S.N.; Jan, L.Y. Cholesterol modulates the recruitment of Kv1.5 channels from Rab11-associated recycling endosome in native atrial myocytes. Proc. Natl. Acad. Sci. USA 2009, 106, 14681–14686. [Google Scholar] [CrossRef] [PubMed] [Green Version]
  34. Epshtein, Y.; Chopra, A.P.; Rosenhouse-Dantsker, A.; Kowalsky, G.B.; Logothetis, D.E.; Levitan, I. Identification of a C-terminus domain critical for the sensitivity of Kir2.1 to cholesterol. Proc. Natl. Acad. Sci. USA 2009, 106, 8055–8060. [Google Scholar] [CrossRef] [Green Version]
  35. Baartscheer, A.; Schumacher, C.A.; Wekker, V.; Verkerk, A.O.; Veldkamp, M.W.; van Oort, R.J.; Elzenaar, L.; Ottenhoff, R.; van Roomen, C.; Aerts, H.; et al. Dyscholesterolemia Protects Against Ischemia-Induced Ventricular Arrhythmias. Circ. Arrhythm. Electrophysiol. 2015, 8, 1481–1490. [Google Scholar] [CrossRef] [PubMed] [Green Version]
  36. Lundbaek, J.A.; Birn, P.; Hansen, A.J.; Søgaard, R.; Nielsen, C.; Girshman, J.; Bruno, M.J.; Tape, S.E.; Egebjerg, J.; Greathouse, D.V.; et al. Regulation of sodium channel function by bilayer elasticity: The importance of hydrophobic coupling. Effects of Micelle-forming amphiphiles and cholesterol. J. Gen. Physiol. 2004, 123, 599–621. [Google Scholar] [CrossRef] [Green Version]
  37. Duntas, L.H.; Brenta, G. The effect of thyroid disorders on l.l.lipid levels and metabolism. Med. Clin. N. Am. 2012, 96, 269–281. [Google Scholar] [CrossRef]
  38. Wongcharoen, W.; Lin, Y.J.; Chang, S.L.; Lo, L.W.; Hu, Y.F.; Chung, F.P.; Chong, E.; Chao, T.-F.; Tuan, T.-C.; Chang, Y.-T.; et al. History of hyperthyroidism and long-term outcome of catheter ablation of drug-refractory atrial fibrillation. Heart Rhythm. 2015, 12, 1956–1962. [Google Scholar] [CrossRef]
  39. Ellervik, C.; Roselli, C.; Christophersen, I.E.; Alonso, A.; Pietzner, M.; Sitlani, C.M.; Trompet, S.; Arking, D.E.; Geelhoed, B.; Guo, X.; et al. Assessment of the Relationship Between Genetic Determinants of Thyroid Function and Atrial Fibrillation: A Mendelian Randomization Study. JAMA Cardiol. 2019, 4, 144–152. [Google Scholar] [CrossRef]
  40. Sanchez, O.A.; Duprez, D.A.; Bahrami, H.; Daniels, L.B.; Folsom, A.R.; Lima, J.A.; Maisel, A.; Peraltag, C.M.; Jacobs, D.R., Jr. The associations between metabolic variables and NT-proBNP are blunted at pathological ranges: The Multi-Ethnic Study of Atherosclerosis. Metabolism 2014, 63, 475–483. [Google Scholar] [CrossRef] [Green Version]
  41. Patton, K.K.; Heckbert, S.R.; Alonso, A.; Bahrami, H.; Lima, J.A.; Burke, G.; Kronmal, R.A. N-terminal pro-B-type natriuretic peptide as a predictor of incident atrial fibrillation in the Multi-Ethnic Study of Atherosclerosis: The effects of age, sex and ethnicity. Heart 2013, 99, 1832–1836. [Google Scholar] [CrossRef]
  42. Schnabel, R.B.; Larson, M.G.; Yamamoto, J.F.; Sullivan, L.M.; Pencina, M.J.; Meigs, J.B.; Tofler, G.H.; Selhub, J.; Jacques, P.F.; Wolf, P.A.; et al. Relations of biomarkers of distinct pathophysiological pathways and atrial fibrillation incidence in the community. Circulation 2010, 121, 200–207. [Google Scholar] [CrossRef] [Green Version]
  43. Sinner, M.F.; Stepas, K.A.; Moser, C.B.; Krijthe, B.P.; Aspelund, T.; Sotoodehnia, N.; Fontes, J.D.; Janssens, C.J.W.; Kronmal, R.A.; Magnani, J.W.; et al. B-type natriuretic peptide and C-reactive protein in the prediction of atrial fibrillation risk: The CHARGE-AF Consortium of community-based cohort studies. Europace 2014, 16, 1426–1433. [Google Scholar] [CrossRef]
  44. Folsom, A.R.; Pankow, J.S.; Tracy, R.P.; Arnett, D.K.; Peacock, J.M.; Hong, Y.; Djoussé, L.; Eckfeldt, J.H. Association of C-reactive protein with markers of prevalent atherosclerotic disease. Am. J. Cardiol. 2001, 88, 112–117. [Google Scholar] [CrossRef]
  45. Richardson, T.G.; Sanderson, E.; Palmer, T.M.; Ala-Korpela, M.; Ference, B.A.; Davey Smith, G.; Holmes, M.V. Evaluating the relationship between circulating lipoprotein lipids and apolipoproteins with risk of coronary heart disease: A multivariable Mendelian randomisation analysis. PLoS Med. 2020, 17, e1003062. [Google Scholar] [CrossRef] [PubMed] [Green Version]
  46. Sniderman, A.D.; Thanassoulis, G.; Glavinovic, T.; Navar, A.M.; Pencina, M.; Catapano, A.; Ference, B.A. Apolipoprotein B Particles and Cardiovascular Disease: A Narrative Review. JAMA Cardiol. 2019, 4, 1287–1295. [Google Scholar] [CrossRef] [PubMed]
  47. Avogaro, P.; Bon, G.B.; Cazzolato, G.; Quinci, G.B. Are apolipoproteins better discriminators than lipids for atherosclerosis? Lancet 1979, 1, 901–903. [Google Scholar] [CrossRef]
  48. Sniderman, A.; Shapiro, S.; Marpole, D.; Skinner, B.; Teng, B.; Kwiterovich, P.O., Jr. Association of coronary atherosclerosis with hyperapobetalipoproteinemia [increased protein but normal cholesterol levels in human plasma low density (beta) lipoproteins]. Proc. Natl. Acad. Sci. USA 1980, 77, 604–608. [Google Scholar] [CrossRef] [Green Version]
  49. Sniderman, A.D.; Robinson, J.G. ApoB in clinical care: Pro and Con. Atherosclerosis 2019, 282, 169–175. [Google Scholar] [CrossRef] [PubMed]
  50. Budoff, M. Triglycerides and Triglyceride-Rich Lipoproteins in the Causal Pathway of Cardiovascular Disease. Am. J. Cardiol. 2016, 118, 138–145. [Google Scholar] [CrossRef] [Green Version]
  51. Lawlor, D.A. Commentary: Two-sample Mendelian randomization: Opportunities and challenges. Int. J. Epidemiol. 2016, 45, 908–915. [Google Scholar] [CrossRef] [PubMed] [Green Version]
  52. Wang, T.; Xu, L. Circulating Vitamin E Levels and Risk of Coronary Artery Disease and Myocardial Infarction: A Mendelian Randomization Study. Nutrients. 2019, 11, 2153. [Google Scholar] [CrossRef] [PubMed] [Green Version]
Figure 1. Associations of HDL-C, LDL-C, triglycerides, Apolipoprotein A1, and Apolipoprotein B with AF in univariable Mendelian randomization analysis. HDL, high-density lipoprotein; LDL, low-density lipoprotein; IVW, inverse variance weighted.
Nutrients 14 00181 g001
Figure 2. Model 1, associations of LDL-C, TG, Apolipoprotein B with AF risks in multivariable MR analysis. Model 2, associations of HDL-C, Apolipoprotein A1 with AF risks in multivariable MR analysis. Model 3, associations of HDL-C, LDL -C, TG, Apolipoprotein A1, and Apolipoprotein B with AF in multivariable MR analysis. HDL-C, high-density lipoprotein cholesterol; LDL, low-density lipoprotein cholesterol.
Nutrients 14 00181 g002
Table 1. Details of studies included and predictive strength of IVs in Mendelian randomization analyses (two-sided α = 0.05).
Exposures/OutcomesConsortiumEthnicitySample SizesR-Squared %
(of Variance in AF)
F-Statistic
(Total)
HDL-CUKBEuropean291,8301.58234.375
LDL-CUKBEuropean318,3401.29628.422
TGUKBEuropean318,6741.54338.704
Apolipoprotein A1UKBEuropean290,1981.97649.559
Apolipoprotein BUKBEuropean317,4121.35431.788
Atrial fibrillationHUNT, DECODE, DiscovEHR, MGI, UKB, and AF Gen ConsortiumEuropean1,030,836NANA
AF, atrial fibrillation; UKB, UK Biobank; HDL-C, high density lipoprotein cholesterol; LDL-C, low density lipoprotein cholesterol; TG, Triglycerides; HUNT, The Nord-Trøndelag Health Study; DECODE, DiscovEHR, Collaborative analysis of Diagnostic criteria in Europe study; MGI, Michigan Genomics Initiative; AF Gen, Atrial Fibrillation Genetics.
Table 2. MR-PRESSO for causal effect between circulation bilirubin levels and AF.
ExposureRaw EstimatesOutlier Corrected EstimatesDistortion Test
nSNPBetaOR (95%CI)p-ValuenSNPBetaOR (95%CI)p-Valuep-Value
HDL-C138−0.0250.975(0.920,1.030)0.379137−0.0180.982(0.928,1.036)0.5170.695
LDL-C147−0.0010.999(0.947,1.051)0.966145−0.0040.996(0.946,1.046)0.8820.942
TG 129−0.0410.960(0.885,1.035)0.291125−0.0470.954(0.897,1.011)0.1140.847
Apolipoprotein A1118−0.0020.998(0.994,1.002)0.921NANANANANA
Apolipoprotein B1370.0081.008(0.959,1.070)0.786NANANANANA
HDL-C, high density lipoprotein cholesterol; LDL-C, low density lipoprotein cholesterol; TG, Triglycerides; SNP, single nucleotide polymorphisms; OR, odds ratio.
Publisher’s Note: MDPI stays neutral with regard to jurisdictional claims in published maps and institutional affiliations.

