
Influence of Gluten-Free Diet on Gut Microbiota Composition in Patients with Coeliac Disease: A Systematic Review


 , and
, and
Abstract
:1. Introduction
2. Experiment
2.1. Search Strategy, Inclusion and Exclusion Criteria
2.2. Data Extraction and Analysis
3. Results
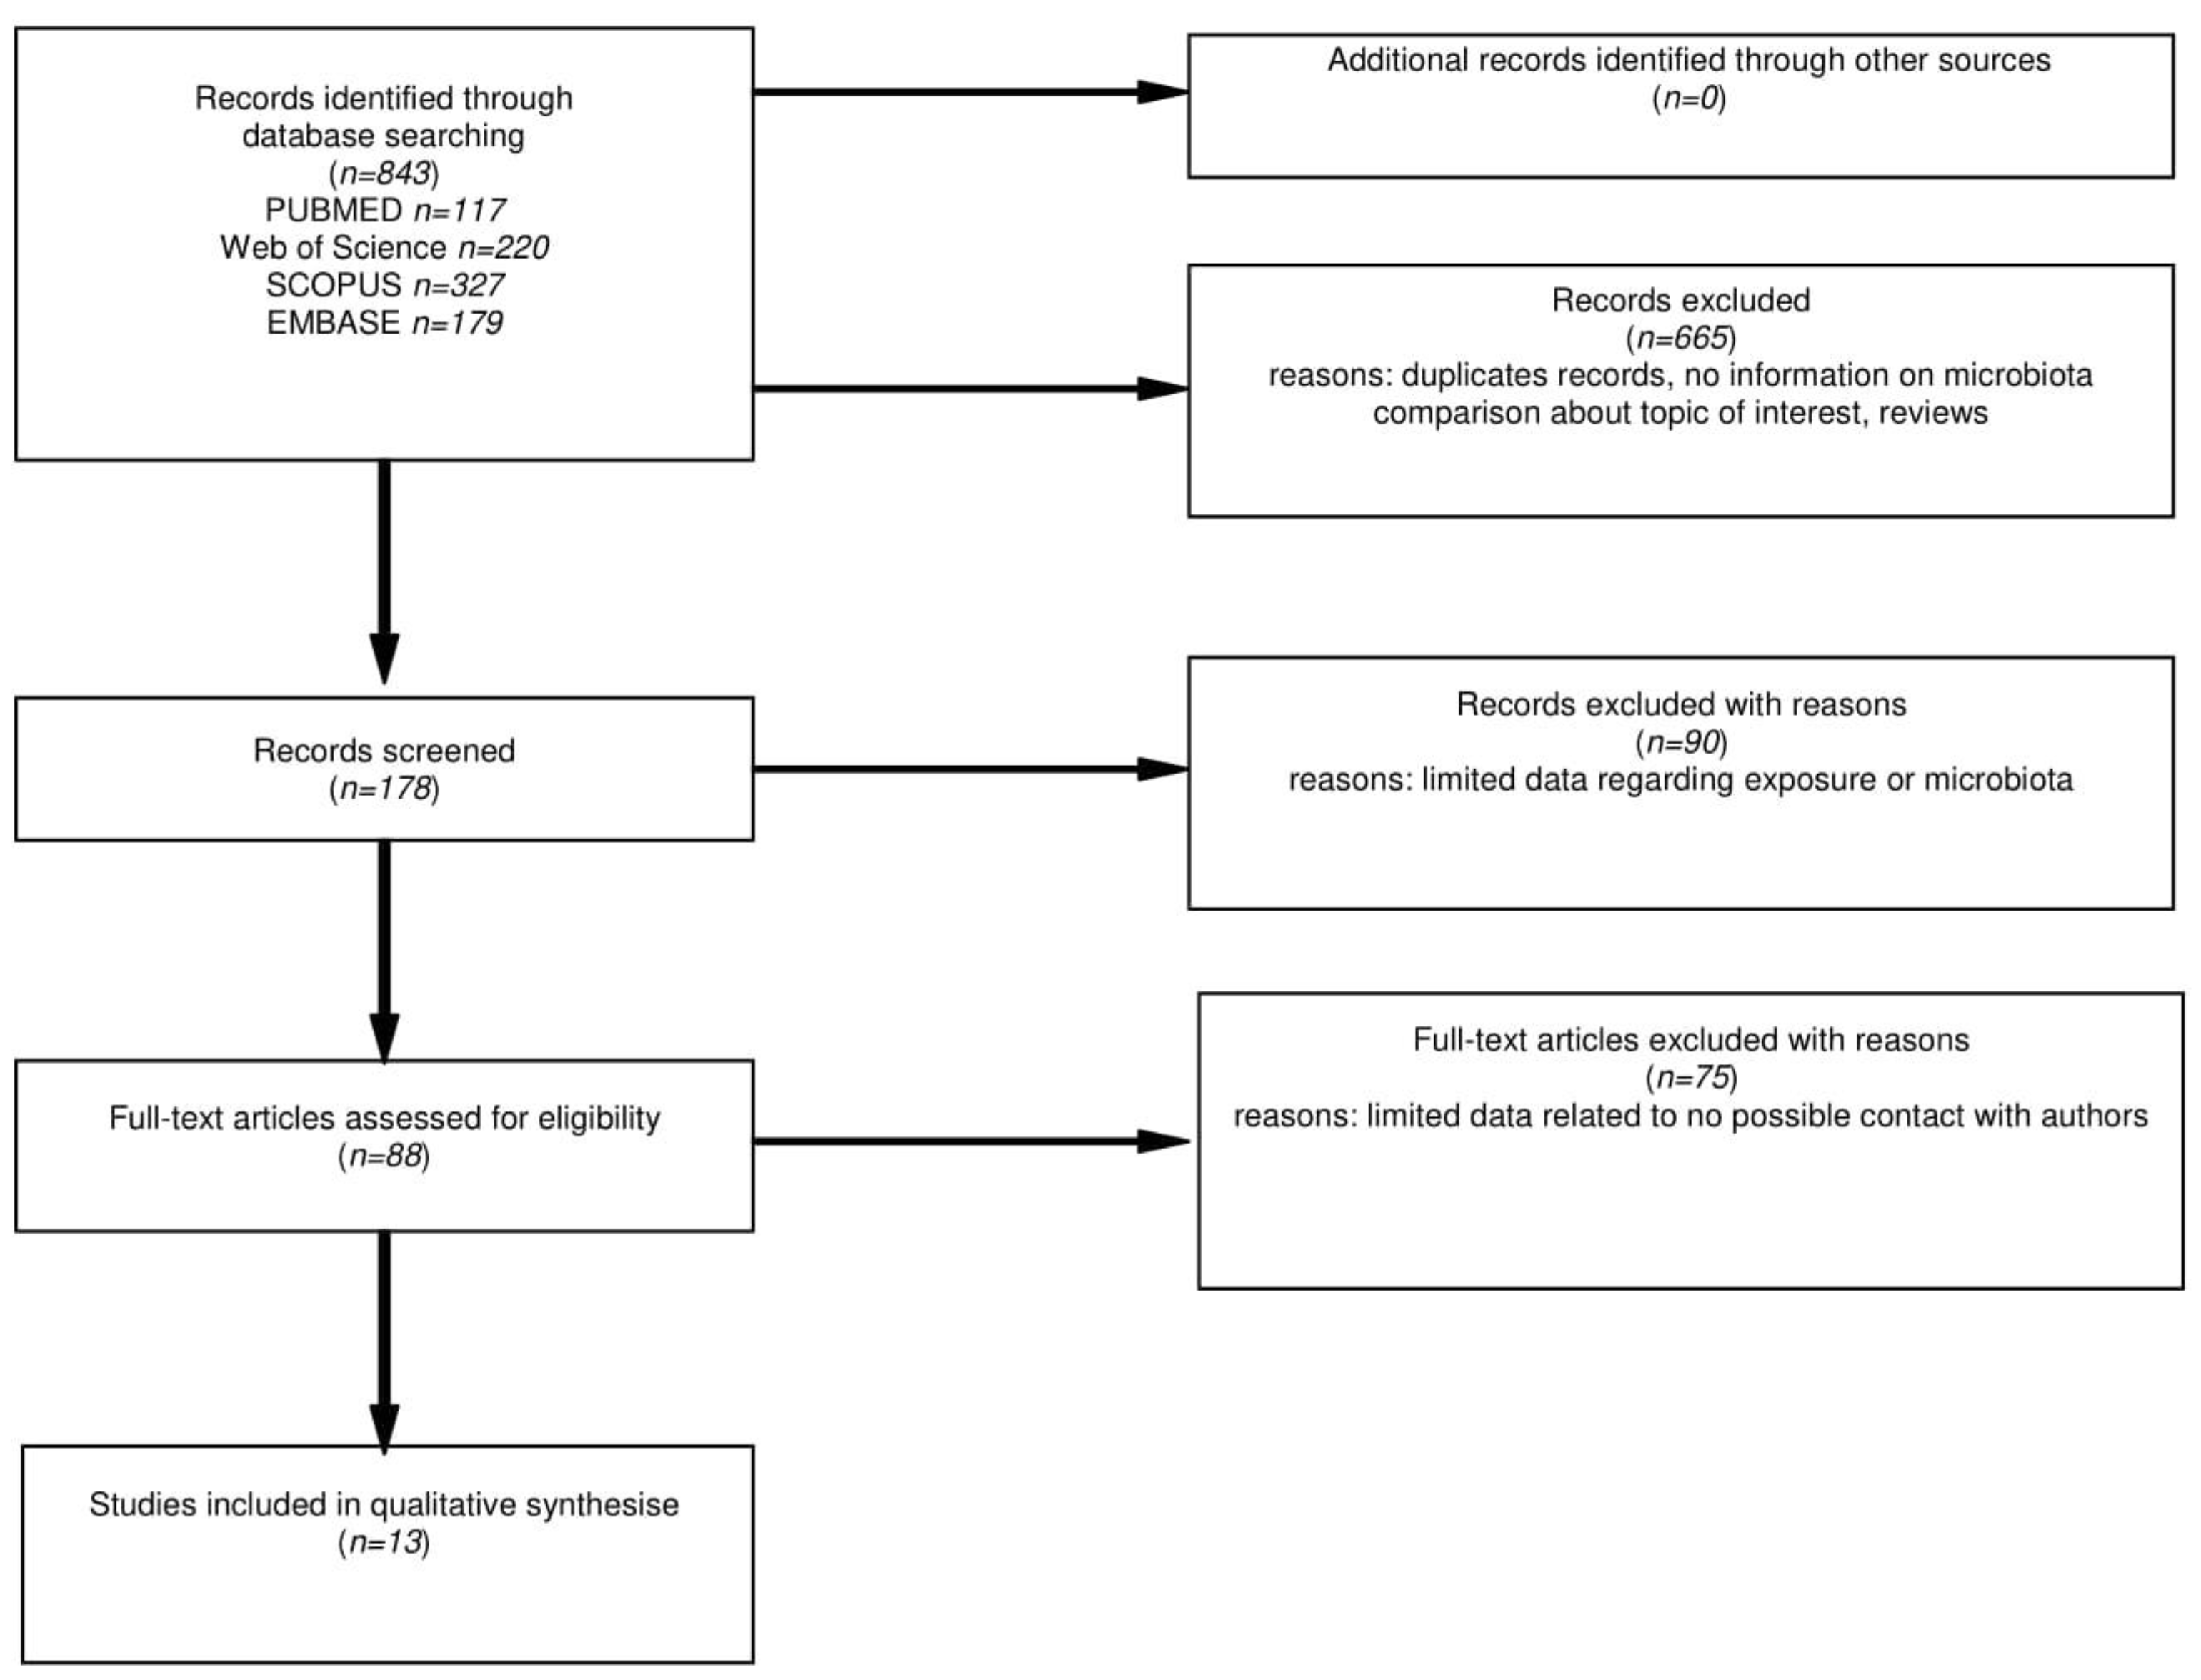
3.1. Search Results
3.2. Characteristics of the Included Studies and Study Population
3.3. Assessment of Microbiota Changes Related to GFD Treatment
4. Discussion
5. Limitations
6. Conclusions
Author Contributions
Funding
Institutional Review Board Statement
Informed Consent Statement
Data Availability Statement
Conflicts of Interest
References
- Lohi, S.; Mustalahti, K.; Kaukinen, K.; Laurilla, K.; Collin, P.; Rissanen, H.; Lohi, O.; Bravi, E.; Gasparin, M.; Reunanen, A.; et al. Increasing prevalence of coeliac disease over time. Aliment. Pharmacol. Ther. 2007, 26, 1217–1225. [Google Scholar] [CrossRef]
- Caio, G.; Volta, U.; Sapone, A.; Leffler, D.A.; Giorgio, R.; Catassi, C.; Fasano, A. Celiac disease: A comprehensive current review. BMC Med. 2019, 17, 142. [Google Scholar] [CrossRef] [Green Version]
- Trynka, G.; Wijmenga, C.; Heel, D.A. A genetic perspective on coeliac disease. Trends Mol. Med. 2010, 16, 537–550. [Google Scholar] [CrossRef]
- Rubio-Tapia, A.; Hill, I.D.; Kelly, C.P.; Calderwood, A.H.; Murray, J.A. ACG Clinical Guidelines: Diagnosis and Management of Celiac Disease. Am. J. Gastroenterol. 2013, 108, 656–676. [Google Scholar] [CrossRef] [PubMed] [Green Version]
- Bardella, M.T.; Velio, P.; Cesana, B.M.; Prampolini, L.; Casella, G.; Bella, C.; Lanzini, A.; Gambarotti, M.; Bassotti, G.; Villanacci, V. Coeliac disease: A histological follow-up study. Histopathology 2007, 50, 465–471. [Google Scholar] [CrossRef]
- Wahab, P.J.; Meijer, J.W.R.; Mulder, C.J.J. Histologic Follow-up of People with Celiac Disease on a Gluten-Free Diet. Am. J. Clin. Pathol. 2002, 118, 459–463. [Google Scholar] [CrossRef] [PubMed]
- Tursi, A.; Brandimarte, G.; Giorgetti, G.; Elisei, W.; Inchingolo, C.; Monardo, E.; Aiello, F. Endoscopic and histological findings in the duodenum of adults with celiac disease before and after changing to a gluten-free diet: A 2-year prospective study. Endoscopy 2006, 38, 702–707. [Google Scholar] [CrossRef] [PubMed]
- Kavak, U.S.; Yüce, A.; Koçak, N.; Demir, H.; Saltik, İ.N.; Gürakan, F.; Özen, H. Bone Mineral Density in Children with Untreated and Treated Celiac Disease. J. Pediatric Gastroenterol. Nutr. 2003, 37, 434–436. [Google Scholar] [CrossRef]
- Saadah, O.I.; Zacharin, M.; O’Callaghan, A.; Oliver, M.R.; Catto-Smith, A. Effect of gluten-free diet and adherence on growth and diabetic control in diabetics with coeliac disease. Arch. Dis. Child. 2004, 89, 871–876. [Google Scholar] [CrossRef] [PubMed] [Green Version]
- Zylberberg, H.M.; Demmer, R.T.; Murray, J.A.; Green, P.H.; Lebwohl, B. Depression and insomnia among individuals with celiac disease or on a gluten-free diet in the USA. Eur. J. Gastroenterol. Hepatol. 2017, 29, 1091–1096. [Google Scholar] [CrossRef]
- De Palma, G.; Cinova, J.; Stepankova, R.; Tuckova, L.; Sanz, Y. Pivotal Advance: Bifidobacteria and Gram-negative bacteria differentially influence immune responses in the proinflammatory milieu of celiac disease. J. Leukoc. Biol. 2010, 87, 765–778. [Google Scholar] [CrossRef] [PubMed]
- Akobeng, A.K.; Singh, P.; Kumar, M.; Khodor, S. Role of the gut microbiota in the pathogenesis of coeliac disease and potential therapeutic implications. Eur J Nutr. 2020, 59, 3369–3390. [Google Scholar] [CrossRef] [PubMed]
- Di Cagno, R.; De Angelis, M.; De Pasquale, I.; Ndagijimana, M.; Vernocchi, P.; Ricciuti, P.; Gagliardi, F.; Laghi, L.; Crecchio, C.; Guerzoni, M.E.; et al. Duodenal and faecal microbiota of celiac children: Molecular, phenotype and metabolome characterization. BMC Microbiol. 2011, 11, 219. [Google Scholar] [CrossRef] [PubMed] [Green Version]
- Schippa, S.; Iebba, V.; Barbato, M.; Di Nardo, G.; Totino, V.; Checchi, M.P.; Longhi, C.; Maiella, G.; Cucchiara, S.; Conte, M.P. A distinctive ‘microbial signature’ in celiac pediatric patients. BMC Microbiol. 2010, 10, 175. [Google Scholar] [CrossRef]
- Pirjo, W.; Pilvi, L.; Katri, L.; Pekka, C. Altered Duodenal Microbiota Composition in Celiac Disease Patients Suffering From Persistent Symptoms on a Long-Term Gluten-Free Diet. Am. J. Gastroenterol. 2014, 109, 1933–1941. [Google Scholar]
- Nadal, I.; Donant, E.; Ribes-Koninckx, C.; Calabuig, M.; Sanz, Y. Imbalance in the composition of the duodenal microbiota of children with coeliac disease. J. Med. Microbiol. 2007, 56, 1669–1674. [Google Scholar] [CrossRef] [Green Version]
- De Palma, G.; Nadal, I.; Medina, M.; Donat, E.; Ribes-Koninckx, C.; Calabuig, M.; Sanz, Y. Intestinal dysbiosis and reduced immunoglobulin-coated bacteria associated with coeliac disease in children. BMC Microbiol. 2010, 10, 63. [Google Scholar] [CrossRef] [Green Version]
- Kalliomäki, M.; Satokari, R.; Lähteenoja, H.; Vähämiko, S.; Grönlund, J.; Routi, T.; Salminen, S. Expression of microbiota, Toll-like receptors, and their regulators in the small intestinal mucosa in celiac disease. Pediatr. Gastroenterol. Nutr. 2012, 54, 727–732. [Google Scholar] [CrossRef]
- Di Cagno, R.; Rizzello, C.G.; Gagliardi, F.; Ricciuti, P.; Ndagijimana, M.; Francavilla, R.; Guerzoni, M.E.; Crecchio, C.; Gobbetti, M.; De Angelis, M. Different fecal microbiotas and volatile organic compounds in treated and untreated children with celiac disease. Appl. Environ. Microbiol. 2009, 75, 3963–3971. [Google Scholar] [CrossRef] [Green Version]
- Nistal, E.; Caminero, A.; Vivas, S.; Ruiz de Morales, J.M.; Sáenz de Miera, L.E.; Rodríguez-Aparicio, L.B.; Casqueiro, J. Differences in faecal bacteria populations and faecal bacteria metabolism in healthy adults and celiac disease patients. Biochimie 2012, 94, 1724–1729. [Google Scholar] [CrossRef]
- Panelli, S.; Capelli, E.; Lupo, G.F.D.; Schiepatti, A.; Betti, E.; Sauta, E.; Marini, S.; Bellazzi, R.; Vanoli, A.; Pasi, A.; et al. Comparative Study of Salivary, Duodenal, and Fecal Microbiota Composition Across Adult Celiac Disease. J. Clin. Med. 2020, 9, 1109. [Google Scholar] [CrossRef] [PubMed] [Green Version]
- Collado, M.C.; Donat, E.; Ribes-Koninckx, C.; Calabuig, M.; Sanz, Y. Specific duodenal and faecal bacterial groups associated with paediatric coeliac disease. J. Clin. Pathol. 2008, 62, 264–269. [Google Scholar] [CrossRef] [PubMed] [Green Version]
- Sánchez, E.; Donat, E.; Ribes-Koninckx, C.; Fernández-Murga, M.L.; Sanz, Y. Duodenal-mucosal bacteria associated with celiac disease in children. Appl. Environ. Microbiol. 2013, 79, 5472–5479. [Google Scholar] [CrossRef] [Green Version]
- Serena, G.; Davies, C.; Cetinbas, M.; Sadreyev, I.R.; Fasano, A. Analysis of blood and fecal microbiome profile in patients with celiac disease. Hum. Microbiome J. 2019, 11, 100049. [Google Scholar] [CrossRef]
- Lorenzo Pisarello, M.J.; Vintiñi, E.O.; González, S.N.; Pagani, F.; Medina, M.S. Decrease in lactobacilli in the intestinal microbiota of celiac children with a gluten-free diet, and selection of potentially probiotic strains. Can. J. Microbiol. 2015, 61, 32–37. [Google Scholar] [CrossRef] [PubMed]
- Golfetto, L.; de Senna, F.D.; Hermes, J.; Beserra, B.T.; França Fda, S.; Martinello, F. Lower bifidobacteria counts in adult patients with celiac disease on a gluten-free diet. Arq. Gastroenterol. 2014, 51, 139–143. [Google Scholar] [CrossRef] [PubMed]
- Zafeiropoulou, K.; Nichols, B.; Mackinder, M.; Biskou, O.; Rizou, E.; Karanikolou, A.; Clark, C.; Buchanan, E.; Cardigan, T.; Duncan, H.; et al. Alterations in Intestinal Microbiota of Children With Celiac Disease at the Time of Diagnosis and on a Gluten-free Diet. Gastroenterology 2020, 159, 2039–2051.e20. [Google Scholar] [CrossRef] [PubMed]
- Wacklin, P.; Kaukinen, K.; Tuovinen, E.; Collin, P.; Lindfors, K.; Partanen, J.; Mäki, M.; Mättö, J. The Duodenal Microbiota Composition of Adult Celiac Disease Patients Is Associated with the Clinical Manifestation of the Disease. Inflamm. Bowel Dis. 2013, 19, 934–941. [Google Scholar] [CrossRef] [Green Version]
- Valitutti, F.; Cucchiara, S.; Fasano, A. Celiac Disease and the Microbiome. Nutrients 2019, 11, 2403. [Google Scholar] [CrossRef] [Green Version]
- Lindfors, K.; Blomqvist, T.; Juuti-Uusitalo, K.; Stenman, S.; Venäläinen, J.; Mäki, M.; Kaukinen, K. Live probiotic Bifidobacterium lactis bacteria inhibit the toxic effects induced by wheat gliadin in epithelial cell culture. Clin. Exp. Immunol. 2008, 152, 552–558. [Google Scholar] [CrossRef]
- Sjögren, Y.M.; Tomicic, S.; Lundberg, A.; Böttcher, M.F.; Björkstén, B.; Sverremark-Ekström, E.; Jenmalm, M.C. Influence of early gut microbiota on the maturation of childhood mucosal and systemic immune responses. Clin. Exp. Allergy 2009, 39, 1842–1851. [Google Scholar] [CrossRef] [PubMed] [Green Version]
- Heintz-Buschart, A.; Wilmes, P. Human Gut Microbiome: MFunction Matters. Trends Microbiol. 2018, 26, 563–574. [Google Scholar] [CrossRef] [PubMed]
- Sun, M.; Wu, W.; Liu, Z.; Cong, Y. Microbiota metabolite short chain fatty acids, GPCR, and inflammatory bowel diseases. J. Gastroenterol. 2017, 52, 1–8. [Google Scholar] [CrossRef]
- Canova, C.; Zabeo, V.; Pitter, G.; Romor, P.; Baldovin, T.; Zanotti, R.; Simonato, L. Association of maternal education, early infections, and antibiotic use with celiac disease: A population-based birth cohort study in northeastern Italy. Am. J. Epidemiol. 2014, 180, 76–85. [Google Scholar] [CrossRef] [PubMed] [Green Version]
- Sollid, L. Coeliac disease: Dissecting a complex inflammatory disorder. Nat. Rev. Immunol. 2002, 2, 647–655. [Google Scholar] [CrossRef]
- Casellas, L.R.F.; Rodrigo, L.; Vivancos, S.R.P.; Riestra, S.; Pantiga, C.; Baudet, J.S.; Junquera, F.; Diví, V.P.; Abadia, C.; Papo, M.; et al. Factors that impact health-related quality of life in adults with celiac disease: A multicenter study. World J. Gastroenterol. 2008, 14, 46–52. [Google Scholar] [CrossRef] [Green Version]
- Böttcher, M.F.; Häggström, P.; Björkstén, B.; Jenmalm, M.C. Total and allergen-specific immunoglobulin A levels in saliva in relation to the development of allergy in infants up to 2 years of age. Clin. Exp. Allergy 2002, 32, 1293–1298. [Google Scholar] [CrossRef]
- Sanz, Y.; Sanchez, E.; Marzotto, M.; Calabuig, M.; Torriani, S.; Dellaglio, F. Differences in faecal bacterial communities in coeliac and healthy children as detected by PCR and denaturing gradient gel electrophoresis. FEMS Immunol. Med. Microbiol. 2007, 51, 562–568. [Google Scholar] [CrossRef] [Green Version]
- Zafar, H.; Saier, M.H. Gut Bacteroides species in health and disease. Gut Microbes 2021, 13, 1848158. [Google Scholar] [CrossRef]
- Sandine, W. Roles of Lactobacillus in the Intestinal Tract. J. Food Prot. 1979, 42, 259–262. [Google Scholar] [CrossRef]
- Eslami, S.; Hadjati, J.; Motevaseli, E.; Mirzaei, R.; Bonab, S.F.; Ansaripour, B.; Khoramizadeh, M.R. Lactobacillus crispatus strain SJ-3C-US induces human dendritic cells (DCs) maturation and confers an anti-inflammatory phenotype to DCs. APMIS 2016, 124, 697–710. [Google Scholar] [CrossRef] [PubMed]
- Garcia-Mazcorro, J.F.; Rivera-Gutierrez, X.; Cobos-Quevedo, O.J.; Grube-Pagola, P.; Meixueiro-Daza, A.; Hernandez-Flores, K.; Cabrera-Jorge, F.J.; Vivanco-Cid, H.; Dowd, S.E.; Remes-Troche, J.M. First Insights into the Gut Microbiota of Mexican Patients with Celiac Disease and Non-Celiac Gluten Sensitivity. Nutrients 2018, 10, 1641. [Google Scholar] [CrossRef] [PubMed] [Green Version]
- Wieser, H.; Ruiz-Carnicer, Á.; Segura, V.; Comino, I.; Sousa, C. Challenges of Monitoring the Gluten-Free Diet Adherence in the Management and Follow-Up of Patients with Celiac Disease. Nutrients 2021, 13, 2274. [Google Scholar] [CrossRef] [PubMed]
- Francino, M.P. Antibiotics and the Human Gut Microbiome: Dysbioses and Accumulation of Resistances. Front. Microbiol. 2016, 6, 1543. [Google Scholar] [CrossRef] [Green Version]
- Wieërs, G.; Belkhir, L.; Enaud, R.; Leclercq, S.; Philippart de Foy, J.M.; Dequenne, I.; de Timary, P.; Cani, P.D. How Probiotics Affect the Microbiota. Front. Cell. Infect. Microbiol. 2020, 9, 454. [Google Scholar] [CrossRef] [Green Version]

| Study | Year | Country | Study Design | CD on GFD | Healthy | UCD | Duration of Treatment with Gluten-Free Diet (Months) |
|---|---|---|---|---|---|---|---|
| Nadal I. et al. [16] | 2007 | Spain | CSS | 10 | 8 | 20 | 12–24 |
| Collado M. et al. [22] | 2008 | Spain | CSS | 18 | 30 | 30 | min 24 |
| Di Cagno R. et al. [19] | 2009 | Italy | CSS | 7 | 7 | 7 | min 24 |
| Schippa S. et al. [14] | 2010 | Italy | CSS | 20 | 10 | 20 | 9 |
| De Palma G. et al. [17] | 2010 | Spain | CSS | 18 | 20 | 24 | min 24 |
| Di Cagno R. et al. [13] | 2011 | Italy | CSS | 19 | 15 | 0 | min 24 |
| Kalliomäki M. et al. [18] | 2012 | Finland | CSS | 6 | 9 | 10 | min 12 |
| Nistal E. et al. [20] | 2012 | Spain | CSS | 11 | 11 | 10 | min 24 |
| Sanchez E. et al. [23] | 2013 | Spain | CSS | 17 | 8 | 32 | min 24 |
| Pirjo W. et al. [15] | 2014 | Finland | CSS | 34 | 0 | 0 | min 36 |
| Lorenzo Pisarello M.J. et al. [25] | 2015 | Argentina | CSS | 15 | 15 | 0 | min 6 |
| Serena G. et al. [24] | 2019 | USA | CSS | 8 | 10 | 10 | min 6 |
| Panelli S. et al. [21] | 2020 | Italy | CSS | 29 | 31 | 13 | 36 (median) |
| Study | Age (Years) Mean ±SD | Sex (% Male) | Antibiotic Treatment | AGA | tGA | HLA | ||||||||||
|---|---|---|---|---|---|---|---|---|---|---|---|---|---|---|---|---|
| CD on GFD | Healthy | UCD | CD on GFD | Healthy | UCD | CD on GFD | Healthy | UCD | CD on GFD | Healthy | UCD | CD on GFD | Healthy | UCD | ||
| Di Cagno R. et al. [13] | 9.7 (6–12) 1 | 10.4 (6–12) 1 | N/A | 42 | 47 | N/A | no last 3 mo | N/A | N/A | N/A | N/A | N/A | N/A | N/A | N/A | N/A |
| Lorenzo Pisarello M.J. et al. [25] | 7.5 | 6.5 | N/A | N/A | N/A | N/A | no last 1 mo | negative | N/A | N/A | negative | N/A | N/A | N/A | N/A | N/A |
| Schippa S. et al. [14] | N/A | 11.7 (7.8–20.8) | 8.3 (1.2–16.1) | 40 | 30 | 40 | no last 3 mo | positive | N/A | N/A | positive | N/A | N/A | N/A | N/A | N/A |
| Pirjo W. et al. [15] | N/A | N/A | N/A | N/A | N/A | N/A | No | N/A | N/A | N/A | 0.3 | 0.8 | N/A | 65% DQ2/DQ8 | N/A | N/A |
| Nadal I. et al. [16] | 5.1 | 4.1 | N/A | N/A | N/A | N/A | no last 1 mo | positive | N/A | N/A | positive | N/A | N/A | N/A | N/A | N/A |
| De Palma G. et al. [17] | 5.5 | 5.3 | 5.5 | N/A | N/A | N/A | no last 1 mo | N/A | N/A | N/A | N/A | N/A | N/A | N/A | N/A | N/A |
| Kalliomäki M. et al. [18] | 46 | 8.5 | 9.5 | N/A | N/A | N/A | N/A | N/A | N/A | N/A | negative | negative | positive | N/A | N/A | N/A |
| Di Cagno R. et al. [19] | N/A | N/A | N/A | N/A | N/A | N/A | no last 1 mo | N/A | N/A | N/A | N/A | N/A | N/A | N/A | N/A | N/A |
| Nistal E. et al. [20] | 40.4 | 30.9 | 38.5 | N/A | N/A | N/A | no last 1 mo | N/A | N/A | N/A | negative | negative | positive | N/A | 0% DQ2/DQ8 | N/A |
| Panelli S. et al. [21] | 37+/−6 | 44+/−17 | 35+/−6 | 31 | 23 | 15 | no last 1 mo | N/A | N/A | N/A | N/A | N/A | N/A | 58% DQ2+, 3% DQ8+, 7% DQ2/DQ8+ | 32% DQ2+, 10% DQ2+, 3% DQ2/DQ8+, 26% DQ2/DQ8- | 62% DQ2+, 0% DQ8+, 23% DQ2/DQ8+ |
| Serena G. et al. [24] | N/A | N/A | N/A | N/A | N/A | N/A | no last 1 mo | N/A | N/A | N/A | negative | N/A | positive | N/A | N/A | N/A |
| Collado M. et al. [22] | 5.43 | 3.75 | 4.7 | 44.4 | 43.3 | 40 | no last 1 mo | negative | negative | positive | negative | negative | positive | DQ2+-100% | N/A | DQ2+-100% |
| Sanchez E. et al. [23] | 5.9 | 6.9 | 5.1 | 47.1 | 50 | 43.7 | no last 1 mo | negative | negative | positive | negative | negative | positive | DQ2/DQ8 100% | N/A | DQ2/DQ8 100% |
| Study | Type of Samples | Method | Abundance | p-Value | ||
|---|---|---|---|---|---|---|
| CD on GFD | Healthy | UCD | ||||
| Di Cagno R. et al. [13] | Duodenal biopsy and faecal samples | 16S rRNA sequencing | Bifidobacteria 5.34 | Bifidobacteria 6.72 | N/A | p = 0.023 |
| Lactobacilli 8.1 | Lactobacilli 8.6 | p > 0.05 | ||||
| Enterococci 7.83 | Enterococci 8.23 | p > 0.05 | ||||
| Bacteroides 6.02 | Bacteroides 5 | p = 0.014 | ||||
| Staphylococci 7.6 | Staphylococci 7 | p > 0.05 | ||||
| Salmonella, Shigella, Klebsiella 7.26 | Salmonella, Shigella, Klebsiella 7.3 | p > 0.05 | ||||
| Enterobacteria 6.7 | Enterobacteria 6.4 | p > 0.05 | ||||
| Clostridium 1 1 | Clostridium 1 1 | p > 0.05 | ||||
| Lorenzo Pisarello M.J. et al. [25] | Faecal samples | bacterial culture | Anaerobic (1.37 ± 5.47) × 109 CFU/g | Anaerobic (2.09 ± 9.08) × 109 CFU/g | N/A | p > 0.05 |
| Aerobic (1.54 ± 5.47) × 109 | Aerobic (3.31 ± 2.57) × 109 | p > 0.05 | ||||
| Enterobacteria (1.18 ± 7.69) × 106 CFU/g | Enterobacteria (6.60 ± 5.23) × 105 CFU/g | p > 0.05 | ||||
| Lactobacillus (4.38 ± 3.14) × 105 | Lactobacillus (4.00 ± 2.45) × 106; | p < 0.05 | ||||
| Schippa S. et al. [14] | Duodenal biopsy | 16S rDNA Sequencing | Bacteroides vulgatus 85% | Bacteroides vulgatus 94.7% | Bacteroides vulgatus 20% | p < 0.001 |
| E. coli 95% | E. coli 20% | p < 0.001 | ||||
| Bifidobacterium 30% | Parabacteroides distasonis 0 6 | Bifidobacterium 20% 6 | p > 0.05 | |||
| Parabacteroides distasonis 31.6% 6 | p = 0.009 | |||||
| Pirjo W. et al. [15] | Duodenal biopsy | 16S rDNA Sequencing | Bacteroidetes 15% | Bacteroidetes 25% | N/A | p = 0.01 |
| Firmicutes 33% | Firmicutes 46% | p = 0.05 | ||||
| Proteobacteria 40% | Proteobacteria 21% | p = 0.04 | ||||
| 72 OTUs per sample | 106 OTUs per sample | |||||
| Nadal I. et al. [16] | Duodenal biopsy | FISH and flow cytometry | Bacteroides–Prevotella 12.98% 2 | Bacteroides–Prevotella 6.07 | Bacteroides–Prevotella 4.52 | p = 0.027 |
| Escherichia coli 10.98% 2 | Escherichia coli 5.04 | Escherichia coli 4.1 | p = 0.027 | |||
| Streptococcus–Lactococcus 10.88% 2 | Streptococcus–Lactococcus 7.18 | Streptococcus–Lactoco 9.44 | p > 0.05 | |||
| Bifidobacterium 9.24% 2 | Bifidobacterium 10.55 | Bifidobacterium 4.32 | p > 0.05 | |||
| De Palma G. et al. [17] | Faecal samples | FISH and FCM | Bifidobacterium 9.20% 2 | Bifidobacterium 12.54% 2 | Bifidobacterium 7.73% 2 | p = 0.009 |
| C. histolyticum 9.41% 2 | C. histolyticum 11.61% 2 | C. histolyticum 5.26% 2 | p = 0.031 | |||
| C. lituseburense 4.41% 2 | C. lituseburense 6.83% 2 | C. lituseburense 3.23% 2 | p = 0.024 | |||
| Lactobacillus-Enterococcus 1.12% 2 | Lactobacillus-Enterococcus 1.76% 2 | Lactobacillus-Enterococcus 1.94% 2 | p > 0.05 | |||
| Staphylococcus 16.49% 2 | Staphylococcus 18.04% 2 | Staphylococcus 10.36% 2 | p > 0.05 | |||
| Bacteroides-Prevotella 2.61% 2 | Bacteroides-Prevotella 2.32% 2 | Bacteroides-Prevotella 3.54% 2 | p = 0.033 | |||
| E. coli 6.39% 2 | E. coli 7.32% 2 | E. coli 5.2% 2 | p > 0.05 | |||
| F. prausnitzii 11.09% 2 | F. prausnitzii 13.88% 2 | F. prausnitzii 6.03% 2 | p = 0.045 | |||
| Sulphate-reducing bacteria 9.82% 2 | Sulphate-reducing bacteria 10.02% 2 | Sulphate-reducing bacteria 9.58% 2 | p > 0.05 | |||
| Kalliomäki M. et al. [18] | Small intestinal biopsy | qPCR | Bacteroides-Prevotella-Porphyromona group 1682 | Bacteroides-Prevotella-Porphyromonas group 684 | Bacteroides-Prevotella-Porphyromonas group 834 | p > 0.05 |
| Bifidobacterium genus 140 | Bifidobacterium genus 190 | Bifidobacterium genus 234 | p > 0.05 | |||
| Bifidobacterium adolescentis 5 5 | Bifidobacterium adolescentis 14 5 | Bifidobacterium adolescentis 10 5 | p > 0.05 | |||
| Di Cagno R. et al. [19] | Faecal samples | 16S rRNA sequencing RAPD-PCR analysis | Lactic acid bacteria 8.09 | Lactic acid bacteria 8.89 | Lactic acid bacteria 8.02 | p > 0.05 |
| Bifidobacterium 6.83 | Bifidobacterium 7.88 | Bifidobacterium 5.51 | p = 0.03 | |||
| Bacteroides 8.31 | Bacteroides 7.05 | Bacteroides 8.69 | p = 0.045 | |||
| Clostridium 8.07 | Clostridium 5.50 | Clostridium 8.04 | p = 0.045 | |||
| Staphylococcus/Micrococcus 7.42 | Staphylococcus/Micrococcus 8.05 | Staphylococcus/Micrococcus 6.00 | p > 0.05 | |||
| Enterobacteriaceae | Enterobacteriaceae 8.05 | Enterobacteriaceae 6.69 | p > 0.05 | |||
| Total anaerobes 9.63 1 | Total anaerobes 10.03 1 | Total anaerobes 9.87 1 | p > 0.05 | |||
| Nistal E. et al. [20] | Faecal samples | SCFAs, DGGE | Lactobacillus sakei 0% | Lactobacillus sakei 45% | Lactobacillus sakei 40% | p < 0.05 |
| Bifidobacterium bifidum 18% | Bifidobacterium bifidum 9% | Bifidobacterium bifidum 60% | p < 0.05 | |||
| Bifidobacterium catenulatum 18% | Bifidobacterium catenulatum 36% | Bifidobacterium catenulatum 80% | p < 0.05 | |||
| Bifidobacterium sp.0% 6 | Bifidobacterium sp. 45% 6 | Bifidobacterium sp. 20% 6 | p < 0.05 | |||
| Panelli S. et al. [21] | Saliva samples, duodenal biopsy and faecal samples | 16S rRNA sequencing | Duodenal samples: | duodenal samples | duodenal samples: | |
| Bacteroidetes 28.08% | Bacteroidetes 20.76% | Bacteroidetes 18.20% | p < 0.05 | |||
| Actinobacteria 7.94% | Actinobacteria 11.1% | Actinobacteria 4.15% | p < 0.05 | |||
| Proteobacteria 19.21% | Proteobacteria 17.89% | Proteobacteria 35.48% | p < 0.05 | |||
| Streptococcaceae 18.34% | Streptococcaceae 25.77% | Streptococcaceae 22.77% | p < 0.05 | |||
| Gemellaceae 1.51% | Gemellaceae 2.17% | Gemellaceae 0.83% | p < 0.05 | |||
| Veillonellaceae 8.95% | Veillonellaceae 7.37% | Veillonellaceae 4.50% | p < 0.05 | |||
| Lachnospiraceae 3.26% | Lachnospiraceae 2.71% | Lachnospiraceae 2.00% | p < 0.05 | |||
| Prevotellaceae 17.8% | Prevotellaceae 12.1% | Prevotellaceae 6.80% | p < 0.05 | |||
| Micrococcaceae 4.98% | Micrococcaceae 7.51% | Micrococcaceae 2.27% | p < 0.05 | |||
| Neisseriaceae 7.91% | Neisseriaceae 3.95% | Neisseriaceae 16.14% | p < 0.05 | |||
| Stool samples: | Stool samples: | Stool samples: | ||||
| Bacteroidetes 59.99% | Bacteroidetes 51.97% | Bacteroidetes 44.27% | p < 0.05 | |||
| Firmicutes 34.21% | Firmicutes 36.39% | Firmicutes 47.83% | p < 0.05 | |||
| Actinobacteria 0.82% | Actinobacteria 1.96% | Actinobacteria 2.93% | p < 0.05 | |||
| Proteobacteria 3.96% | Proteobacteria 6.9% | Proteobacteria 3.12% | ||||
| Coriobacteriaceae 0.12% | Coriobacteriaceae 0.14% | Coriobacteriaceae 1.39% | p < 0.05 | |||
| Clostridiaceae 0.57% | Clostridiaceae 0.18% | Clostridiaceae 0.63% | p < 0.05 | |||
| Veillonellaceae 6.35% | Veillonellaceae 6.35% | Veillonellaceae 2.4% | p < 0.05 | |||
| Erysipelitrichaceae 0.44% | Erysipelitrichaceae 0.30% | Erysipelitrichaceae 1.14% | p < 0.05 | |||
| Ruminococcaceae 13.94% | Ruminococcaceae 23.52% | Ruminococcaceae 23.52% | p < 0.05 | |||
| Coriobacteriaceae 0.12% | Coriobacteriaceae 0.14% | Coriobacteriaceae 1.39% | p > 0.05 | |||
| Enterobacteriaceae 2.13% | Enterobacteriaceae 0.46% | Enterobacteriaceae 1.84% | p > 0.05 | |||
| Pasteurellaceae 0.41% | Pasteurellaceae 2.32% | Pasteurellaceae 0.56% | p > 0.05 | |||
| Serena G. et al. [24] | Blood samples and faecal samples | 16S rRNA sequencing | blood samples: | blood samples: | blood samples: | |
| Proteobacteria 41.26% | Proteobacteria 42.34% | Proteobacteria 49.16% | p > 0.05 | |||
| Actinobacteria 8.16% | Actinobacteria 8.42% | Actinobacteria 9.44% | p > 0.05 | |||
| Bacteroidetes 6.39% | Bacteroidetes 5.87% | Bacteroidetes 7.87% | p > 0.05 | |||
| Firmicutes 36.36% | Firmicutes 32.07% | Firmicutes 26.44% | p > 0.05 | |||
| Other 7.83% | Other 11.3% | Other 7.09% | p > 0.05 | |||
| faecal samples: | faecal samples: | faecal samples: | ||||
| Firmicutes 71.41% | Firmicutes 77.37% | Firmicutes 57.8% | p < 0.05 | |||
| Bacteroidetes 11.87% | Bacteroidetes 13.01% | Bacteroidetes 31.86% | p < 0.05 | |||
| Other 16.72% | Other 9.62% | Other 10.34% | p > 0.05 | |||
| Collado M. et al. [22] 3 | Duodenal biopsy and faecal samples | qPCR | Study—Treated CD faecal samples: | Healthy faecal samples: | Untreated CD faecal samples: | |
| Bifidobacterium—8.77 (8.58–9.60) | Bifidobacterium—9.80 (9.23–10.33) | Bifidobacterium—8.67 (8.68–9.90) | p < 0.05 | |||
| Bacteroides—8.55 (8.30–8.90) | Bacterioides—8.13 (7.41–8.53) | Bacterioides—8.71 (8.05–9.00) | p < 0.05 | |||
| Staphylococcus—6.58 (6.28–6.88) | Staphylococcus—6.78 (6.26–7.18) | Staphylococcus—7.07 (6.06–7.35) | p < 0.05 | |||
| C. coccoides—9.00 (8.41–9.56) | C. coccoides—9.00 (8.23–9.79) | C. coccoides—9.03 (8.50–9.52) | p > 0.05 | |||
| C. leptum—9.17 (8.86–9.74) | C. leptum—8.42 (7.89–8.74) | C. leptum—8.88 (8.10–9.50) | p < 0.05 | |||
| Lactobacillus—6.68 (6.26–7.30) | Lactobacillus—6.39 (6.08–6.85) | Lactobacillus—6.34 (6.06–6.95) | p < 0.05 | |||
| E. coli—7.05 (6.20–7.64) | E. coli—6.40 (6.21–6.56) | E. coli—7.11 (6.50–8.01) | p < 0.05 | |||
| A. muciniphilia—7.01 (5.80–7.44) | A. muciniphilia—5.75 (4.96–7.40) | A. muciniphilia—7.00 (5.65–8.00) | p > 0.05 | |||
| duodenal biopsy: | duodenal biopsy: | duodenal biopsy: | ||||
| Bifidobacterium—6.15 (4.97–6.28) | Bifidobacterium—6.27 (6.03–6.80) | Bifidobacterium—5.95 (5.55–6.21) | p < 0.05 | |||
| Bacterioides—4.98 (3.98–5.00) | Bacteroides—3.28 (2.25–4.10) | Bacteroides—4.97 (4.03–5.20) | p < 0.05 | |||
| Staphylococcus—2.67 (2.12–3.00) | Staphylococcus—2.35 (1.25–2.77) | Staphylococcus—3.97 (3.44–4.06) | p < 0.05 | |||
| C. coccoides—3.70 (3.30–4.12) | C. coccoides—4.06 (3.70- 4.70) | C. coccoides—4.00 (3.65–4.25) | p > 0.05 | |||
| C. leptum—3.98 (3.23–4.15) | C. leptum—3.65 (3.05–4.52) | C. leptum—4.56 (4.42–4.70) | p < 0.05 | |||
| Lactobacillus—2.70 (2.58–3.46) | Lactobacillus—3.12 (2.74–4.14) | Lactobacillus—4.92 (4.16–5.25) | p < 0.05 | |||
| E. coli—3.18 | E. coli—3.04 | E. coli—4.23 (3.99–4.47) | p < 0.05 | |||
| A. muciniphila—N/A | A. muciniphila—2.78 (2.50–3.38) | A. muciniphila—2.95 (2.74—4.00) | p > 0.05 | |||
| Sanchez E. et al. [23] 1 | Duodenal biopsy | 16S rRNA sequencing | Enterobacteriaceae—4 | Enterobacteriaceae—0 | Enterobacteriaceae—22 | N/A |
| Actinobacteria—2 | Actinobacteria—4 | Actinobacteria—15 | ||||
| Staphylococcaceae—8 | Staphylococcaceae—2 | Staphylococcaceae—32 | ||||
| Streptococcaceae—58 | Streptococcaceae—58 | Streptococcaceae—59 | ||||
| Clostridiaceae—2 | Clostridiaceae—3 | Clostridiaceae—4 | ||||
| Lactobacillaceae—0 | Lactobacillaceae—2 | Lactobacillaceae—0 | ||||
| Enterococcaceae—0 | Enterococcaceae—0 | Enterococcaceae—2 | ||||
| Veillonellaceae—2 | Veillonellaceae—0 | Veillonellaceae—3 | ||||
| Carnobacteriaceae—4 4 | Carnobacteriaceae—1 4 | Carnobacteriaceae—2 4 | ||||
Publisher’s Note: MDPI stays neutral with regard to jurisdictional claims in published maps and institutional affiliations. |
© 2022 by the authors. Licensee MDPI, Basel, Switzerland. This article is an open access article distributed under the terms and conditions of the Creative Commons Attribution (CC BY) license (https://creativecommons.org/licenses/by/4.0/).
Share and Cite
Kaliciak, I.; Drogowski, K.; Garczyk, A.; Kopeć, S.; Horwat, P.; Bogdański, P.; Stelmach-Mardas, M.; Mardas, M. Influence of Gluten-Free Diet on Gut Microbiota Composition in Patients with Coeliac Disease: A Systematic Review. Nutrients 2022, 14, 2083. https://doi.org/10.3390/nu14102083
Kaliciak I, Drogowski K, Garczyk A, Kopeć S, Horwat P, Bogdański P, Stelmach-Mardas M, Mardas M. Influence of Gluten-Free Diet on Gut Microbiota Composition in Patients with Coeliac Disease: A Systematic Review. Nutrients. 2022; 14(10):2083. https://doi.org/10.3390/nu14102083
Chicago/Turabian StyleKaliciak, Iwona, Konstanty Drogowski, Aleksandra Garczyk, Stanisław Kopeć, Paulina Horwat, Paweł Bogdański, Marta Stelmach-Mardas, and Marcin Mardas. 2022. "Influence of Gluten-Free Diet on Gut Microbiota Composition in Patients with Coeliac Disease: A Systematic Review" Nutrients 14, no. 10: 2083. https://doi.org/10.3390/nu14102083
APA StyleKaliciak, I., Drogowski, K., Garczyk, A., Kopeć, S., Horwat, P., Bogdański, P., Stelmach-Mardas, M., & Mardas, M. (2022). Influence of Gluten-Free Diet on Gut Microbiota Composition in Patients with Coeliac Disease: A Systematic Review. Nutrients, 14(10), 2083. https://doi.org/10.3390/nu14102083