
Association of Sugar-Sweetened Beverages and Cardiovascular Diseases Mortality in a Large Young Cohort of Nearly 300,000 Adults (Age 20–39)

Abstract
:1. Introduction
2. Materials and Methods
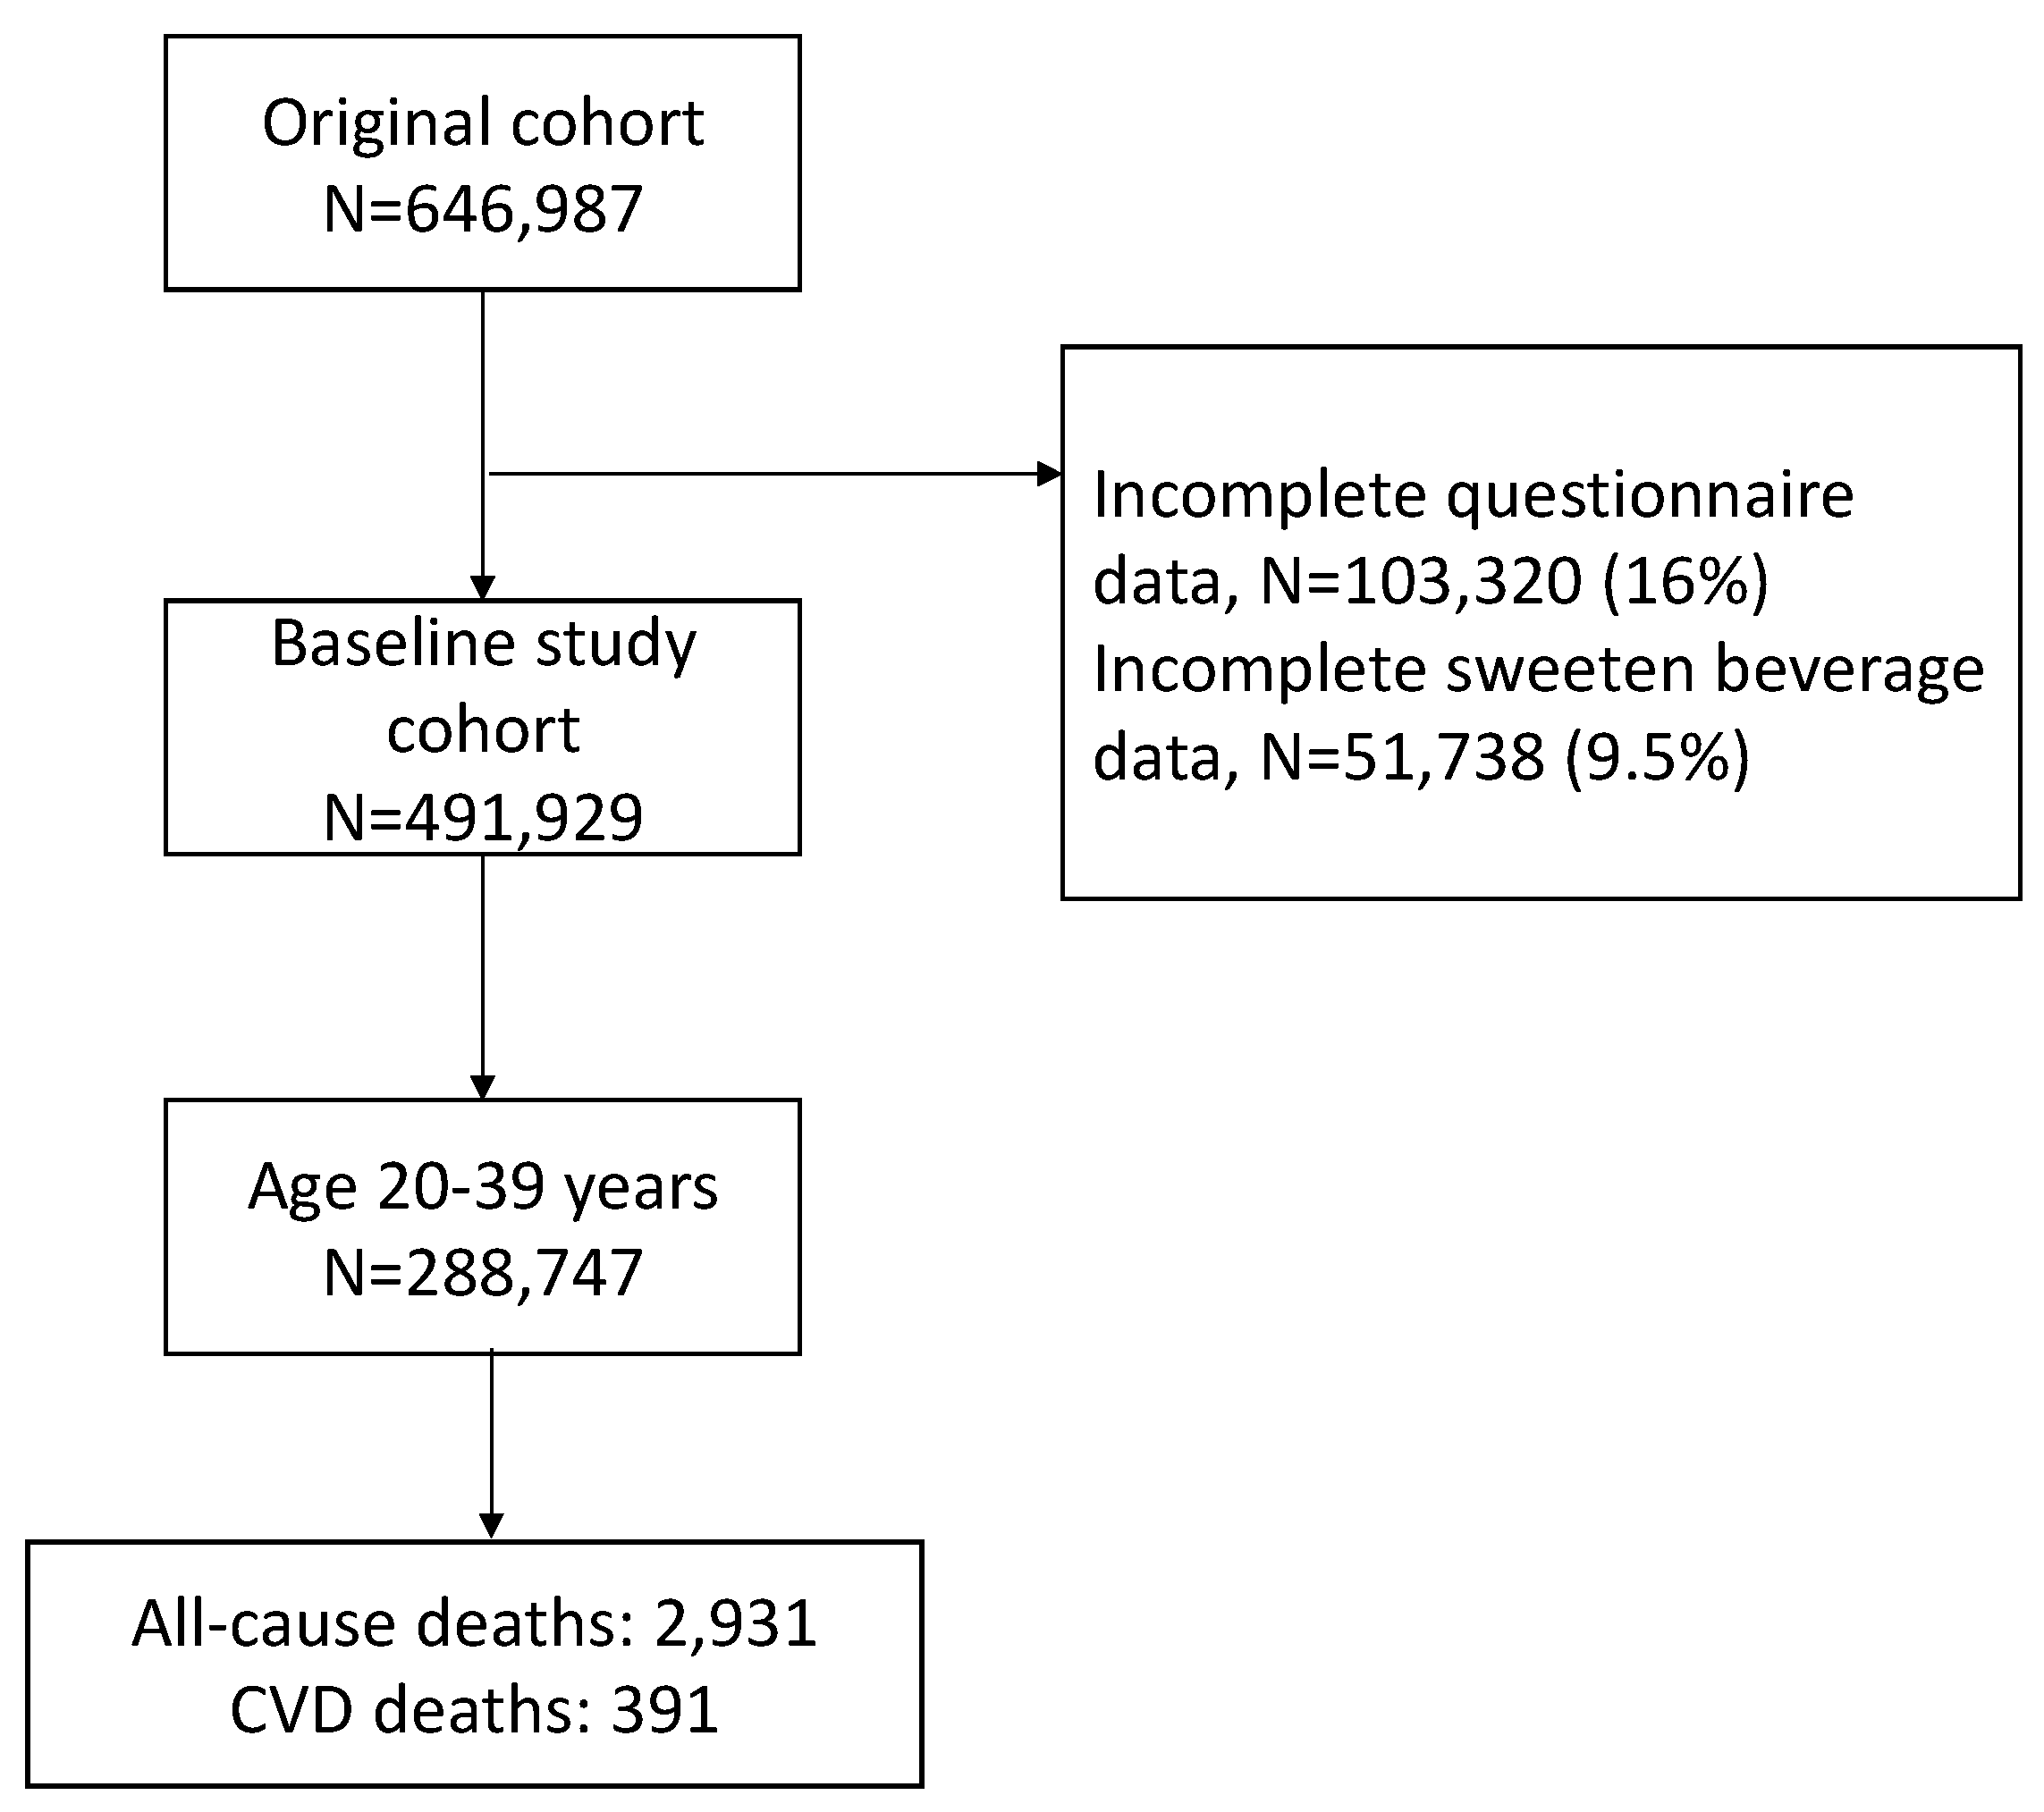
2.1. Study Population
2.2. Laboratories and Questionnaires
2.3. Assessment of Outcome
2.4. Statistical Analysis
3. Results
3.1. Population Distribution of SSB Consumption
3.2. SSB Consumption and Mortality Risks of CVD
3.3. Stratified Analyses for Association of SSB Intake with CVD Mortality
4. Discussion
Author Contributions
Funding
Institutional Review Board Statement
Informed Consent Statement
Data Availability Statement
Conflicts of Interest
Abbreviations
References
- Mensah, G.A.; Roth, G.A.; Fuster, V. The global burden of cardiovascular diseases and risk factors: 2020 and beyond. J. Am. Coll. Cardiol. 2019, 74, 2529–2532. [Google Scholar] [CrossRef] [PubMed]
- GBD 2017 Causes of Death Collaborators. Global, regional, and national age-sex-specific mortality for 282 causes of death in 195 countries and territories, 1980–2017: A systematic analysis for the global burden of disease study 2017. Lancet 2018, 392, 1736–1788. [Google Scholar] [CrossRef] [Green Version]
- GBD DALYs Hale Collaborators. Global, regional, and national disability-adjusted life-years (DALYs) for 359 diseases and injuries and healthy life expectancy (HALE) for 195 countries and territories, 1990–2017: A systematic analysis for the global burden of disease study 2017. Lancet 2018, 392, 1859–1922. [Google Scholar] [CrossRef] [Green Version]
- Gulati, R.; Behfar, A.; Narula, J.; Kanwar, A.; Lerman, A.; Cooper, L.; Singh, M. Acute myocardial infarction in young individuals. Mayo Clin. Proc. 2020, 95, 136–156. [Google Scholar] [CrossRef] [Green Version]
- Kannel, W.B.; Abbott, R.D. Incidence and prognosis of unrecognized myocardial infarction. An update on the framingham study. N. Engl. J. Med. 1984, 311, 1144–1147. [Google Scholar] [CrossRef]
- Aarnio, K.; Siegerink, B.; Pirinen, J.; Sinisalo, J.; Lehto, M.; Haapaniemi, E.; Nave, A.H.; Kaste, M.; Tatlisumak, T.; Putaala, J. Cardiovascular events after ischemic stroke in young adults: A prospective follow-up study. Neurology 2016, 86, 1872–1879. [Google Scholar] [CrossRef]
- Bejot, Y.; Bailly, H.; Durier, J.; Giroud, M. Epidemiology of stroke in Europe and trends for the 21st century. Presse Med. 2016, 45, e391–e398. [Google Scholar] [CrossRef]
- Bejot, Y.; Daubail, B.; Jacquin, A.; Durier, J.; Osseby, G.V.; Rouaud, O.; Giroud, M. Trends in the incidence of ischaemic stroke in young adults between 1985 and 2011: The dijon stroke registry. J. Neurol. Neurosurg. Psychiatry 2014, 85, 509–513. [Google Scholar] [CrossRef] [Green Version]
- Ekker, M.S.; Boot, E.M.; Singhal, A.B.; Tan, K.S.; Debette, S.; Tuladhar, A.M.; de Leeuw, F.-E. Epidemiology, aetiology, and management of ischaemic stroke in young adults. Lancet Neurol. 2018, 17, 790–801. [Google Scholar] [CrossRef]
- Feigin, V.L.; Roth, G.A.; Naghavi, M.; Parmar, P.; Krishnamurthi, R.; Chugh, S.; Norrving, B.; Shiue, I.; Ng, M. Global burden of stroke and risk factors in 188 countries, during 1990–2013: A systematic analysis for the global burden of disease study 2013. Lancet Neurol. 2016, 15, 913–924. [Google Scholar] [CrossRef] [Green Version]
- Griffiths, D.; Sturm, J. Epidemiology and etiology of young stroke. Stroke Res. Treat. 2011, 2011, 209370. [Google Scholar] [CrossRef] [PubMed] [Green Version]
- Sarfo, F.S.; Ovbiagele, B.; Gebregziabher, M.; Wahab, K.; Akinyemi, R.; Akpalu, A.; Akpa, O.; Obiako, R.; Owolabi, L.; Jenkins, C.; et al. Stroke among young west africans evidence from the siren (stroke investigative research and educational network) large multisite case-control study. Stroke 2018, 49, 1116–1122. [Google Scholar] [CrossRef] [PubMed]
- Yin, J.W.; Zhu, Y.L.; Malik, A.S.T.; Li, X.Q.; Peng, X.L.; Zhang, F.F.; Shan, Z.; Liu, L. Intake of sugar-sweetened and low-calorie sweetened beverages and risk of cardiovascular disease: A meta-analysis and systematic review. Adv. Nutr. 2021, 12, 89–101. [Google Scholar] [CrossRef] [PubMed]
- Centers for Disease Control and Prevention. Get the facts: Sugar-Sweetened Beverages and Consumption. 2021. Available online: https://www.cdc.gov/nutrition/data-statistics/sugar-sweetened-beverages-intake.html (accessed on 30 May 2022).
- Malik, V.S.; Willett, W.C.; Hu, F.B. Global obesity: Trends, risk factors and policy implications. Nat. Rev. Endocrinol. 2013, 9, 13–27. [Google Scholar] [CrossRef] [PubMed]
- Bernstein, A.M.; de Koning, L.; Flint, A.J.; Rexrode, K.M.; Willett, W.C. Soda consumption and the risk of stroke in men and women. Am. J. Clin. Nutr. 2012, 95, 1190–1199. [Google Scholar] [CrossRef]
- Fung, T.T.; Malik, V.S.; Rexrode, K.M.; Manson, J.E.; Willett, W.C.; Hu, F.B. Sweetened beverage consumption and risk of coronary heart disease. Am. J. Clin. Nutr. 2009, 89, 1037–1042. [Google Scholar] [CrossRef] [Green Version]
- de Koning, L.; Malik, V.S.; Kellogg, M.D.; Rimm, E.B.; Willett, W.C.; Hu, F.B. Sweetened beverage consumption, incident croronary heart disease, and biomarkers of risk in men. Circulation 2012, 125, 1735–1741. [Google Scholar] [CrossRef] [Green Version]
- Pase, M.P.; Himali, J.J.; Beiser, A.S.; Aparicio, H.J.; Satizabal, C.L.; Vasan, R.S.; Seshadri, S.; Jacques, P.F. Sugar-and artifically sweetened beverages and the risks of incident stroke and dementia: A prospective cohort study. Stroke 2017, 48, 1139–1146. [Google Scholar] [CrossRef] [Green Version]
- Anderson, J.J.; Gray, S.R.; Welsh, P.; Mackay, D.F.; Celis-Morales, C.A.; Lyall, D.M.; Forbes, J.; Sattar, N.; Gill, J.M.R.; Pell, J.P. The associations of sugar-sweetened, artificially sweetened and naturally sweet juices with all-cause mortality in 198,285 UK biobank participants: A prospective cohort study. BMC Med. 2020, 18, 97. [Google Scholar] [CrossRef] [Green Version]
- Lichtenstein, A.H. Last nail in the coffin for sugar-sweetened beverages. Circulation 2019, 139, 2126–2128. [Google Scholar] [CrossRef]
- Malik, V.S.; Li, Y.P.; Pan, A.; De Koning, L.; Schernhammer, E.; Willett, W.C.; Hu, F.B. Long-term consumption of sugar-sweetened and artificially sweetened beverages and risk of mortality in us adults. Circulation 2019, 139, 2113–2125. [Google Scholar] [CrossRef] [PubMed]
- Mullee, A.; Romaguera, D.; Pearson-Stuttard, J. Association between soft drink consumption and mortality in 10 european countries. JAMA Intern. Med. 2019, 179, 1607. [Google Scholar] [CrossRef] [Green Version]
- Scheffers, F.R.; Boer, J.M.A. Sugar intake and all-cause mortality-differences between sugar-sweetened beverages, artificially sweetened beverages, and pure fruit juices. BMC Med. 2020, 18, 112. [Google Scholar] [CrossRef] [Green Version]
- Zhang, Y.B.; Chen, J.X.; Jiang, Y.W.; Xia, P.F.; Pan, A. Association of sugar-sweetened beverage and artificially sweetened beverage intakes with mortality: An analysis of us national health and nutrition examination survey. Eur. J. Nutr. 2021, 60, 1945–1955. [Google Scholar] [CrossRef]
- Kim, S.O.; Bae, E.M.; Lee, Y.N.; Son, J.S. Association between consumption of sugar-sweetened beverages and risk of cardiovascular disease in Korean men: Analysis based on the Korean National Health and Nutrition Examination Survey 2014–2016. Korean J. Fam. Med. 2021, 42, 212–218. [Google Scholar] [CrossRef]
- Li, H.; Liang, H.; Yang, H.; Zhang, X.; Ding, X.; Zhang, R.; Mao, Y.; Liu, Z.; Kan, Q.; Sun, T. Association between intake of sweetened beverages with all-cause and cause-specific mortality: A systematic review and meta-analysis. J. Public Health 2021, fdab069. [Google Scholar] [CrossRef]
- Yang, Q.; Zhang, Z.; Gregg, E.W.; Flanders, W.D.; Merritt, R.; Hu, F.B. Added sugar intake and cardiovascular diseases mortality among US adults. JAMA Intern. Med. 2014, 174, 516–524. [Google Scholar] [CrossRef] [Green Version]
- Gardener, H.; Rundek, T.; Markert, M.; Wright, C.B.; Elkind, M.S.V.; Sacco, R. Diet soft drink consumption is associated with an increased risk of vascular events in the Northern Manhattan Study. J. Gen. Intern. Med. 2012, 27, 1120–1126. [Google Scholar] [CrossRef] [Green Version]
- Hoare, E.; Varsamis, P.; Owen, N.; Dunstan, D.W.; Jennings, G.L.; Kingwell, B.A. Sugar- and intense-sweetened drinks in australia: A systematic review on cardiometabolic risk. Nutrients 2017, 9, 1075. [Google Scholar] [CrossRef] [Green Version]
- Laclaustra, M.; Rodriguez-Artalejo, F.; Guallar-Castillon, P.; Banegas, J.R.; Graciani, A.; Garcia-Esquinas, E.; Ordovás, J.; López-García, E. Prospective association between added sugars and frailty in older adults. Am. J. Clin. Nutr. 2018, 107, 772–779. [Google Scholar] [CrossRef]
- Neelakantan, N.; Park, S.H.; Chen, G.C.; van Dam, R.M. Sugar-sweetened beverage consumption, weight gain, and risk of type 2 diabetes and cardiovascular disease in Asia: A systematic review. Nutr. Rev. 2022, 80, 50–67. [Google Scholar] [CrossRef] [PubMed]
- Cicero, A.F.G.; Fogacci, F.; Desideri, G.; Grandi, E.; Rizzoli, E.; D’Addato, S.; Borghi, C. Arterial stiffness, sugar-sweetened beverages and fruits intake in a rural population sample: Data from the Brisighella Heart Study. Nutrients 2019, 11, 2674. [Google Scholar] [CrossRef] [Green Version]
- Odegaard, A.O.; Koh, W.P.; Yuan, J.M.; Pereira, M.A. Beverage habits and mortality in Chinese adults. J. Nutr. 2015, 145, 595–604. [Google Scholar] [CrossRef] [PubMed] [Green Version]
- Paganini-Hill, A.; Kawas, C.H.; Corrada, M.M. Non-alcoholic beverage and caffeine consumption and mortality: The leisure world cohort study. Prev. Med. 2007, 44, 305–310. [Google Scholar] [CrossRef] [Green Version]
- Powell, E.S.; Smith-Taillie, L.P.; Popkin, B.M. Added Sugars Intake Across the Distribution of US Children and Adult Consumers: 1977–2012. J. Acad. Nutr. Diet. 2016, 116, 1543–1550.e1. [Google Scholar] [CrossRef] [PubMed] [Green Version]
- Rosinger, A.; Herrick, K.; Gahche, J.; Park, S. Sugar-sweetened Beverage Consumption Among U.S. Youth, 2011–2014. NCHS Data Brief. 2017, 271, 1–8. [Google Scholar]
- Health Promotion Administration. Nutrition and Health Survey in Taiwan, NAHSIT. 2021. Available online: https://www.hpa.gov.tw/Pages/List.aspx?nodeid=3998 (accessed on 31 May 2022).
- Department of Statistics. Ministry of Economic Affairs. Industrial Production Indexes. 2022. Available online: https://www.moea.gov.tw/Mns/dos/bulletin/Bulletin.aspx?kind=9&html=1&menu_id=18808&bull_id=6099(In Chinese). (accessed on 31 May 2022).
- Ong, A.K.S.; Prasetyo, Y.T.; Libiran, M.A.D.C.; Lontoc, Y.M.A.; Lunaria, J.A.V.; Manalo, A.M.; Miraja, B.; Young, M.; Chuenyindee, T.; Persada, S.; et al. Consumer Preference Analysis on Attributes of Milk Tea: A Conjoint Analysis Approach. Foods 2021, 10, 1382. [Google Scholar] [CrossRef] [PubMed]
- Sangwai, V.; Deshmukh, R. Bubble Tea Market by Base Ingredient, Flavor and Component: Global Opportunity Analysis and Industry Forecast, 2020–2027; Allied Analytics LLP: Pune, India, 2020; p. 261. [Google Scholar]
- Braverman-Bronstein, A.; Camacho-García-Formentí, D.; Zepeda-Tello, R.; Cudhea, F.; Singh, G.M.; Mozaffarian, D.; Barrientos-Gutierrez, T. Mortality attributable to sugar sweetened beverages consumption in Mexico: An update. Int. J. Obes. 2020, 44, 1341–1349. [Google Scholar] [CrossRef]
- Chazelas, E.; Debras, C.; Srour, B.; Fezeu, L.K.; Julia, C.; Hercberg, S.; Deschasaux, M.; Touvier, M. Sugary drinks, artificially-sweetened beverages, and cardiovascular disease in the NutriNet-Sante Cohort. J. Am. Coll. Cardiol. 2020, 76, 2175–2180. [Google Scholar] [CrossRef]
- Wen, C.P.; Cheng, T.Y.; Tsai, M.K.; Chang, Y.C.; Chan, P.K.; Tsai, S.P.; Chiang, P.H.; Hsu, C.C.; Sung, P.K.; Hsu, Y.H.; et al. All-cause mortality attributable to chronic kidney disease: A prospective cohort study based on 462,293 adults in Taiwan. Lancet 2008, 371, 2173–2182. [Google Scholar] [CrossRef]
- Wen, C.P.; Wai, J.P.M.; Tsai, M.K.; Yang, Y.C.; Cheng, T.Y.D.; Lee, M.-C.; Chan, H.T.; Tsao, C.K.; Tsai, S.P.; Wu, X. Minimum amount of physical activity for reduced mortality and extended life expectancy: A prospective cohort study. Lancet 2011, 378, 1244–1253. [Google Scholar] [CrossRef]
- Carlson, S.A.; Densmore, D.; Fulton, J.E.; Yore, M.M.; Kohl, H.W. Differences in physical activity prevalence and trends from 3 US surveillance systems: NHIS, NHANES, and BRFSS. J. Phys. Act. Health 2009, 6, S18–S27. [Google Scholar] [CrossRef] [Green Version]
- Wu, X.; Tsai, S.P.; Tsao, C.K.; Chiu, M.L.; Tsai, M.K.; Lu, P.J.; Lee, J.H.; Chen, C.H.; Wen, C.; Chang, S.-S.; et al. Cohort profile: The Taiwan MJ cohort: Half a million Chinese with repeated health surveillance data. Int. J. Epidemiol. 2017, 46, 1744g. [Google Scholar] [CrossRef]
- Schulze, M.B.; Manson, J.E.; Ludwig, D.S.; Colditz, G.A.; Stampfer, M.J.; Willett, W.C.; Hu, F.B. Sugar-sweetened beverages, weight gain, and incidence of type 2 diabetes in young and middle-aged women. JAMA 2004, 292, 927–934. [Google Scholar] [CrossRef]
- Malik, V.; Hu, F.B. Sugar-sweetened beverages and cardiometabolic health: An update of the evidence. Nutrients 2019, 11, 1840. [Google Scholar] [CrossRef] [Green Version]
- Stanhope, K.L.; Medici, V.; Bremer, A.A.; Lee, V.; Lam, H.D.; Nunez, M.V.; Chen, G.X.; Keim, N.L.; Havel, P.J. A dose-response study of consumig high-fructose corn syrup-sweetened beverages in lipid/lipoprotein risk factors for cardiovascular disease in young adults. Am. J. Clin. Nutr. 2015, 101, 1144–1154. [Google Scholar] [CrossRef] [Green Version]
- Imamura, F.; O’Connor, L.; Ye, Z.; Mursu, J.; Hayashino, Y.; Bhupathiraju, S.N.; Forouhi, N.G. Consumption of sugar sweetened beverages, artificially sweetened beverages, and fruit juice and incidence of type 2 diabetes: Systematic review, meta-analysis, and estimation of population attributable fraction. BMJ 2015, 351, h3576. [Google Scholar] [CrossRef] [Green Version]
- Jiang, H.; Livingston, M.; Room, R.; Chenhall, R.; English, D.R. Temporal associations of alcohol and tobacco consumption with cancer mortality. JAMA Netw. Open 2018, 1, e180713. [Google Scholar] [CrossRef] [Green Version]
- Kao, W.H.; Hong, J.H.; See, L.C.; Yu, H.P.; Hsu, J.T.; Chou, I.J.; Chou, W.-C.; Chiou, M.-J.; Wang, C.-C.; Kuo, C.-F. Validity of cancer diagnosis in the national health insurance database compared with the linked national cancer registry in Taiwan. Pharmacoepidemiol. Drug Saf. 2018, 27, 1060–1066. [Google Scholar] [CrossRef]
- Lu, T.H.; Lee, M.C.; Chou, M.C. Accuracy of cause-of-death coding in Taiwan: Types of miscoding and effects on mortality statistics. Int. J. Epidemiol. 2000, 29, 336–343. [Google Scholar] [CrossRef]
- Popkin, B.M.; Hawkes, C. Sweetening of the global diet, particularly beverages: Patterns, trends, and policy responses. Lancet Diabetes Endocrinol. 2016, 4, 174–186. [Google Scholar] [CrossRef] [Green Version]

| SSB Intake (Serving/Day) | Total (n) | (%) | None (n) | (%) | >0–<0.5 (n) | (%) | ≥0.5–<1 (n) | (%) | ≥1–<2 (n) | (%) | ≥2 (n) | (%) | |
|---|---|---|---|---|---|---|---|---|---|---|---|---|---|
| Age | 20–39 | 288,747 | (100.0) | 80,930 | (28.0) | 86,915 | (30.1) | 49,669 | (17.2) | 44,388 | (15.4) | 26,845 | (9.3) |
| Sex | Men | 139,413 | (100.0) | 34,231 | (24.6) | 40,463 | (28.9) | 26,425 | (19.0) | 22,041 | (15.8) | 16,253 | (11.7) |
| Women | 148,355 | (100.0) | 46,344 | (31.2) | 46,175 | (31.1) | 23,093 | (15.6) | 22,217 | (15.0) | 10,526 | (7.1) | |
| Education | Middle school or below | 9480 | (100.0) | 4975 | (52.5) | 1948 | (20.5) | 734 | (7.7) | 1038 | (10.9) | 785 | (8.4) |
| High school | 60,771 | (100.0) | 21,911 | (36.1) | 15,664 | (25.8) | 7981 | (13.1) | 8929 | (14.7) | 6286 | (10.3) | |
| Junior college | 71,350 | (100.0) | 20,021 | (28.1) | 21,143 | (29.6) | 12,252 | (17.2) | 11,043 | (15.4) | 6891 | (9.7) | |
| College or above | 142,924 | (100.0) | 32,670 | (22.9) | 46,938 | (32.8) | 28,034 | (19.6) | 22,762 | (15.9) | 12,520 | (8.8) | |
| Smoking status | Non-smoker | 203,091 | (100.0) | 56,848 | (28.0) | 65,883 | (32.4) | 35,779 | (17.6) | 29,956 | (14.8) | 14,625 | (7.2) |
| Ex-smoker | 13,810 | (100.0) | 3849 | (27.9) | 4072 | (29.5) | 2444 | (17.7) | 2084 | (15.0) | 1361 | (9.9) | |
| Current smoker | 64,695 | (100.0) | 16,574 | (25.6) | 15,419 | (23.8) | 10,678 | (16.6) | 11,599 | (17.9) | 10,425 | (16.1) | |
| Alcohol drinking status | Non-drinker | 232,363 | (100.0) | 61,571 | (26.5) | 72,487 | (31.2) | 41,468 | (17.8) | 36,234 | (15.6) | 20,603 | (8.9) |
| Occasional drinker | 29,097 | (100.0) | 9716 | (33.3) | 7417 | (25.5) | 4498 | (15.5) | 4240 | (14.6) | 3226 | (11.1) | |
| Regular drinker | 16,938 | (100.0) | 5602 | (33.1) | 4159 | (24.6) | 2356 | (13.9) | 2529 | (14.9) | 2292 | (13.5) | |
| Physical activity | Inactive | 153,182 | (100.0) | 42,298 | (27.6) | 44,174 | (28.8) | 26,028 | (17.0) | 24,642 | (16.1) | 16,040 | (10.5) |
| Low | 79,432 | (100.0) | 22,999 | (29.0) | 25,513 | (32.1) | 13,778 | (17.3) | 11,396 | (14.4) | 5746 | (7.2) | |
| Medium | 34,026 | (100.0) | 9162 | (26.9) | 10,702 | (31.5) | 6173 | (18.1) | 5116 | (15.0) | 2873 | (8.5) | |
| High | 9938 | (100.0) | 3036 | (30.5) | 2835 | (28.5) | 1654 | (16.6) | 1413 | (14.3) | 1000 | (10.1) | |
| Very high | 6637 | (100.0) | 1847 | (27.8) | 1777 | (26.8) | 1174 | (17.7) | 1021 | (15.4) | 818 | (12.3) | |
| Body mass index | <18.5 | 36,489 | (100.0) | 10,524 | (28.8) | 11,262 | (30.9) | 6105 | (16.7) | 5651 | (15.5) | 2947 | (8.1) |
| 18.5~24 | 191,429 | (100.0) | 55,040 | (28.8) | 57,610 | (30.1) | 32,620 | (17.0) | 29,143 | (15.2) | 17,016 | (8.9) | |
| 25~29 | 48,990 | (100.0) | 12,346 | (25.2) | 14,546 | (29.7) | 8813 | (18.0) | 7759 | (15.8) | 5526 | (11.3) | |
| ≥30 | 10,765 | (100.0) | 2635 | (24.5) | 3198 | (29.7) | 1970 | (18.3) | 1682 | (15.6) | 1280 | (11.9) | |
| Hypertension | None | 269,387 | (100.0) | 75,252 | (27.9) | 81,293 | (30.2) | 46,347 | (17.2) | 41,627 | (15.5) | 24,868 | (9.2) |
| Yes | 18,381 | (100.0) | 5323 | (29.0) | 5345 | (29.1) | 3171 | (17.3) | 2631 | (14.3) | 1911 | (10.4) | |
| Diabetes | None | 284,574 | (100.0) | 79,563 | (28.0) | 85,702 | (30.1) | 49,042 | (17.2) | 43,835 | (15.4) | 26,432 | (9.3) |
| Yes | 3194 | (100.0) | 1012 | (31.7) | 936 | (29.3) | 476 | (14.9) | 423 | (13.2) | 347 | (10.9) | |
| Chronic kidney disease | None | 255,803 | (100.0) | 70,838 | (27.7) | 77,335 | (30.2) | 44,458 | (17.4) | 39,405 | (15.4) | 23,767 | (9.3) |
| Stage 1 | 7569 | (100.0) | 2334 | (30.8) | 2137 | (28.2) | 1193 | (15.8) | 1071 | (14.2) | 834 | (11.0) | |
| Stage 2 | 5698 | (100.0) | 1810 | (31.8) | 1526 | (26.8) | 897 | (15.7) | 795 | (13.9) | 670 | (11.8) | |
| Stage 3 | 555 | (100.0) | 185 | (33.3) | 142 | (25.6) | 81 | (14.6) | 84 | (15.1) | 63 | (11.4) | |
| Stage 4 or 5 | 54 | (100.0) | 22 | (40.7) | 13 | (24.1) | 8 | (14.8) | 4 | (7.4) | 7 | (13.0) |
| SSB Intake (Serving/Day) | 0–<0.5 | ≥0.5–1 | ≥1–<2 | ≥2 | p for Trend | ≥1 | |||||||||
|---|---|---|---|---|---|---|---|---|---|---|---|---|---|---|---|
| Causes of Deaths | N | HR | N | HR | 95% CI | N | HR | 95% CI | N | HR | 95% CI | N | HR | 95% CI | |
| CVD | 242 | Ref | 47 | 1.03 | 0.73–1.45 | 48 | 1.14 | 0.82–1.59 | 54 | 1.59 | 1.16–2.17 | 0.009 | 102 | 1.34 | 1.04–1.73 |
| Ischemic heart disease | 53 | Ref | 3 | 0.33 | 0.10–1.07 | 9 | 0.90 | 0.42–1.94 | 14 | 1.78 | 0.95–3.32 | 0.200 | 23 | 1.31 | 0.77–2.23 |
| Stroke | 72 | Ref | 17 | 1.24 | 0.70–2.21 | 13 | 1.14 | 0.62–2.10 | 16 | 1.51 | 0.83–2.74 | 0.196 | 29 | 1.30 | 0.82–2.09 |
| Diabetes mellitus | 31 | Ref | 5 | 1.26 | 0.47–3.38 | 5 | 0.99 | 0.34–2.89 | 5 | 1.20 | 0.45–3.21 | 0.749 | 10 | 1.10 | 0.50–2.40 |
| Kidney diseases | 10 | Ref | 0 | 4 | 2.38 | 0.67–8.50 | 0 | 0.745 | 4 | 1.18 | 0.33–4.20 | ||||
| Expanded CVD | 283 | Ref | 52 | 1.02 | 0.74–1.40 | 57 | 1.18 | 0.87–1.60 | 59 | 1.49 | 1.11–2.01 | 0.011 | 116 | 1.32 | 1.04–1.68 |
| SSB Intake (Serving/Day) | 0–<0.5 | ≥0.5–<1 | ≥1–<2 | ≥2 | P for Trend | ≥1 | |||||||||
|---|---|---|---|---|---|---|---|---|---|---|---|---|---|---|---|
| N | HR | N | HR | 95% CI | N | HR | 95% CI | N | HR | 95% CI | N | HR | 95% CI | ||
| Men | 170 | Ref. | 34 | 0.95 | 0.64–1.42 | 36 | 1.16 | 0.79–1.70 | 41 | 1.48 | 1.03–2.12 | 0.046 | 77 | 1.31 | 0.98–1.76 |
| Women | 72 | Ref. | 13 | 1.27 | 0.68–2.39 | 12 | 1.05 | 0.55–2.02 | 13 | 1.90 | 1.01–3.61 | 0.109 | 25 | 1.37 | 0.83–2.25 |
| Non-smokers | 94 | Ref. | 22 | 1.22 | 0.75–1.99 | 22 | 1.28 | 0.77–2.12 | 17 | 1.95 | 1.14–3.32 | 0.020 | 39 | 1.52 | 1.02–2.28 |
| Ever smokers | 133 | Ref. | 25 | 0.89 | 0.56–1.43 | 26 | 1.04 | 0.67–1.61 | 36 | 1.42 | 0.96–2.09 | 0.134 | 62 | 1.23 | 0.89–1.70 |
| BMI < 30 kg/m2 | 206 | Ref. | 37 | 0.97 | 0.66–1.42 | 44 | 1.22 | 0.86–1.73 | 43 | 1.54 | 1.08–2.19 | 0.019 | 87 | 1.36 | 1.03–1.79 |
| BMI ≥ 30 kg/m2 | 36 | Ref. | 10 | 1.40 | 0.64–3.03 | 4 | 0.69 | 0.24–1.99 | 11 | 1.85 | 0.89–3.81 | 0.249 | 15 | 1.27 | 0.66–2.44 |
| Non-hypertension | 156 | Ref. | 26 | 0.87 | 0.55–1.38 | 37 | 1.40 | 0.96–2.06 | 40 | 1.89 | 1.30–2.73 | 0.001 | 77 | 1.62 | 1.20–2.18 |
| Hypertension | 86 | Ref. | 21 | 1.31 | 0.79–2.17 | 11 | 0.67 | 0.33–1.35 | 14 | 1.06 | 0.58–1.94 | 0.797 | 25 | 0.85 | 0.52–1.39 |
| Non-diabetes | 223 | Ref | 45 | 1.04 | 0.73–1.47 | 45 | 1.15 | 0.82–1.62 | 49 | 1.54 | 1.11–2.14 | 0.017 | 94 | 1.33 | 1.02–1.73 |
| Diabetes | 19 | Ref. | 2 | 0.81 | 0.18–3.74 | 3 | 0.90 | 0.19–4.18 | 5 | 2.20 | 0.76–6.38 | 0.247 | 8 | 1.58 | 0.61–4.10 |
| Daily calorie intake ≥25 Kcal/Kg body weight | 60 | Ref | 20 | 1.03 | 0.60–1.78 | 29 | 1.40 | 0.86–2.26 | 36 | 1.87 | 1.19–2.95 | 0.006 | 65 | 1.78 | 1.09–2.91 |
| Daily calorie intake <25 Kcal/Kg body weight | 165 | Ref | 24 | 1.14 | 0.72–1.80 | 15 | 0.88 | 0.51–1.55 | 17 | 1.75 | 1.04–2.93 | 0.160 | 32 | 1.31 | 0.85–2.01 |
| Exclude those died in 3 years | 222 | Ref. | 42 | 1.07 | 0.75–1.53 | 41 | 1.08 | 0.75–1.54 | 51 | 1.66 | 1.20–2.29 | 0.010 | 92 | 1.34 | 1.03–1.75 |
| Exclude those with smoking, hypertension, or diabetes | 57 | Ref | 11 | 0.96 | 0.48–1.92 | 17 | 1.63 | 0.90–2.93 | 13 | 2.48 | 1.33–4.62 | 0.004 | 30 | 1.93 | 1.20–3.12 |
| Exclude regular alcohol drinkers | 242 | Ref. | 47 | 1.03 | 0.73–1.45 | 48 | 1.14 | 0.82–1.59 | 54 | 1.58 | 1.16–2.17 | 0.009 | 102 | 1.34 | 1.04–1.73 |
| First Visit (n) | |||||||
|---|---|---|---|---|---|---|---|
| SSB Intake (Serving/Day) | None | >0–<0.5 | ≥0.5–<1 | ≥1–<2 | ≥2 | Total | |
| Second visit (n) | None | 14,391 | 7783 | 2344 | 1712 | 931 | 27,161 |
| >0–<0.5 | 9541 | 15885 | 6959 | 4370 | 1836 | 38,591 | |
| ≥0.5–<1 | 3314 | 5798 | 5895 | 4160 | 1734 | 20,901 | |
| ≥1–2 | 2818 | 3194 | 3582 | 5615 | 2784 | 17,993 | |
| ≥2 | 1676 | 1164 | 1094 | 1862 | 3539 | 9335 | |
| Total | 31,740 | 33,824 | 19,874 | 17,719 | 10,824 | ||
Publisher’s Note: MDPI stays neutral with regard to jurisdictional claims in published maps and institutional affiliations. |
© 2022 by the authors. Licensee MDPI, Basel, Switzerland. This article is an open access article distributed under the terms and conditions of the Creative Commons Attribution (CC BY) license (https://creativecommons.org/licenses/by/4.0/).
Share and Cite
Chen, C.-H.; Tsai, M.-K.; Lee, J.-H.; Wen, C.; Wen, C.-P. Association of Sugar-Sweetened Beverages and Cardiovascular Diseases Mortality in a Large Young Cohort of Nearly 300,000 Adults (Age 20–39). Nutrients 2022, 14, 2720. https://doi.org/10.3390/nu14132720
Chen C-H, Tsai M-K, Lee J-H, Wen C, Wen C-P. Association of Sugar-Sweetened Beverages and Cardiovascular Diseases Mortality in a Large Young Cohort of Nearly 300,000 Adults (Age 20–39). Nutrients. 2022; 14(13):2720. https://doi.org/10.3390/nu14132720
Chicago/Turabian StyleChen, Chien-Hua, Min-Kuang Tsai, June-Han Lee, Christopher Wen, and Chi-Pang Wen. 2022. "Association of Sugar-Sweetened Beverages and Cardiovascular Diseases Mortality in a Large Young Cohort of Nearly 300,000 Adults (Age 20–39)" Nutrients 14, no. 13: 2720. https://doi.org/10.3390/nu14132720