Abstract
Background: Metabolomics is useful in elucidating the progression of diabetes; however, the follow-up changes in metabolomics among health, diabetes mellitus, and diabetic kidney disease (DKD) have not been reported. This study was aimed to reveal metabolomic signatures in diabetes development and progression. Methods: In this cross-sectional study, we compared healthy (n = 30), type 2 diabetes mellitus (T2DM) (n = 30), and DKD (n = 30) subjects with the goal of identifying gradual altering metabolites. Then, a prospective study was performed in T2DM patients to evaluate these altered metabolites in the onset of DKD. Logistic regression was conducted to predict rapid eGFR decline in T2DM subjects using altered metabolites. The prospective association of metabolites with the risk of developing DKD was examined using logistic regression and restricted cubic spline regression models. Results: In this cross-sectional study, impaired amino acid metabolism was the main metabolic signature in the onset and development of diabetes, which was characterized by increased N-acetylaspartic acid, L-valine, isoleucine, asparagine, betaine, and L-methionine levels in both the T2DM and DKD groups. These candidate metabolites could distinguish the DKD group from the T2DM group. In the follow-up study, higher baseline levels of L-valine and isoleucine were significantly associated with an increased risk of rapid eGFR decline in T2DM patients. Of these, L-valine and isoleucine were independent risk factors for the development of DKD. Notably, nonlinear associations were also observed for higher baseline levels of L-valine and isoleucine, with an increased risk of DKD among patients with T2DM. Conclusion: Amino acid metabolism was disturbed in diabetes, and N-acetylaspartic acid, L-valine, isoleucine, asparagine, betaine, and L-methionine could be biomarkers for the onset and progression of diabetes. Furthermore, high levels of L-valine and isoleucine may be risk factors for DKD development.
1. Introduction
Diabetes mellitus (DM) is one of the fastest growing diseases, carrying persistent increases in the worldwide disease burden. Metabolic dysregulations have emerged as important signatures in the process of diabetes [1,2]. The application of high-throughput metabolomics has revealed a series of plasma metabolites prospectively associated with the biochemical process of diabetes. Studies have shown higher levels of branched-chain amino acids and aromatic amino acids in prediabetic and diabetic patients compared with normal subjects, and the underlying mechanism is that circulating amino acids may modulate insulin secretion and promote insulin resistance to promote pancreatic β-cell exhaustion [2,3]. Additionally, studies have shown that disorders of carbohydrate (fructose and glucose) metabolites or lipid (glycerophospholipids, sphingomyelins, and triglycerides) metabolites may prospectively correlate with diabetes risk [4,5].
Further, metabolomics has shown that dysregulated lipid and amino acid metabolism are associated with diabetic kidney disease (DKD) progression [6,7,8]. Recent studies revealed several candidate metabolites discriminating DKD from diabetes, showing that valine, xanthosine and 7-methyluric acid could be used to predict the development of renal injury in T2DM patients [9,10]. However, studies exploring the step-wise changes of metabolomics from healthy status to diabetes and then to DKD are limited, and researchers have commonly analyzed the metabolomic changes among DKD, DM and healthy controls at a single time point without following up DM patients to observe the onset of DKD. In this study, we compared untargeted metabolomic profiles between type 2 DM (T2DM) and healthy controls and between DKD and T2DM patients to identify altered metabolites with the same trend. Then, we followed up T2DM patients to observe whether they developed renal injury and analyzed the correlation between these altered metabolites with the onset of renal injury in order to find the potentially altered metabolites from healthy status to diabetes and then to DKD, as well as to evaluate the significance of these metabolites in predicting the development of DKD.
2. Materials and Methods
2.1. Human Subjects
A total of 90 participants—30 T2DM patients (T2DM group), 30 DKD patients (DKD group), and 30 healthy volunteers as the control group (Health group)—were enrolled from the First Affiliated Hospital of Zhejiang University School of Medicine (Figure 1A). The T2DM patients were in line with the ADA criteria [11]. Their eGFR was ≥60 mL/min/1.73 m2, and their albuminuria (urine albumin–creatinine ratio, UACR) was ≤30 mg/g. The DKD patients met the American Diabetes Association (ADA) criteria, and their renal injury was proven by renal biopsy [11]. We excluded non-DKD patients; patients complicated with non-DKD such as IgA nephropathy, membranous nephropathy, interstitial kidney disease; patients with acute kidney injury; and patients with diseases that may affect albuminuria, such as urinary tract infection, urinary tumors, and cardiac insufficiency. Then, we followed up the patients in the T2DM group to observe whether they developed renal injury. The renal injury was defined as a rapid eGFR decline (an annual eGFR decline ≥3 mL/min/1.73 m2) or a diagnosis of DKD defined as eGFR declining to <60 mL/min/1.73 m2 or a persistently elevated urinary albumin level (UACR ≥30 mg/g). The eGFR slopes were calculated by the difference of eGFR values between baseline and the last follow-up time divided by the number of years. The current study was reviewed and approved by the institutional ethics committee of the First Affiliated Hospital of Zhejiang University, and all participants provided informed consent.
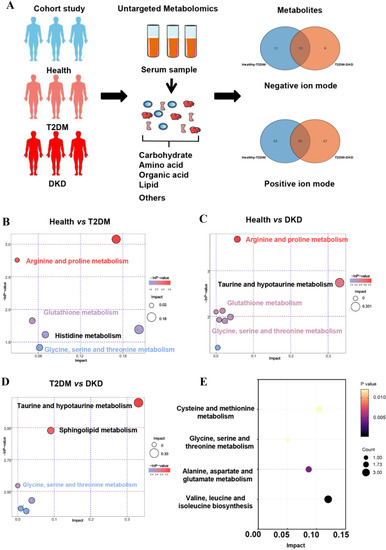
Figure 1.
Overview of metabolic alterations in T2DM and DKD. (A) A Study design overview. Plasma metabolomics was collected for all study participants, and metabolic alterations were compared in both positive and negative ion modes. (B–D) Pathway enrichment analysis of significantly elevated metabolites in T2DM and DKD patients according to the KEGG pathway. (E) Differentially abundant metabolites in the onset and development of diabetes, stratified by KEGG pathways.
2.2. Measurement and Sample Collection
Data on age, gender, diabetic duration, and blood pressure were collected from medical records. The levels of fasting blood glucose, albumin, serum lipids, serum creatinine, and serum blood urea nitrogen were measured in a routine clinical laboratory. We used 24 h urine collection to assess the 24 h excretion of urinary albumin. The urinary albumin and creatinine levels were collected to calculate the albumin-to-creatinine ratio (ACR). eGFR was estimated using the Chronic Kidney Disease Epidemiology Collaboration (CKD-EPI) equation [12]. Patients with DKD were categorically divided by ACR into those with normal ACR (<30 mg/g Cr), microalbuminuria (30 to 300 mg/g Cr), and macroalbuminuria (>300 mg/g Cr).
Blood samples for metabolomics analysis were collected from each participant after overnight fasting, and then serum was isolated after centrifugation at 3000× g at 4 °C for 15 min. Serum samples were stored at −80 °C before further sample preparation and LC–MS analysis. Quality control (QC) samples were obtained by combining the serum sample from the different groups, and the measurements and analyses were repeated with the same LC–MS method.
2.3. Liquid Chromatography–Mass Spectrometry (LC–MS)
All serum samples were subjected to LC–MS metabolomics analysis on an ultra-high performance liquid chromatography (UHPLC) system (Thermo Fisher Scientific, Waltham, MA, USA) coupled with the TSQ Endura Triple Quadrupole Mass Spectrometer (Thermo Fisher Scientific, San Jose, CA, USA), according to previously described methods [13].
2.4. Metabolites Analysis
Raw data files were converted into the mzXML format using ProteoWizard software (version 3.0, Nashville, TN, USA) and processed by R package XCMS (version 3.2, La Jolla, CA, USA) for peak detection and normalization. The resulting three-dimensional data involving the peak number, sample name, and normalized peak area were fed to SIMCA software (version 14.1, MKS Data Analytics Solutions, Umea, Sweden) for principal component analysis (PCA) and orthogonal projections to latent structures-discriminant analysis (OPLS-DA). The metabolites were identified using the HMDB, PubChem, and ChEBI databases. The variable importance in projection (VIP) was used to identify differential metabolites in the DKD group relative to the T2DM group or the Health group. Metabolites with statistical significance (VIP > 1.0 and p < 0.05) were considered to be potential markers capable of differentiating DKD from T2DM or the control group. In addition, pathway enrichment analysis was conducted using the Kyoto Encyclopedia of Genes and Genomes (KEGG) database.
2.5. Statistical Analysis
All statistical analyses were performed using SPSS (version 25, Chicago, IL, USA), R (version 3.6.3, R Foundation for Statistical Computing, Vienna, Austria), and python (version 3.7, Python Software Foundation, Amsterdam, The Netherlands). Data were presented as the mean ± standard deviation for normal distribution and as median (interquartile range) for non-normal distribution. Data of normal distribution were compared using the independent sample t-test and the one-way analysis of variance, while the independent sample Kruskal–Wallis test was used for comparisons of non-normally distributed data. Pearson’s correlation was used to assess the association between metabolites and kidney function indicators. Moreover, receiver operating characteristic (ROC) analysis was performed to evaluate the diagnostic capability of identified potential metabolites. In the follow-up study, a logistic regression model was used to test associations of metabolites with rapid eGFR decline, and multivariate Cox analysis was performed to determine independent risk factors of diabetes prognosis. Restricted cubic spline (RCS) analysis was used to examine the nonlinear association of metabolites levels with DKD risk. Nonlinearity was tested using the likelihood ratio test. p-value < 0.05 was considered to be statistically significant.
3. Results
3.1. Metabolic Features in All Participants
The clinical characteristics of the Health, T2DM, and DKD groups were summarized in Table 1. There were no significant differences in age, sex, and duration of diabetes between the T2DM and DKD groups. Metabolomics showed positive and negative ion modes to detect all samples, and a total of 2433 serum metabolites were identified. To determine whether metabolites differed among the three groups, we performed principal components analysis (PCA) (Supplementary Figure S1). Moreover, an optimal orthogonal partial least squares-discriminant analysis (OPLS-DA) model was obtained using total area normalization to conduct the data analysis of metabolite profiling (Supplementary Figure S2). A permutation test was used to estimate the OPLS-DA model, while Q2Y and R2Y values close to 1 indicated that there was no overfitting. Supplementary Figure S3 indicates that the OPLS-DA model obtained high predictive features in the Health, T2DM, and DKD groups. According to the screening criteria (p-value < 0.05 and VIP values > 1), the statistical significance of metabolites was estimated to determine whether they were potential biomarkers between two groups in volcano plots (Supplementary Figure S4). Surprisingly, KEGG pathways showed the same paths of increased metabolite intensities among the progression of T2DM and DKD, with particular pathway focus on amino acid metabolisms, including arginine and proline metabolism, glutathione metabolism, and glycine, serine, and threonine metabolism (Figure 1B–D).

Table 1.
Clinical and biochemical parameters in Health, T2DM, and DKD groups.
To identify potential biomarkers in the progression of DM and DKD, we screened out metabolites that were elevated or gradually reduced from the Health group to the T2DM and DKD groups in the same direction with the PCA models (Supplementary Figure S1C,D). The metabolite-associated pathways were enriched among the progression of DM and DKD, where the majority were encoded in amino acid metabolism (Figure 1E), as described above. A total of 18 metabolites were identified (Supplementary Table S1), and six metabolites could be mapped into biochemical pathways. Compared with the Health group, the T2DM group had higher levels of N-acetylaspartic acid (NAA), L-valine, betaine, isoleucine, asparagine and L-methionine. The same trend was found between the T2DM and DKD groups (Figure 2A–F). Almost all metabolites were shown to be involved in amino acid metabolism, implying that amino acid metabolism may play an important role in the progression of DM and DKD. Moreover, the changing trend of other metabolites in the Health, T2DM, and DKD groups are shown in Supplementary Figure S5.
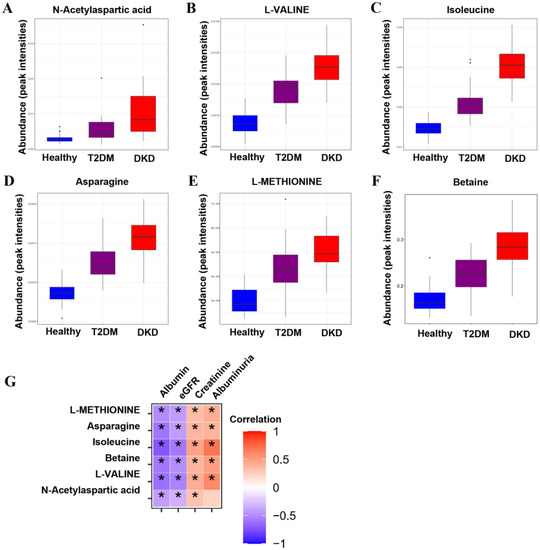
Figure 2.
Metabolic differences across the Health–T2DM–DKD gradient. (A–F) Differential metabolites among Health, T2DM, and DKD groups, including the relative intensities of the six up-regulated overlapping metabolites from Health to T2DM and towards DKD. (G) The correlations between differential metabolites and clinical parameters. Significant p-value < 0.05. * p < 0.05.
3.2. Correlation between Metabolites and Clinical Parameters
As shown in Figure 2G and Table 2, the metabolites of amino acids showed a broad range of correlations with clinical parameters. Serum albumin and eGFR were negatively correlated with levels of NAA, L-valine, betaine, isoleucine, asparagine and L-methionine. In contrast, serum creatinine and albuminuria were positively correlated with levels of L-valine, betaine, isoleucine, asparagine and L-methionine, and serum creatinine was also positively correlated with NAA. Based on the significant correlation of metabolites with renal function and proteinuria, we further analyzed the levels of metabolites in different subgroups of CKD stages and proteinuria. There were no significant differences in NAA, L-valine, betaine, isoleucine, asparagine, or L-methionine between the DKD patient groups with different CKD stages (Supplementary Figure S6). In different subgroups of degree of proteinuria, L-valine and betaine levels successively increased in the macroalbuminuria group compared with the normal albuminuria group (Supplementary Figure S7).
Table 2.
Correlation analysis between clinical parameters and metabolites.
3.3. Validation of the Potential Biomarkers
To better understand the possible role of metabolites in distinguishing between the Health and T2DM groups or between the T2DM and DKD groups, ROC analysis was performed (Figure 3 and Table 3). Serum metabolite levels of NAA, L-valine, betaine, asparagine and L-methionine demonstrated accuracy and power in discriminating the DKD group from the T2DM group, as well as the T2DM group from the Health group, suggesting that metabolite differences may provide a way for identifying potential candidates for diabetes and DKD.
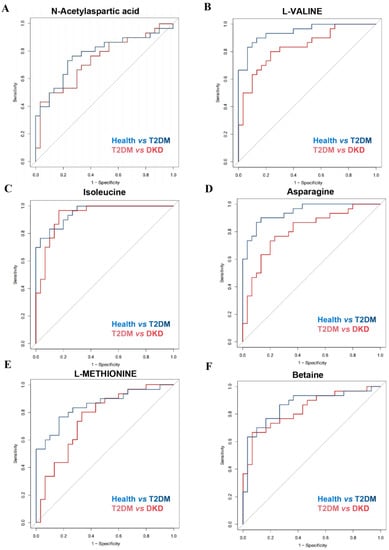
Figure 3.
Discrimination ability of differential metabolites among Health, T2DM, and DKD groups. (A–F) ROC curves of differential metabolites for distinguishing health from T2DM patients and distinguishing T2DM patients from DKD patients.
Table 3.
The diagnostic power of different metabolite biomarkers in differentiating T2DM from Health controls or DKD from T2DM.
3.4. Correlation of Metabolites with Diabetes Progression
For patients in the T2DM group, after a median follow up of 69.00 (46.00, 71.00) months, 14 T2DM patients showed an annual eGFR decline ≥3 mL/min/1.73 m2 and 12 T2DM patients met the diagnosis criterion of DKD. In the logistic regression models, the concentrations of both L-valine and isoleucine were significantly associated with rapid eGFR decline (respectively, OR = 3.292, 95% CI = 1.293–8.378; OR = 1.419, 95% CI = 1.052–1.915) (Figure 4A). Univariable Cox regression analysis showed that high levels of L-valine and isoleucine were risk factors for DKD. After adjustment for the parameters of baseline age, sex, blood pressure, diabetes duration, eGFR, and albuminuria, the upregulated L-valine (HR = 2.583, 95% CI = 1.006–6.629, p = 0.048) and isoleucine (HR = 1.670, 95% CI = 1.206–2.312, p = 0.002) remained independent risk factors for the development of DKD in multivariate Cox regression (Figure 4B).
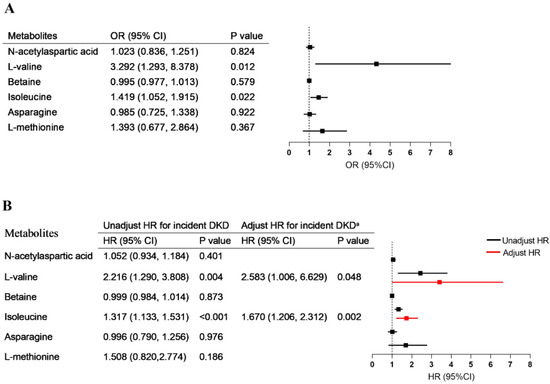
Figure 4.
Association of metabolites with diabetes progression. (A) The associations of metabolic alterations (per one-point increment) with rapid eGFR decline. (B) The association between metabolic alterations (per one-point increment) and risk of new-onset diabetic kidney disease. Adjusted a, without stratification, for age, sex, blood pressure, duration of diabetes, baseline eGFR, and albuminuria.
Moreover, restricted cubic spline analysis indicated a significant dose–response relationship between the risk of DKD and metabolites (Figure 5). A nonlinear association was observed between new-onset DKD and L-valine, isoleucine, and asparagine levels (p for nonlinearity < 0.05). That is, when levels of L-valine and isoleucine were relatively low, there was a negative correlation between L-valine and isoleucine levels and DKD risk; however, when L-valine and isoleucine exceeded certain thresholds (L-valine > 0.0097 peak intensities and isoleucine > 0.0205 peak intensities), the risks of new-onset DKD increased.
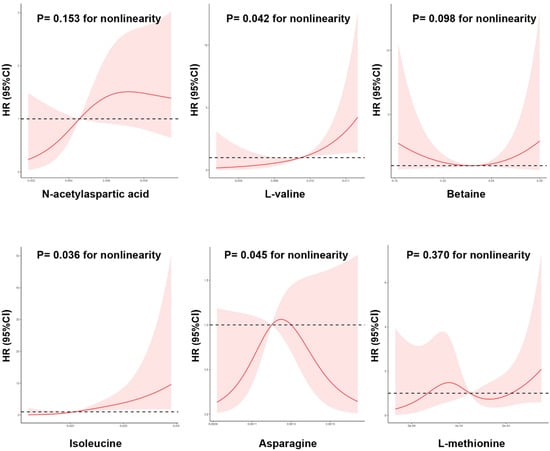
Figure 5.
The nonlinear dose-dependent relationship between metabolic alterations and risk of new-onset diabetic kidney disease. Restricted cubic spline curve was carried out with 4 knots of baseline metabolic index. The solid line represents the association of metabolic index with DKD risk, and the shaded portion represents 95% CI estimation.
4. Discussion
Through untargeted metabolomics profiling, the present study focused on the continuously changing metabolites from healthy status to diabetes and then to DKD. Unique to the present research, we performed a prospective study to search for circulating metabolites associated with progressive eGFR decline and progression to DKD among T2DM patients. In this cross-sectional study, we found that upregulated amino acid metabolites levels were the main metabolic signatures in the occurrence and development of diabetes, which was characterized by increased NAA, L-valine, isoleucine, asparagine, and L-methionine levels. We also provided evidence that these candidate metabolites could distinguish the Health group and the DKD group from the T2DM group. Given this background, metabolites may offer insights into diabetes progression, so we evaluated associations of these previously identified metabolites with kidney function decline in a follow-up study. A key finding was that L-valine and isoleucine showed a strong independent effect on progressive renal decline in T2DM patients. Furthermore, the fact that higher baseline levels of L-valine and isoleucine were associated with an increased risk of DKD provides strong evidence that these metabolites are causally involved in diabetes development and progression. Next, we will discuss the biology of these metabolites and possible mechanisms through which they may contribute to the occurrence of diabetes and the progression of renal injury.
Amino acids are building blocks for all life forms, for which absorption and transportation are found in the small intestine, colon, liver, kidneys, and other tissues, therefore allowing amino acids to affect the growth and health of humans [14,15]. Branched chain amino acids (BCAAs)—referring to valine, leucine, and isoleucine—serve as important signaling molecules regulating the metabolism of proteins, glucose, and lipids, which play critical roles in energy homeostasis. Alterations in BCAA catabolism were found in diabetes decades ago, and BCAA metabolism is altered before the development of diabetes and is associated with the onset of it [16,17,18]. These high circulating levels of BCAAs are associated with an increased risk of type 2 diabetes, which has been verified in multiple cohorts [19,20,21]. Several mechanisms have been implicated in raising BCAA levels in insulin resistance (Supplementary Figure S8A). In the current study, we found that valine and isoleucine were gradually upregulated in T2DM and DKD patients. Consistent with our expectations, the different circulating concentrations of valine and isoleucine could distinguish healthy subjects and DKD patients from T2DM patients. These results are in agreement with the findings of previous studies, which confirmed the role of altered BCAA metabolism in the pathophysiology of diabetes [22,23]. A possible reason for these findings is that a defective BCAA catabolism regulates rapamycin (mTOR) pathway activation and insulin receptor substrate protein phosphorylation, which lead to insulin resistance and the accumulation of cytotoxic metabolites. Another noteworthy observation is that we found that high circulating levels of valine and isoleucine were correlated with decreased eGFR levels and increased albuminuria levels. Given these results and prior findings showing associations of amino acids with vascular complications in diabetes, we further explored whether amino acid levels were associated with adverse renal outcomes in T2DM patients. In a follow-up study of individuals with type 2 diabetes, we found that higher levels of both valine and isoleucine were associated with an increased risk of incident DKD. These findings supported the idea that BCAA metabolism potentially participates in the onset of diabetic kidney disease, and the pathophysiology underlying these associations is worthy of further investigation.
In addition to BCAAs, we also identified four other amino-acid-correlated metabolites that were significantly associated with diabetes and diabetic kidney diseases. The results of this study demonstrated the step-wise upregulation of circulating asparagine, NAA, L-methionine, and betaine in T2DM and DKD patients, which was significantly associated with renal function, serum albumin, and albuminuria. Our results also showed that these increased amino-acid-related metabolites could distinguish healthy subjects and DKD patients from T2DM patients, so they could be potential biomarkers for diabetes and DKD. Asparagine and aspartate can be converted to each other with metabolism fluctuation, and the roles of asparagine and aspartate homeostasis regulation have been highlighted in metabolic disorders. Previous research showed that an increasing asparagine-to-aspartate ratio was a risk for the incident of diabetes [24], which is consistent with the results obtained in our study. These findings could be explained by the idea that high levels of asparagine upregulate the mTORC1 pathway [25], which contributes to the development of insulin resistance [26]. However, other studies have shown that asparagine has an inverse association with diabetes risk [27], which was contrary to the results of our study. To date, the association of circulating asparagine levels and diabetes is still controversial in clinical settings. The alteration of asparagine metabolism has not been demonstrated in the pathogenesis of diabetes, so further studies investigating the underlying changes of asparagine in diabetes patients are still warranted. Moreover, NAA is involved in neuronal metabolism and downregulated in the brain of diabetes patients, which have been reported to be the key metabolites in the cognitive dysfunction of diabetes [28,29]. A previous study showed that lower levels of NAA in the brains of patients with diabetes indicate partial neuronal loss [30]. Despite these findings, circulating NAA levels in T2DM and DKD patients have received little attention, and our study demonstrated increased NAA levels in the blood of these patients. Although our findings have broadened insights into NAA metabolism in the progression of diabetes, the homeostasis of NAA in the circulation and cerebrum is worthy of further exploration.
DNA methylation could be involved in glucose metabolism, insulin resistance, and other conditions, leading to the pathogenesis of diabetes that continues to be an area of active research [31,32]. Several studies have shown that alterations of the DNA methylation in human tissues are of importance for the epigenome and may thereby affect gene expression and the pathogenesis of diabetes mellitus (Supplementary Figure S8B). Indeed, DNA methylation changes in diabetes may eventually contribute to vascular complications, including diabetic kidney disease. Methionine and betaine are vital methyl donors in DNA methylation, serving as cofactors for affecting methylation. Methionine is converted into S-adenosyl-l-methionine (SAM) and S-adenosyl-homocysteine (SAH), and the SAM/SAH ratio is known as a methylation regulation index. In line with the results of our study, the upregulation of circulating methionine and its catabolites has been observed in diabetes patients, and circulating methionine abundance could predict the risk of developing diabetes [33]. Methionine restriction attenuates glucose homeostasis, insulin sensitivity, oxidative stress, inflammation in diabetes, and this evidence highlights the idea that methionine is a potential contributor to the pathogenesis of diabetes [34]. Furthermore, methionine restriction has also been proven to activate renoprotective genes and improve kidney function decline associated with metabolic dysfunction [35,36], which is consistent with our findings. In addition, betaine is also involved in diabetes metabolic alterations through the control of the SAM/SAH ratio of DNA methylation. Betaine is upregulated in the blood of diabetes models and patients, so it is also considered a poor predictor for incident diabetes [37,38]. Nevertheless, a high circulating betaine concentration could contribute to diabetes complications, including diabetic kidney disease [39,40]. Therefore, more systematic studies are warranted to identify whether betaine is a potential target in diabetes conditions.
There were few limitations in the current study. First, a single untargeted metabolomics platform was used with relatively small-scale samples, and integration between metabolomics and proteomics should be utilized for systems biology information in the future. Second, despite the strong design of the study with a cross-sectional and follow-up cohort, an independent validation cohort is needed to confirm the presented findings because the number of current samples was insufficient to support correction for multiple comparisons. Finally, the molecular mechanisms of the studied metabolites are still uncertain, and mechanistic studies in diabetic models will be indispensable to understanding the roles of metabolites in future works.
5. Conclusions
We performed a cross-sectional study to identify consistently altered metabolites in diabetes and diabetic kidney diseases, and metabolomic changes in T2DM and DKD subjects were characterized by upregulated L-valine, isoleucine, asparagine, NAA, L-methionine, and betaine levels. The findings in a follow-up cohort suggested that L-valine and isoleucine were associated with an increased risk of incident DKD. This study highlights the idea that BCAA metabolism is disturbed in diabetes, which could be considered a biomarker for the prediction of DKD.
Supplementary Materials
The following supporting information can be downloaded at: https://www.mdpi.com/article/10.3390/nu14163345/s1, Figure S1: PCA score plot in positive and negative ion mode among Health, T2DM, and DKD groups; Figure S2: OPLS-DA of serum metabolome; Figure S3: Cross-validation plot in OPLS-DA model; Figure S4: Volcano plots of candidate metabolites; Figure S5: Box plots of differential metabolites in serum samples; Figure S6: Detection of differentially expressed metabolites based on different CKD stages; Figure S7: Detection of differentially expressed metabolites based on different degree of proteinuria; Figure S8: The disturbance of amino acid metabolism pathway in the progression of diabetes; Table S1: The metabolites in Health, T2DM, and DKD subjects.
Author Contributions
Conceptualization, J.C., F.H. and W.L.; methodology, H.Z.; software, H.Z.; validation, M.B., X.X., H.D., J.W. and C.W.; formal analysis, H.Z.; investigation, M.B., X.X., H.D., J.W. and C.W.; resources, M.B.; data curation, M.B.; writing—original draft preparation, H.Z.; writing—review and editing, J.C., F.H. and W.L.; visualization, H.Z.; supervision, W.L.; project administration, W.L.; funding acquisition, W.L. All authors have read and agreed to the published version of the manuscript.
Funding
This work was supported by grants from the National Key R&D Program of China (2018YFC2000400), the National Natural Science Foundation of China (81670651, 81970573, and 81770752), the Zhejiang provincial program for the Cultivation of High-level Innovative Health talents, and the key science & technology project of medicine and health, Zhejiang province, Foundation of scientific research of national health care commission (WKJ-ZJ-2009).
Institutional Review Board Statement
The study was conducted in accordance with the Declaration of Helsinki and approved by the First Affiliated Hospital of Zhejiang University School of Medicine (protocol code: IIT-743).
Informed Consent Statement
Informed consent was obtained from all subjects involved in the study.
Data Availability Statement
The data underlying this study are available from the corresponding author upon reasonable request.
Acknowledgments
We express our appreciation to all participants for their collaboration in the current study. All individuals have consented to the acknowledgement.
Conflicts of Interest
The authors declare no conflict of interest.
References
- Chen, Z.-Z.; Gerszten, R.E. Metabolomics and Proteomics in Type 2 Diabetes. Circ. Res. 2020, 126, 1613–1627. [Google Scholar] [CrossRef] [PubMed]
- Sun, Y.; Gao, H.-Y.; Fan, Z.-Y.; He, Y.; Yan, Y.-X. Metabolomics Signatures in Type 2 Diabetes: A Systematic Review and Integrative Analysis. J. Clin. Endocrinol. Metab. 2020, 105, 1000–1008. [Google Scholar] [CrossRef] [PubMed]
- Wang, T.J.; Larson, M.G.; Vasan, R.S.; Cheng, S.; Rhee, E.P.; McCabe, E.; Lewis, G.D.; Fox, C.S.; Jacques, P.F.; Fernandez, C.; et al. Metabolite profiles and the risk of developing diabetes. Nat. Med. 2011, 17, 448–453. [Google Scholar] [CrossRef]
- Rhee, E.P.; Cheng, S.; Larson, M.G.; Walford, G.A.; Lewis, G.D.; McCabe, E.; Yang, E.; Farrell, L.; Fox, C.S.; O’Donnell, C.J.; et al. Lipid profiling identifies a triacylglycerol signature of insulin resistance and improves diabetes prediction in humans. J. Clin. Investig. 2011, 121, 1402–1411. [Google Scholar] [CrossRef] [PubMed]
- Peddinti, G.; Cobb, J.; Yengo, L.; Froguel, P.; Kravić, J.; Balkau, B.; Tuomi, T.; Aittokallio, T.; Groop, L. Early metabolic markers identify potential targets for the prevention of type 2 diabetes. Diabetologia 2017, 60, 1740–1750. [Google Scholar] [CrossRef]
- Kwan, B.; Fuhrer, T.; Zhang, J.; Darshi, M.; Van Espen, B.; Montemayor, D.; de Boer, I.H.; Dobre, M.; Hsu, C.-Y.; Kelly, T.N.; et al. Metabolomic Markers of Kidney Function Decline in Patients with Diabetes: Evidence from the Chronic Renal Insufficiency Cohort (CRIC) Study. Am. J. Kidney Dis. 2020, 76, 511–520. [Google Scholar] [CrossRef] [PubMed]
- Shao, M.; Lu, H.; Yang, M.; Liu, Y.; Yin, P.; Li, G.; Wang, Y.; Chen, L.; Chen, Q.; Zhao, C.; et al. Serum and urine metabolomics reveal potential biomarkers of T2DM patients with nephropathy. Ann. Transl. Med. 2020, 8, 199. [Google Scholar] [CrossRef] [PubMed]
- Ahn, H.-S.; Kim, J.H.; Jeong, H.; Yu, J.; Yeom, J.; Song, S.H.; Kim, S.S.; Kim, I.J.; Kim, K. Differential Urinary Proteome Analysis for Predicting Prognosis in Type 2 Diabetes Patients with and without Renal Dysfunction. Int. J. Mol. Sci. 2020, 21, 4236. [Google Scholar] [CrossRef]
- Hirayama, A.; Nakashima, E.; Sugimoto, M.; Akiyama, S.-I.; Sato, W.; Maruyama, S.; Matsuo, S.; Tomita, M.; Yuzawa, Y.; Soga, T. Metabolic profiling reveals new serum biomarkers for differentiating diabetic nephropathy. Anal. Bioanal. Chem. 2012, 404, 3101–3109. [Google Scholar] [CrossRef] [PubMed]
- Chen, C.-J.; Liao, W.-L.; Chang, C.-T.; Lin, Y.-N.; Tsai, F.-J. Identification of Urinary Metabolite Biomarkers of Type 2 Diabetes Nephropathy Using an Untargeted Metabolomic Approach. J. Proteome Res. 2018, 17, 3997–4007. [Google Scholar] [CrossRef] [PubMed]
- American Diabetes Association. 2. Classification and Diagnosis of Diabetes. Diabetes Care 2021, 44, S15–S33. [Google Scholar] [CrossRef]
- Levey, A.S.; Stevens, L.A.; Schmid, C.H.; Zhang, Y.L.; Castro, A.F.; Feldman, H.I.; Kusek, J.W.; Eggers, P.; Van Lente, F.; Greene, T.; et al. A new equation to estimate glomerular filtration rate. Ann. Intern. Med. 2009, 150, 604–612. [Google Scholar] [CrossRef] [PubMed]
- Dunn, W.B.; Broadhurst, D.; Begley, P.; Zelena, E.; Francis-McIntyre, S.; Anderson, N.; Brown, M.; Knowles, J.D.; Halsall, A.; Haselden, J.N.; et al. Procedures for large-scale metabolic profiling of serum and plasma using gas chromatography and liquid chromatography coupled to mass spectrometry. Nat. Protoc. 2011, 6, 1060–1083. [Google Scholar] [CrossRef] [PubMed]
- Neis, E.P.J.G.; Sabrkhany, S.; Hundscheid, I.; Schellekens, D.; Lenaerts, K.; Olde Damink, S.W.; Blaak, E.E.; Dejong, C.H.C.; Rensen, S.S. Human splanchnic amino-acid metabolism. Amino Acids 2017, 49, 161–172. [Google Scholar] [CrossRef] [PubMed]
- Bröer, S.; Fairweather, S.J. Amino Acid Transport across the Mammalian Intestine. Compr. Physiol. 2018, 9, 343–373. [Google Scholar] [CrossRef] [PubMed]
- Nagata, C.; Nakamura, K.; Wada, K.; Tsuji, M.; Tamai, Y.; Kawachi, T. Branched-chain amino acid intake and the risk of diabetes in a Japanese community: The Takayama study. Am. J. Epidemiol. 2013, 178, 1226–1232. [Google Scholar] [CrossRef] [PubMed]
- Zheng, Y.; Li, Y.; Qi, Q.; Hruby, A.; Manson, J.E.; Willett, W.C.; Wolpin, B.M.; Hu, F.B.; Qi, L. Cumulative consumption of branched-chain amino acids and incidence of type 2 diabetes. Int. J. Epidemiol. 2016, 45, 1482–1492. [Google Scholar] [CrossRef]
- Lotta, L.A.; Scott, R.A.; Sharp, S.J.; Burgess, S.; Luan, J.a.; Tillin, T.; Schmidt, A.F.; Imamura, F.; Stewart, I.D.; Perry, J.R.B.; et al. Genetic Predisposition to an Impaired Metabolism of the Branched-Chain Amino Acids and Risk of Type 2 Diabetes: A Mendelian Randomisation Analysis. PLoS Med. 2016, 13, e1002179. [Google Scholar] [CrossRef] [PubMed]
- Wang-Sattler, R.; Yu, Z.; Herder, C.; Messias, A.C.; Floegel, A.; He, Y.; Heim, K.; Campillos, M.; Holzapfel, C.; Thorand, B.; et al. Novel biomarkers for pre-diabetes identified by metabolomics. Mol. Syst. Biol. 2012, 8, 615. [Google Scholar] [CrossRef] [PubMed]
- Floegel, A.; Stefan, N.; Yu, Z.; Mühlenbruch, K.; Drogan, D.; Joost, H.-G.; Fritsche, A.; Häring, H.-U.; Hrabě de Angelis, M.; Peters, A.; et al. Identification of serum metabolites associated with risk of type 2 diabetes using a targeted metabolomic approach. Diabetes 2013, 62, 639–648. [Google Scholar] [CrossRef]
- Tillin, T.; Hughes, A.D.; Wang, Q.; Würtz, P.; Ala-Korpela, M.; Sattar, N.; Forouhi, N.G.; Godsland, I.F.; Eastwood, S.V.; McKeigue, P.M.; et al. Diabetes risk and amino acid profiles: Cross-sectional and prospective analyses of ethnicity, amino acids and diabetes in a South Asian and European cohort from the SABRE (Southall And Brent REvisited) Study. Diabetologia 2015, 58, 968–979. [Google Scholar] [CrossRef] [PubMed]
- Jang, C.; Oh, S.F.; Wada, S.; Rowe, G.C.; Liu, L.; Chan, M.C.; Rhee, J.; Hoshino, A.; Kim, B.; Ibrahim, A.; et al. A branched-chain amino acid metabolite drives vascular fatty acid transport and causes insulin resistance. Nat. Med. 2016, 22, 421–426. [Google Scholar] [CrossRef] [PubMed]
- Neinast, M.D.; Jang, C.; Hui, S.; Murashige, D.S.; Chu, Q.; Morscher, R.J.; Li, X.; Zhan, L.; White, E.; Anthony, T.G.; et al. Quantitative Analysis of the Whole-Body Metabolic Fate of Branched-Chain Amino Acids. Cell Metab. 2019, 29, 417–429. [Google Scholar] [CrossRef] [PubMed]
- Luo, H.-H.; Feng, X.-F.; Yang, X.-L.; Hou, R.-Q.; Fang, Z.-Z. Interactive effects of asparagine and aspartate homeostasis with sex and age for the risk of type 2 diabetes risk. Biol. Sex Differ. 2020, 11, 58. [Google Scholar] [CrossRef] [PubMed]
- Krall, A.S.; Xu, S.; Graeber, T.G.; Braas, D.; Christofk, H.R. Asparagine promotes cancer cell proliferation through use as an amino acid exchange factor. Nat. Commun. 2016, 7, 11457. [Google Scholar] [CrossRef] [PubMed]
- Saxton, R.A.; Sabatini, D.M. mTOR Signaling in Growth, Metabolism, and Disease. Cell 2017, 169, 361–371. [Google Scholar] [CrossRef]
- Rebholz, C.M.; Yu, B.; Zheng, Z.; Chang, P.; Tin, A.; Köttgen, A.; Wagenknecht, L.E.; Coresh, J.; Boerwinkle, E.; Selvin, E. Serum metabolomic profile of incident diabetes. Diabetologia 2018, 61, 1046–1054. [Google Scholar] [CrossRef] [PubMed]
- Chen, G.; Wang, Y.; Li, Y.; Zhang, L.; Dong, M. A novel hippocampus metabolite signature in diabetes mellitus rat model of diabetic encephalopathy. Metab. Brain Dis. 2020, 35, 895–904. [Google Scholar] [CrossRef]
- Zyśk, M.; Pikul, P.; Kowalski, R.; Lewandowski, K.; Sakowicz-Burkiewicz, M.; Pawełczyk, T. Neither Excessive Nitric Oxide Accumulation nor Acute Hyperglycemia Affects the -Acetylaspartate Network in Wistar Rat Brain Cells. Int. J. Mol. Sci. 2020, 21, 8541. [Google Scholar] [CrossRef] [PubMed]
- Mangia, S.; Kumar, A.F.; Moheet, A.A.; Roberts, R.J.; Eberly, L.E.; Seaquist, E.R.; Tkáč, I. Neurochemical profile of patients with type 1 diabetes measured by ¹H-MRS at 4 T. J. Cereb. Blood Flow Metab. 2013, 33, 754–759. [Google Scholar] [CrossRef] [PubMed]
- Bansal, A.; Pinney, S.E. DNA methylation and its role in the pathogenesis of diabetes. Pediatr. Diabetes 2017, 18, 167–177. [Google Scholar] [CrossRef] [PubMed]
- Ling, C.; Rönn, T. Epigenetics in Human Obesity and Type 2 Diabetes. Cell Metab. 2019, 29, 1028–1044. [Google Scholar] [CrossRef] [PubMed]
- Lamichhane, S.; Kemppainen, E.; Trošt, K.; Siljander, H.; Hyöty, H.; Ilonen, J.; Toppari, J.; Veijola, R.; Hyötyläinen, T.; Knip, M.; et al. Circulating metabolites in progression to islet autoimmunity and type 1 diabetes. Diabetologia 2019, 62, 2287–2297. [Google Scholar] [CrossRef] [PubMed]
- Yin, J.; Ren, W.; Chen, S.; Li, Y.; Han, H.; Gao, J.; Liu, G.; Wu, X.; Li, T.; Kim, S.W.; et al. Metabolic Regulation of Methionine Restriction in Diabetes. Mol. Nutr. Food Res. 2018, 62, e1700951. [Google Scholar] [CrossRef] [PubMed]
- Kitada, M.; Ogura, Y.; Monno, I.; Xu, J.; Koya, D. Methionine abrogates the renoprotective effect of a low-protein diet against diabetic kidney disease in obese rats with type 2 diabetes. Aging 2020, 12, 4489–4505. [Google Scholar] [CrossRef]
- Cooke, D.; Ouattara, A.; Ables, G.P. Dietary methionine restriction modulates renal response and attenuates kidney injury in mice. FASEB J. 2018, 32, 693–702. [Google Scholar] [CrossRef] [PubMed]
- Kim, D.H.; Kim, S.M.; Lee, B.; Lee, E.K.; Chung, K.W.; Moon, K.M.; An, H.J.; Kim, K.M.; Yu, B.P.; Chung, H.Y. Effect of betaine on hepatic insulin resistance through FOXO1-induced NLRP3 inflammasome. J. Nutr. Biochem. 2017, 45, 104–114. [Google Scholar] [CrossRef] [PubMed]
- Jung, G.-Y.; Won, S.-B.; Kim, J.; Jeon, S.; Han, A.; Kwon, Y.H. Betaine Alleviates Hypertriglycemia and Tau Hyperphosphorylation in db/db Mice. Toxicol. Res. 2013, 29, 7–14. [Google Scholar] [CrossRef] [PubMed][Green Version]
- Chen, L.; Chen, Y.-M.; Wang, L.-J.; Wei, J.; Tan, Y.-Z.; Zhou, J.-Y.; Yang, Y.; Chen, Y.-M.; Ling, W.-H.; Zhu, H.-L. Higher homocysteine and lower betaine increase the risk of microangiopathy in patients with diabetes mellitus carrying the GG genotype of PEMT G774C. Diabetes Metab. Res. Rev. 2013, 29, 607–617. [Google Scholar] [CrossRef]
- Lever, M.; Sizeland, P.C.; Bason, L.M.; Hayman, C.M.; Robson, R.A.; Chambers, S.T. Abnormal glycine betaine content of the blood and urine of diabetic and renal patients. Clin. Chim. Acta 1994, 230, 69–79. [Google Scholar] [CrossRef]


Publisher’s Note: MDPI stays neutral with regard to jurisdictional claims in published maps and institutional affiliations. |
© 2022 by the authors. Licensee MDPI, Basel, Switzerland. This article is an open access article distributed under the terms and conditions of the Creative Commons Attribution (CC BY) license (https://creativecommons.org/licenses/by/4.0/).