
Perirenal Fat Thickness Significantly Associated with Prognosis of Metastatic Renal Cell Cancer Patients Receiving Anti-VEGF Therapy

 ,
,
Abstract
:1. Introduction
2. Materials and Methods
2.1. Clinical Data Collection
2.2. Measures of CT-Based Body Composition
2.3. NanoString Digital Spatial Profiler
2.4. Quantitative Reverse Transcription Polymerase Chain Reaction (RT-qPCR)
2.5. Statistical Analysis
3. Results
3.1. Patient Characteristics and Outcomes
3.2. Univariable Analysis
3.3. Multivariable Analysis
3.4. PRFT-Modified IMDC Model
3.5. Gene Sequencing Analysis in Different PRFT
4. Discussion
5. Conclusions
Supplementary Materials
Author Contributions
Funding
Institutional Review Board Statement
Informed Consent Statement
Data Availability Statement
Conflicts of Interest
Abbreviations
| Anti-VEGF | anti-vascular endothelial growth factor |
| AIC | Akaike’s Information Criteria |
| BMI | body mass index |
| C-index | concordance index |
| CT | computed tomography |
| IMDC | International Metastatic renal-cell-carcinoma Database Consortium |
| IQR | interquartile range |
| IL-6 | interleukin-6 |
| LLN | lower limit of normal |
| mRCC | metastatic renal cell carcinoma |
| OS | overall survival |
| PFS | progression-free survival |
| PRFT | perirenal fat thickness |
| RCC | Renal cell carcinoma |
| RT-qPCR | quantitative reverse transcription polymerase chain reaction |
| SAT | subcutaneous adipose tissue |
| SM | skeletal muscle |
| SMI | skeletal muscle index |
| TAT | total adipose tissue |
| TDT | time from diagnosis to treatment |
| TNF | tumor necrosis factor |
| ULN | upper limit of normal |
| VAT | visceral adipose tissue |
References
- Atkins, M.B.; Tannir, N.M. Current and emerging therapies for first-line treatment of metastatic clear cell renal cell carcinoma. Cancer Treat. Rev. 2018, 70, 127–137. [Google Scholar] [CrossRef] [PubMed]
- Huang, J.; Wang, Y.; Zhang, H.; Hu, X.; Wang, P.; Cai, W.; Yuan, Y.; Zeng, H.; Zhang, J.; Kong, W.; et al. Clinical outcomes of second-line treatment following first-line VEGFR-TKI failure in patients with metastatic renal cell carcinoma: A comparison of axitinib alone and axitinib plus anti-PD-1 antibody. Cancer Commun. 2021, 41, 1071–1074. [Google Scholar] [CrossRef] [PubMed]
- Barata, P.C.; Rini, B.I. Treatment of renal cell carcinoma: Current status and future directions. CA Cancer J. Clin. 2017, 67, 507–524. [Google Scholar] [CrossRef] [PubMed]
- Heng, D.Y.; Xie, W.; Regan, M.M.; Warren, M.A.; Golshayan, A.R.; Sahi, C.; Eigl, B.J.; Ruether, J.D.; Cheng, T.; North, S.; et al. Prognostic factors for overall survival in patients with metastatic renal cell carcinoma treated with vascular endothelial growth factor-targeted agents: Results from a large, multicenter study. J. Clin. Oncol. 2009, 27, 5794–5799. [Google Scholar] [CrossRef]
- Heng, D.Y.; Xie, W.; Regan, M.M.; Harshman, L.C.; Bjarnason, G.A.; Vaishampayan, U.N.; Mackenzie, M.; Wood, L.; Donskov, F.; Tan, M.H.; et al. External validation and comparison with other models of the International Metastatic Renal-Cell Carcinoma Database Consortium prognostic model: A population-based study. Lancet. Oncol. 2013, 14, 141–148. [Google Scholar] [CrossRef]
- Rini, B.I. Metastatic renal cell carcinoma: Many treatment options, one patient. J. Clin. Oncol. 2009, 27, 3225–3234. [Google Scholar] [CrossRef]
- Albiges, L.; Hakimi, A.A.; Xie, W.; McKay, R.R.; Simantov, R.; Lin, X.; Lee, J.L.; Rini, B.I.; Srinivas, S.; Bjarnason, G.A.; et al. Body Mass Index and Metastatic Renal Cell Carcinoma: Clinical and Biological Correlations. J. Clin. Oncol. 2016, 34, 3655–3663. [Google Scholar] [CrossRef]
- Park, Y.; Peterson, L.L.; Colditz, G.A. The Plausibility of Obesity Paradox in Cancer-Point. Cancer Res. 2018, 78, 1898–1903. [Google Scholar] [CrossRef]
- Gonzalez, M.C.; Pastore, C.A.; Orlandi, S.P.; Heymsfield, S.B. Obesity paradox in cancer: New insights provided by body composition. Am. J. Clin. Nutr. 2014, 99, 999–1005. [Google Scholar] [CrossRef]
- Shachar, S.S.; Williams, G.R. The Obesity Paradox in Cancer-Moving beyond BMI-Response. Cancer Epidemiol. Biomark. Prev. 2017, 26, 981. [Google Scholar] [CrossRef]
- Yasunaga, H.; Horiguchi, H.; Matsuda, S.; Fushimi, K.; Hashimoto, H.; Ayanian, J.Z. Body mass index and outcomes following gastrointestinal cancer surgery in Japan. Br. J. Surg. 2013, 100, 1335–1343. [Google Scholar] [CrossRef] [PubMed]
- Mullen, J.T.; Moorman, D.W.; Davenport, D.L. The obesity paradox: Body mass index and outcomes in patients undergoing nonbariatric general surgery. Ann. Surg. 2009, 250, 166–172. [Google Scholar] [CrossRef] [PubMed]
- Caan, B.J.; Cespedes Feliciano, E.M.; Prado, C.M.; Alexeeff, S.; Kroenke, C.H.; Bradshaw, P.; Quesenberry, C.P.; Weltzien, E.K.; Castillo, A.L.; Olobatuyi, T.A.; et al. Association of Muscle and Adiposity Measured by Computed Tomography With Survival in Patients With Nonmetastatic Breast Cancer. JAMA Oncol. 2018, 4, 798–804. [Google Scholar] [CrossRef]
- Andreoli, A.; Garaci, F.; Cafarelli, F.P.; Guglielmi, G. Body composition in clinical practice. Eur. J. Radiol. 2016, 85, 1461–1468. [Google Scholar] [CrossRef] [PubMed]
- Vijay, J.; Gauthier, M.F.; Biswell, R.L.; Louiselle, D.A.; Johnston, J.J.; Cheung, W.A.; Belden, B.; Pramatarova, A.; Biertho, L.; Gibson, M.; et al. Single-cell analysis of human adipose tissue identifies depot and disease specific cell types. Nat. Metab. 2020, 2, 97–109. [Google Scholar] [CrossRef]
- Ibrahim, M.M. Subcutaneous and visceral adipose tissue: Structural and functional differences. Obes. Rev. 2010, 11, 11–18. [Google Scholar] [CrossRef]
- Chau, Y.Y.; Bandiera, R.; Serrels, A.; Martínez-Estrada, O.M.; Qing, W.; Lee, M.; Slight, J.; Thornburn, A.; Berry, R.; McHaffie, S.; et al. Visceral and subcutaneous fat have different origins and evidence supports a mesothelial source. Nat. Cell Biol. 2014, 16, 367–375. [Google Scholar] [CrossRef]
- Sanchez-Gurmaches, J.; Guertin, D.A. Adipocytes arise from multiple lineages that are heterogeneously and dynamically distributed. Nat. Commun. 2014, 5, 4099. [Google Scholar] [CrossRef]
- Chen, X.; Mao, Y.; Hu, J.; Han, S.; Gong, L.; Luo, T.; Yang, S.; Qing, H.; Wang, Y.; Du, Z.; et al. Perirenal Fat Thickness Is Significantly Associated With the Risk for Development of Chronic Kidney Disease in Patients With Diabetes. Diabetes 2021, 70, 2322–2332. [Google Scholar] [CrossRef]
- Davidiuk, A.J.; Parker, A.S.; Thomas, C.S.; Leibovich, B.C.; Castle, E.P.; Heckman, M.G.; Custer, K.; Thiel, D.D. Mayo adhesive probability score: An accurate image-based scoring system to predict adherent perinephric fat in partial nephrectomy. Eur. Urol. 2014, 66, 1165–1171. [Google Scholar] [CrossRef]
- Shen, W.; Punyanitya, M.; Wang, Z.; Gallagher, D.; St-Onge, M.P.; Albu, J.; Heymsfield, S.B.; Heshka, S. Total body skeletal muscle and adipose tissue volumes: Estimation from a single abdominal cross-sectional image. J. Appl. Physiol. (Bethesda, Md. 1985) 2004, 97, 2333–2338. [Google Scholar] [CrossRef]
- Ulrich, C.M.; Himbert, C.; Holowatyj, A.N.; Hursting, S.D. Energy balance and gastrointestinal cancer: Risk, interventions, outcomes and mechanisms. Nat. Rev. Gastroenterol. Hepatol. 2018, 15, 683–698. [Google Scholar] [CrossRef]
- World Health Organization. Appropriate body-mass index for Asian populations and its implications for policy and intervention strategies. Lancet 2004, 363, 157–163. [Google Scholar] [CrossRef]
- Martinez-Tapia, C.; Diot, T.; Oubaya, N.; Paillaud, E.; Poisson, J.; Gisselbrecht, M.; Morisset, L.; Caillet, P.; Baudin, A.; Pamoukdjian, F.; et al. The obesity paradox for mid- and long-term mortality in older cancer patients: A prospective multicenter cohort study. Am. J. Clin. Nutr. 2021, 113, 129–141. [Google Scholar] [CrossRef]
- Kyrgiou, M.; Kalliala, I.; Markozannes, G.; Gunter, M.J.; Paraskevaidis, E.; Gabra, H.; Martin-Hirsch, P.; Tsilidis, K.K. Adiposity and cancer at major anatomical sites: Umbrella review of the literature. BMJ (Clin. Res. Ed.) 2017, 356, j477. [Google Scholar] [CrossRef]
- Capitanio, U.; Bensalah, K.; Bex, A.; Boorjian, S.A.; Bray, F.; Coleman, J.; Gore, J.L.; Sun, M.; Wood, C.; Russo, P. Epidemiology of Renal Cell Carcinoma. Eur. Urol. 2019, 75, 74–84. [Google Scholar] [CrossRef]
- Carson, K.R.; Bartlett, N.L.; McDonald, J.R.; Luo, S.; Zeringue, A.; Liu, J.; Fu, Q.; Chang, S.H.; Colditz, G.A. Increased body mass index is associated with improved survival in United States veterans with diffuse large B-cell lymphoma. J. Clin. Oncol. 2012, 30, 3217–3222. [Google Scholar] [CrossRef]
- McQuade, J.L.; Daniel, C.R.; Hess, K.R.; Mak, C.; Wang, D.Y.; Rai, R.R.; Park, J.J.; Haydu, L.E.; Spencer, C.; Wongchenko, M.; et al. Association of body-mass index and outcomes in patients with metastatic melanoma treated with targeted therapy, immunotherapy, or chemotherapy: A retrospective, multicohort analysis. Lancet Oncol. 2018, 19, 310–322. [Google Scholar] [CrossRef]
- Okorodudu, D.O.; Jumean, M.F.; Montori, V.M.; Romero-Corral, A.; Somers, V.K.; Erwin, P.J.; Lopez-Jimenez, F. Diagnostic performance of body mass index to identify obesity as defined by body adiposity: A systematic review and meta-analysis. Int. J. Obes. 2010, 34, 791–799. [Google Scholar] [CrossRef]
- He, W.Z.; Jiang, C.; Liu, L.L.; Yin, C.X.; Rong, Y.M.; Hu, W.M.; Yang, L.; Wang, L.; Jin, Y.N.; Lin, X.P.; et al. Association of body composition with survival and inflammatory responses in patients with non-metastatic nasopharyngeal cancer. Oral Oncol. 2020, 108, 104771. [Google Scholar] [CrossRef]
- Chu, M.P.; Li, Y.; Ghosh, S.; Sass, S.; Smylie, M.; Walker, J.; Sawyer, M.B. Body composition is prognostic and predictive of ipilimumab activity in metastatic melanoma. J. Cachexia Sarcopenia Muscle 2020, 11, 748–755. [Google Scholar] [CrossRef]
- Vrieling, A.; Kampman, E.; Knijnenburg, N.C.; Mulders, P.F.; Sedelaar, J.P.M.; Baracos, V.E.; Kiemeney, L.A. Body Composition in Relation to Clinical Outcomes in Renal Cell Cancer: A Systematic Review and Meta-analysis. Eur. Urol. Focus 2018, 4, 420–434. [Google Scholar] [CrossRef]
- Gu, W.; Zhu, Y.; Wang, H.; Zhang, H.; Shi, G.; Liu, X.; Ye, D. Prognostic value of components of body composition in patients treated with targeted therapy for advanced renal cell carcinoma: A retrospective case series. PLoS ONE 2015, 10, e0118022. [Google Scholar] [CrossRef]
- Steffens, S.; Grünwald, V.; Ringe, K.I.; Seidel, C.; Eggers, H.; Schrader, M.; Wacker, F.; Kuczyk, M.A.; Schrader, A.J. Does obesity influence the prognosis of metastatic renal cell carcinoma in patients treated with vascular endothelial growth factor-targeted therapy? Oncologist 2011, 16, 1565–1571. [Google Scholar] [CrossRef]
- Dai, J.; Zhang, X.; Liu, Z.; Song, T.; Zhu, X.; Zhang, H.; Wu, M.; Li, X.; Zeng, H.; Shen, P. The Prognostic Value of Body Fat Components in Metastasis Renal Cell Carcinoma Patients Treated with TKIs. Cancer Manag. Res. 2020, 12, 891–903. [Google Scholar] [CrossRef]
- Ladoire, S.; Bonnetain, F.; Gauthier, M.; Zanetta, S.; Petit, J.M.; Guiu, S.; Kermarrec, I.; Mourey, E.; Michel, F.; Krause, D.; et al. Visceral fat area as a new independent predictive factor of survival in patients with metastatic renal cell carcinoma treated with antiangiogenic agents. Oncologist 2011, 16, 71–81. [Google Scholar] [CrossRef]
- Antoun, S.; Lanoy, E.; Iacovelli, R.; Albiges-Sauvin, L.; Loriot, Y.; Merad-Taoufik, M.; Fizazi, K.; di Palma, M.; Baracos, V.E.; Escudier, B. Skeletal muscle density predicts prognosis in patients with metastatic renal cell carcinoma treated with targeted therapies. Cancer 2013, 119, 3377–3384. [Google Scholar] [CrossRef]
- Favre, G.; Grangeon-Chapon, C.; Raffaelli, C.; François-Chalmin, F.; Iannelli, A.; Esnault, V. Perirenal fat thickness measured with computed tomography is a reliable estimate of perirenal fat mass. PLoS ONE 2017, 12, e0175561. [Google Scholar] [CrossRef]
- Sanchez, A.; Furberg, H.; Kuo, F.; Vuong, L.; Ged, Y.; Patil, S.; Ostrovnaya, I.; Petruzella, S.; Reising, A.; Patel, P.; et al. Transcriptomic signatures related to the obesity paradox in patients with clear cell renal cell carcinoma: A cohort study. Lancet Oncol. 2020, 21, 283–293. [Google Scholar] [CrossRef]
- Ma, S.; Zhu, X.Y.; Eirin, A.; Woollard, J.R.; Jordan, K.L.; Tang, H.; Lerman, A.; Lerman, L.O. Perirenal Fat Promotes Renal Arterial Endothelial Dysfunction in Obese Swine through Tumor Necrosis Factor-α. J. Urol. 2016, 195, 1152–1159. [Google Scholar] [CrossRef]
- Renehan, A.G.; Zwahlen, M.; Egger, M. Adiposity and cancer risk: New mechanistic insights from epidemiology. Nat. Rev. Cancer 2015, 15, 484–498. [Google Scholar] [CrossRef]
- Iyengar, N.M.; Gucalp, A.; Dannenberg, A.J.; Hudis, C.A. Obesity and Cancer Mechanisms: Tumor Microenvironment and Inflammation. J. Clin. Oncol. 2016, 34, 4270–4276. [Google Scholar] [CrossRef]


| Characteristics | All Patients (n = 358) |
|---|---|
| Age, median (IQR) | 56 (48–64) |
| Male, n (%) | 267 (74.6) |
| Karnofsky score < 80 *, n (%) | 81 (22.6) |
| TDT < 1 year, n (%) | 241 (67.3) |
| Clear cell carcinoma, n (%) | 249 (69.6) |
| Nephrectomy, n (%) | 289 (80.7) |
| Immunotherapy, n (%) | 146 (40.8) |
| Metastatic sites, n(%) | |
| Lung | 170 (47.5) |
| Bone | 102 (28.5) |
| Liver | 37 (10.3) |
| Adrenal gland | 37 (10.3) |
| Lymph node | 168 (46.9) |
| Laboratory marker, median (IQR) | |
| Hemoglobin, g/L | 128.0 (112.3–142.0) |
| Neutrophil, 109/L | 4.6 (3.5–6.8) |
| Platelets, 109/L | 245.5 (186.3–318.8) |
| Albumin, g/L | 40.9 (35.2–44.1) |
| Serum calcium, mmol/L | 128.0 (112.3–142.0) |
| First-line treatment, n (%) | |
| Sunitinib | 183 (51.1) |
| Axitinib | 68 (19.0) |
| Pazopanib | 60 (16.8) |
| Sorafenib | 30 (8.4) |
| Others | 17 (4.7) |
| Body composition, median (IQR) | |
| BMI, kg/m² | 23.0 (21.0–24.9) |
| PRFT, cm | 1.6 (1.1–2.6) |
| Lateral | 1.0 (0.6–1.5) |
| Posterior | 0.6 (0.4–1.0) |
| SM, cm² | 128.9 (108.6–146.9) |
| VAT, cm² | 81.9 (39.3–138.4) |
| SAT, cm² | 100.2 (66.1–145.4) |
| TAT, cm² | 195.1 (112.1–290.8) |
| SMI, cm² | 46.0 (40.4–51.5) |
| VAT/TAT | 0.4 (0.3–0.5) |
| Characteristics | Overall Survival * | Progression-Free Survival * | ||
|---|---|---|---|---|
| HR (95%CI) | p-Value | HR (95%CI) | p-Value | |
| Baseline characteristics | ||||
| Age > 60 | 1.03 (0.72–1.49) | 0.87 | 0.93 (0.73–1.18) | 0.54 |
| Female | 1.33 (0.87–2.03) | 0.19 | 1.13 (0.86–1.49) | 0.38 |
| Karnofsky score < 80 ** | 2.86 (1.96–4.18) | <0.001 | 1.92 (1.47–2.52) | <0.001 |
| Clear cell carcinoma | 0.93 (0.62–1.40) | 0.731 | 0.73 (0.56–0.94) | 0.01 |
| Treatment experience | ||||
| TDT < 1 year | 2.46 (1.56–3.87) | <0.001 | 1.30 (1.00–1.69) | 0.048 |
| Nephrectomy | 0.66 (0.4–1.06) | 0.09 | 0.57 (0.42–0.77) | <0.001 |
| Immunotherapy | 0.47 (0.32–0.70) | <0.001 | 0.93 (0.73–1.19) | 0.56 |
| Laboratory marker | ||||
| Albumin < LLN, g/L | 1.45 (1.01–2.09) | 0.05 | 1.23 (0.96–1.56) | 0.10 |
| Hemoglobin < LLN, g/L | 1.82 (1.25–2.66) | 0.002 | 1.58 (1.23–2.04) | <0.001 |
| Neutrophil > ULN, 109/L | 1.28 (0.87–1.88) | 0.21 | 1.11 (0.85–1.44) | 0.43 |
| Platelets > ULN, 109/L | 1.38 (0.93–2.04) | 0.11 | 1.27 (0.98–1.65) | 0.08 |
| Corrected calcium > ULN, mmol/L | 4.01 (2.39–6.74) | <0.001 | 2.41 (1.58–3.69) | <0.001 |
| Body composition *** | ||||
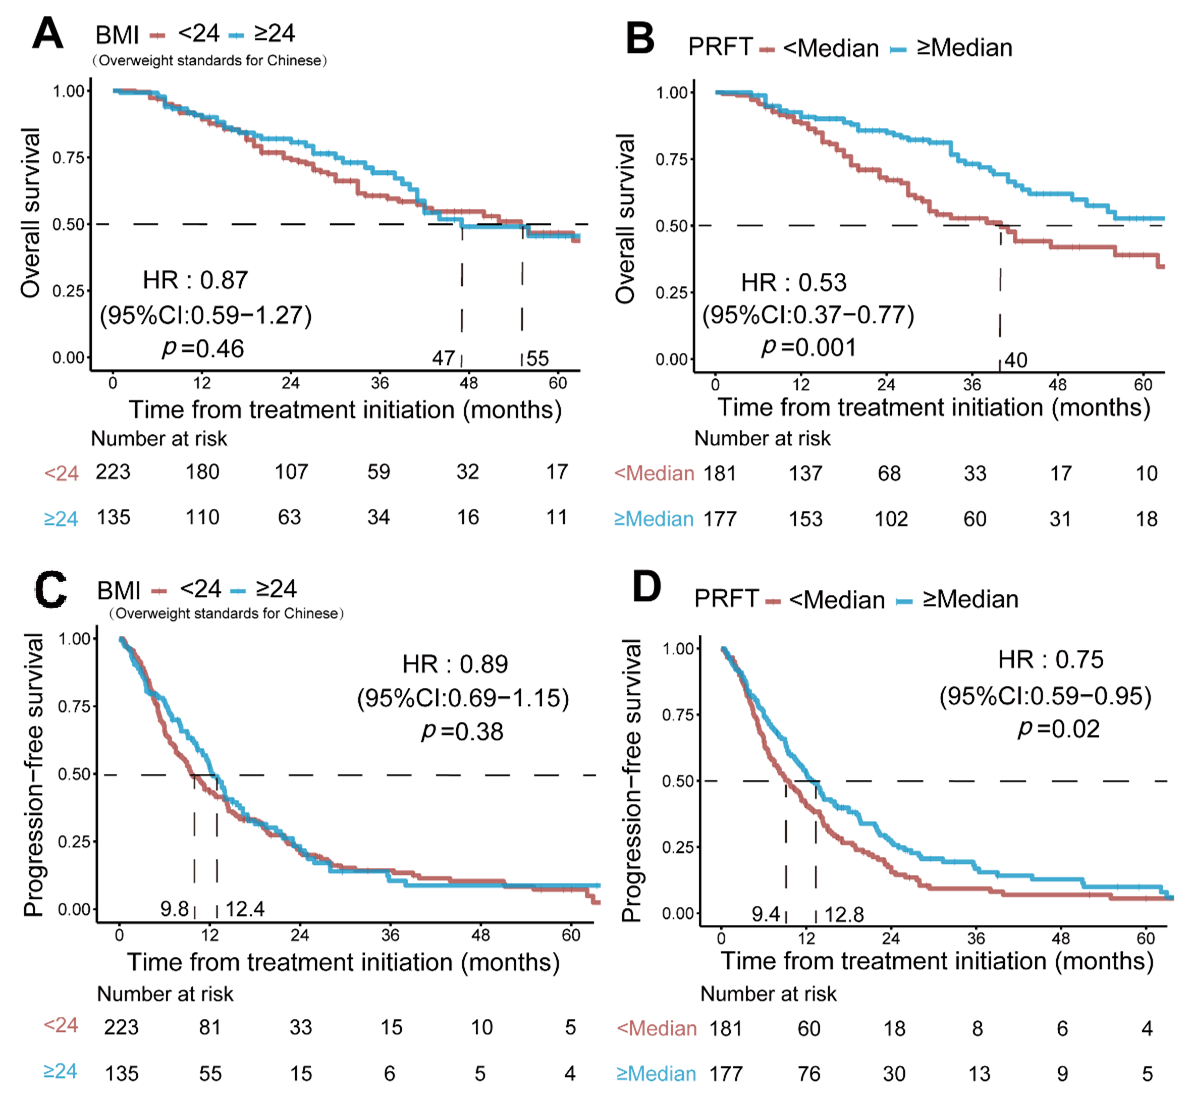
| BMI > 24, kg/m2 **** | 0.87 (0.59–1.27) | 0.46 | 0.89 (0.69–1.15) | 0.38 |
| PRFT > Median (1.6 cm) | 0.53 (0.37–0.77) | 0.001 | 0.75 (0.59–0.95) | 0.02 |
| SM > Median (128.9 cm2) | 0.70 (0.49–1.01) | 0.06 | 0.72 (0.57–0.92) | 0.009 |
| VAT > Median (81.9 cm2) | 0.60 (0.42–0.87) | 0.007 | 0.74 (0.58–0.94) | 0.01 |
| SAT > Median (100.2 cm2) | 0.47 (0.33–0.69) | <0.001 | 0.69 (0.54–0.88) | 0.002 |
| SMI > Median (46.0 cm2) | 0.88 (0.61–1.26) | 0.49 | 0.85 (0.67–1.08) | 0.19 |
| TAT > Median (195.1 cm2) | 0.56 (0.39–0.82) | 0.002 | 0.70 (0.55–0.89) | 0.004 |
| VAT/TAT > Median (0.4) | 0.97 (0.67–1.39) | 0.85 | 0.89 (0.7–1.13) | 0.33 |
Publisher’s Note: MDPI stays neutral with regard to jurisdictional claims in published maps and institutional affiliations. |
© 2022 by the authors. Licensee MDPI, Basel, Switzerland. This article is an open access article distributed under the terms and conditions of the Creative Commons Attribution (CC BY) license (https://creativecommons.org/licenses/by/4.0/).
Share and Cite
Ning, K.; Li, Z.; Liu, H.; Tian, X.; Wang, J.; Wu, Y.; Xiong, L.; Zou, X.; Peng, Y.; Zhou, Z.; et al. Perirenal Fat Thickness Significantly Associated with Prognosis of Metastatic Renal Cell Cancer Patients Receiving Anti-VEGF Therapy. Nutrients 2022, 14, 3388. https://doi.org/10.3390/nu14163388
Ning K, Li Z, Liu H, Tian X, Wang J, Wu Y, Xiong L, Zou X, Peng Y, Zhou Z, et al. Perirenal Fat Thickness Significantly Associated with Prognosis of Metastatic Renal Cell Cancer Patients Receiving Anti-VEGF Therapy. Nutrients. 2022; 14(16):3388. https://doi.org/10.3390/nu14163388
Chicago/Turabian StyleNing, Kang, Zhen Li, Huiming Liu, Xi Tian, Jun Wang, Yi Wu, Longbin Xiong, Xiangpeng Zou, Yulu Peng, Zhaohui Zhou, and et al. 2022. "Perirenal Fat Thickness Significantly Associated with Prognosis of Metastatic Renal Cell Cancer Patients Receiving Anti-VEGF Therapy" Nutrients 14, no. 16: 3388. https://doi.org/10.3390/nu14163388