
The Associations of Iron Related Biomarkers with Risk, Clinical Severity and Mortality in SARS-CoV-2 Patients: A Meta-Analysis

Abstract
:1. Introduction
2. Materials and Methods
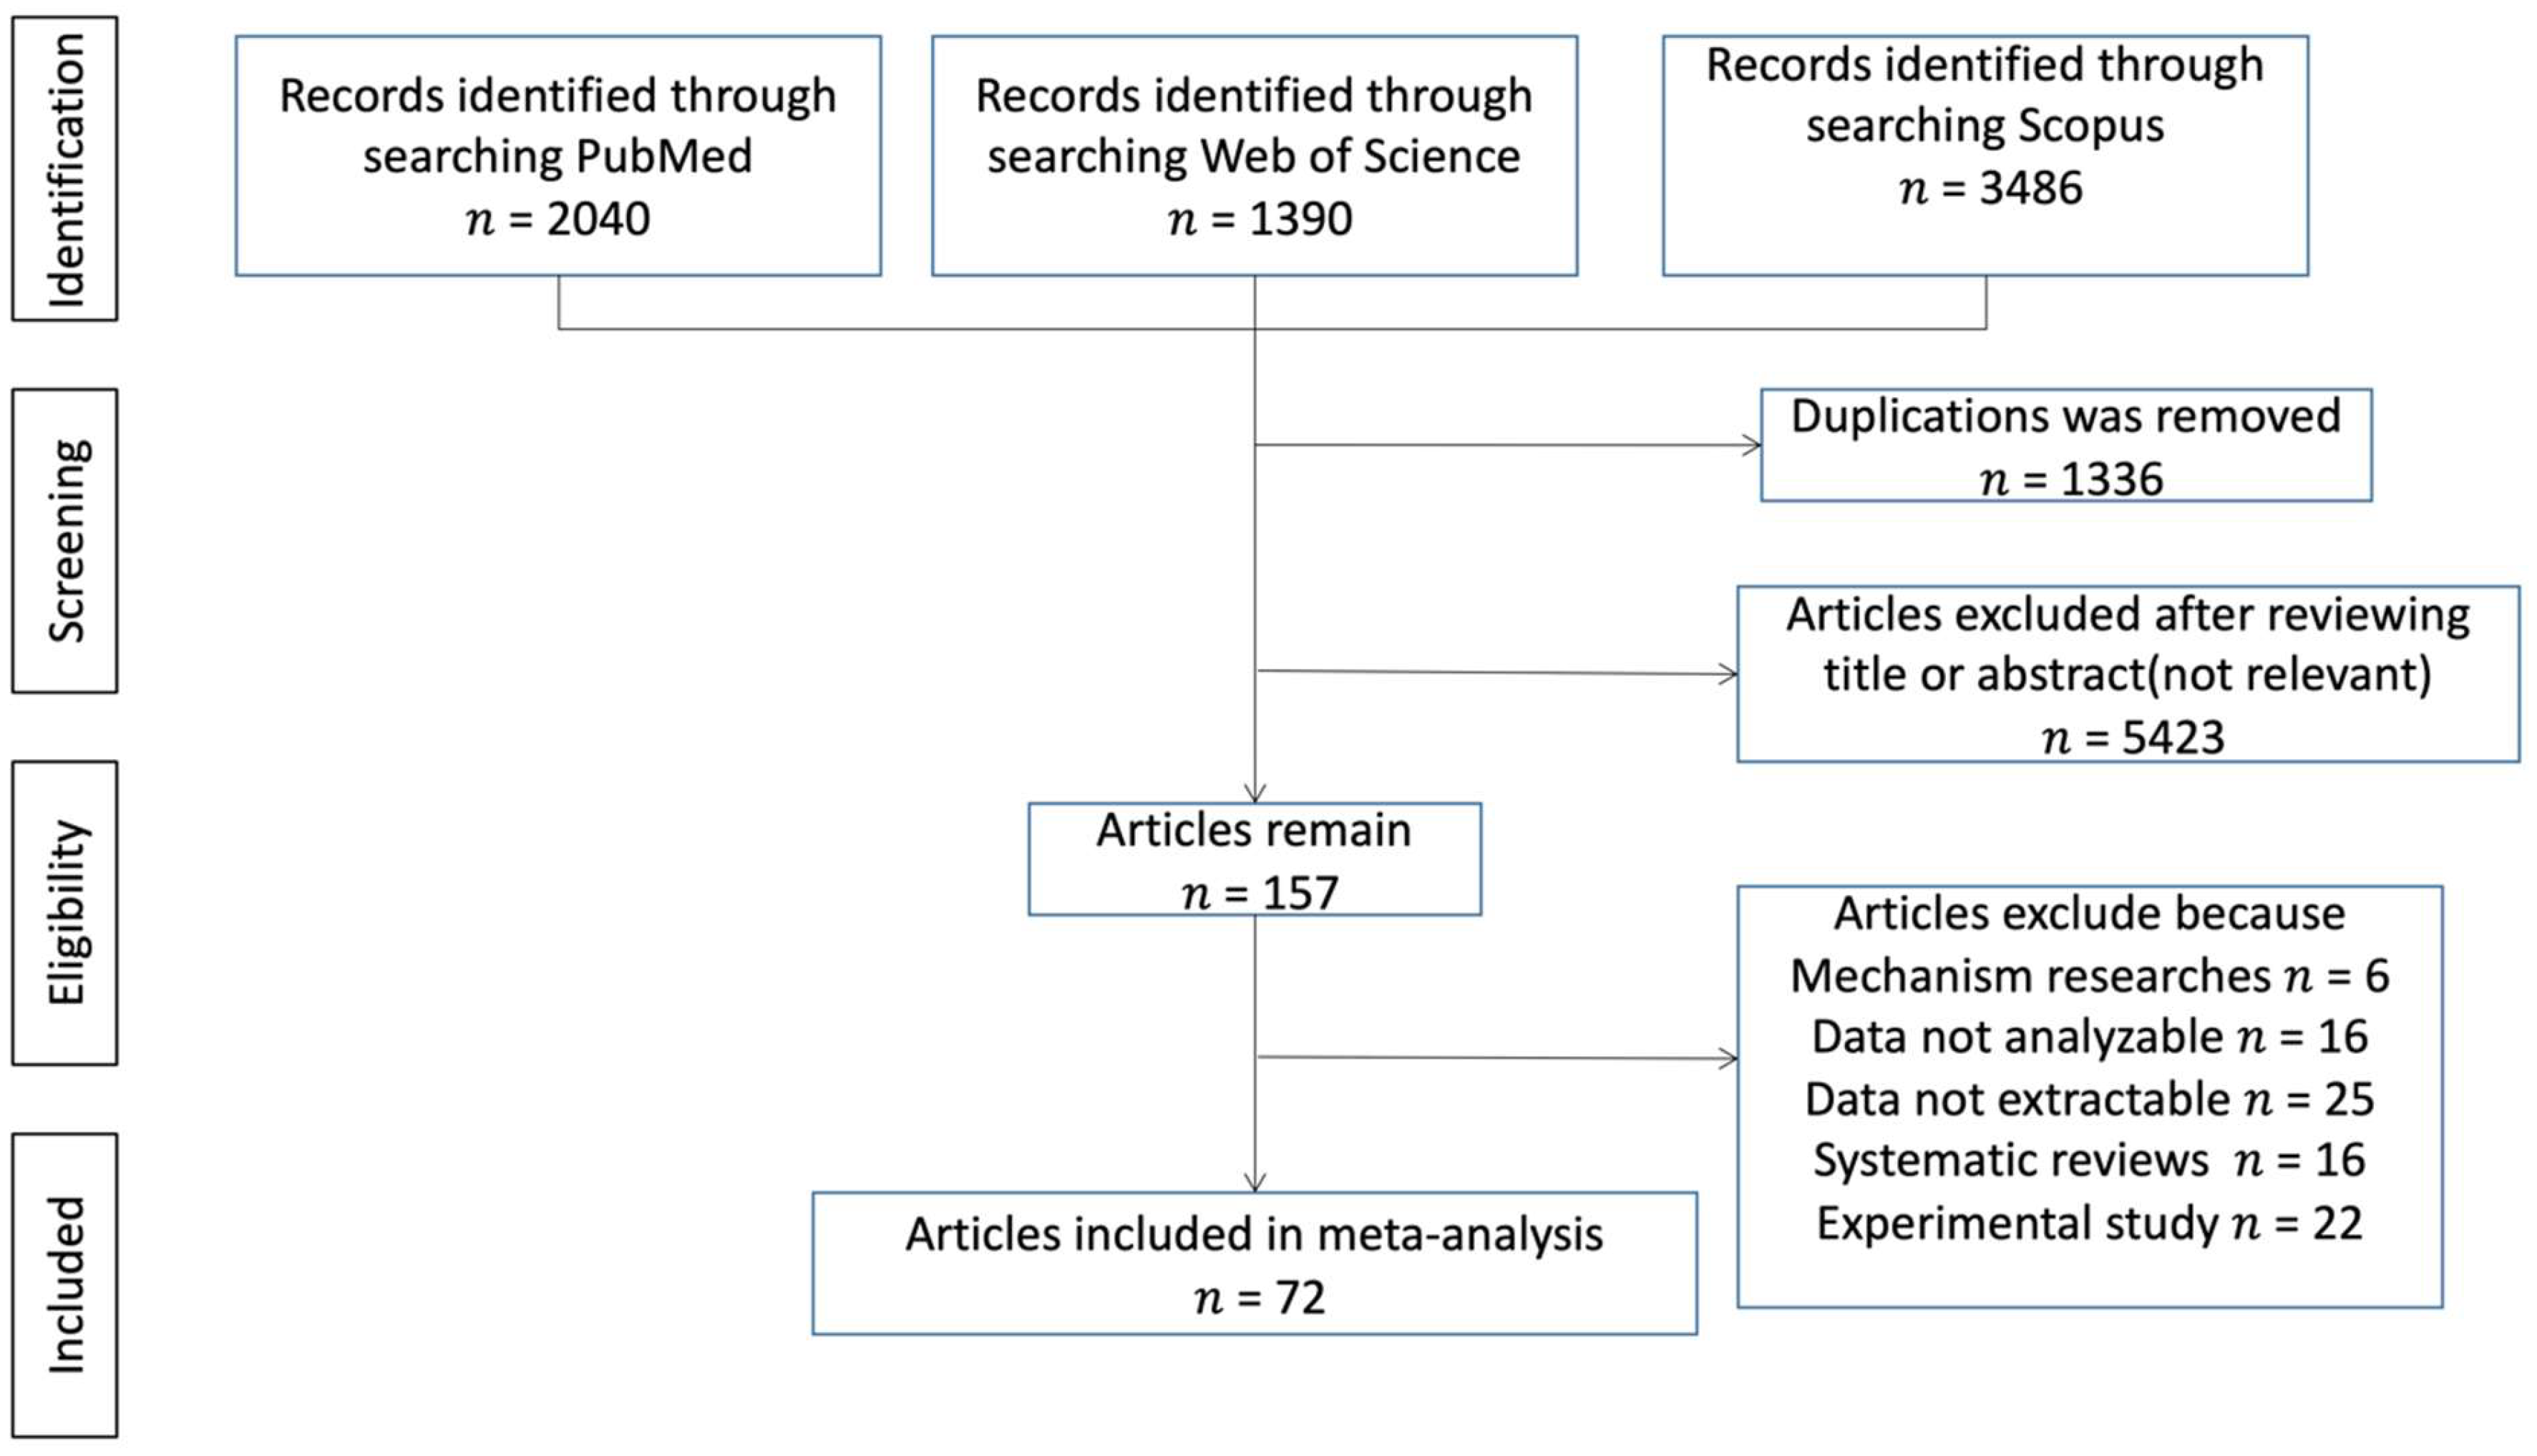
2.1. Literature Search and Data Selection Criteria
2.2. Data Selection Criteria
2.3. Data Extraction
2.4. Statistical Analyses
3. Results
3.1. Characteristics of Studies
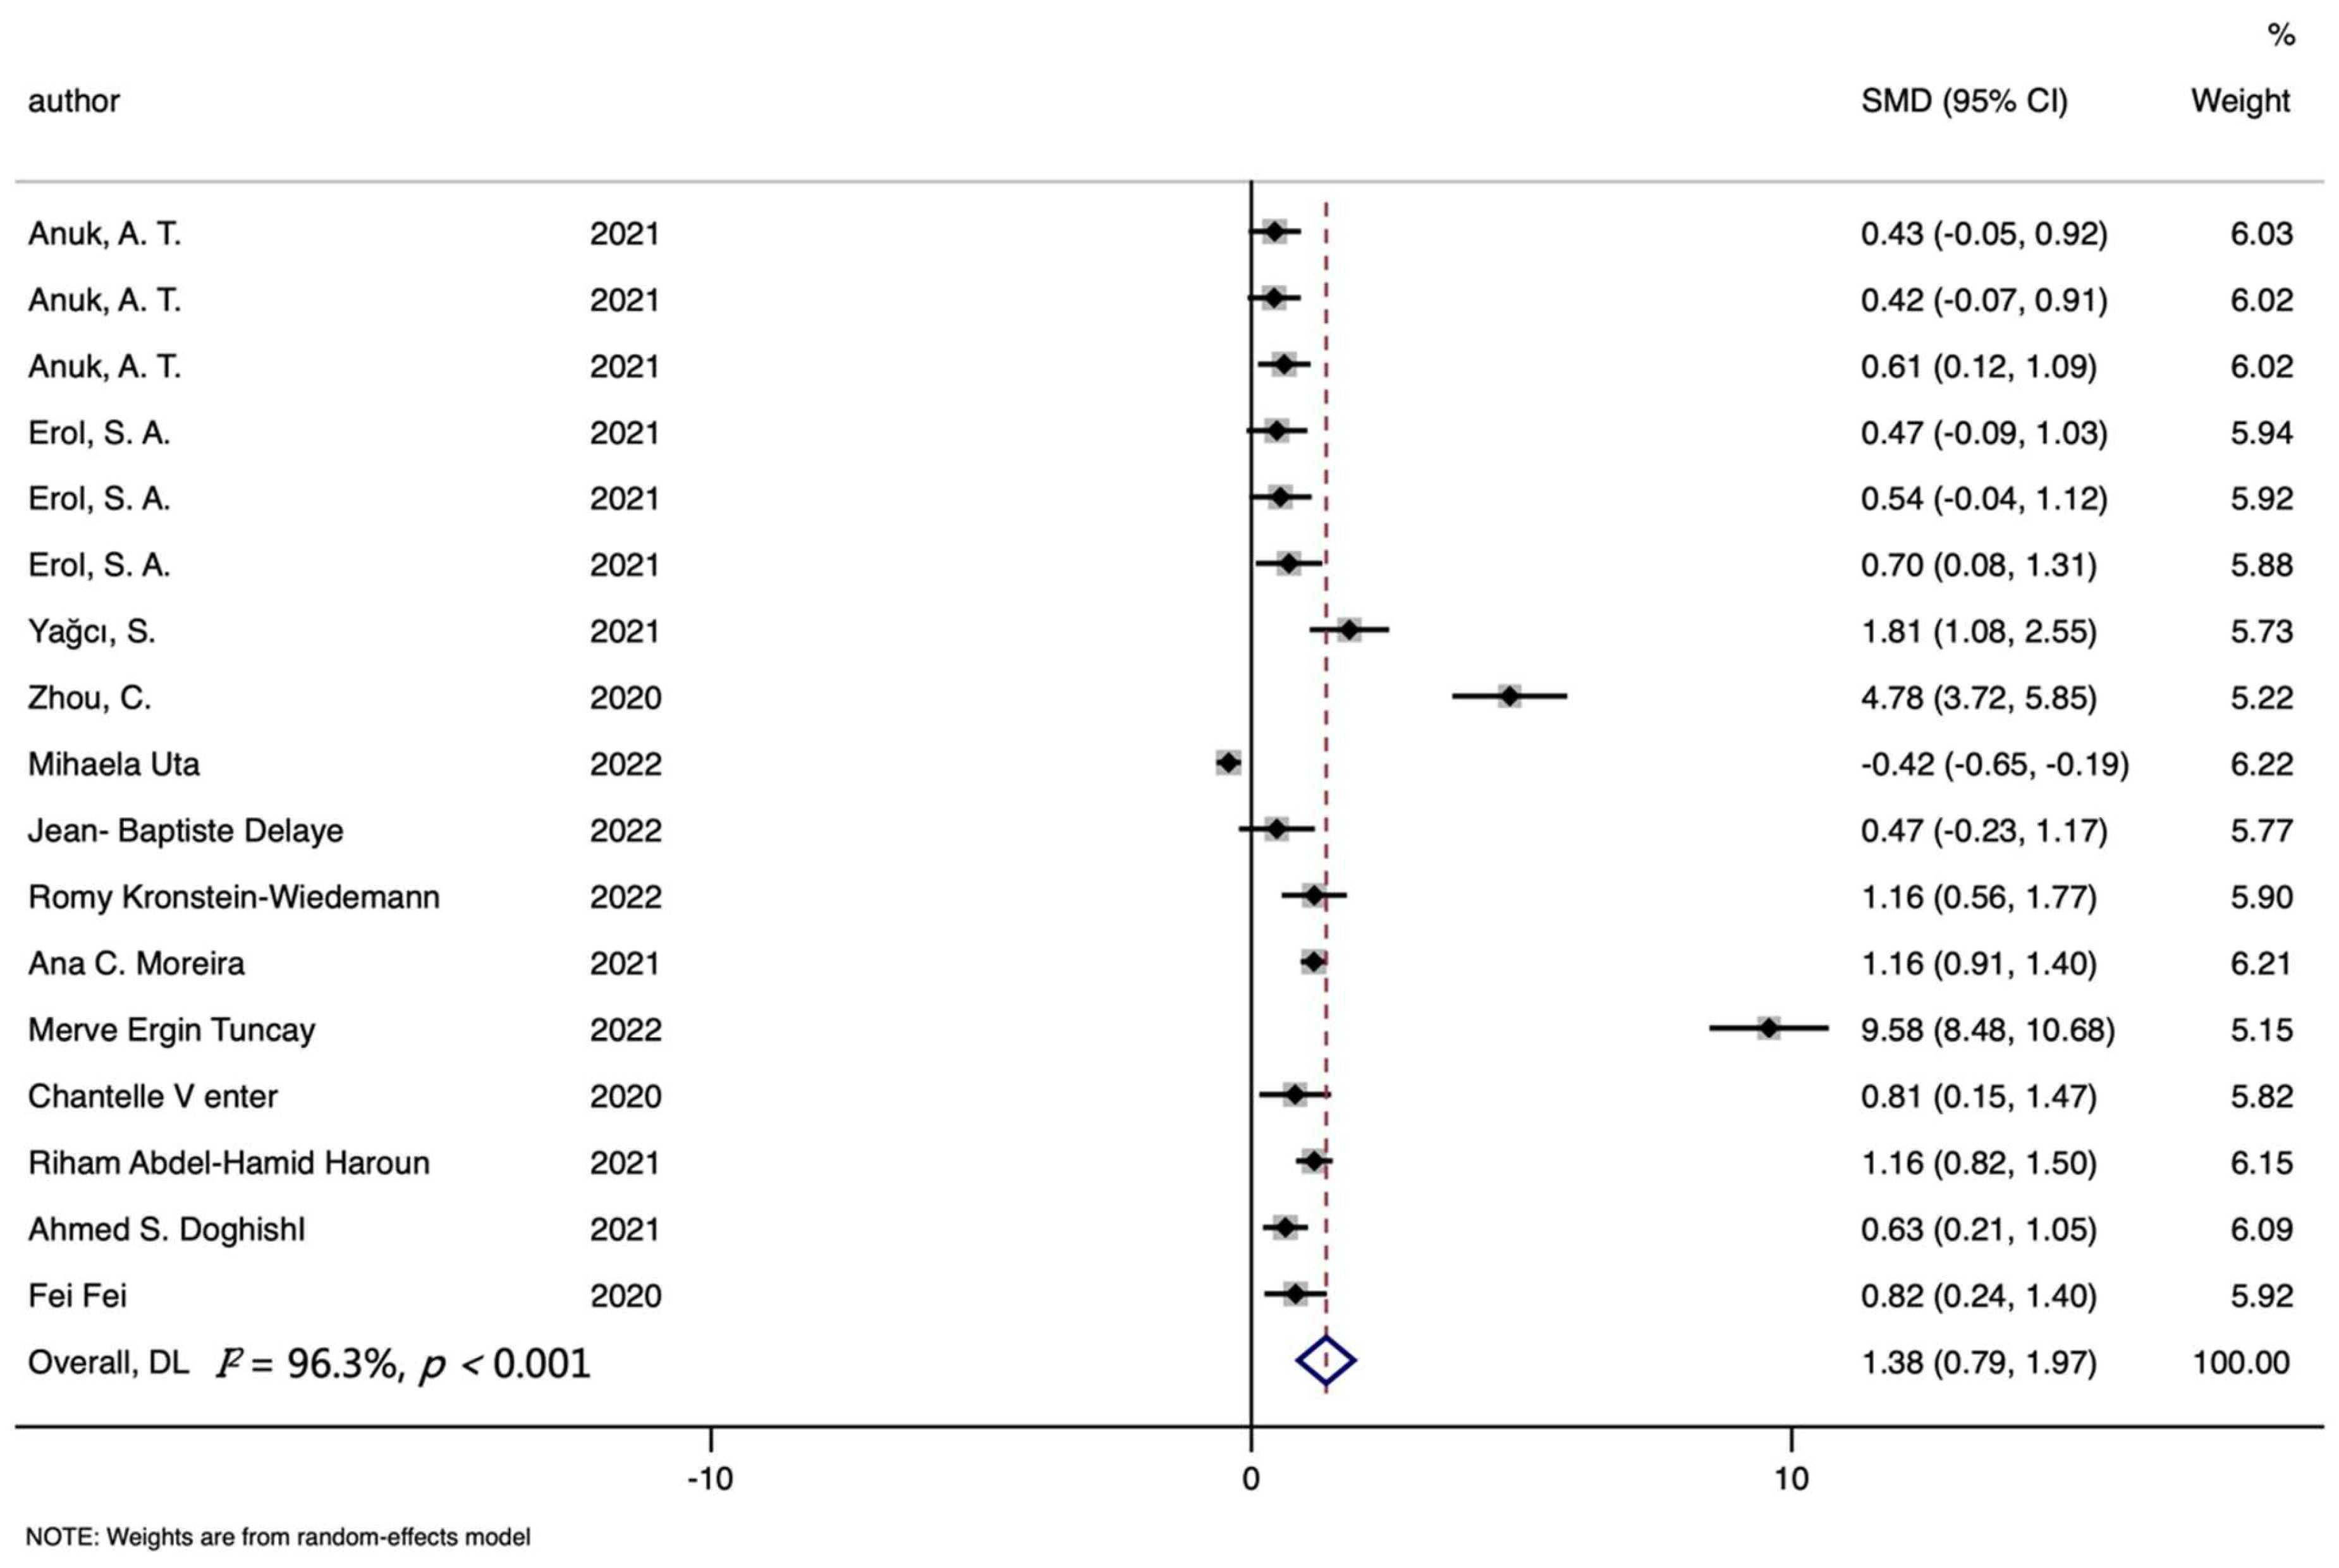
3.2. Ferritin Level and COVID-19
3.3. Serum or Plasma Iron Level and COVID-19
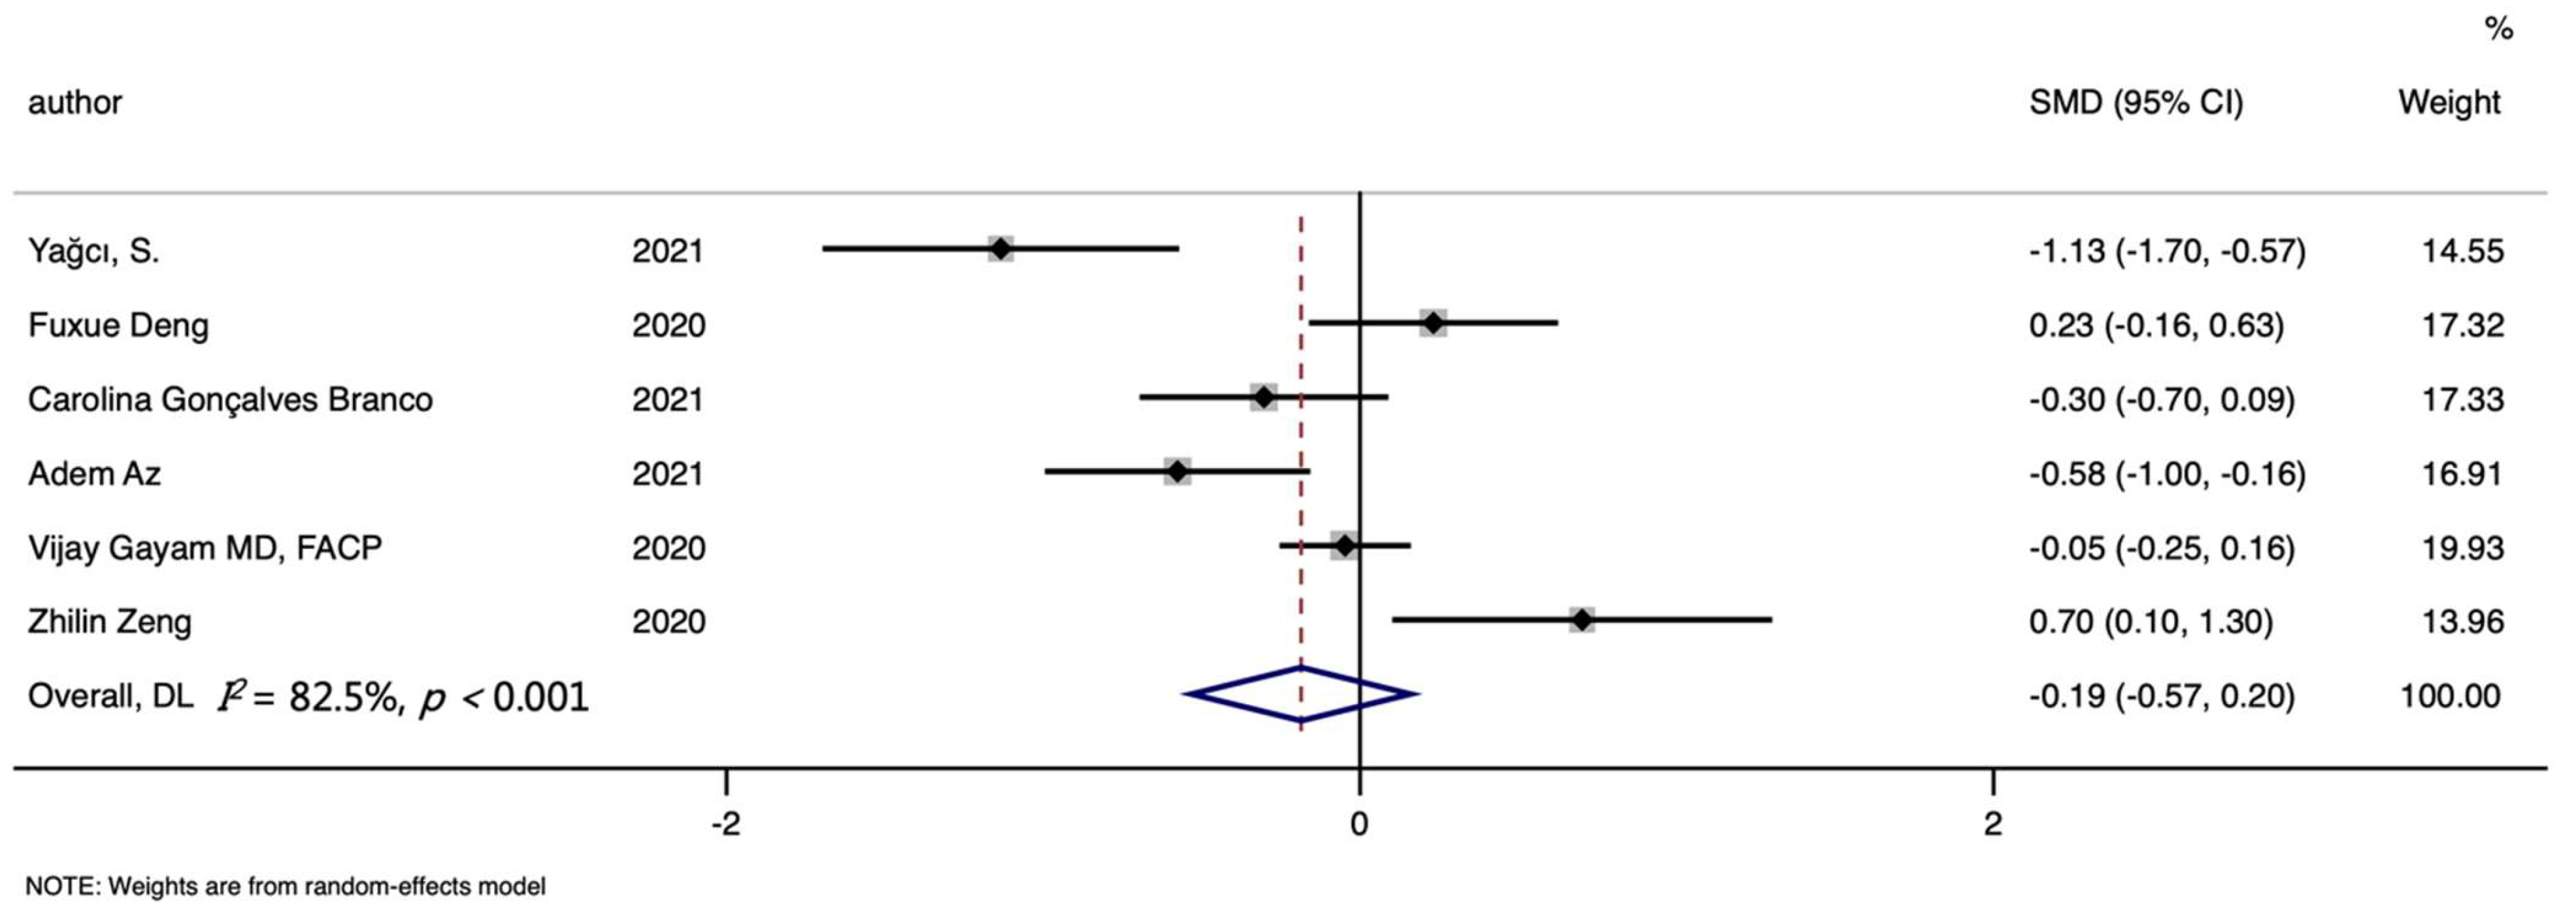
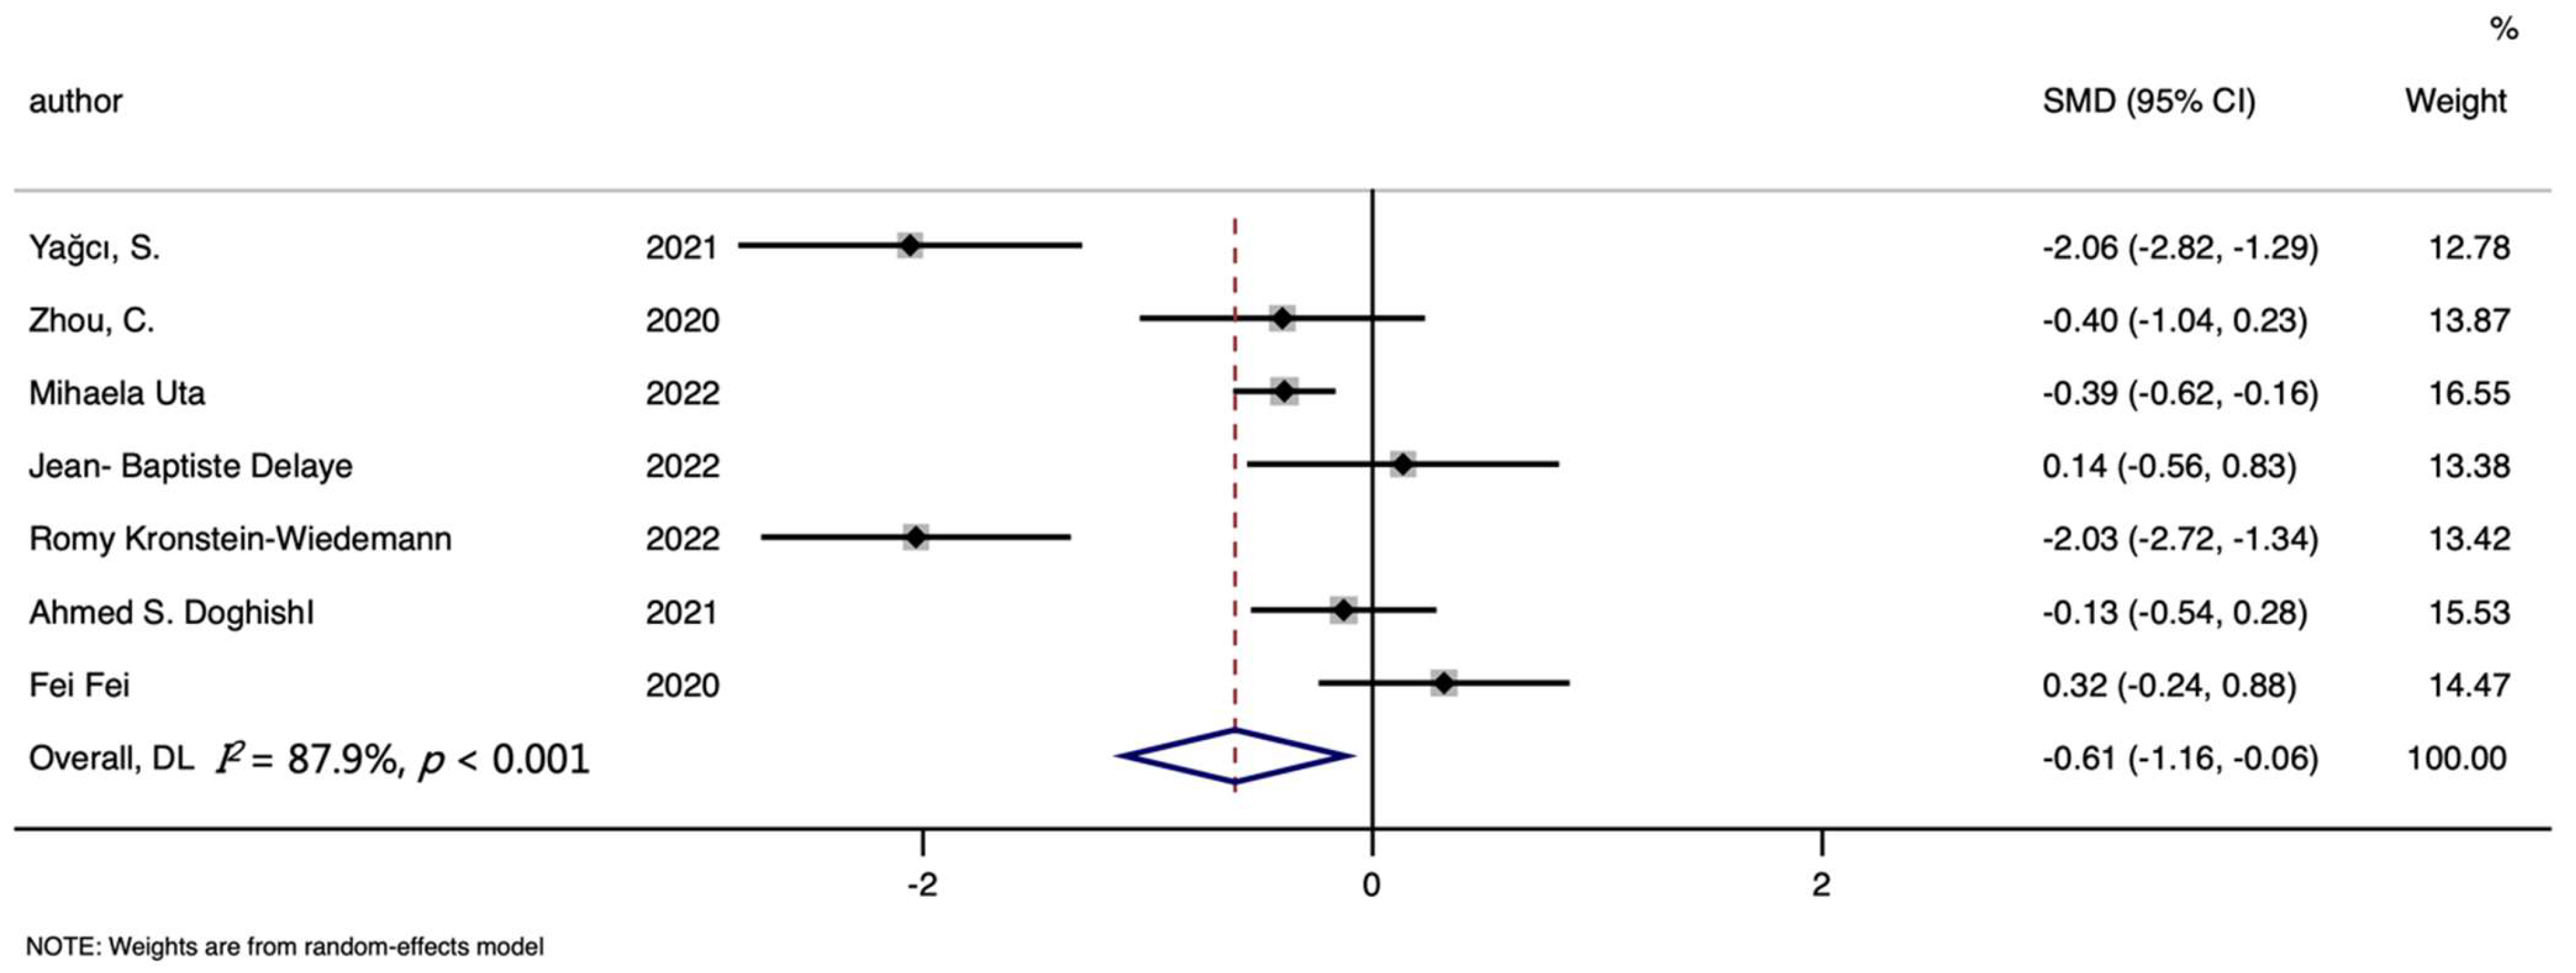
3.4. Hemoglobin Level and COVID-19
3.5. Hepcidin Level and COVID-19
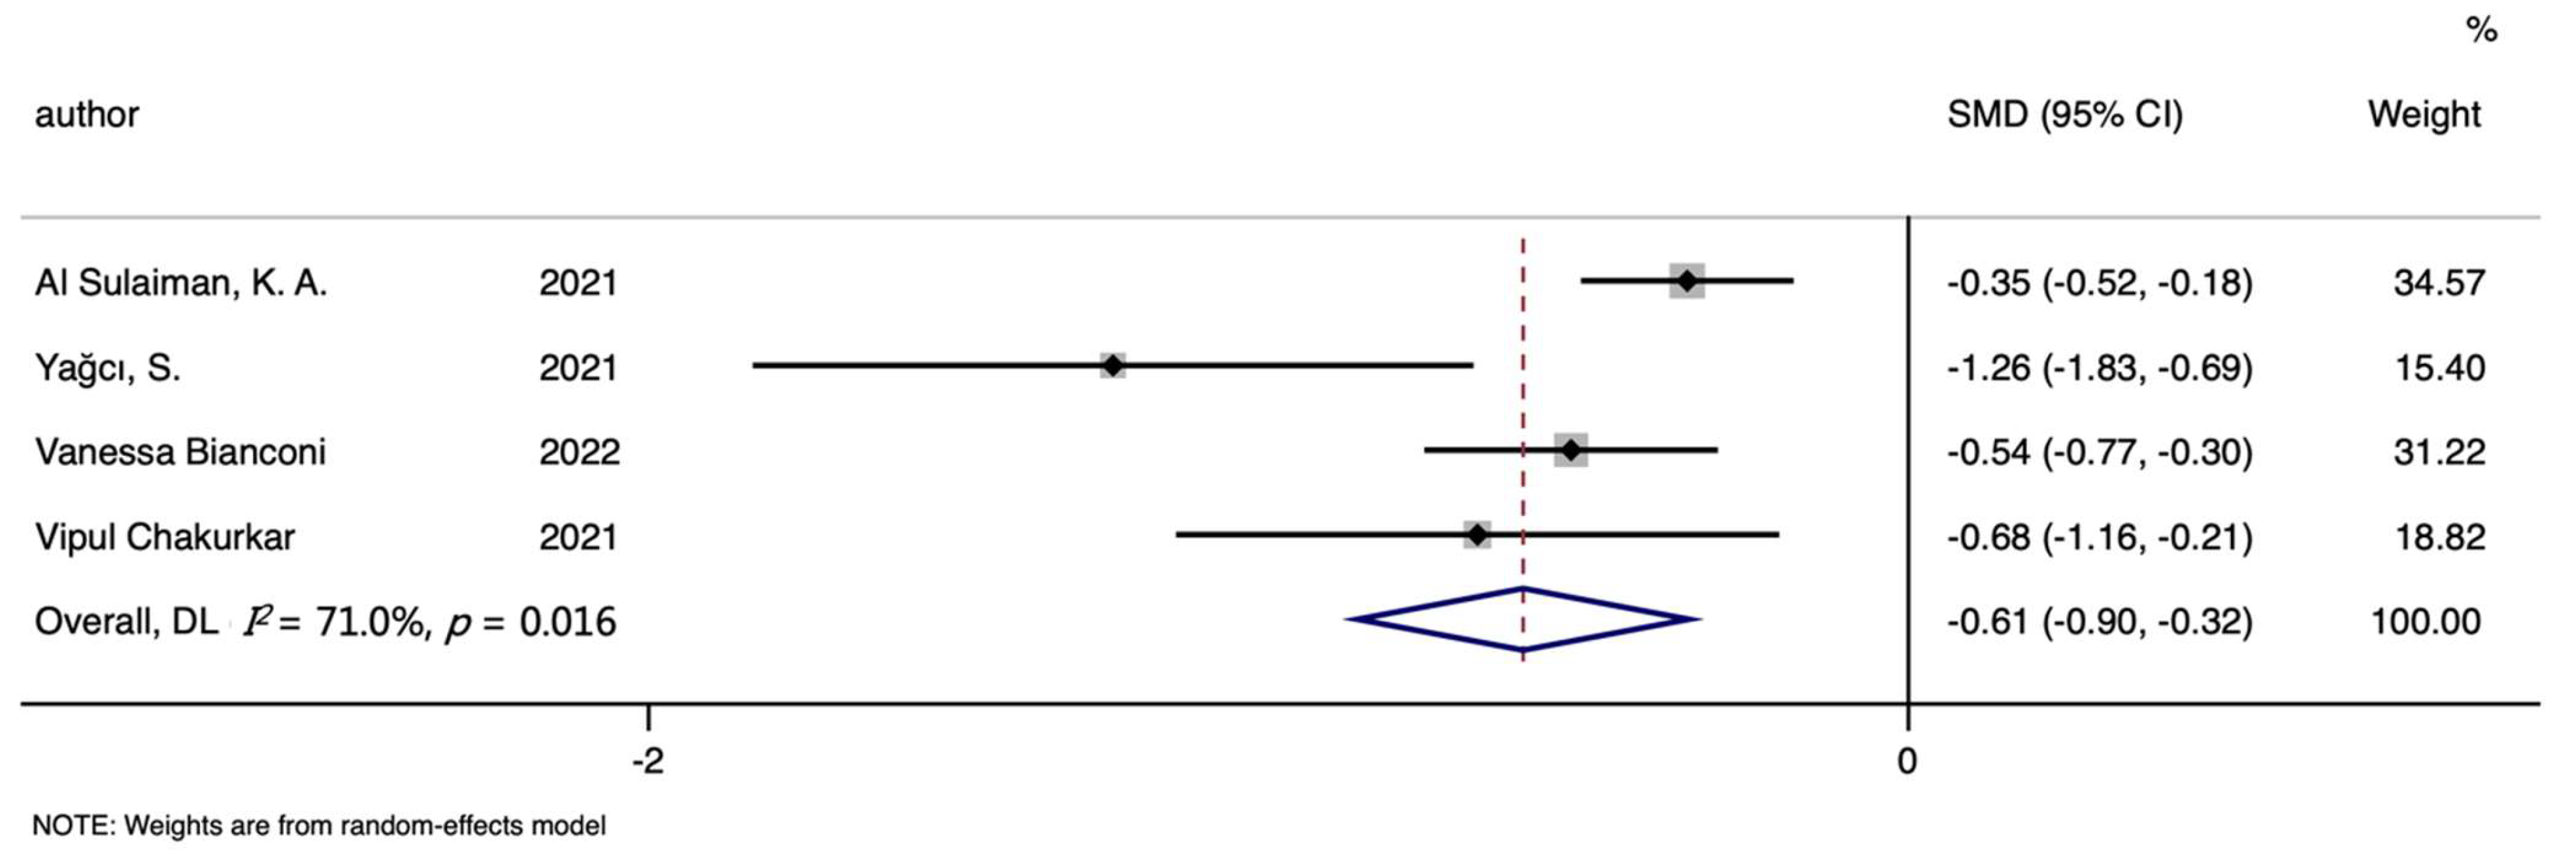
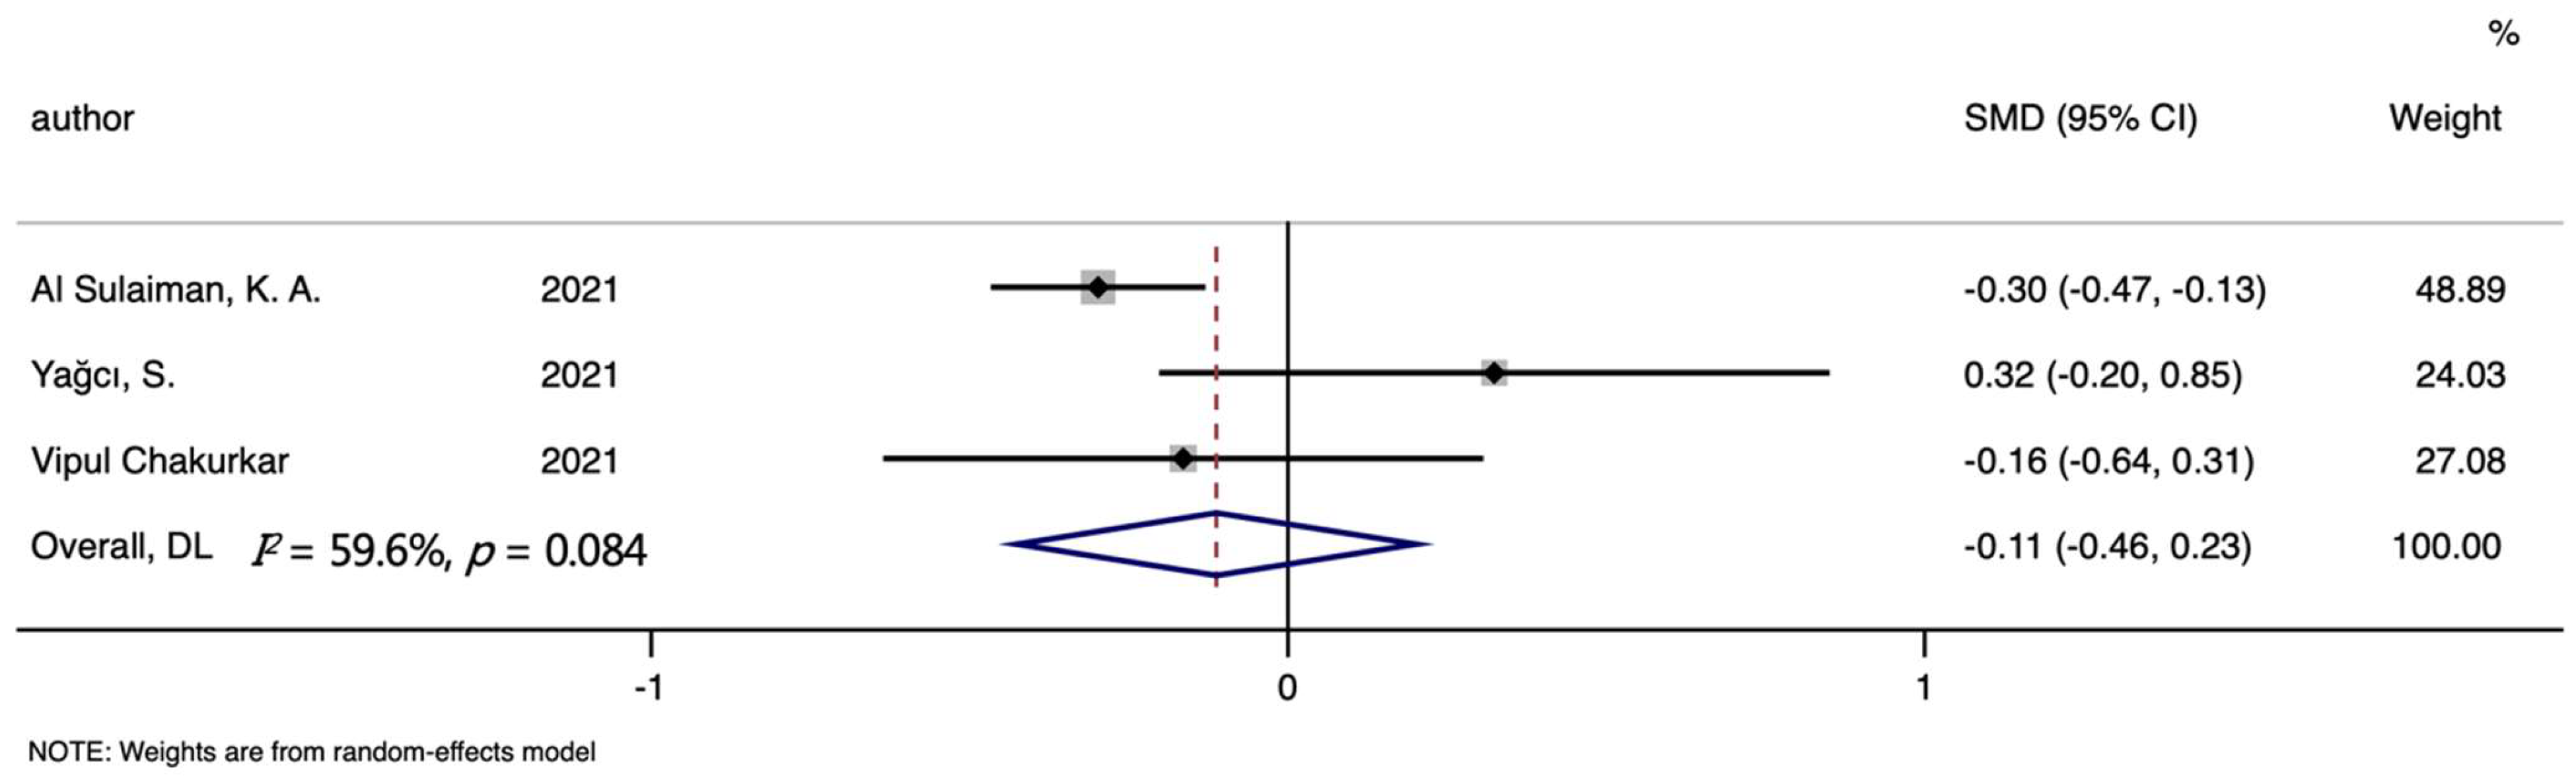
3.6. TIBC, TSAT and the Mortality of COVID-19
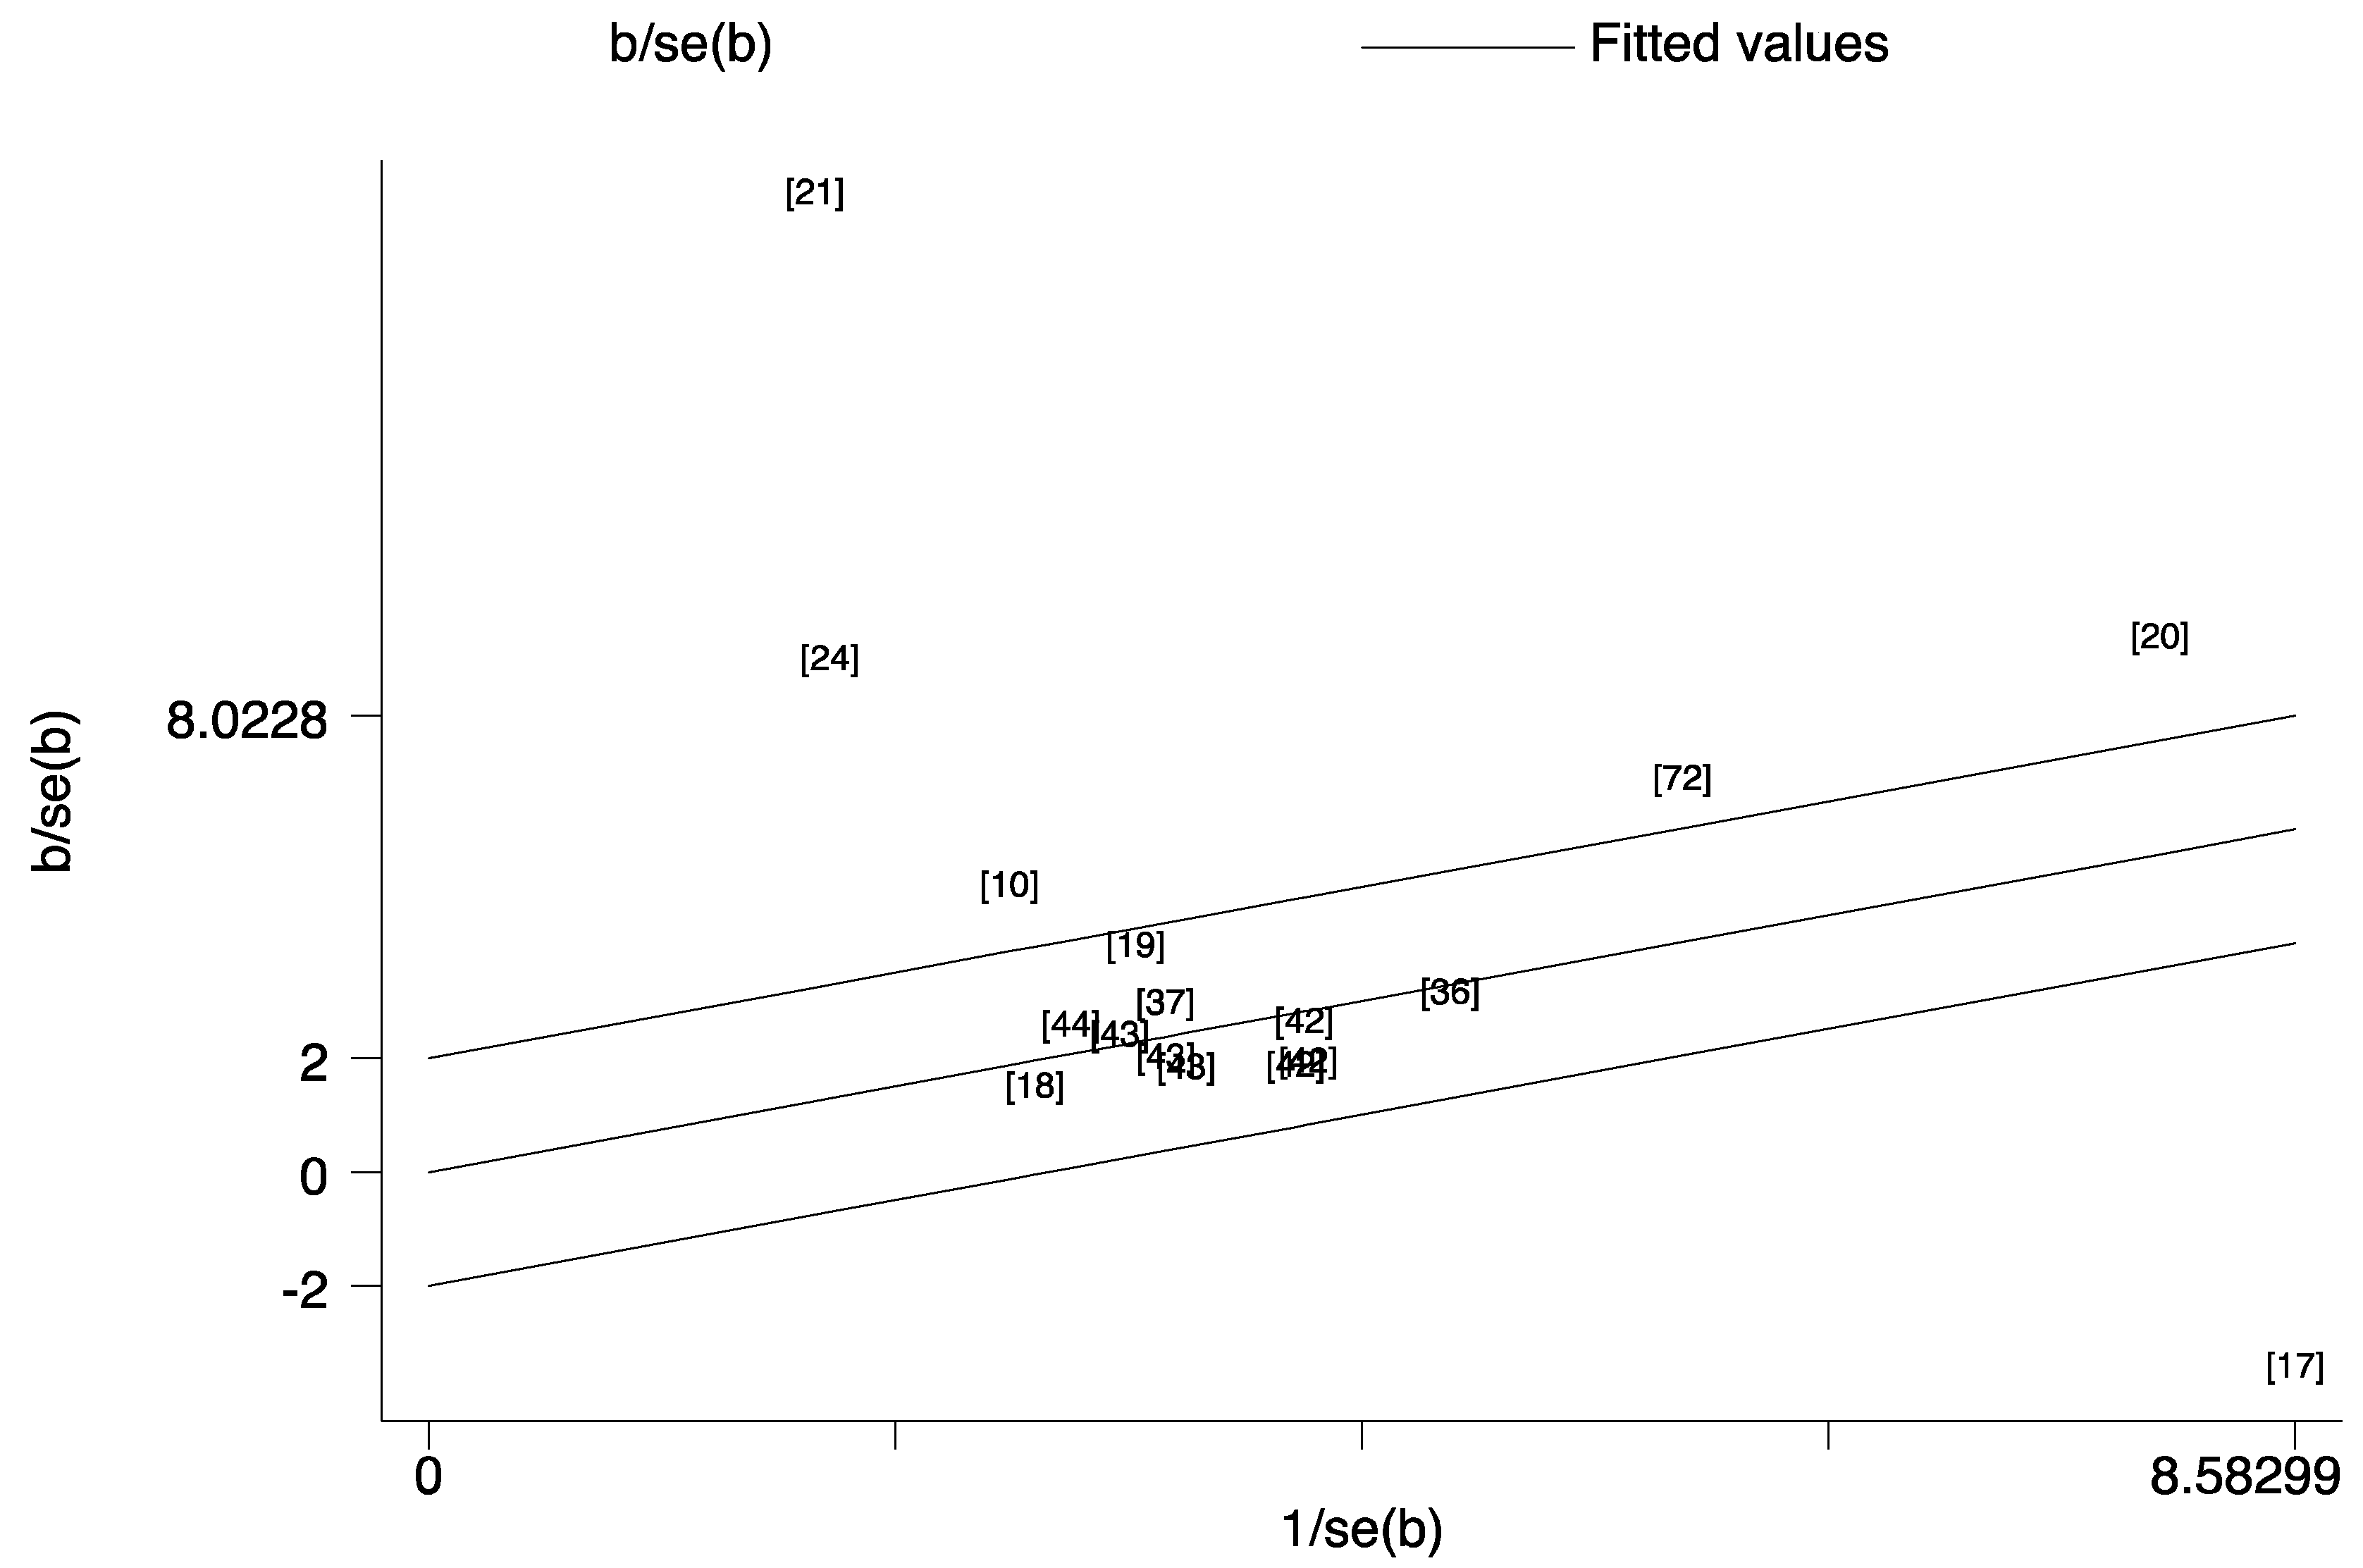
3.7. Sources of Heterogeneity and Publication Bias
4. Discussion
5. Conclusions
Supplementary Materials
Author Contributions
Funding
Institutional Review Board Statement
Informed Consent Statement
Data Availability Statement
Conflicts of Interest
References
- Cucinotta, D.; Vanelli, M. WHO Declares COVID-19 a Pandemic. Acta Biomed. 2020, 91, 157–160. [Google Scholar] [PubMed]
- Karakaya Molla, G.; Ünal Uzun, Ö.; Koç, N.; Özen Yeşil, B.; Bayhan, G. Evaluation of nutritional status in pediatric patients diagnosed with COVID-19 infection. Clin. Nutr. ESPEN 2021, 44, 424–428. [Google Scholar] [CrossRef] [PubMed]
- Shakeri, H.; Azimian, A.; Ghasemzadeh-Moghaddam, H.; Safdari, M.; Haresabadi, M.; Daneshmand, T.; Namdar Ahmadabad, H. Evaluation of the relationship between serum levels of zinc, vitamin B12, vitamin D, and clinical outcomes in patients with COVID-19. J. Med. Virol. 2022, 94, 141–146. [Google Scholar] [CrossRef] [PubMed]
- Dahan, S.; Segal, G.; Katz, I.; Hellou, T.; Tietel, M.; Bryk, G.; Amital, H.; Shoenfeld, Y.; Dagan, A. Ferritin as a Marker of Severity in COVID-19 Patients: A Fatal Correlation. Isr. Med. Assoc. J. 2020, 22, 494–500. [Google Scholar]
- Zhou, P.; Yang, X.L.; Wang, X.G.; Hu, B.; Zhang, L.; Zhang, W.; Si, H.R.; Zhu, Y.; Li, B.; Huang, C.L.; et al. Addendum: A pneumonia outbreak associated with a new coronavirus of probable bat origin. Nature 2020, 588, E6. [Google Scholar] [CrossRef]
- Lv, Y.; Chen, L.; Liang, X.; Liu, X.; Gao, M.; Wang, Q.; Wei, Q.; Liu, L. Association between iron status and the risk of adverse outcomes in COVID-19. Clin. Nutr. 2021, 40, 3462–3469. [Google Scholar] [CrossRef]
- Tojo, K.; Sugawara, Y.; Oi, Y.; Ogawa, F.; Higurashi, T.; Yoshimura, Y.; Miyata, N.; Hayami, H.; Yamaguchi, Y.; Ishikawa, Y.; et al. The U-shaped association of serum iron level with disease severity in adult hospitalized patients with COVID-19. Sci. Rep. 2021, 11, 13431. [Google Scholar] [CrossRef]
- Al Sulaiman, K.A.; Aljuhani, O.; Eljaaly, K.; Alharbi, A.A.; Al Shabasy, A.M.; Alsaeedi, A.S.; Al Mutairi, M.; Badreldin, H.A.; Al Harbi, S.A.; Al Haji, H.A.; et al. Clinical features and outcomes of critically ill patients with coronavirus disease 2019 (COVID-19): A multicenter cohort study. Int. J. Infect. Dis. 2021, 105, 180–187. [Google Scholar] [CrossRef]
- Ersöz, A.; Yılmaz, T.E. The association between micronutrient and hemogram values and prognostic factors in COVID-19 patients: A single-center experience from Turkey. Int. J. Clin. Pract. 2021, 75, e14078. [Google Scholar] [CrossRef]
- Yağcı, S.; Serin, E.; Acicbe, Ö.; Zeren, M.; Odabaşı, M.S. The relationship between serum erythropoietin, hepcidin, and haptoglobin levels with disease severity and other biochemical values in patients with COVID-19. Int. J. Lab. Hematol. 2021, 43 (Suppl. 1), 142–151. [Google Scholar] [CrossRef]
- Nai, A.; Lorè, N.I.; Pagani, A.; De Lorenzo, R.; Di Modica, S.; Saliu, F.; Cirillo, D.M.; Rovere-Querini, P.; Manfredi, A.A.; Silvestri, L. Hepcidin levels predict COVID-19 severity and mortality in a cohort of hospitalized Italian patients. Am. J. Hematol. 2021, 96, e32–e35. [Google Scholar] [CrossRef]
- Bianconi, V.; Mannarino, M.R.; Figorilli, F.; Cosentini, E.; Batori, G.; Marini, E.; Banach, M.; Sahebkar, A.; Pirro, M. The detrimental impact of elevated Ferritin to Iron ratio on in-hospital prognosis of patients with COVID-19. Expert Rev. Mol. Diagn. 2022, 22, 469–478. [Google Scholar] [CrossRef]
- Chakurkar, V.; Rajapurkar, M.; Lele, S.; Mukhopadhyay, B.; Lobo, V.; Injarapu, R.; Sheikh, M.; Dholu, B.; Ghosh, A.; Jha, V. Increased serum catalytic iron may mediate tissue injury and death in patients with COVID-19. Sci. Rep. 2021, 11, 19618. [Google Scholar] [CrossRef]
- Claise, C.; Saleh, J.; Rezek, M.; Vaulont, S.; Peyssonnaux, C.; Edeas, M. Low transferrin levels predict heightened inflammation in patients with COVID-19: New insights. Int. J. Infect. Dis. 2022, 116, 74–79. [Google Scholar] [CrossRef]
- Kilercik, M.; Ucal, Y.; Serdar, M.; Serteser, M.; Ozpinar, A.; Schweigert, F.J. Zinc protoporphyrin levels in COVID-19 are indicative of iron deficiency and potential predictor of disease severity. PLoS ONE 2022, 17, e0262487. [Google Scholar] [CrossRef]
- Skalny, A.V.; Timashev, P.S.; Aschner, M.; Aaseth, J.; Chernova, L.N.; Belyaev, V.E.; Grabeklis, A.R.; Notova, S.V.; Lobinski, R.; Tsatsakis, A.; et al. Serum Zinc, Copper, and Other Biometals Are Associated with COVID-19 Severity Markers. Metabolites 2021, 11, 244. [Google Scholar] [CrossRef]
- Uta, M.; Neamtu, R.; Bernad, E.; Mocanu, A.G.; Gluhovschi, A.; Popescu, A.; Dahma, G.; Dumitru, C.; Stelea, L.; Citu, C.; et al. The Influence of Nutritional Supplementation for Iron Deficiency Anemia on Pregnancies Associated with SARS-CoV-2 Infection. Nutrients 2022, 14, 836. [Google Scholar] [CrossRef]
- Delaye, J.B.; Alarcan, H.; Vallet, N.; Veyrat-Durebex, C.; Bernard, L.; Hérault, O.; Ropert, M.; Marlet, J.; Gyan, E.; Andres, C.; et al. Specific changes of erythroid regulators and hepcidin in patients infected by SARS-CoV-2. J. Investig. Med. 2022, 70, 934–938. [Google Scholar] [CrossRef]
- Kronstein-Wiedemann, R.; Stadtmüller, M.; Traikov, S.; Georgi, M.; Teichert, M.; Yosef, H.; Wallenborn, J.; Karl, A.; Schütze, K.; Wagner, M.; et al. SARS-CoV-2 Infects Red Blood Cell Progenitors and Dysregulates Hemoglobin and Iron Metabolism. Stem Cell Rev. Rep. 2022, 18, 1809–1821. [Google Scholar] [CrossRef]
- Moreira, A.C.; Teles, M.J.; Silva, T.; Bento, C.M.; Alves, I.S.; Pereira, L.; Guimarães, J.T.; Porto, G.; Oliveira, P.; Gomes, M.S. Iron Related Biomarkers Predict Disease Severity in a Cohort of Portuguese Adult Patients during COVID-19 Acute Infection. Viruses 2021, 13, 2482. [Google Scholar] [CrossRef]
- Ergin Tuncay, M.; Neselioglu, S.; Asfuroglu Kalkan, E.; Inan, O.; Sena Akkus, M.; Ates, I.; Erel, O. Modified Proline Metabolism and Prolidase Enzyme in COVID-19. Lab. Med. 2022, 6, lmac017. [Google Scholar] [CrossRef] [PubMed]
- Zeng, H.L.; Yang, Q.; Yuan, P.; Wang, X.; Cheng, L. Associations of essential and toxic metals/metalloids in whole blood with both disease severity and mortality in patients with COVID-19. FASEB J. 2021, 35, e21392. [Google Scholar] [CrossRef] [PubMed]
- Zhao, K.; Huang, J.; Dai, D.; Feng, Y.; Liu, L.; Nie, S. Serum Iron Level as a Potential Predictor of Coronavirus Disease 2019 Severity and Mortality: A Retrospective Study. Open Forum Infect. Dis. 2020, 7, ofaa250. [Google Scholar] [CrossRef] [PubMed]
- Zhou, C.; Chen, Y.; Ji, Y.; He, X.; Xue, D. Increased Serum Levels of Hepcidin and Ferritin Are Associated with Severity of COVID-19. Med. Sci. Monit. 2020, 26, e926178. [Google Scholar] [CrossRef]
- Rahman, M.A.; Shanjana, Y.; Tushar, M.I.; Mahmud, T.; Rahman, G.M.S.; Milan, Z.H.; Sultana, T.; Chowdhury, A.; Bhuiyan, M.A.; Islam, M.R.; et al. Hematological abnormalities and comorbidities are associated with COVID-19 severity among hospitalized patients: Experience from Bangladesh. PLoS ONE 2021, 16, e0255379. [Google Scholar] [CrossRef]
- Aly, M.M.; Meshref, T.S.; Abdelhameid, M.A.; Ahmed, S.A.; Shaltout, A.S.; Abdel-Moniem, A.E.; Hamad, D.A. Can Hematological Ratios Predict Outcome of COVID-19 Patients? A Multicentric Study. J. Blood Med. 2021, 12, 505–515. [Google Scholar] [CrossRef]
- Huang, H.; Song, B.; Xu, Z.; Jiao, Y.; Huang, L.; Zhao, P.; Huang, J.; Zhou, Z.; Zhao, Z.; Tian, J.; et al. Predictors of Coronavirus Disease 2019 Severity: A Retrospective Study of 64 Cases. Jpn. J. Infect. Dis. 2021, 74, 54–60. [Google Scholar] [CrossRef]
- Sana, A.; Avneesh, M. Identification of hematological and inflammatory parameters associated with disease severity in hospitalized patients of COVID-19. J. Family Med. Prim. Care 2022, 11, 260–264. [Google Scholar] [CrossRef]
- Huang, C.Y.; Tsai, H.W.; Liu, C.Y.; Liu, T.H.; Huang, H.L.; Chang, C.C.; Chen, W.C.; Sun, J.T. The predictive and prognostic role of hematologic and biochemical parameters in the emergency department among coronavirus disease 2019 patients. Chin. J. Physiol. 2021, 64, 306–311. [Google Scholar]
- Az, A.; Sogut, O.; Akdemir, T.; Ergenc, H.; Dogan, Y.; Cakirca, M. Impacts of Demographic and Clinical Characteristics on Disease Severity and Mortality in Patients with Confirmed COVID-19. Int. J. Gen. Med. 2021, 14, 2989–3000. [Google Scholar] [CrossRef]
- Ghweil, A.A.; Hassan, M.H.; Khodeary, A.; Mohamed, A.O.; Mohammed, H.M.; Abdelazez, A.A.; Osman, H.A.; Bazeed, S.E.S. Characteristics, Outcomes and Indicators of Severity for COVID-19 Among Sample of ESNA Quarantine Hospital’s Patients, Egypt: A Retrospective Study. Infect. Drug Resist. 2020, 13, 2375–2383. [Google Scholar] [CrossRef]
- Ramadan, H.K.; Mahmoud, M.A.; Aburahma, M.Z.; Elkhawaga, A.A.; El-Mokhtar, M.A.; Sayed, I.M.; Hosni, A.; Hassany, S.M.; Medhat, M.A. Predictors of Severity and Co-Infection Resistance Profile in COVID-19 Patients: First Report from Upper Egypt. Infect. Drug Resist. 2020, 13, 3409–3422. [Google Scholar] [CrossRef]
- Yamamoto, A.; Wada, H.; Ichikawa, Y.; Mizuno, H.; Tomida, M.; Masuda, J.; Makino, K.; Kodama, S.; Yoshida, M.; Fukui, S.; et al. Evaluation of Biomarkers of Severity in Patients with COVID-19 Infection. J. Clin. Med. 2021, 10, 3775. [Google Scholar] [CrossRef]
- Abdelhakam, D.A.; Badr, F.M.; Abd El Monem Teama, M.; Bahig Elmihi, N.M.; El-Mohamdy, M.A. Serum amyloid A, ferritin and carcinoembryonic antigen as biomarkers of severity in patients with COVID-19. Biomed. Rep. 2022, 16, 13. [Google Scholar] [CrossRef]
- Emsen, A.; Sumer, S.; Tulek, B.; Cizmecioglu, H.; Vatansev, H.; Goktepe, M.H.; Kanat, F.; Koksal, Y.; Arslan, U.; Artac, H. Correlation of myeloid-derived suppressor cells with C-reactive protein, ferritin and lactate dehydrogenase levels in patients with severe COVID-19. Scand. J. Immunol. 2022, 95, e13108. [Google Scholar] [CrossRef]
- Doghish, A.S.; Elkhatib, W.F.; Hassan, E.A.; Elkhateeb, A.F.; Mahmoud, E.E.; Ahmed, M.I.; Khalil, M.A.F. Clinical characteristics of Egyptian male patients with COVID-19 acute respiratory distress syndrome. PLoS ONE 2021, 16, e0249346. [Google Scholar]
- Fei, F.; Smith, J.A.; Cao, L. Clinical laboratory characteristics in patients with suspected COVID-19: One single-institution experience. J. Med. Virol. 2021, 93, 1665–1671. [Google Scholar] [CrossRef]
- Deng, F.; Zhang, L.; Lyu, L.; Lu, Z.; Gao, D.; Ma, X.; Guo, Y.; Wang, R.; Gong, S.; Jiang, W. Increased levels of ferritin on admission predicts intensive care unit mortality in patients with COVID-19. Med. Clin. (Engl. Ed.) 2021, 156, 324–331. [Google Scholar]
- Valeri, A.M.; Robbins-Juarez, S.Y.; Stevens, J.S.; Ahn, W.; Rao, M.K.; Radhakrishnan, J.; Gharavi, A.G.; Mohan, S.; Husain, S.A. Presentation and Outcomes of Patients with ESKD and COVID-19. J. Am. Soc. Nephrol. 2020, 31, 1409–1415. [Google Scholar] [CrossRef]
- Gayam, V.; Chobufo, M.D.; Merghani, M.A.; Lamichhane, S.; Garlapati, P.R.; Adler, M.K. Clinical characteristics and predictors of mortality in African-Americans with COVID-19 from an inner-city community teaching hospital in New York. J. Med. Virol. 2021, 93, 812–819. [Google Scholar] [CrossRef]
- Zeng, Z.; Yu, H.; Chen, H.; Qi, W.; Chen, L.; Chen, G.; Yan, W.; Chen, T.; Ning, Q.; Han, M.; et al. Longitudinal changes of inflammatory parameters and their correlation with disease severity and outcomes in patients with COVID-19 from Wuhan, China. Crit. Care 2020, 24, 525. [Google Scholar] [CrossRef]
- Anuk, A.T.; Polat, N.; Akdas, S.; Erol, S.A.; Tanacan, A.; Biriken, D.; Keskin, H.L.; Moraloglu Tekin, O.; Yazihan, N.; Sahin, D. The Relation Between Trace Element Status (Zinc, Copper, Magnesium) and Clinical Outcomes in COVID-19 Infection During Pregnancy. Biol. Trace Elem. Res. 2021, 199, 3608–3617. [Google Scholar] [CrossRef]
- Erol, S.A.; Polat, N.; Akdas, S.; Aribal Ayral, P.; Anuk, A.T.; Ozden Tokalioglu, E.; Goncu Ayhan, Ş.; Kesikli, B.; Ceylan, M.N.; Tanacan, A.; et al. Maternal selenium status plays a crucial role on clinical outcomes of pregnant women with COVID-19 infection. J. Med. Virol. 2021, 93, 5438–5445. [Google Scholar] [CrossRef]
- Venter, C.; Bezuidenhout, J.A.; Laubscher, G.J.; Lourens, P.J.; Steenkamp, J.; Kell, D.B.; Pretorius, E. Erythrocyte, Platelet, Serum Ferritin, and P-Selectin Pathophysiology Implicated in Severe Hypercoagulation and Vascular Complications in COVID-19. Int. J. Mol. Sci. 2020, 21, 8234. [Google Scholar] [CrossRef]
- Mehri, F.; Rahbar, A.H.; Ghane, E.T.; Souri, B.; Esfahani, M. Changes in oxidative markers in COVID-19 patients. Arch. Med. Res. 2021, 52, 843–849. [Google Scholar] [CrossRef]
- Ahmed, S.; Ansar Ahmed, Z.; Siddiqui, I.; Haroon Rashid, N.; Mansoor, M.; Jafri, L. Evaluation of serum ferritin for prediction of severity and mortality in COVID-19- A cross sectional study. Ann. Med. Surg. 2021, 63, 102163. [Google Scholar] [CrossRef]
- Wu, C.; Chen, X.; Cai, Y.; Xia, J.; Zhou, X.; Xu, S.; Huang, H.; Zhang, L.; Zhou, X.; Du, C.; et al. Risk Factors Associated with Acute Respiratory Distress Syndrome and Death in Patients with Coronavirus Disease 2019 Pneumonia in Wuhan, China. JAMA Intern. Med. 2020, 180, 934–943. [Google Scholar] [CrossRef]
- Guan, X.; Zhang, B.; Fu, M.; Li, M.; Yuan, X.; Zhu, Y.; Peng, J.; Guo, H.; Lu, Y. Clinical and inflammatory features based machine learning model for fatal risk prediction of hospitalized COVID-19 patients: Results from a retrospective cohort study. Ann. Med. 2021, 53, 257–266. [Google Scholar] [CrossRef]
- Tural Onur, S.; Altın, S.; Sokucu, S.N.; Fikri, B.; Barça, T.; Bolat, E.; Toptaş, M. Could ferritin level be an indicator of COVID-19 disease mortality? J. Med. Virol. 2021, 93, 1672–1677. [Google Scholar] [CrossRef]
- Lino, K.; Guimarães, G.M.C.; Alves, L.S.; Oliveira, A.C.; Faustino, R.; Fernandes, C.S.; Tupinambá, G.; Medeiros, T.; Silva, A.A.D.; Almeida, J.R. Serum ferritin at admission in hospitalized COVID-19 patients as a predictor of mortality. Braz. J. Infect. Dis. 2021, 25, 101569. [Google Scholar] [CrossRef]
- Khamis, F.; Memish, Z.; Bahrani, M.A.; Dowaiki, S.A.; Pandak, N.; Bolushi, Z.A.; Salmi, I.A.; Al-Zakwani, I. Prevalence and predictors of in-hospital mortality of patients hospitalized with COVID-19 infection. J. Infect. Public Health 2021, 14, 759–765. [Google Scholar] [CrossRef] [PubMed]
- Yardımcı, A.C.; Yıldız, S.; Ergen, E.; Ballı, H.; Ergene, E.; Guner, Y.S.; Karnap, M.; Demırbas Keskın, D.; Yuksel, H.; Bocutoglu, F.; et al. Association between platelet indices and the severity of the disease and mortality in patients with COVID-19. Eur. Rev. Med. Pharmacol. Sci. 2021, 25, 6731–6740. [Google Scholar] [PubMed]
- Martinez Mesa, A.; Cabrera César, E.; Martín-Montañez, E.; Sanchez Alvarez, E.; Lopez, P.M.; Romero-Zerbo, Y.; Garcia-Fernandez, M.; Velasco Garrido, J.L. Acute Lung Injury Biomarkers in the Prediction of COVID-19 Severity: Total Thiol, Ferritin and Lactate Dehydrogenase. Antioxidants 2021, 10, 1221. [Google Scholar] [CrossRef] [PubMed]
- Rasyid, H.; Sangkereng, A.; Harjianti, T.; Soetjipto, A.S. Impact of age to ferritin and neutrophil-lymphocyte ratio as biomarkers for intensive care requirement and mortality risk in COVID-19 patients in Makassar, Indonesia. Physiol. Rep. 2021, 9, e14876. [Google Scholar] [CrossRef] [PubMed]
- Zanella, A.; Florio, G.; Antonelli, M.; Bellani, G.; Berselli, A.; Bove, T.; Cabrini, L.; Carlesso, E.; Castelli, G.P.; Cecconi, M.; et al. Time course of risk factors associated with mortality of 1260 critically ill patients with COVID-19 admitted to 24 Italian intensive care units. Intensive Care Med. 2021, 47, 995–1008. [Google Scholar] [PubMed]
- Burugu, H.R.; Kandi, V.; Kutikuppala, L.V.S.; Suvvari, T.K. Activities of Serum Ferritin and Treatment Outcomes among COVID-19 Patients Treated with Vitamin C and Dexamethasone: An Uncontrolled Single-Center Observational Study. Cureus 2020, 12, e11442. [Google Scholar] [CrossRef]
- Rai, D.; Ranjan, A.; Ameet, H.; Pandey, S. Clinical and Laboratory Predictors of Mortality in COVID-19 Infection: A Retrospective Observational Study in a Tertiary Care Hospital of Eastern India. Cureus 2021, 13, e17660. [Google Scholar] [CrossRef]
- Aygun, H.; Eraybar, S. Can ferritin/lymphocyte percentage ratio, a new indicator, predict the clinical course of COVID-19 cases? Bratisl. Lek. Listy 2021, 122, 799–804. [Google Scholar] [CrossRef]
- Pujani, M.; Raychaudhuri, S.; Singh, M.; Kaur, H.; Agarwal, S.; Jain, M.; Chandoke, R.K.; Singh, K.; Sidam, D.; Chauhan, V. An analysis of hematological, coagulation and biochemical markers in COVID-19 disease and their association with clinical severity and mortality: An Indian outlook. Am. J. Blood Res. 2021, 11, 580–591. [Google Scholar]
- Chen, Q.; Kong, H.; Qi, X.; Ding, W.; Ji, N.; Wu, C.; Huang, C.; Wu, W.; Huang, M.; Xie, W.; et al. Carcinoembryonic Antigen: A Potential Biomarker to Evaluate the Severity and Prognosis of COVID-19. Front. Med. 2020, 7, 579543. [Google Scholar] [CrossRef]
- Yousaf, M.N.; Sarwar, S.; Tarique, S.; Ahmed, M.; Tahir, H. Mortality in Patients of COVID-19 Infection: Biochemical Markers and its Cut-off Values for Predicting Outcome. J. Coll. Phys. Surg. Pak. 2022, 32, 37–41. [Google Scholar]
- Arshad, A.R.; Khan, I.; Shahzad, K.; Arshad, M.; Haider, S.J.; Aslam, M.J. Association of Inflammatory Markers with Mortality in COVID-19 Infection. J. Coll. Phys. Surg. Pak. 2020, 30, 158–163. [Google Scholar]
- Masetti, C.; Generali, E.; Colapietro, F.; Voza, A.; Cecconi, M.; Messina, A.; Omodei, P.; Angelini, C.; Ciccarelli, M.; Badalamenti, S.; et al. High mortality in COVID-19 patients with mild respiratory disease. Eur. J. Clin. Investig. 2020, 50, e13314. [Google Scholar] [CrossRef]
- Marimuthu, A.K.; Anandhan, M.; Sundararajan, L.; Chandrasekaran, J.; Ramakrishnan, B. Utility of various inflammatory markers in predicting outcomes of hospitalized patients with COVID-19 pneumonia: A single-center experience. Lung. India 2021, 38, 448–453. [Google Scholar] [CrossRef]
- Allard, L.; Ouedraogo, E.; Molleville, J.; Bihan, H.; Giroux-Leprieur, B.; Sutton, A.; Baudry, C.; Josse, C.; Didier, M.; Deutsch, D.; et al. Malnutrition: Percentage and Association with Prognosis in Patients Hospitalized for Coronavirus Disease 2019. Nutrients 2020, 12, 3679. [Google Scholar] [CrossRef]
- Bats, M.L.; Rucheton, B.; Fleur, T.; Orieux, A.; Chemin, C.; Rubin, S.; Colombies, B.; Desclaux, A.; Rivoisy, C.; Mériglier, E.; et al. Covichem: A biochemical severity risk score of COVID-19 upon hospital admission. PLoS ONE 2021, 16, e0250956. [Google Scholar] [CrossRef]
- Kirtana, J.; Kumar, A.; Kumar, S.S.; Singh, A.K.; Shankar, S.H.; Sharma, A.; Kumar, A.; Kaur, R.; Khan, M.A.; Ranjan, P.; et al. Mild COVID-19 infection-predicting symptomatic phase and outcome: A study from AIIMS, New Delhi. J. Family Med. Prim. Care 2020, 9, 5360–5365. [Google Scholar]
- Sukrisman, L.; Sinto, R. Coagulation profile and correlation between D-dimer, inflammatory markers, and COVID-19 severity in an Indonesian national referral hospital. J. Int. Med. Res. 2021, 49, 3000605211059939. [Google Scholar] [CrossRef]
- San Segundo, D.; Arnáiz de Las Revillas, F.; Lamadrid-Perojo, P.; Comins-Boo, A.; González-Rico, C.; Alonso-Peña, M.; Irure-Ventura, J.; Olmos, J.M.; Fariñas, M.C.; López-Hoyos, M. Innate and Adaptive Immune Assessment at Admission to Predict Clinical Outcome in COVID-19 Patients. Biomedicines 2021, 9, 917. [Google Scholar] [CrossRef]
- Yasui, Y.; Yasui, H.; Suzuki, K.; Saitou, T.; Yamamoto, Y.; Ishizaka, T.; Nishida, K.; Yoshihara, S.; Gohma, I.; Ogawa, Y. Analysis of the predictive factors for a critical illness of COVID-19 during treatment—Relationship between serum zinc level and critical illness of COVID-19. Int. J. Infect. Dis. 2020, 100, 230–236. [Google Scholar] [CrossRef]
- García-Gasalla, M.; Ferrer, J.M.; Fraile-Ribot, P.A.; Ferre-Beltrán, A.; Rodríguez, A.; Martínez-Pomar, N.; Ramon-Clar, L.; Iglesias, A.; Losada-López, I.; Fanjul, F.; et al. Predictive Immunological, Virological, and Routine Laboratory Markers for Critical COVID-19 on Admission. Can. J. Infect. Dis. Med. Microbiol. 2021, 2021, 9965850. [Google Scholar] [CrossRef] [PubMed]
- Haroun, R.A.; Osman, W.H.; Eessa, A.M. Interferon-γ-induced protein 10 (IP-10) and serum amyloid A (SAA) are excellent biomarkers for the prediction of COVID-19 progression and severity. Life Sci. 2021, 269, 119019. [Google Scholar] [CrossRef] [PubMed]
- Pubmed. Available online: https://pubmed.ncbi.nlm.nih.gov/ (accessed on 31 May 2022).
- Web of Science. Available online: http://apps.webofknowledge.com (accessed on 31 May 2022).
- Scopus. Available online: https://www.scopus.com/search/form.uri?display=basic#basic (accessed on 31 May 2022).
- Estimating the Sample Mean and Standard Deviation from the Sample Size, Median, Range and/or Interquartile Range. Available online: https://www.math.hkbu.edu.hk/~tongt/papers/median2mean.html (accessed on 31 May 2022).
- Beigmohammadi, M.T.; Bitarafan, S.; Abdollahi, A.; Amoozadeh, L.; Salahshour, F.; Mahmoodi Ali Abadi, M.; Soltani, D.; Motallebnejad, Z.A. The association between serum levels of micronutrients and the severity of disease in patients with COVID-19. Nutrition 2021, 91–92, 111400. [Google Scholar] [CrossRef] [PubMed]
- Bozkurt, F.T.; Tercan, M.; Patmano, G.; Bingol Tanrıverdi, T.; Demir, H.A.; Yurekli, U.F. Can Ferritin Levels Predict the Severity of Illness in Patients with COVID-19? Cureus 2021, 13, e12832. [Google Scholar] [CrossRef] [PubMed]
- Sukrisman, L.; Sinto, R.; Priantono, D. Hematologic Profiles and Correlation between Absolute Lymphocyte Count and Neutrophil/Lymphocyte Ratio with Markers of Inflammation of COVID-19 in an Indonesian National Referral Hospital. Int. J. Gen. Med. 2021, 14, 6919–6924. [Google Scholar] [CrossRef] [PubMed]
- Garcia-Gasalla, M.; Berman-Riu, M.; Pons, J.; Rodríguez, A.; Iglesias, A.; Martínez-Pomar, N.; Llompart-Alabern, I.; Riera, M.; Ferré Beltrán, A.; Figueras-Castilla, A.; et al. Hyperinflammatory State and Low T1 Adaptive Immune Response in Severe and Critical Acute COVID-19 Patients. Front. Med. 2022, 9, 828678. [Google Scholar] [CrossRef] [PubMed]
- Nizami, D.J.; Raman, V.; Paulose, L.; Hazari, K.S.; Mallick, A.K. Role of laboratory biomarkers in assessing the severity of COVID-19 disease. A cross-sectional study. J. Family Med. Prim. Care 2021, 10, 2209–2215. [Google Scholar] [CrossRef]
- Bastin, A.; Shiri, H.; Zanganeh, S.; Fooladi, S.; Momeni Moghaddam, M.A.; Mehrabani, M.; Nematollahi, M.H. Iron Chelator or Iron Supplement Consumption in COVID-19? The Role of Iron with Severity Infection. Biol. Trace Elem. Res. 2021, 1–11. [Google Scholar] [CrossRef]
- Nicolas, G.; Bennoun, M.; Devaux, I.; Beaumont, C.; Grandchamp, B.; Kahn, A.; Vaulont, S. Lack of hepcidin gene expression and severe tissue iron overload in upstream stimulatory factor 2 (USF2) knockout mice. Proc. Natl. Acad. Sci. USA 2001, 98, 8780–8785. [Google Scholar] [CrossRef]
- Pigeon, C.; Ilyin, G.; Courselaud, B.; Leroyer, P.; Turlin, B.; Brissot, P.; Loréal, O. A new mouse liver-specific gene, encoding a protein homologous to human antimicrobial peptide hepcidin, is overexpressed during iron overload. J. Biol. Chem. 2001, 276, 7811–7819. [Google Scholar] [CrossRef]
- Peng, D.; Gao, Y.; Zhang, L.; Liu, Z.; Wang, H.; Liu, Y. The Relationship between Hepcidin-Mediated Iron Dysmetabolism and COVID-19 Severity: A Meta-Analysis. Front. Public Health 2022, 10, 881412. [Google Scholar]
- Drakesmith, H.; Prentice, A. Viral infection and iron metabolism. Nat. Rev. Microbiol. 2008, 6, 541–552. [Google Scholar] [CrossRef]
- Nemeth, E.; Tuttle, M.S.; Powelson, J.; Vaughn, M.B.; Donovan, A.; Ward, D.M.; Ganz, T.; Kaplan, J. Hepcidin regulates cellular iron efflux by binding to ferroportin and inducing its internalization. Science 2004, 306, 2090–2093. [Google Scholar] [CrossRef]
- Mahroum, N.; Alghory, A.; Kiyak, Z.; Alwani, A.; Seida, R.; Alrais, M.; Shoenfeld, Y. Ferritin—From iron, through inflammation and autoimmunity, to COVID-19. J. Autoimmun. 2022, 126, 102778. [Google Scholar] [CrossRef]
- Kell, D.B.; Pretorius, E. Serum ferritin is an important inflammatory disease marker, as it is mainly a leakage product from damaged cells. Metallomics 2014, 6, 748–773. [Google Scholar] [CrossRef]
- Henry, B.M.; de Oliveira, M.H.S.; Benoit, S.; Plebani, M.; Lippi, G. Hematologic, biochemical and immune biomarker abnormalities associated with severe illness and mortality in coronavirus disease 2019 (COVID-19): A meta-analysis. Clin. Chem. Lab. Med. 2020, 58, 1021–1028. [Google Scholar] [CrossRef]
- Jiang, Z.B.; Gao, J.; Chai, Y.H.; Li, W.; Luo, Y.F.; Chen, Y.Z. Astragaloside alleviates alcoholic fatty liver disease by suppressing oxidative stress. Kaohsiung J. Med. Sci. 2021, 37, 718–729. [Google Scholar] [CrossRef]
- Andriopoulos, B.; Pantopoulos, K. Hepcidin generated by hepatoma cells inhibits iron export from co-cultured THP1 monocytes. J. Hepatol. 2006, 44, 1125–1131. [Google Scholar] [CrossRef]
- Turi, J.L.; Yang, F.; Garrick, M.D.; Piantadosi, C.A.; Ghio, A.J. The iron cycle and oxidative stress in the lung. Free Radic. Biol. Med. 2004, 36, 850–857. [Google Scholar] [CrossRef]
- Gudjoncik, A.; Guenancia, C.; Zeller, M.; Cottin, Y.; Vergely, C.; Rochette, L. Iron, oxidative stress, and redox signaling in the cardiovascular system. Mol. Nutr. Food Res. 2014, 58, 1721–1738. [Google Scholar] [CrossRef]
- Braumann, A.; Wulfhekel, U.; Nielsen, P.; Balkenhol, B.; Düllmann, J. Pattern of iron storage in the rat heart following iron overloading with trimethylhexanoyl-ferrocene. Acta Anat 1994, 150, 45–54. [Google Scholar] [CrossRef]
- Shah, K.K.; Verma, R.; Oleske, J.M.; Scolpino, A.; Bogden, J.D. Essential trace elements and progression and management of HIV infection. Nutr. Res. 2019, 71, 21–29. [Google Scholar] [CrossRef]
- Georgopoulou, U.; Dimitriadis, A.; Foka, P.; Karamichali, E.; Mamalaki, A. Hepcidin and the iron enigma in HCV infection. Virulence 2014, 5, 465–476. [Google Scholar] [CrossRef]
- Toyokuni, S. Iron-induced carcinogenesis: The role of redox regulation. Free Radic. Biol. Med. 1996, 20, 553–566. [Google Scholar] [CrossRef]
- Ehsani, A.H.; Nasimi, M.; Bigdelo, Z. Pityriasis rosea as a cutaneous manifestation of COVID-19 infection. J. Eur. Acad. Dermatol. Venereol. 2020, 34, e436–e437. [Google Scholar] [CrossRef]
- Ehsani, S. COVID-19 and iron dysregulation: Distant sequence similarity between hepcidin and the novel coronavirus spike glycoprotein. Biol. Direct 2020, 15, 19. [Google Scholar] [CrossRef]
- Elsayed, M.E.; Sharif, M.U.; Stack, A.G. Transferrin Saturation: A Body Iron Biomarker. Adv. Clin. Chem. 2016, 75, 71–97. [Google Scholar]
- Hippchen, T.; Altamura, S.; Muckenthaler, M.U.; Merle, U. Hypoferremia is Associated with Increased Hospitalization and Oxygen Demand in COVID-19 Patients. Hemasphere 2020, 4, e492. [Google Scholar] [CrossRef]


| Author (Year) | Country (Continent) | Study Type | Indicators | Group (G1/G2) | The Number of Samples (Group1/Group2) | Age Mean /Range (G1) | Mean (G1) | SD (G1) | Age Mean/Range (G2) | Mean (G2) | SD (G2) | Data Unit | Quality Assessment |
|---|---|---|---|---|---|---|---|---|---|---|---|---|---|
| Al Sulaiman, K.A. (2021) [8] | Saudi Arabia (AS) | C | Serum iron | dead/discharge | 237/323 | 60 | 5.8 | 4.5 | 60 | 8.3 | 5.9 | umol/L | 6 |
| TIBC | dead/discharge | 237/323 | 60 | 27.3 | 9.6 | 60 | 30.6 | 9.2 | umol/L | ||||
| TSAT | dead/discharge | 237/323 | 60 | 18.6 | 13.8 | 60 | 23.5 | 18.5 | % | ||||
| Ferritin | dead/discharge | 237/323 | 60 | 1247.3 | 1368.3 | 60 | 1069.2 | 1128.9 | ug/L | ||||
| Allard, L. (2020) [65] | France (EU) | CS | Ferritin | Severe/no severe | 34/74 | 58.9 | 1846.0 | 3328.0 | 68 | 676.0 | 696.0 | µg/L | 6 |
| Anuk, A.T. (2021) [42] | Turkey (AS) | CC | Ferritin | 1st trimester case/control | 34/33 | 26 | 39.4 | 50.3 | 27 | 22.8 | 20.2 | ng/mL | 7 |
| 2nd trimester case/control | 33/32 | 27 | 61.0 | 156.1 | 28 | 14.1 | 9.2 | ng/mL | |||||
| 3rd Trimester case/control | 33/35 | 26 | 31.4 | 39.0 | 29 | 13.5 | 16.2 | ng/mL | |||||
| Beigmohammadi, M.T. (2021) [77] | Iran (AS) | CS | Serum iron | severe/no-severe | 20/40 | 56 | 38.0 | 27.0 | 50 | 52.0 | 38.8 | mcg/dL | 6 |
| Dahan, S. (2020) [4] | Israel (AS) | CS | Ferritin | severe/no-severe | 10/29 | 52.5 | 2817.6 | 3457.9 | 52.5 | 708.6 | 1074.5 | ng/mL | 6 |
| severe/mild | 10/20 | 52.5 | 2817.6 | 3457.9 | 52.5 | 327.7 | 401.2 | ng/mL | |||||
| moderate/mild | 9/20 | 52.5 | 1555.0 | 1578.1 | 52.5 | 327.7 | 401.2 | ng/mL | |||||
| Erol, S.A. (2021) [43] | Turkey (AS) | CC | Ferritin | 1st trimester case/control | 24/26 | 26.3 | 47.0 | 59.3 | 26.34 | 26.2 | 22.8 | ng/mL | 7 |
| 2nd trimester case/control | 26/22 | 29.76 | 35.5 | 55.1 | 28.04 | 13.4 | 10.6 | ng/mL | |||||
| 3rd Trimester case/control | 21/22 | 26.895 | 31.6 | 45.4 | 26.3 | 9.4 | 5.6 | ng/mL | |||||
| Ersöz, A. (2021) [9] | Turkey (AS) | CC | Serum iron | dead/discharge | 29/281 | 69.2 | 25.3 | 22.7 | 55.8 | 42.1 | 31.0 | mg/dL | 6 |
| Lv, Y. (2021) [6] | China (AS) | C | Ferritin | severe/no-severe | 60/98 | 63.4 | 1088.7 | 285.6 | 63.4 | 328.1 | 216.2 | ng/mL | 7 |
| Serum iron | severe/no-severe | 60/98 | 63.4 | 11.3 | 2.4 | 63.4 | 15.5 | 1.7 | umol/L | ||||
| Skalny, A.V. (2021) [16] | Russia (EU) | CC | Serum iron | severe/control | 50/44 | NA | 1.3 | 0.7 | NA | 1.9 | 0.7 | ug/mL | 7 |
| Tojo, K. (2021) [7] | Japan (AS) | CC | Serum iron | dead/discharge | 8/128 | NA | 38.5 | 41.1 | NA | 42.3 | 30.0 | mg/dL | 5 |
| Yağcı, S. (2021) [10] | Turkey (AS) | CC | Serum iron | dead/discharge | 23/36 | 63.63 | 309.0 | 200.9 | 63.63 | 369.3 | 235.3 | ug/L | 7 |
| critical/control | 22/19 | 63.5 | 335.4 | 206.7 | 65.6 | 784.1 | 225.6 | ug/L | |||||
| TIBC | dead/discharge | 23/36 | 63.63 | 1666.2 | 651.5 | 63.63 | 2388.4 | 515.7 | ug/L | ||||
| TSAT | dead/discharge | 23/36 | 63.63 | 19.6 | 12.8 | 63.63 | 16.1 | 9.7 | % | ||||
| Hemoglobin | dead/discharge | 23/36 | 63.63 | 103.8 | 26.3 | 63.63 | 129.3 | 19.7 | ug/mL | ||||
| critical/control | 22/19 | 63.5 | 98.5 | 23.9 | 65.6 | 138.2 | 11.9 | g/L | |||||
| Ferritin | dead/discharge | 23/36 | 63.63 | 1183.0 | 846.6 | 63.63 | 592.9 | 658.9 | ug/L | ||||
| critical/control | 22/19 | 63.5 | 1205.8 | 853.5 | 65.6 | 68.8 | 43.6 | ug/L | |||||
| Hepcidin | dead/discharge | 23/36 | 63.63 | 728.4 | 407.2 | 63.63 | 880.9 | 493.5 | pg/mL | ||||
| critical/control | 22/19 | 63.5 | 603.3 | 244.4 | 65.6 | 992.8 | 230.7 | pg/mL | |||||
| Yasui, Y. (2020) [70] | Japan (AS) | C | Ferritin | severe/mild | 7/22 | 54.3 | 956.0 | 689.0 | 62.7 | 458.0 | 399.0 | ng/mL | 7 |
| Zeng, H.L. (2021) [22] | China (AS) | C | Serum iron | dead/discharge | 15/291 | 63 | 358.6 | 79.5 | 63 | 378.1 | 7.4 | mg/L | 6 |
| Severe/no severe | 104/202 | 69 | 376.5 | 73.8 | 58 | 436.6 | 64.6 | mg/L | |||||
| Hemoglobin | severe/no severe | 104/202 | 69 | 107.9 | 19.2 | 58 | 125.1 | 16.4 | g/L | ||||
| Ferritin | severe/no severe | 104/202 | 69 | 683.7 | 556.5 | 58 | 338.3 | 259.3 | ug/L | ||||
| Zhou, C. (2020) [24] | China (AS) | CC | Hemoglobin | severe/control | 12/50 | 48.2 | 134.2 | 22.1 | 46.5 | 143.1 | 22.2 | g/L | 7 |
| Ferritin | severe/control | 12/50 | 48.2 | 207.8 | 45.2 | 46.5 | 85.2 | 18.6 | ng/mL | ||||
| Hepcidin | severe/control | 12/50 | 48.2 | 31.7 | 8.9 | 46.5 | 15.7 | 2.6 | ng/mL | ||||
| Nai, A. (2021) [11] | Italy (EU) | C | Serum iron | dead/discharge | 22/89 | 57.5 | 26.5 | 9.3 | 57.5 | 29.7 | 12.1 | ug/dL | 7 |
| Ferritin | dead/discharge | 22/89 | 57.5 | 1939.1 | 1888.9 | 57.5 | 1494.9 | 1377.3 | ug/L | ||||
| Hepcidin | dead/discharge | 22/89 | 57.5 | 516.6 | 236.8 | 57.5 | 329.2 | 205.3 | ng/mL | ||||
| Uta, M. (2022) [17] | Romania (EU) | CC | Serum iron | case/control | 95/351 | NA | 7.6 | 2.1 | NA | 8.8 | 2.3 | umol/L | 7 |
| Hemoglobin | case/control | 95/351 | NA | 10.1 | 2.9 | NA | 11.0 | 2.1 | g/dL | ||||
| Ferritin | case/control | 95/351 | NA | 21.4 | 4.2 | NA | 23.3 | 4.6 | ng/mL | ||||
| Bianconi, V. (2022) [12] | Italy (EU) | CS | Serum iron | dead/discharge | 101/261 | 79 | 26.7 | 15.0 | 72 | 38.9 | 26.1 | μg/dL | 6 |
| TIBC | dead/discharge | 101/261 | 79 | 189.7 | 47.4 | 72 | 215.8 | 49.2 | μg/dL | ||||
| Ferritin | dead/discharge | 101/261 | 79 | 822.7 | 798.7 | 72 | 462.0 | 451.0 | ng/mL | ||||
| Delaye, J.B. (2022) [18] | France (EU) | CC | Serum iron | case/control | 55/45 | 72.8 | 8.4 | 6.5 | 75.5 | 9.3 | 2.7 | µmol/L | 8 |
| Hemoglobin | case/control | 55/45 | 72.8 | 115.9 | 22.2 | 75.5 | 113.1 | 18.7 | g/L | ||||
| Ferritin | case/control | 55/45 | 72.8 | 829.3 | 940.4 | 75.5 | 485.5 | 425.9 | µg/L | ||||
| Hepcidin | case/control | 55/45 | 72.8 | 43.7 | 43.8 | 75.5 | 12.9 | 10.6 | nmol/L | ||||
| Zhao, K. (2020) [23] | China (AS) | CS | Serum iron | severe/mild | 18/19 | 54.6 | 5.7 | 3.3 | 50.1 | 7.7 | 4.4 | µmol/L | 6 |
| Hemoglobin | critical/mild | 13/19 | 65.3 | 135.1 | 24.1 | 50.1 | 128.1 | 26.4 | g/L | ||||
| Kronstein-Wiedemann, R. (2022) [19] | Germany (EU) | CC | Serum iron | case/control | 27/23 | NA | 5.2 | 3.2 | NA | 8.6 | 3.1 | μmol/L | 7 |
| Hemoglobin | case/control | 27/23 | NA | 7.0 | 1.2 | NA | 9.0 | 0.7 | mmol/L | ||||
| Ferritin | case/control | 27/23 | NA | 1082.7 | 1138.6 | NA | 103.2 | 119.5 | µg/L | ||||
| Catherine, C. (2021) [14] | France (EU) | C | Serum iron | severe/mild | 35/38 | NA | 6.4 | 6.6 | NA | 7.2 | 5.4 | μM/L | 6 |
| Ferritin | severe/mild (man) | 22/20 | NA | 1431.0 | 44.0 | NA | 541.0 | 10.7 | pg/dL | ||||
| Ferritin | severe/mild (woman) | 13/18 | NA | 1921.0 | 57.3 | NA | 334.0 | 11.3 | pg/dL | ||||
| Moreira, A.C. (2021) [20] | Portugal (EU) | CC | Serum iron | case/control | 127/176 | ≥18 | 28.2 | 18.7 | ≥18 | 47.7 | 40.0 | µg/dL | 6 |
| Ferritin | case/control | 127/176 | ≥18 | 752.8 | 655.3 | ≥18 | 233.0 | 195.4 | ng/mL | ||||
| Hepcidin | case/control | 127/176 | ≥18 | 69.8 | 53.3 | ≥18 | 54.5 | 83.9 | nM | ||||
| Ahmed, S. (2021) [46] | Pakistan (AS) | CS | Ferritin | severe/no-severe | 86/71 | 60.6 | 884.1 | 716.9 | 53.6 | 561.9 | 672.7 | ng/mL | 6 |
| dead/discharge | 28/129 | 66.4 | 1107.6 | 784.9 | 55.5 | 650.2 | 667.1 | ng/mL | |||||
| Kilercik, M. (2022) [15] | Turkey (AS) | C | Serum iron | Severe to Critical/Mild to Moderate | 19/35 | 51.8 | 25.4 | 28.0 | 52 | 27.8 | 22.8 | μmol/L | 7 |
| Hemoglobin | Severe to Critical/Mild to Moderate | 19/35 | 51.8 | 12.6 | 2.3 | 52 | 13.7 | 1.3 | mmol/L | ||||
| Ferritin | Severe to Critical/Mild to Moderate | 19/35 | 51.8 | 740.1 | 831.8 | 52 | 357.4 | 345.5 | mg/L | ||||
| Ergin Tuncay, M. (2022) [21] | Turkey (AS) | CC | Serum iron | case/control | 116/46 | 60.8 | 27.9 | 7.9 | 37.5 | 69.2 | 10.7 | µg/dL | 7 |
| Ferritin | case/control | 116/46 | 60.8 | 389.0 | 41.6 | 37.5 | 48.0 | 9.6 | µg/L | ||||
| Wu, C. (2020) [47] | China (AS) | C | Ferritin | dead/discharge | 44/40 | 68.5 | 1226.3 | 1104.0 | 50 | 1063.4 | 1259.7 | ng/mL | 6 |
| Deng, F. (2020) [38] | China (AS) | CS | Hemoglobin | dead/discharge | 50/50 | 68.7 | 128.2 | 18.7 | 62.4 | 123.5 | 21.4 | g/L | 6 |
| Ferritin | dead/discharge | 50/50 | 68.7 | 1743.6 | 994.8 | 62.4 | 602.0 | 498.3 | μg/L | ||||
| Guan, X. (2020) [48] | China (AS) | C | Ferritin | dead/discharge (1) | 65/919 | 71 | 1568.9 | 1168.4 | 60.6 | 549.0 | 462.1 | μg/L | 6 |
| dead/discharge (2) | 7/279 | 77.7 | 1793.6 | 1059.4 | 56.2 | 368.1 | 334.9 | μg/L | |||||
| Tural Onur, S. (2021) [49] | Turkey (AS) | CS | Ferritin | dead/discharge | 56/245 | 62 | 451.3 | 466.2 | 55 | 233.2 | 186.6 | ng/mL | 6 |
| Branco, C.G. (2021) [39] | Portugal (EU) | CS | Hemoglobin | dead/discharge | 34/96 | 83.1 | 3183.9 | 11.2 | 2.6 | 11.9 | 2.2 | g/dL | 6 |
| Ferritin | dead/discharge | 34/96 | 83.1 | 3183.9 | 4248.3 | 70.6 | 958.7 | 1303.6 | ug/dL | ||||
| Lino, K. (2021) [50] | Brazil (SA) | CS | Ferritin | dead/discharge | 19/29 | 66.7 | 4207.7 | 3530.3 | 54.3 | 1717.7 | 2789.8 | ng/mL | 6 |
| Khamis, F. (2021) [51] | Oman (AS) | CS | Ferritin | dead/discharge | 257/745 | 63 | 1144.0 | 1060.9 | 51 | 820.8 | 837.8 | ng/mL | 6 |
| Bozkurt, F.T. (2021) [78] | Turkey (AS) | CS | Ferritin | severe to critical/mild to moderate | 23/70 | 61.9 | 670.4 | 631.3 | 37.2 | 108.4 | 95.1 | ng/mL | 7 |
| García-Gasalla, M. (2021) [71] | Spain (EU) | CS | Ferritin | several/mild | 32/49 | 61.7 | 454.8 | 383.4 | 53.5 | 164.8 | 176.4 | ng/mL | 6 |
| Venter, C. (2020) [44] | South Africa (AF) | CC | Ferritin | case/control | 33/13 | 53.1 | 394.8 | 416.1 | 55.6 | 105.5 | 77.7 | ng/mL | 8 |
| Rahman, M.A. (2021) [25] | Bangladesh (AF) | C | Hemoglobin | severe/no-severe | 108/198 | 54.1 | 12.6 | 6.0 | 45.6 | 12.7 | 1.4 | g/dL | 7 |
| Ferritin | severe/no-severe | 108/198 | 54.1 | 651.9 | 793.3 | 45.6 | 86.4 | 34.8 | ng/mL | ||||
| Yardımcı, A.C. (2021) [52] | Italy (EU) | CS | Ferritin | dead/discharge | 30/692 | 57.2 | 575.4 | 419.6 | 57.2 | 316.0 | 292.0 | μg/L | 7 |
| Kirtana, J. (2020) [67] | India (AS) | CS | Ferritin | moderate/mild | 3/47 | 37.4 | 306.2 | 158.5 | 37.4 | 73.3 | 71.0 | ng/mL | 6 |
| Martinez Mesa, A. (2021) [53] | Spain (EU) | C | Ferritin | dead/discharge | 7/53 | NA | 1666.0 | 1217.0 | NA | 779.0 | 476.0 | ng/mL | 8 |
| Rasyid, H. (2021) [54] | Indonesia (AS) | C | Ferritin | dead/discharge | 31/264 | 56.6 | 3264.6 | 2941.1 | 46.2 | 1511.4 | 2941.2 | ng/mL | 7 |
| Sukrisman, L. (2021) [68] | Indonesia (AS) | CS | Ferritin | severe/mild | 6/39 | 50.9 | 2402.4 | 3886.9 | 50.9 | 1277.6 | 1939.8 | μg/mL | 6 |
| moderate/mild | 64/39 | 50.9 | 1898.0 | 2514.0 | 50.9 | 1277.6 | 1939.8 | μg/mL | |||||
| Zanella, A. (2021) [55] | Italy (EU) | CS | Ferritin | dead/discharge | 426/834 | 67.4 | 1579.0 | 897.1 | 60 | 1514.2 | 1225.3 | ng/mL | 7 |
| Az, A. (2021) [30] | Turkey (AS) | CS | Hemoglobin | dead/discharge | 23/517 | 48 | 12.7 | 2.3 | 48 | 13.7 | 1.7 | g/dL | 6 |
| critical/mild | 30/221 | 63.4 | 12.7 | 1.8 | 41.1 | 13.8 | 1.9 | g/dL | |||||
| Ferritin | dead/discharge | 23/517 | 48 | 281.4 | 336.8 | 48 | 189.2 | 173.2 | μg/L | ||||
| several/mild | 290/221 | 52.8 | 303.7 | 333.9 | 41.1 | 104.0 | 107.8 | µg/L | |||||
| Burugu, H.R. (2020) [56] | India (AS) | CS | Ferritin | dead/discharge | 3/47 | 41.7 | 1410.0 | 370.7 | 41.7 | 478.8 | 424.7 | ng/mL | 6 |
| Chakurkar, V. (2021) [13] | India (AS) | C | Serum iron | dead/discharge | 21/99 | NA | 23.9 | 9.1 | NA | 38.1 | 31.6 | μg/dL | 8 |
| severe/mild | 41/22 | 59 | 30.6 | 19.3 | 38.5 | 42.7 | 28.4 | μg/dL | |||||
| TIBC | dead/discharge | 21/99 | NA | 221.0 | 50.5 | NA | 269.8 | 74.9 | μg/dL | ||||
| TSAT | dead/discharge | 21/99 | NA | 13.1 | 9.1 | NA | 15.1 | 12.4 | % | ||||
| severe/mild | 41/22 | 59 | 15.0 | 10.8 | 38.5 | 14.7 | 10.9 | % | |||||
| Ferritin | dead/discharge | 21/99 | NA | 810.2 | 894.8 | NA | 289.5 | 304.6 | ng/mL | ||||
| severe/mild | 41/22 | 59 | 584.3 | 527.2 | 38.5 | 169.0 | 201.2 | ng/mL | |||||
| Hepcidin | dead/discharge | 21/99 | NA | 235.3 | 120.8 | NA | 126.2 | 146.6 | ng/mL | ||||
| Rai, D. (2021) [57] | India (AS) | CS | Ferritin | dead/discharge | 188/498 | 58.7 | 847.6 | 769.4 | 48 | 362.6 | 365.8 | ng/mL | 7 |
| Aygun, H. (2021) [58] | Turkey (AS) | C | Ferritin | dead/discharge | 41/290 | 56 | 880.1 | 535.6 | 56 | 182.2 | 178.5 | ng/mL | 6 |
| San Segundo, D. (2021) [69] | Spain (EU) | C | Ferritin | moderate–severe/mild | 82/73 | 71.3 | 636.8 | 687.5 | 61.1 | 309.8 | 376.3 | ng/mL | 8 |
| Pujani, M. (2021) [59] | India (AS) | CS | Ferritin | dead/discharge | 15/85 | NA | 569.1 | 320.9 | NA | 276.5 | 176.5 | ng/mL | 8 |
| several/mild | 13/61 | ≥18 | 624.6 | 314.8 | ≥18 | 235.2 | 174.43 | ng/mL | |||||
| Haroun, R.A. (2021) [72] | Egypt (AF) | CC | Ferritin | severe to critical/mild to moderate | 52/98 | 50.4 | 494.1 | 261.0 | 48.36 | 213.9 | 135.2 | ng/mL | 7 |
| case/control | 150/50 | 43.43 | 361.1 | 252.5 | 45.8 | 104.4 | 50.9 | ng/mL | |||||
| Sukrisman, L. (2021) [79] | Japan (AS) | CS | Ferritin | severe/no-severe | 8/33 | 55.3 | 772.4 | 271.4 | 46.8 | 513.8 | 612.8 | ng/mL | 6 |
| Chen, Q. (2020) [60] | China (AS) | CS | Ferritin | dead/discharge | 46/68 | 65.9 | 1315.1 | 653.2 | 58.6 | 423.8 | 423.8 | ng/mL | 6 |
| Gayam, V. (2020) [40] | America (NA) | C | Hemoglobin | dead/discharge | 132/276 | 71 | 12.6 | 2.4 | 63 | 12.7 | 1.9 | g/dL | 7 |
| Ferritin | dead/discharge | 132/276 | 71 | 1221.1 | 859.0 | 63 | 795.5 | 596.9 | ng/dL | ||||
| Ghweil, A.A. (2020) [31] | Egypt (AF) | C | Hemoglobin | severe to critical/mild to moderate | 30/36 | 62.6 | 12.6 | 0.9 | 55.5 | 12.7 | 1.2 | g/dL | 7 |
| Ferritin | severe to critical/mild to moderate | 30/36 | 62.6 | 440.3 | 87.3 | 55.5 | 268.6 | 57.5 | ng/mL | ||||
| Ramadan, H.K. (2020) [32] | Egypt (AF) | CS | Hemoglobin | severe/mild | 60/66 | NA | 12.7 | 1.8 | NA | 12.8 | 1.7 | g/dL | 6 |
| Ferritin | severe/mild | 60/66 | NA | 638.4 | 62.4 | NA | 258.1 | 47.6 | ng/mL | ||||
| Ferritin | moderate–severe/mild | 134/66 | NA | 471.5 | 35.9 | NA | 258.1 | 47.6 | ng/mL | ||||
| Zeng, Z. (2020) [41] | China (AS) | CS | Hemoglobin | dead/discharge | 14/54 | 60.9 | 140.0 | 8.6 | 60.9 | 127.6 | 19.3 | g/L | 6 |
| Yamamoto, A. (2021) [33] | Japan (AS) | CS | Hemoglobin | severe/mild | 9/63 | 69.2 | 14.2 | 1.1 | 42.8 | 14.2 | 2.0 | g/dL | 6 |
| Ferritin | moderate/mild | 48/63 | 50.9 | 246.7 | 194.1 | 42.8 | 194.1 | 196.5 | ng/mL | ||||
| Abdelhakam, D.A. (2021) [34] | Egypt (AF) | CS | Hemoglobin | severe/mild | 66/58 | 49.6 | 14.1 | 1.4 | 43.5 | 13.8 | 2.7 | g/dL | 7 |
| Ferritin | severe/mild | 66/58 | 49.6 | 821.8 | 583.6 | 43.5 | 213.9 | 123.9 | ng/mL | ||||
| Yousaf, M.N. (2022) [61] | Pakistan (AS) | CS | Ferritin | dead/discharge | 135/251 | 56.5 | 810.0 | 409.0 | 52.7 | 593.0 | 471.0 | ng/mL | 6 |
| Emsen, A. (2021) [35] | Turkey (AS) | CC | Hemoglobin | severe/mild | 15/26 | 49.7 | 14.1 | 1.6 | 44.4 | 13.5 | 1.8 | g/L | 8 |
| Ferritin | severe/mild | 15/26 | 49.7 | 294.7 | 255.9 | 44.4 | 137.6 | 255.4 | ng/mL | ||||
| Doghish, A.S. (2021) [36] | Egypt (AF) | CC | Hemoglobin | case/control | 171/26 | 41.4 | 13.3 | 1.9 | 42.9 | 13.6 | 2.3 | g/dL | 8 |
| Ferritin | case/control | 171/26 | 41.4 | 349.1 | 403.7 | 42.9 | 110.8 | 91.6 | ng/mL | ||||
| Fei, F. (2020) [37] | England (EU) | CC | Hemoglobin | case/control | 24/26 | 65.4 | 12.4 | 5.3 | 56.3 | 11.1 | 2.7 | g/dL | 7 |
| Ferritin | case/control | 24/26 | 65.4 | 1294.8 | 1624.0 | 56.3 | 354.8 | 328.0 | ng/mL | ||||
| Bats, M.L. (2021) [66] | France (EU) | C | Ferritin | severe/no-severe | 97/106 | 67.2 | 1228.2 | 1233.4 | 59.7 | 417.3 | 405.1 | ng/mL | 6 |
| Arshad, A.R. (2020) [62] | Pakistan (AS) | CS | Ferritin | dead/discharge | 22/216 | 41.2 | 1680.6 | 714.6 | 41.2 | 256.5 | 246.5 | ng/mL | 6 |
| several/mild | 45/157 | 41.2 | 1267.0 | 998.2 | 41.2 | 183.1 | 135.1 | ng/mL | |||||
| moderate/mild | 36/157 | 41.2 | 527.0 | 444.5 | 41.2 | 183.1 | 135.1 | ng/mL | |||||
| Aly, M.M. (2021) [26] | Egypt (AF) | CS | Hemoglobin | severe/no-severe | 165/185 | 54.6 | 11.6 | 2.2 | 38.1 | 12.4 | 2.2 | g/dL | 7 |
| Ferritin | severe/no-severe | 165/185 | 54.6 | 249.3 | 263.3 | 38.1 | 223.4 | 254.0 | mcg/mL | ||||
| Garcia-Gasalla, M. (2022) [80] | Spain (EU) | CS | Ferritin | severe to critical/mild to moderate | 81/58 | 56 | 820.4 | 675.5 | 49.2 | 279.2 | 341.3 | ng/mL | 6 |
| Huang, H. (2021) [27] | China (AS) | CS | Hemoglobin | severe/no-severe | 21/43 | 61.4 | 128.2 | 16.3 | 41.2 | 138.1 | 13.8 | g/L | 7 |
| Ferritin | severe/no-severe | 21/43 | 61.4 | 766.1 | 564.4 | 41.2 | 304.3 | 251.9 | ng/mL | ||||
| Masetti, C. (2020) [63] | Italy (EU) | C | Ferritin | dead/discharge | 33/196 | 75.2 | 1332.0 | 1675.0 | 58.3 | 577.0 | 545.0 | ng/mL | 7 |
| Nizami, D.J. (2021) [81] | UAE (AS) | CS | Ferritin | severe/no-severe | 18/75 | ≥18 | 4169.8 | 4954.6 | ≥18 | 381.3 | 3.5 | ng/mL | 6 |
| Sana, A. (2022) [28] | India (AS) | CS | Hemoglobin | severe/no-severe | 69/81 | ≥18 | 13.9 | 1.5 | ≥18 | 14.4 | 1.8 | g/dL | 6 |
| Ferritin | severe/no-severe | 69/81 | ≥18 | 596.0 | 661.7 | ≥18 | 419.6 | 408.1 | ng/mL | ||||
| Huang, C.Y. (2022) [29] | China (AS) | CS | Hemoglobin | severe/no-severe | 86/142 | 66.2 | 13.6 | 1.8 | 55.8 | 13.8 | 1.8 | g/dL | 7 |
| Ferritin | severe/no-severe | 86/142 | 66.2 | 1200.6 | 897.3 | 55.8 | 571.9 | 516.8 | ng/mL | ||||
| Marimuthu, A.K. (2021) [64] | India (AS) | CS | Ferritin | dead/discharge | 35/186 | 60 | 902.7 | 851.1 | 60 | 403.7 | 364.6 | ng/mL | 6 |
| Subgroups | N of Studies | SMD (95%CI) | Test of SMD = 0 | Heterogeneity | ||
|---|---|---|---|---|---|---|
| Z | p for Z | I2 | p for I2 | |||
| Serum iron | 8 | −0.483 (−0.597, −0.368) | 8.27 | <0.001 | 0.90% | 0.423 |
| Ferritin | 29 | 1.121 (0.854, 1.388) | 8.22 | <0.001 | 95.70% | <0.001 |
| Year | ||||||
| 2020 | 9 | 1.881 (1.137, 2.625) | 4.95 | <0.001 | 96.70% | <0.001 |
| 2021 | 18 | 0.847 (0.575, 1.119) | 6.1 | <0.001 | 93.90% | <0.001 |
| 2022 | 2 | 0.550 (0.393, 0.707) | 6.86 | <0.001 | 0.00% | 0.347 |
| Hemoglobin | 6 | −0.186 (−0.571, 0.198) | 0.950 | 0.343 | 82.50% | <0.001 |
| Year | ||||||
| 2020 | 3 | 0.215 (−0.168, 0.598) | 1.100 | 0.272 | 67.40% | 0.047 |
| 2021 | 3 | −0.632 (−1.070, −0.194) | 2.830 | 0.005 | 64.40% | 0.060 |
| Hepcidin | 3 | 0.447 (−0.287, 1.182) | 1.190 | 0.232 | 84.80% | 0.001 |
| TSAT | 3 | −0.112 (−0.455, 0.231) | 0.64 | 0.521 | 59.60% | 0.084 |
| TIBC | 4 | −0.612 (−0.900, −0.324) | 4.16 | <0.001 | 71.00% | 0.016 |
| Subgroups | N of Studies | SMD (95%CI) | Test of SMD = 0 | Heterogeneity | ||
|---|---|---|---|---|---|---|
| Z | p for Z | I2 | p for I2 | |||
| Serum iron | ||||||
| Overall | 7 | −1.384 (−2.175, −0.592) | 3.43 | 0.001 | 96.70% | <0.001 |
| Continent | ||||||
| Asia | 2 | −3.403 (−5.974, −0.832) | 2.59 | 0.009 | 96.30% | <0.001 |
| Europe | 5 | −0.580 (−0.791, −0.370) | 5.41 | <0.001 | 48.60% | 0.100 |
| Severe-Mild | 4 | −0.293 (−0.561, −0.024) | 2.13 | 0.033 | 0.00% | 0.545 |
| Severe-non-Severe | 3 | −1.144 (−2.060, −0.227) | 2.45 | 0.014 | 94.20% | <0.001 |
| Ferritin | ||||||
| Overall | 17 | 1.383 (0.792, 1.975) | 4.58 | <0.001 | 96.30% | <0.001 |
| Design | ||||||
| Cross-Section Study | 3 | 3.935 (−0.739, 8.608) | 1.65 | 0.099 | 99.00% | <0.001 |
| Case-Control Study | 14 | 0.872 (0.443, 1.300) | 3.98 | <0.001 | 92.40% | <0.001 |
| Severe-non-Severe | 13 | 0.864 (0.389, 1.338) | 3.57 | <0.001 | 96.00% | <0.001 |
| Severe-Mild | 18 | 1.414 (0.995, 1.834) | 6.61 | <0.001 | 92.70% | <0.001 |
| Year | ||||||
| 2020 | 5 | 2.652 (1.035, 4.269) | 3.21 | 0.001 | 96.50% | <0.001 |
| 2021 | 11 | 1.037 (0.735, 1.340) | 6.72 | <0.001 | 77.70% | <0.001 |
| 2022 | 2 | 0.885 (0.583, 1.188) | 5.74 | <0.001 | 0.00% | 0.407 |
| Moderate-Mild | 8 | 1.551 (0.535, 2.566) | 2.99 | 0.003 | 97.20% | <0.001 |
| Year | ||||||
| 2020 | 4 | 2.802 (0.678, 4.925) | 2.59 | 0.010 | 97.40% | <0.001 |
| 2021 | 4 | 0.400 (0.207, 0.592) | 4.07 | <0.001 | 0.00% | 0.553 |
| Continent | ||||||
| Asia | 6 | 0.976 (0.362, 1.591) | 3.11 | 0.002 | 88.00% | <0.001 |
| Europe | 1 | 0.581 (0.259, 0.903) | 3.54 | <0.001 | / | / |
| Africa | 1 | 5.319 (4.718, 5.920) | 17.34 | <0.001 | / | / |
| Hemoglobin | ||||||
| Overall | 7 | −0.612 (−1.159, −0.065) | 2.190 | 0.028 | 87.90% | <0.001 |
| Severe-non-Severe | 6 | −0.394 (−0.703, −0.086) | 2.500 | 0.012 | 86.50% | <0.001 |
| Severe-Mild | 8 | −0.073 (−0.209, 0.064) | 1.040 | 0.298 | 5.80% | 0.386 |
| Hepcidin | ||||||
| Overall | 4 | 0.750 (−0.805, 2.306) | 0.95 | 0.345 | 96.40% | <0.001 |
Publisher’s Note: MDPI stays neutral with regard to jurisdictional claims in published maps and institutional affiliations. |
© 2022 by the authors. Licensee MDPI, Basel, Switzerland. This article is an open access article distributed under the terms and conditions of the Creative Commons Attribution (CC BY) license (https://creativecommons.org/licenses/by/4.0/).
Share and Cite
Zhou, S.; Li, H.; Li, S. The Associations of Iron Related Biomarkers with Risk, Clinical Severity and Mortality in SARS-CoV-2 Patients: A Meta-Analysis. Nutrients 2022, 14, 3406. https://doi.org/10.3390/nu14163406
Zhou S, Li H, Li S. The Associations of Iron Related Biomarkers with Risk, Clinical Severity and Mortality in SARS-CoV-2 Patients: A Meta-Analysis. Nutrients. 2022; 14(16):3406. https://doi.org/10.3390/nu14163406
Chicago/Turabian StyleZhou, Shuya, Huihui Li, and Shiru Li. 2022. "The Associations of Iron Related Biomarkers with Risk, Clinical Severity and Mortality in SARS-CoV-2 Patients: A Meta-Analysis" Nutrients 14, no. 16: 3406. https://doi.org/10.3390/nu14163406