Abstract
Background: Matrix metalloproteinase-10 (MMP-10) levels increase progressively starting from early diabetic kidney disease (DKD) stages. Vitamin D3 (vitD3) deficit is associated with a higher risk of diabetic microangiopathy. Reduced MMP-10 expression has been observed after exposure to vitD3. Aim: to assess how vitD3 status is related to MMP-10 levels in patients with Type 2 diabetes (T2D). Methods: 256 patients with T2D were included in this cross-sectional study. Demographic, clinical and serum MMP-10 and 25-hydroxyvitamin D3 (25(OH)D3) levels were collected from each patient. The association between MMP-10 and (25(OH)D3) levels was assessed using a correlation analysis and fitting a multivariate linear regression model. Results: Serum MMP-10 levels were inversely correlated with circulating 25(OH)D3 (rho = −0.25; p < 0.001). In the subgroup analysis this correlation was significant in patients with DKD (rho = −0.28; p = 0.001) and in subjects with vitD3 deficit (rho = −0.24; p = 0.005). In the regression model adjusted for kidney function, body adiposity, smoking and vitD supplementation MMP-10 levels were 68.7 pg/mL lower in patients with 25(OH)D3 > 20 ng/mL, with respect to ≤20 ng/mL (p = 0.006). Conclusions: vitD3 repletion status is an independent predictor of MMP-10 levels in T2D patients. Perhaps, high 25(OH)D3 values should be targeted in these patients in order to prevent vascular complications.
1. Introduction
Altered expression of matrix metalloproteinases (MMPs) and tissue inhibitors of metalloproteinases (TIMPs) has been shown in diabetic kidney disease (DKD) [1,2]. These enzymes participate in the activation of growth factors and cytokines [3]. MMPs can be found in renal tissue [4]. Particularly, MMP-10 is expressed in the murine glomeruli and juxtaglomerular apparatus, and has been shown to degrade type II, IV and V collagens, gelatin and elastin [2]. Additionally, MMP-10 can activate other MMPs and inflammatory mediators, such as tumor necrosis factor alpha precursor (pro-TNF-α) [5]. In turn, MMP-10 expression is triggered by inflammatory stimuli present in chronic kidney disease (CKD), diabetes and atherosclerosis [6,7,8]. Renin–angiotensin–aldosterone system (RAAS) inhibitors prevented MMP-10 activation in a murine DKD model, suggesting that angiotensin II (Ang-II) could also activate a signaling pathway involved in MMP-10 expression regulation [8]. In patients with Type 2 diabetes (T2D) and CKD, elevated serum MMP-10 values were observed at early stages of nephropathy, followed by a progressive increase at more advanced CKD stages [8]. Furthermore, in patients with CKD serum, MMP-10 concentrations were associated with atherosclerosis severity [6].
The 25-hydroxyvitamin D3 (25(OH)D3) is the main circulating form of vitamin D3 (vitD3) and the most convenient biomarker of the vitD3 repletion status [9,10]. VitD3 is involved in multiple metabolic and immunological processes [11]. In patients with diabetes, a vitD3 deficit has been associated with a higher prevalence of microvascular complications [12]. Supplementation with vitD3 has been shown to improve systemic inflammation by reducing interleukin-6 and TNF-α levels [13]. Additionally, vitD3 has been shown to down-regulate the RAAS [14]. In CKD, the increase in Ang-II induces disintegrin and metalloproteinase-17 (ADAM17) expression, which activates the epidermal growth factor receptor/mitogen-activated protein kinase (EGFR-MAPK) pathway implicated in fibrosis, glomerulosclerosis, tubular dilation and atrophy [4]. VitD3 has been shown to inhibit ADAM17 expression and to block signal transmission in the EGFR–MAPK pathway [4]. Nevertheless, little is known about the relationship between vitD3 and other MMPs. We aimed to evaluate whether circulating 25(OH)D3 levels are associated with serum MMP-10 or TIMP-1 concentrations in patients with T2D.
2. Materials and Methods
2.1. Ethics
The study was approved by the University of Navarra Research Ethics Committee (2021.183TFG). Samples and patients’ data were provided by the University of Navarra Biobank and processed following standard operating procedures approved by the Research Ethics and Scientific Committees. All patients included in this study were properly informed and gave their written consent for sample collection, analysis and storage, as well as for use of their demographic and clinical data before inclusion.
2.2. Study Population
The original cohort included 271 patients with T2D recruited in 2009–2016 in the outpatient Endocrinology and Nephrology units of the Clinica Universidad de Navarra. The inclusion criteria were as follows: patients with T2D aged ≥18 years with or without CKD defined as an estimated glomerular filtration rate (eGFR) >60 mL/min/1.73 m2 and urine albumin–creatinine ratio (UACR) ≥30 mcg/mg or eGFR ≤60 mL/min/1.73 m2, independently of albuminuria. The exclusion criteria were: corticosteroid or immunosuppressive therapy, ongoing inflammatory, autoimmune or malignant process and/or data of probable non-diabetes-related nephropathy. For the final analysis, 256 patients were included, after eliminating participants with missing or extreme 25(OH)D3 (>100 ng/mL) values and patients with unknown T2D duration.
2.3. Data Acquisition and Measurement
All data was collected at the inclusion visit, comprising demographic (age and sex) and clinical (hypertension; cardiovascular diseases ((CVD), including ischemic heart disease, cerebrovascular ischemia and peripheral arterial disease; CKD; time since T2D diagnosis; weight and height), laboratory (fasting glycemia, serum cystatin C, creatinine, eGFR estimated by CKD-EPI 2021 formula [15], urea, urate, cholesterol (total and fractions), triglycerides, hemoglobin, calcium, phosphate, intact parathyroid hormone (PTH), C reactive protein (CRP), albumin, Hb1Ac and UACR) variables and information about treatments (loop diuretics, thiazides, RAAS inhibitors, paricalcitol and vitD supplements, including calcifediol and cholecalciferol). The MMP-10 and TIMP-1 serum levels were measured with the ELISA kit (DM1000 and DY970 respectively, R&D Systems, UK) according to the manufacturer’s instructions. The 25(OH)D3 levels were assessed using the immunoassay based on ElectroChemiLuminescence (ECL) technology. The month and the year of the sample acquisition were recorded to consider seasonal 25(OH)D3 variations. The body mass index (BMI) was calculated and the body fat percentage (BF%) was estimated using the Clinica Universidad de Navarra Body Adiposity Estimator (CUN-BAE), a previously validated formula based on age, sex and BMI [16,17]. Following the Endocrine Society Clinical Practice Guideline, the study population was divided into 3 groups according to the serum 25(OH)D3 level: normal vitD3 status (>30 ng/mL), insufficiency (20–30 ng/mL) and deficiency (<20 ng/mL) [9]. Alternative 25(OH)D3 cut-offs were also explored, based on national recommendations and considering the existing controversies regarding the optimal 25(OH)D3 level [18,19].
2.4. Statistical Analysis
The normality of distribution for continuous variables was checked using distribution graphs and the Shapiro–Wilk test. Qualitative data are presented as proportions; for quantitative data either a mean and standard deviation (SD) or a median and the interquartile range were calculated. The proportion of subjects with vitD3 deficit was compared in patients with and without CKD and with and without obesity using the Fisher’s exact test. To assess the correlations between MMP-10, TIMP-1 and 25(OH)D3 values, Spearman’s rank correlation coefficient was estimated, as these variables did not follow a normal distribution. The confidence intervals for the correlation coefficients were constructed using the bootstrapping procedure. The correlations between MMP-10, TIMP-1 and 25(OH)D3 values were evaluated in the entire sample, in different vitD3 status subgroups and in CKD/non-CKD patients. The mean values of logarithmically transformed MMP-10 were compared among the vitD3 categories using one-way analysis of variance (ANOVA), and post-hoc tests with the Bonferroni correction. For the comparison of median TIMP-1 and 25(OH)D3 values across vitD3 categories, the Kruskal–Wallis test was used. Then, a multivariate regression model was fitted using the bootstrapping procedure to address non-normal data distribution. 25(OH)D3 serum levels were first considered as a continuous and then as a categorical variable. The stepwise forward selection method was used to select covariates out of all the collected variables without missing values. The significance level was 0.05 for addition to the model and 0.2 for removal from the model. The final model was adjusted for the eGFR and BF% (variables identified by the stepwise analysis) and the smoking status and vitD supplementation (variables known to affect 25(OH)D3 values [10,20]). Two-tailed p-values < 0.05 were considered statistically significant. STATA 12.0 software was used for statistical analyses.
3. Results
Detailed characteristics of the patients stratified by the vitD3 status are given in Table 1. Overall, the majority of subjects in our study were male, except for the normal vitD3 status group, which had an equal proportion of men and women. The majority of participants had a relatively long-standing T2D, were non-smokers, overweight and suffered from hypertension. When compared with other groups, vitD3-deficient subjects showed a higher prevalence of hypertension and CKD and, consequently, tended to have higher serum creatinine and cystatin values and lower eGFR. In regard with medications, more vitD3-deficient subjects used RAAS inhibitors, compared to other groups. Finally, vitD3 supplementation was less prevalent and paricalcitol use was more prevalent among the vitD3-deficient subjects, although only a minority of patients were taking paricalcitol.

Table 1.
Description of the patients’ characteristics according to the vitD3 status.
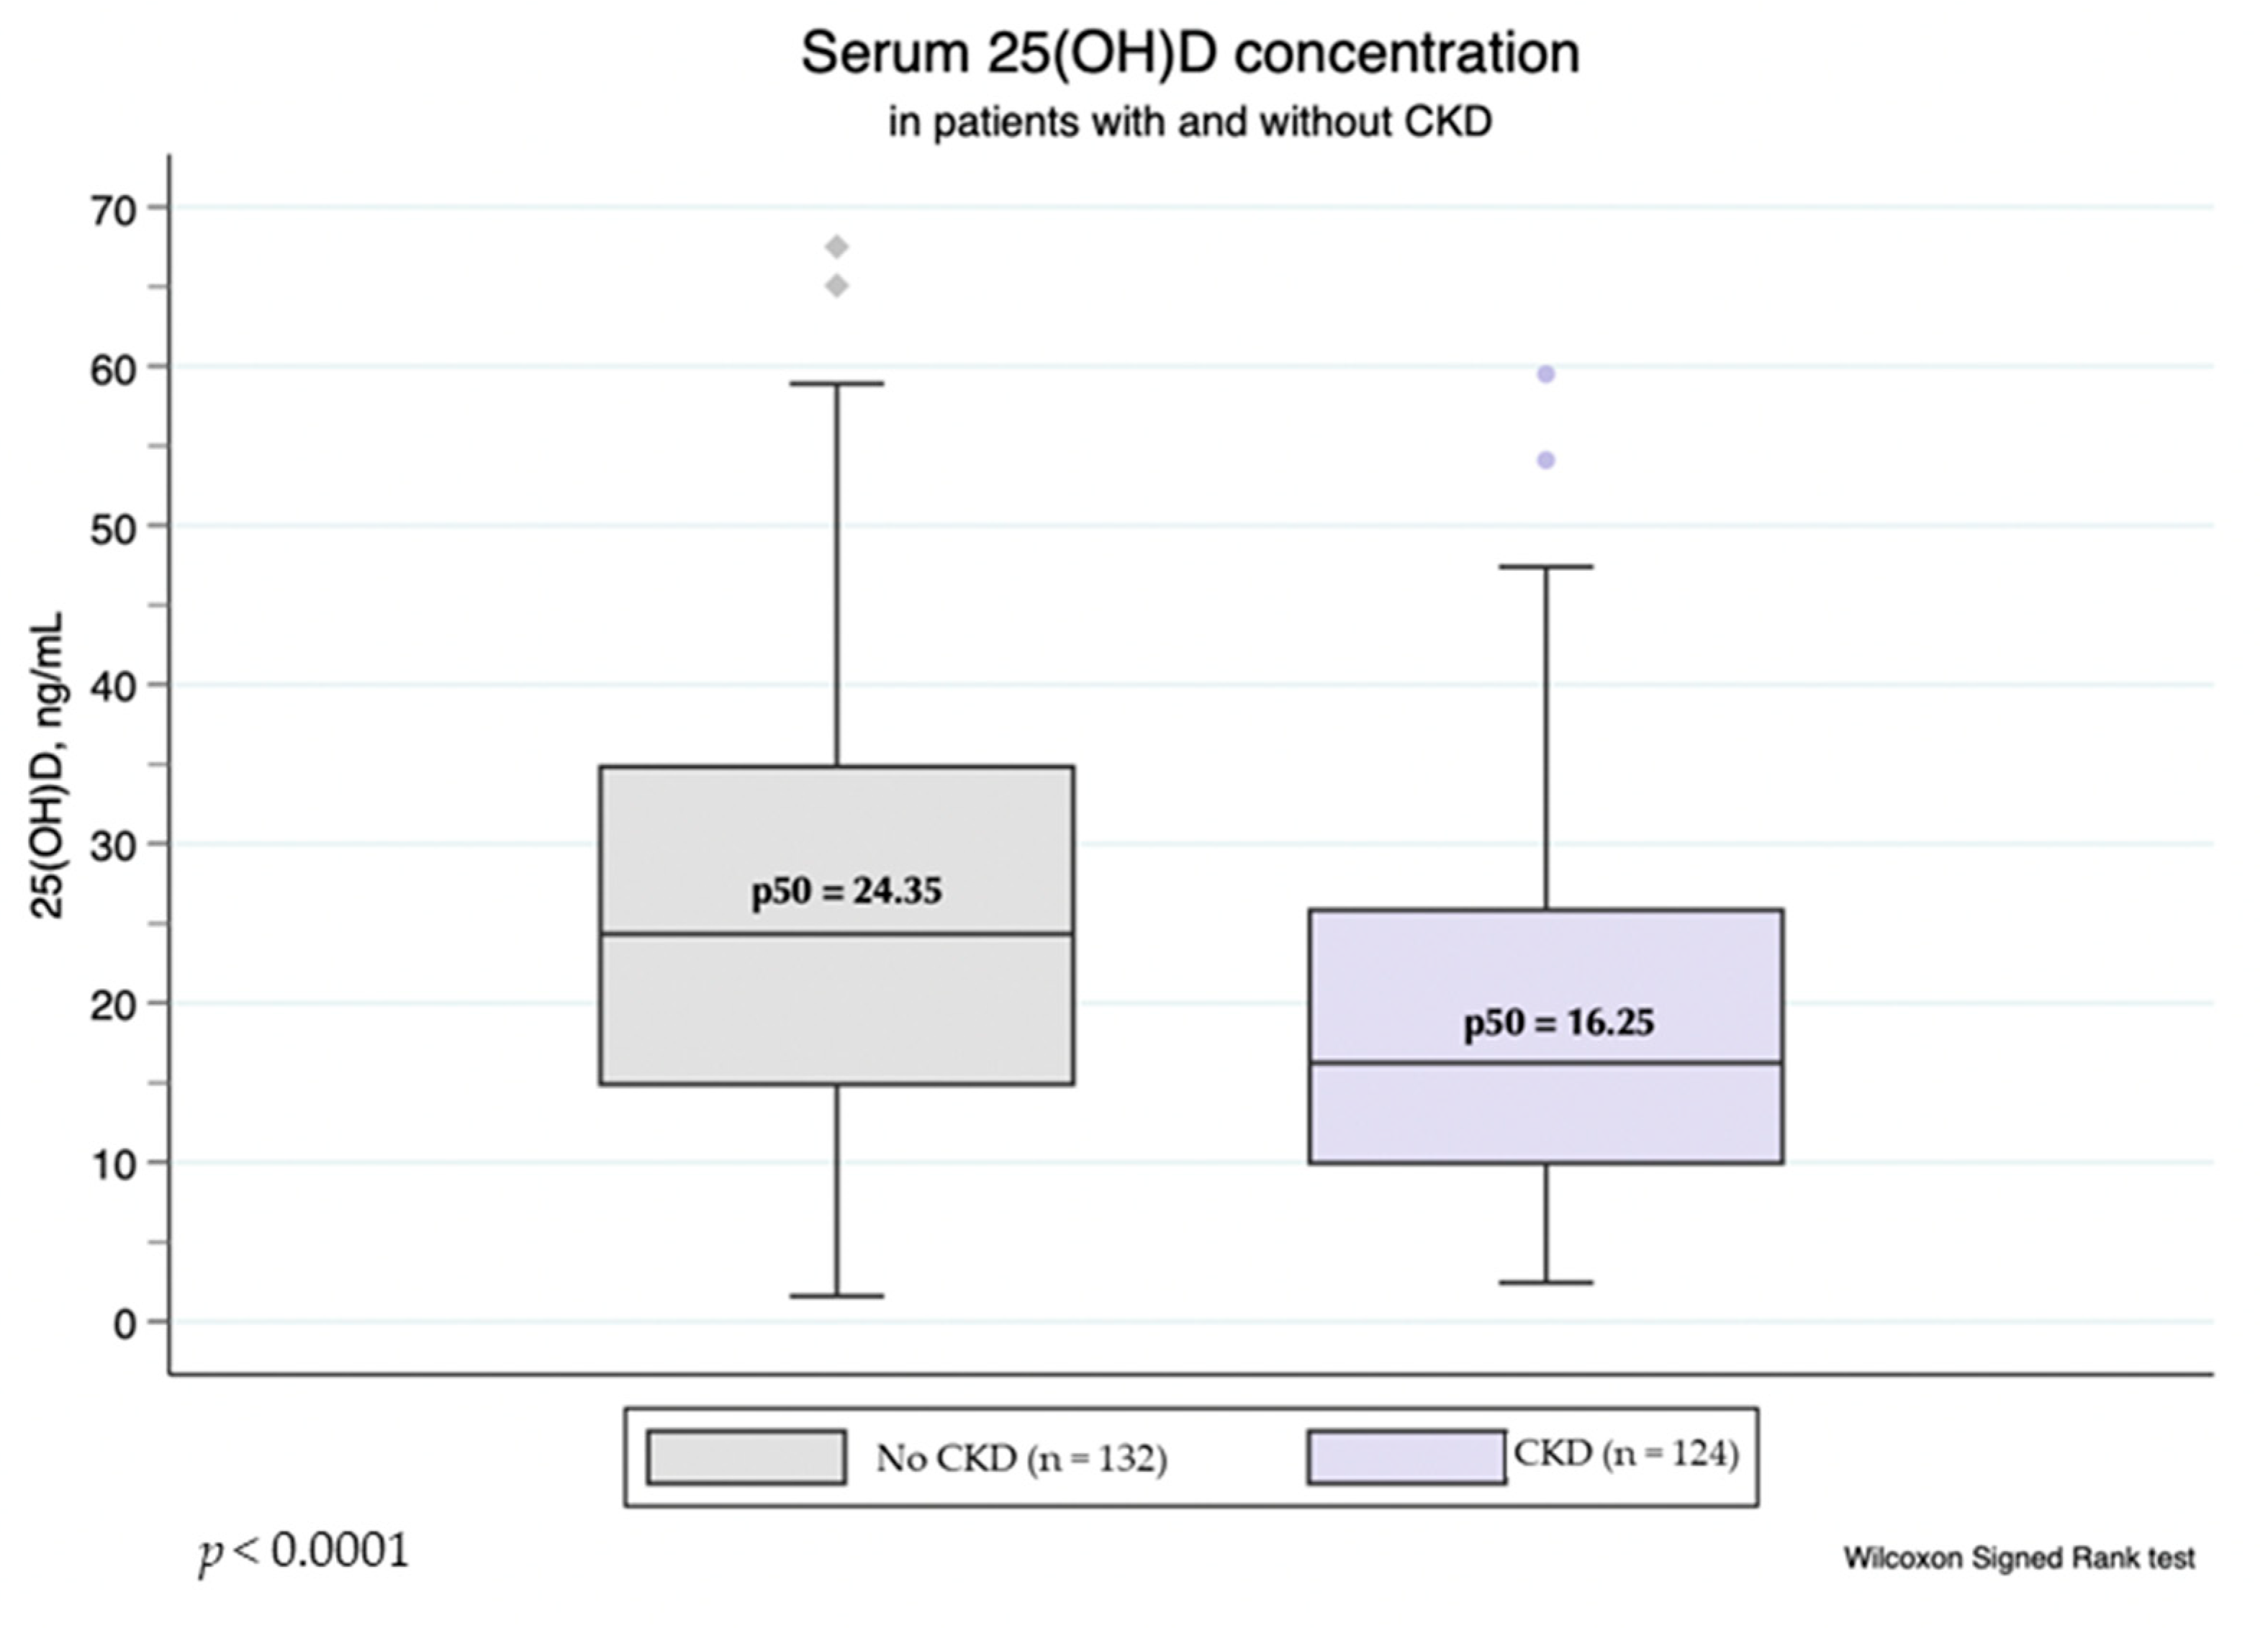
Overall, the prevalence of vitD3 deficiency (25(OH)D3 < 20 ng/mL) and vitD3 insufficiency (25(OH)D3 within 20–30 ng/mL) in our cohort was 50 and 25% respectively. The proportion of subjects with vitD3 deficit was significantly higher among patients with CKD, compared to the non-CKD group (61 vs. 40%, p = 0.001; Fisher exact test), and the median 25(OH)D3 was significantly higher in the non-CKD group (Figure 1). However, there was no difference between 25(OH)D3 levels in patients with different BMI or BF%. The proportion of subjects with vitD3 deficit was also similar among patients with and without obesity (p = 0.314 for BMI ≥ 30 kg/m2 vs. BMI < 30 kg/m2; p = 0.300 for BF% indicating obesity vs. lean/overweight subjects; Fisher’s exact test). There was no significant difference between median 25(OH)D3 values in samples obtained in winter (November to February) and those obtained in summer (p = 0.210; Wilcoxon rank-sum test).
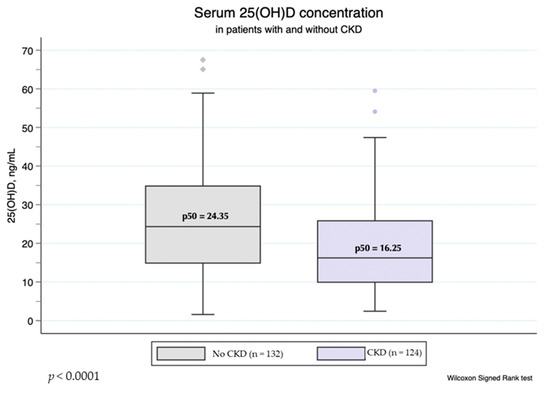
Figure 1.
Serum 25(OH)D3 levels in patients with and without CKD.
Table 2 shows the median values and interquartile ranges of 25(OH)D3, MMP-10 and TIMP-1 in the whole sample and subgroups. MMP-10 levels were significantly different between subgroups, however, when the Bonferroni test for multiple comparison was conducted, only the vitD3-deficient subgroup showed a significant difference from both normal (p = 0.044) and insufficiency (p = 0.001) subgroups, while there was no difference in MMP-10 levels between normal and insufficiency subgroups (p = 0.808). TIMP-1 levels also significantly differed between subgroups, showing a progressive increase in subjects with an insufficiency or deficit of vitD3.
Table 2.
Comparison of the median serum 25(OH)D3, MMP-10 and TIMP-1 levels among the vitD3 status subgroups.
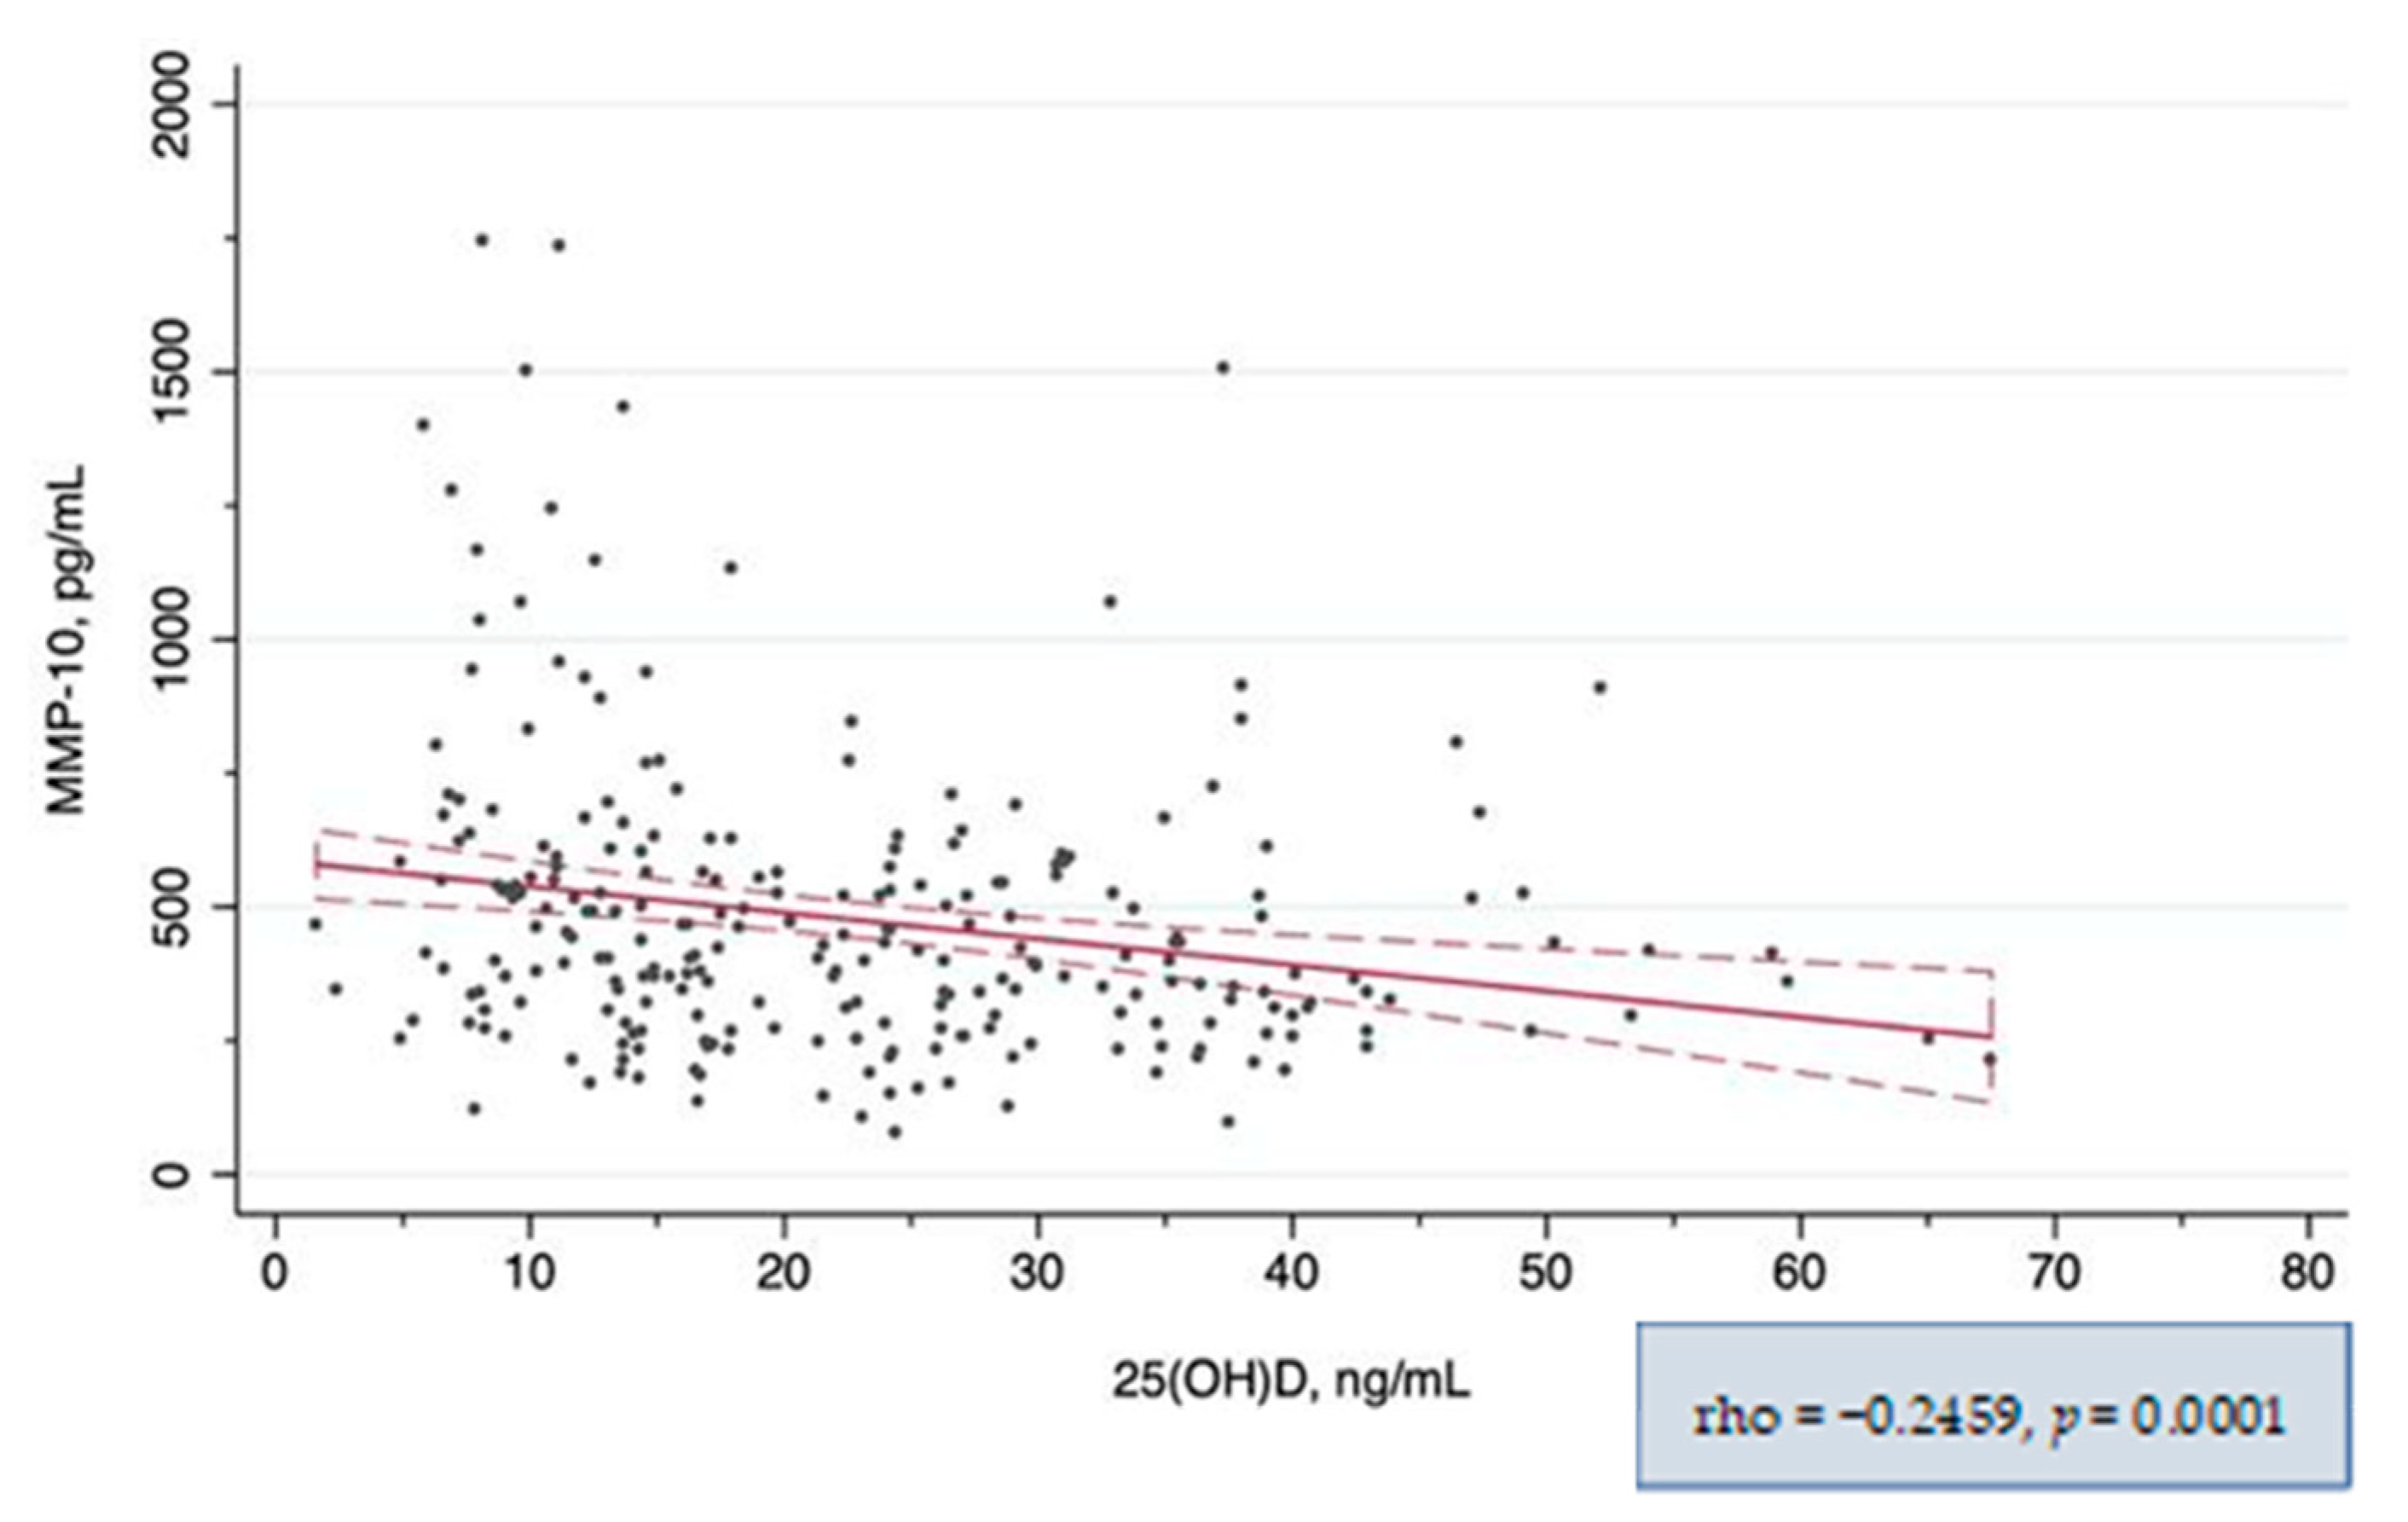
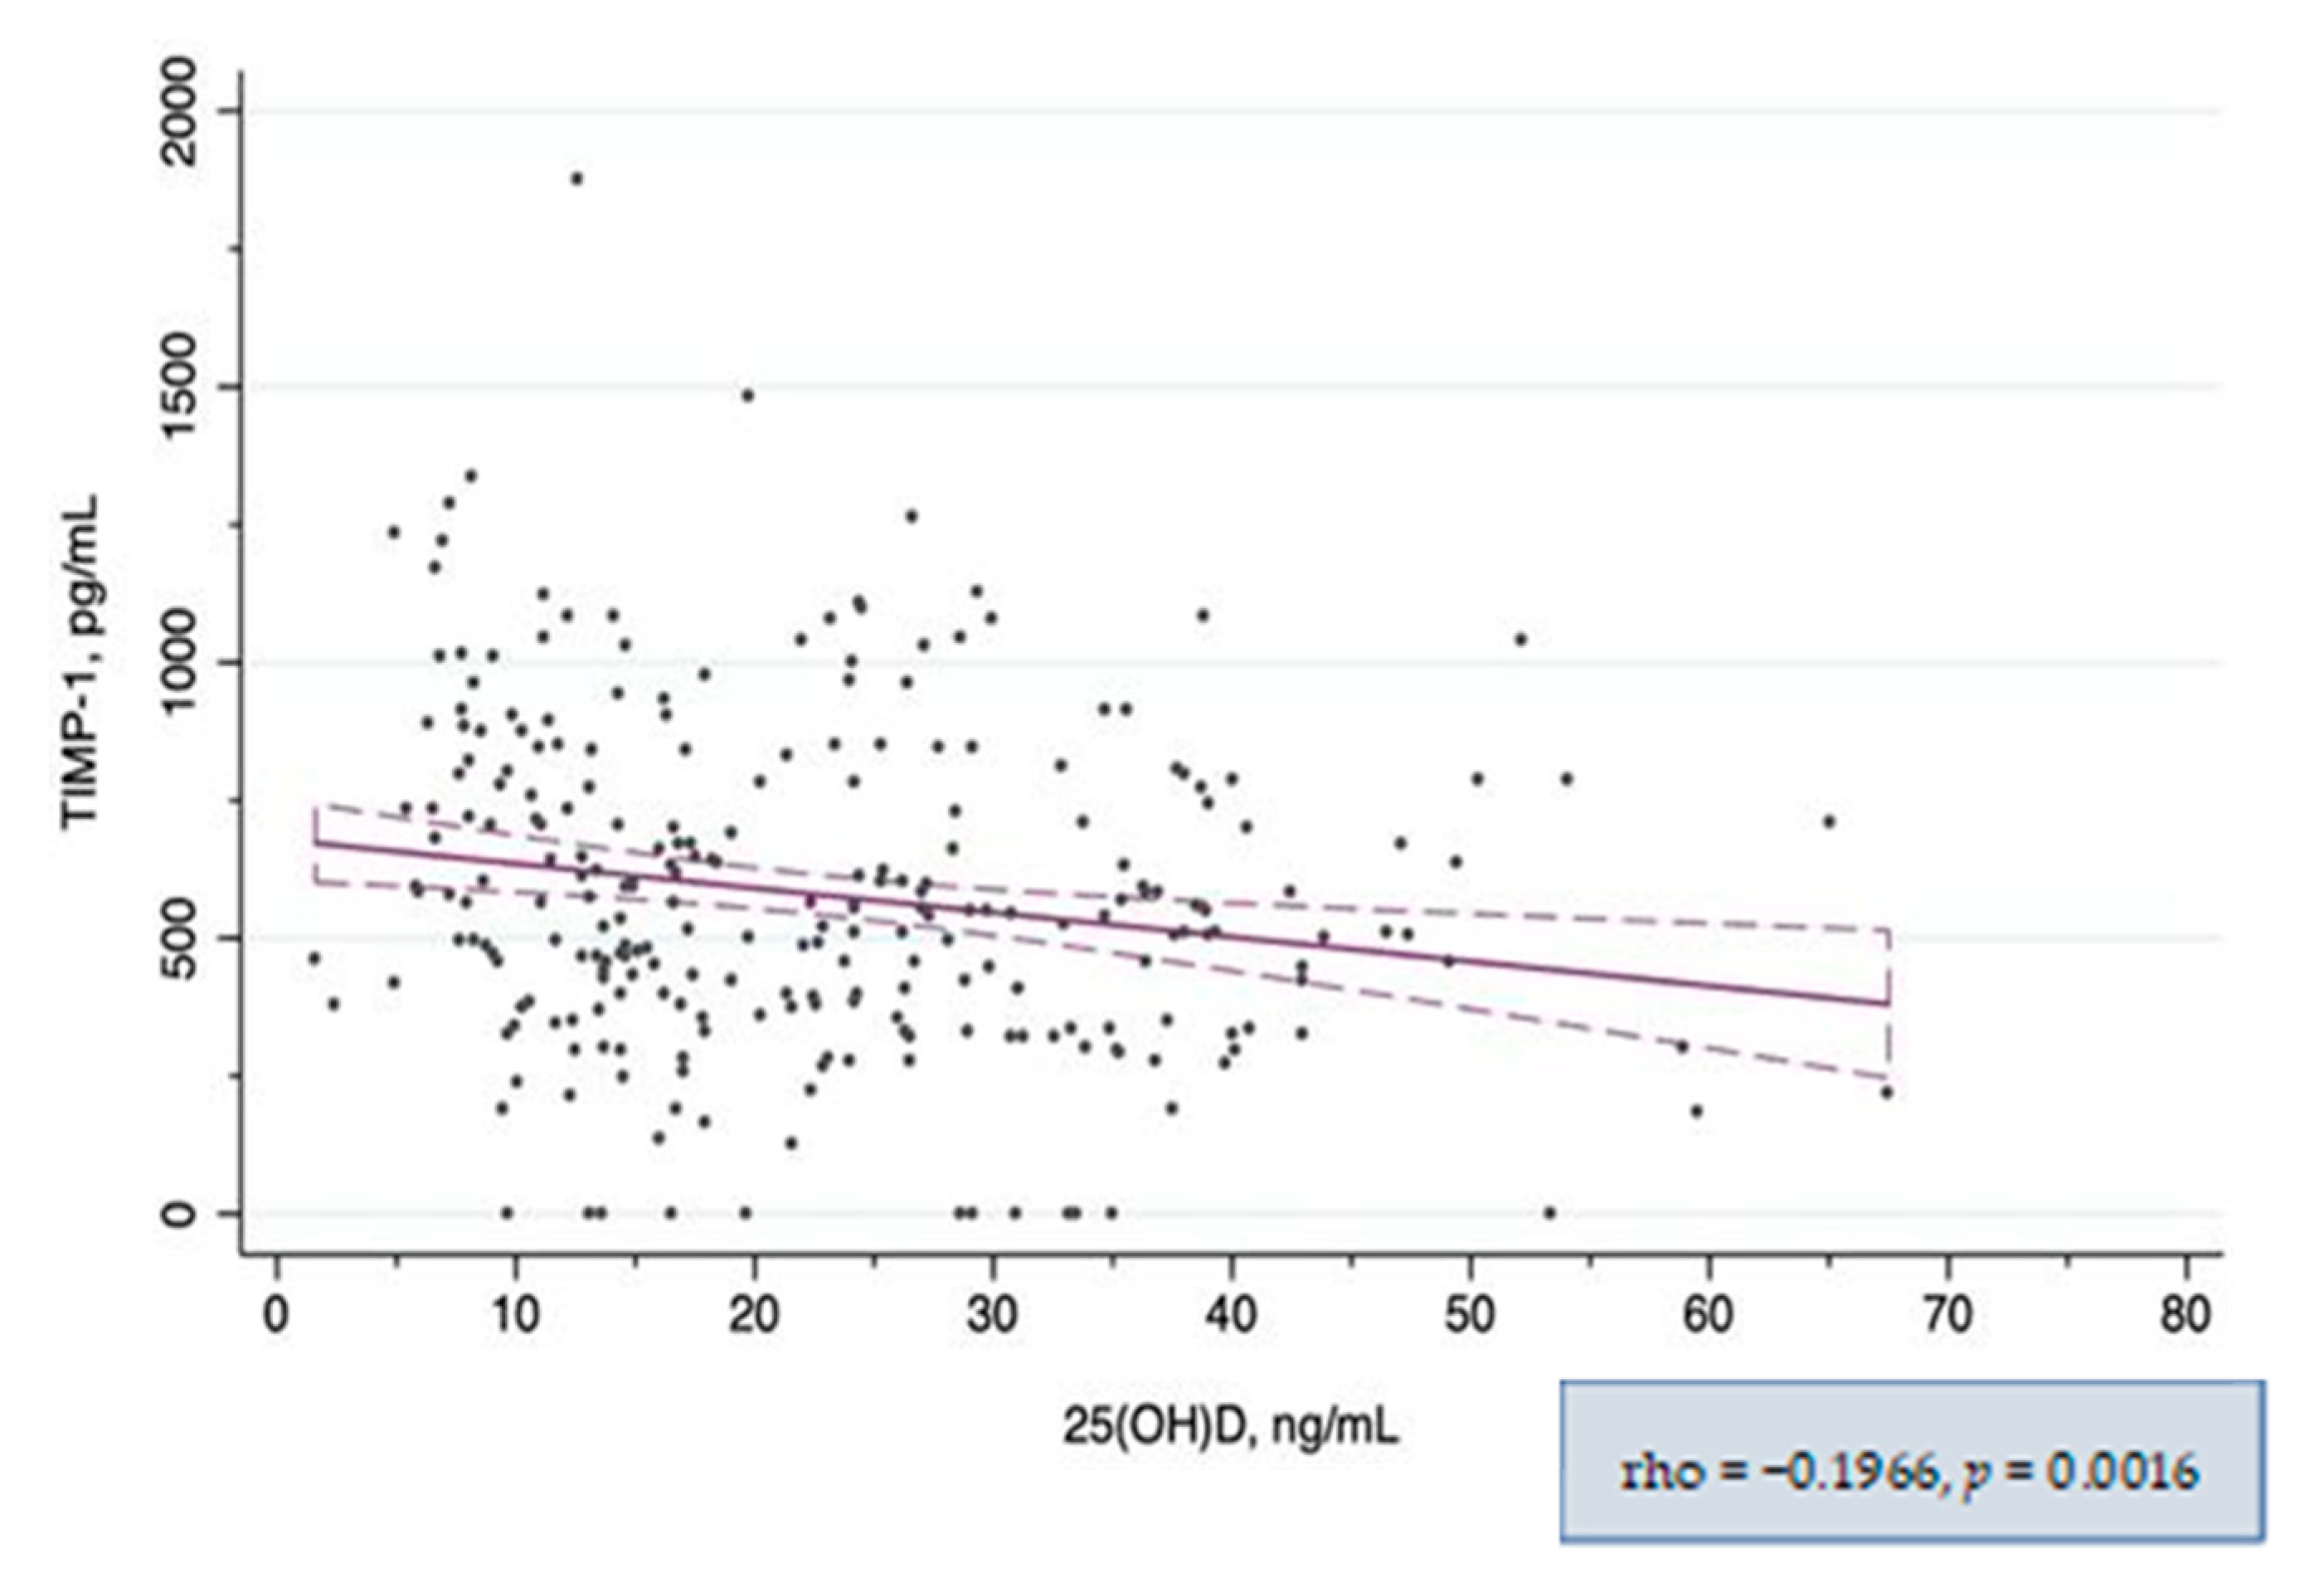
In the global correlation analysis, both MMP-10 and TIMP-1 showed a significant negative correlation with 25(OH)D3 levels (Figure 2 and Figure 3 respectively). When the correlation between MMP-10 and 25(OH)D3 was analyzed separately in patients with and without CKD, it remained significant only in the CKD subgroup. In the subgroup analysis by vitD3 categories, the correlation was significant only in the vitD3-deficiency subgroup (Table 3). However, when we explored higher 25(OH)D3 serum level cut-offs, corresponding to the 75th and 95th percentiles, we found a strong correlation between MMP-10 and 25(OH)D3 levels in patients with 25(OH)D3 levels >45 ng/mL and a moderate correlation in those with 25(OH)D3 levels within 30–45 ng/mL (Supplementary Table S1 and Supplementary Figure S1). TIMP-1 showed only a weak correlation with 25(OH)D3 globally, in patients with CKD and in those with avitD3 deficit, and remained similar applying different 25(OH)D3 cut-offs (Table 4). There was also a positive correlation between MMP-10 and TIMP-1 circulating levels (rho = 0.25, p < 0.001). The statistically significant results of the correlation analysis between other variables and 25(OH)D3 and MMP-10 levels are given in the Supplementary Table S2.
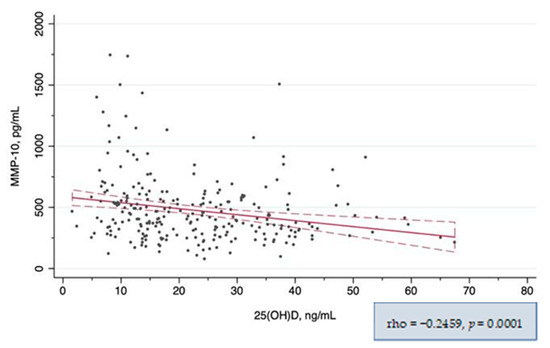
Figure 2.
Correlation between serum MMP-10 and 25(OH)D3 levels.

Figure 3.
Correlation between serum TIMP-1 and 25(OH)D3 levels.
Table 3.
Correlation between circulating MMP-10 and 25(OH)D3 levels.
Table 4.
Correlation between circulating TIMP-1 and 25(OH)D3 levels.
In the linear regression model, the 25(OH)D3 level used as a continuous variable was inversely associated with MMP-10 (beta-coefficient [95%CI] = −4.9 [−7.6; −2.2]); however, this association was no longer significant after adjusting for the eGFR (beta-coefficient [95%CI] = −2.2 [−4.4; 0.1]). Using the 20 ng/mL cut-off, we found a negative association between MMP-10 levels and vitD3 deficiency which remained significant after adjustment for the eGFR, body adiposity, smoking status and vitD supplementation. In the fully adjusted model, 25(OH)D3 level >20 ng/mL was associated with a 68.7 pg/mL reduction in the circulating MMP-10 concentration (Table 5). Using alternative cut-offs (30 ng/mL, 45 ng/mL), we did not observe any significant association between MMP-10 and 25(OH)D3 levels after adjusting for the eGFR.
Table 5.
Association between serum MMP-10 and 25(OH)D3 level.
4. Discussion
Our results suggest that circulating MMP-10 and TIMP-1 levels are inversely correlated with serum 25(OH)D3 levels in patients with T2D, particularly in those with a vitD3 deficiency and in those affected by CKD. Furthermore, 25(OH)D3 levels below 20 ng/mL are associated with higher circulating MMP-10 concentrations, independently of the eGFR.
The high prevalence of vitD3 deficiency and low median serum values of the 25(OH)D3 in our cohort are consistent with other studies of patients with diabetes [12,21]. We also found that 25(OH)D3 serum levels in our cohort were significantly lower in patients with CKD when compared to those without CKD. Although the 1,25(OH)2D deficiency in patients with kidney disease is biologically plausible, the deficit of 25(OH)D3 in this group of patients is less consistently reported. In the OSERCE study, which included CKD patients not undergoing dialysis, there was no correlation between 25(OH)D3 levels and kidney function, while a strong correlation was observed for calcitriol [22]. In contrast, another study reported that the progressive decline in 25(OH)D3 levels correlated with the eGFR decrease [23]. However, the former study excluded patients with nephrotic proteinuria, and included patients receiving vitD3 supplements, which could account for the lack of association between CKD stage and 25(OH)D3 concentration. The lower levels of the 25(OH)D3 can be explained by the loss of 25(OH)D3 bound to the vitamin D-binding protein in patients with nephrotic proteinuria, impaired ultraviolet B-dependent cutaneous synthesis of cholecalciferol and reduced hepatic 25(OH)D3 production due to uremia, dietary restrictions and less solar exposure in patients with CKD [24]. In our study, only 15% of patients had a UACR ≥ 300 and the median eGFR was relatively high. However, we did not collect information about solar exposure and diet in our patients.
This is the first study to show an association between the vitD3 status and MMP-10 circulating levels in humans. Elevated MMP-10 levels are found in various chronic inflammatory conditions and might play a particularly important role in diabetes as an early marker of developing microvascular complications (7,8). VitD3 is a known RAAS inhibitor [4] and in a mouse model of DKD; the pathological MMP-10 increase was blocked by an Ang-II receptor antagonist [8]. Furthermore, vitD3 has been shown to directly inhibit the cellular pathways involved in the activation of the MMPs transcription. Bahar-Shany et al. demonstrated that the inhibition of NF-kB cascade and Jun N-terminal kinase was responsible for the attenuation of the TNF-α-induced MMP-9 expression by calcitriol in a human keratinocyte culture [25]. Another study showed that pre-treatment of leukocytes infected with M. tuberculosis with calcitriol reduced both constitutive and induced MMP-10 expression, and reported a stimulation of prostaglandin E2 and interleukin-10 secretion by vitD3, both of which are known to suppress MMPs’ expression, elucidating yet another possible mechanism of vitD3-mediated MMPs’ inhibition [26]. In addition, calcitriol has been shown to inhibit the EGFR signaling pathway and reduce ADAM17 expression [4]. However, it has not been studied if the same mechanisms are involved in other MMPs’ regulation.
At the same time, the evidence regarding the association of vitD3 and MMPs in humans is scarce. A small study of African-American patients on hemodialysis found an inverse correlation between MMP-9 and 25(OH)D3 serum levels (r = −0.29), but not between MMP-2 and 25(OH)D3 levels. MMP-9 concentration was also significantly higher in patients with 25(OH)D3 < 15 ng/mL [27]. An interventional study of vitD3 supplementation in healthy adults reported a 68% reduction in MMP-9 and a 38% reduction in TIMP-1 levels following one year of vitD3 supplementation, however, only subjects with very low baseline 25(OH)D3 (<12 ng/mL) were included. Noteworthy, authors also studied the association between the vitamin D receptor (VDR) genotype and MMP-9 and TIMP-1 levels and showed that a specific allele of VDR gene was an independent predictor of TIMP-1 levels [28]. In contrast with these findings, a pilot study of the effect of 16-week vitD3 supplementation (50,000 UI per week) in subjects with metabolic syndrome showed no difference in serum MMP-2, MMP-9 and TIMP-1 concentrations between the intervention and placebo groups, although there was a significant reduction in the MMP-9 and TIMP-1 levels when compared to the baseline in the intervention group [29]. Although the aforementioned works point out that MMPs levels, and, therefore, vascular risk, increase particularly below the 12–15 ng/mL threshold in serum 25(OH)D3 concentration, we were able to observe this association at the 25(OH)D3 levels < 20 ng/mL. On the other hand, we showed that the strongest correlation between serum MMP-10 and 25(OH)D3 concentrations was observed at 25(OH)D3 levels > 45 ng/mL. Although this group of patients was rather small in our sample, it might indicate that higher 25(OH)D3 levels should be achieved in patients with diabetes to prevent vascular complications. In consistency with this assumption, a cross-sectional study of post-menopausal Spanish women showed no difference in glucose metabolism biomarkers between those with 25(OH)D3 > 30 ng/mL and those below this cut-off; however, in the group with 25(OH)D3 > 45 ng/mL there was a significant increase in insulin sensitivity and a decrease in basal insulin levels [30].
This study has several limitations. Firstly, due to the cross-sectional design, no causal inferences should be made. Secondly, although we restricted our study population to patients without any active inflammatory, autoimmune or malignant process, who were not taking immunosuppressants or steroids, and adjusted the regression model for some of the potential confounders, the residual confounding cannot be excluded. Thirdly, despite the relatively large sample size, our study might be underpowered to detect interactions between MMP-10 and 25(OH)D3 levels and CKD stage or eGFR, because the number of patients with moderate to severe CKD in our sample was low.
To conclude, we found that serum 25(OH)D3 concentration was significantly inversely associated with MMP-10 and TIMP-1 levels in patients with diabetes. VitD3 repletion status showed to be an independent predictor of serum MMP-10 values. These results suggest that high values of 25(OH)D3 should be targeted in patients with diabetes in order to decrease the risk of vascular complications. The efficacy of vitD3 supplementation in reducing circulating MMP-10 levels should be further examined in larger prospective studies.
Supplementary Materials
The following supporting information can be downloaded at: https://www.mdpi.com/article/10.3390/nu14173484/s1, Table S1: Correlation between circulating MMP-10 and 25(OH)D3 levels using alternative cut-offs; Table S2: Correlation between serum 25(OH)D3 and MMP-10 levels and other variables; Figure S1: Correlation between MMP-10 and 25(OH)D3 stratified by 25(OH)D3 circulating level.
Author Contributions
D.A.: investigation, statistical analysis, original manuscript preparation and visualization; M.M.D.-N.: statistical analysis; M.A.F.-S. and J.O.: investigation and project supervision; F.J.E.: project supervision; J.M.M.-G.: conceptualization and investigation; N.G.-F.: conceptualization, methodology, funding acquisition and project supervision. All authors have read and agreed to the published version of the manuscript.
Funding
This work has been funded by the Integrated in the State Plan of R + D + I 2016–2018 and co-funded by Instituto de Salud Carlos III (ISCIII), Fondo de Investigaciones Sanitarias [PI 15/02111] and the European Regional Development Fund (FEDER), as well as by Plan de Investigación Universidad de Navarra (PIUNA) [2014-5]. The study sponsor was not involved in the design of the study; the collection, analysis, and interpretation of data; writing the report; or the decision to submit the report for publication.
Institutional Review Board Statement
The human study was conducted in accordance with the Declaration of Helsinki, and approved by the Institutional Review Board of University of Navarra Research Ethics Committee (protocol code: “2021.183 TFG” and date of approval: 12 November 2021).
Informed Consent Statement
Informed consent was obtained from all subjects involved in the study.
Data Availability Statement
Data is available on request.
Acknowledgments
We particularly acknowledge the patient and, the Biobank of the University of Navarra for their collaboration.
Conflicts of Interest
The authors declare no conflict to interest.
References
- Cui, N.; Hu, M.; Khalil, R.A. Biochemical and Biological Attributes of Matrix Metalloproteinases. Prog. Mol. Biol. Transl. Sci. 2017, 147, 1–73. [Google Scholar] [PubMed]
- Garcia-Fernandez, N.; Jacobs-Cachá, C.; Mora-Gutiérrez, J.M.; Vergara, A.; Orbe, J.; Soler, M.J. Matrix Metalloproteinases in Diabetic Kidney Disease. J. Clin. Med. 2020, 9, 472. [Google Scholar] [CrossRef] [PubMed]
- Xu, X.; Xiao, L.; Xiao, P.; Yang, S.; Chen, G.; Liu, F.; Kanwar, Y.S.; Sun, L. A Glimpse of Matrix Metalloproteinases in Diabetic Nephropathy. Curr. Med. Chem. 2014, 21, 3244–3260. [Google Scholar] [CrossRef]
- Wozniak, J.; Floege, J.; Ostendorf, T.; Ludwig, A. Key metalloproteinase-mediated pathways in the kidney. Nat. Rev. Nephrol. 2021, 17, 513–527. [Google Scholar] [CrossRef] [PubMed]
- Bäck, M.; Ketelhuth, D.F.J.; Agewall, S. Matrix Metalloproteinases in Atherothrombosis. Prog. Cardiovasc. Dis. 2010, 52, 410–428. [Google Scholar] [CrossRef] [PubMed]
- Coll, B.; Rodríguez, J.A.; Craver, L.; Orbe, J.; Martínez-Alonso, M.; Ortiz, A.; Díez, J.; Beloqui, O.; Borras, M.; Valdivielso, J.M.; et al. Serum levels of matrix metalloproteinase-10 are associated with the severity of atherosclerosis in patients with chronic kidney disease. Kidney Int. 2010, 78, 1275–1280. [Google Scholar] [CrossRef]
- Toni, M.; Hermida, J.; Goñi, M.J.; Fernández, P.; Parks, W.C.; Toledo, E.; Montes, R.; Díez, N. Matrix metalloproteinase-10 plays an active role in microvascular complications in type 1 diabetic patients. Diabetologia 2013, 56, 2743–2752. [Google Scholar] [CrossRef]
- Mora-Gutiérrez, J.M.; Rodríguez, J.A.; Fernández-Seara, M.A.; Orbe, J.; Escalada, F.J.; Soler, M.J.; Slon Roblero, M.F.; Riera, M.; Páramo, J.A.; Garcia-Fernandez, N. MMP-10 is Increased in Early Stage Diabetic Kidney Disease and can be Reduced by Renin-Angiotensin System Blockade. Sci. Rep. 2020, 10, 26. [Google Scholar] [CrossRef]
- Holick, M.F.; Binkley, N.C.; Bischoff-Ferrari, H.A.; Gordon, C.M.; Hanley, D.A.; Heaney, R.P.; Murad, M.H.; Weaver, C.M. Evaluation, treatment, and prevention of vitamin D deficiency: An endocrine society clinical practice guideline. J. Clin. Endocrinol. Metab. 2011, 96, 1911–1930. [Google Scholar] [CrossRef]
- Sempos, C.T.; Heijboer, A.C.; Bikle, D.D.; Bollerslev, J.; Bouillon, R.; Brannon, P.M.; DeLuca, H.F.; Jones, G.; Munns, C.F.; Bilezikian, J.P.; et al. Vitamin D assays and the definition of hypovitaminosis D: Results from the First International Conference on Controversies in Vitamin D. Br. J. Clin. Pharmacol. 2018, 84, 2194–2207. [Google Scholar] [CrossRef]
- Bouillon, R.; Marcocci, C.; Carmeliet, G.; Bikle, D.; White, J.H.; Dawson-Hughes, B.; Lips, P.; Munns, C.F.; Lazaretti-Castro, M.; Giustina, A.; et al. Skeletal and Extraskeletal Actions of Vitamin D: Current Evidence and Outstanding Questions. Endocr. Rev. 2019, 40, 1109–1151. [Google Scholar] [CrossRef] [PubMed]
- Ahmadieh, H.; Azar, S.T.; Lakkis, N.; Arabi, A. Hypovitaminosis D in Patients with Type 2 Diabetes Mellitus: A Relation to Disease Control and Complications. ISRN Endocrinol. 2013, 2013, 641098. [Google Scholar] [CrossRef] [PubMed]
- Tabesh, M.; Azadbakht, L.; Faghihimani, E.; Tabesh, M.; Esmaillzadeh, A. Calcium-vitamin D cosupplementation influences circulating inflammatory biomarkers and adipocytokines in vitamin D-insufficient diabetics: A randomized controlled clinical trial. J. Clin. Endocrinol. Metab. 2014, 99, E2485–E2493. [Google Scholar] [CrossRef]
- Zhou, C.; Lu, F.; Cao, K.; Xu, D.; Goltzman, D.; Miao, D. Calcium-independent and 1,25(OH)2D3-dependent regulation of the renin-angiotensin system in 1α-hydroxylase knockout mice. Kidney Int. 2008, 74, 170–179. [Google Scholar] [CrossRef] [PubMed]
- Inker, L.A.; Eneanya, N.D.; Coresh, J.; Tighiouart, H.; Wang, D.; Sang, Y.; Crews, D.C.; Doria, A.; Estrella, M.M.; Froissart, M.; et al. New Creatinine- and Cystatin C–Based Equations to Estimate GFR without Race. N. Engl. J. Med. 2021, 385, 1737–1749. [Google Scholar] [CrossRef] [PubMed]
- Gómez-Ambrosi, J.; Silva, C.; Galofré, J.C.; Escalada, J.; Santos, S.; Millán, D.; Vila, N.; Ibañez, P.; Gil, M.J.; Valentí, V.; et al. Body mass index classification misses subjects with increased cardiometabolic risk factors related to elevated adiposity. Int. J. Obes. 2012, 36, 286–294. [Google Scholar] [CrossRef]
- Gómez-Ambrosi, J.; Silva, C.; Catalán, V.; Rodríguez, A.; Galofré, J.C.; Escalada, J.; Valentí, V.; Rotellar, F.; Romero, S.; Ramírez, B.; et al. Clinical usefulness of a new equation for estimating body fat. Diabetes Care. 2012, 35, 383–388. [Google Scholar] [CrossRef]
- Varsavsky, M.; Moreno, P.R.; Fernández, A.B.; Fernández, I.L.; Gómez, J.M.Q.; Rubio, V.Á.; Martín, A.G.; Berdonces, M.C.; Cortés, S.N.; Muñoz, M.R.; et al. Recommended vitamin D levels in the general population. Endocrinol. Diabetes Nutr. 2017, 64, 7–14. [Google Scholar] [CrossRef]
- Giustina, A.; Bouillon, R.; Binkley, N.; Sempos, C.; Adler, R.A.; Bollerslev, J.; Dawson-Hughes, B.; Ebeling, P.R.; Feldman, D.; Heijboer, A.; et al. Controversies in Vitamin D: A Statement from the Third International Conference. JBMR Plus 2020, 4, 1–13. [Google Scholar] [CrossRef]
- Jiang, C.Q.; Chan, Y.H.; Xu, L.; Jin, Y.L.; Zhu, T.; Zhang, W.S.; Cheng, K.K.; Lam, T.H. Smoking and serum Vitamin D in older Chinese people: Cross-sectional analysis based on the Guangzhou Biobank Cohort Study. BMJ Open 2016, 6, 6–10. [Google Scholar] [CrossRef] [Green Version]
- Serra-Planas, E.; Aguilera, E.; Granada, M.L.; Soldevila, B.; Salinas, I.; Reverter, J.L.; Pizarro, E.; Pellitero, S.; Alonso, N.; Mauricio, D.; et al. High prevalence of vitamin D deficiency and lack of association with subclinical atherosclerosis in asymptomatic patients with Type 1 Diabetes Mellitus from a Mediterranean area. Acta Diabetol. 2015, 52, 773–779. [Google Scholar] [CrossRef] [PubMed]
- Górriz, J.L.; Molina, P.; Bover, J.; Barril, G.; Martín-de Francisco, Á.L.; Caravaca, F.; Hervás, J.; Piñera, C.; Escudero, V.; Molinero, L.M. Characteristics of bone mineral metabolism in patients with stage 3-5 chronic kidney disease not on dialysis: Results of the OSERCE study. Nefrologia 2013, 33, 46–60. [Google Scholar] [PubMed]
- Restrepo Valencia, C.A.; Aguirre Arango, J.V. Vitamin D (25(OH)D) in patients with chronic kidney disease stages 2-5 [published correction appears in Colomb Med (Cali). 2019 Mar 30;50(1):49]. Colomb. Med. 2016, 47, 160–166. [Google Scholar] [CrossRef]
- Martin, K.J.; Floege, J.; Ketteler, M. Bone and Mineral Metabolism in Chronic Kidney Disease. In Comprehensive Clinical Nephrology, 4th ed.; Floege, J., Johnson, R.J., Feehally, J., Eds.; Elsevier Inc.: Amsterdam, The Netherlands, 2010; pp. 969–984. [Google Scholar]
- Bahar-Shany, K.; Ravid, A.; Koren, R. Upregulation of MMP-9 production by TNFα in keratinocytes and its attenuation by vitamin D. J. Cell. Physiol. 2010, 222, 729–737. [Google Scholar] [PubMed]
- Coussens, A.; Timms, P.M.; Boucher, B.J.; Venton, T.R.; Ashcroft, A.T.; Skolimowska, K.H.; Newton, S.M.; Wilkinson, K.A.; Davidson, R.N.; Griffiths, C.J.; et al. 1α,25-dihydroxyvitamin D3 inhibits matrix metalloproteinases induced by Mycobacterium tuberculosis infection. Immunology 2009, 127, 539–548. [Google Scholar] [CrossRef]
- Wasse, H.; Cardarelli, F.; De Staercke, C.; Hooper, C.; Veledar, E.; Guessous, I. 25-hydroxyvitamin D concentration is inversely associated with serum MMP-9 in a cross-sectional study of African American ESRD patients. BMC Nephrol. 2011, 12, 24. [Google Scholar] [CrossRef]
- Timms, P.M.; Mannan, N.; Hitman, G.A.; Noonan, K.; Mills, P.G.; Syndercombe-Court, D.; Aganna, E.; Price, C.P.; Boucher, B.J. Circulating MMP9, vitamin D and variation in the TIMP-1 response with VDR genotype: Mechanisms for inflammatory damage in chronic disorders? QJM 2002, 95, 787–796. [Google Scholar] [CrossRef]
- Ghezel, A.; Salekzamani, S.; Mehralizadeh, H.; Jafarabadi, M.A.; Gargari, B.P. Vitamin D supplementation has no effect on matrix metalloproteinases-2, -9, and tissue inhibitor matrix metalloproteinase-1 in subjects with metabolic syndrome: A pilot study. Int. J. Vitam. Nutr. Res. 2019, 89, 227–237. [Google Scholar] [CrossRef]
- Ávila-Rubio, V.; García-Fontana, B.; Novo-Rodríguez, C.; Cantero-Hinojosa, J.; Reyes-García, R.; Muñoz-Torres, M. Higher Levels of Serum 25-Hydroxyvitamin D Are Related to Improved Glucose Homeostasis in Women with Postmenopausal Osteoporosis. J. Women’s Health 2018, 27, 1007–1015. [Google Scholar] [CrossRef]
Publisher’s Note: MDPI stays neutral with regard to jurisdictional claims in published maps and institutional affiliations. |
© 2022 by the authors. Licensee MDPI, Basel, Switzerland. This article is an open access article distributed under the terms and conditions of the Creative Commons Attribution (CC BY) license (https://creativecommons.org/licenses/by/4.0/).