
Using Household Expenditure Surveys for Comparable and Replicable Nutritional Analysis: Evidence from México

 ,
,
Abstract
:1. Introduction
2. Materials and Methods
2.1. Identification of Relevant Food Categories
2.2. Pairing of Food Contents to Each Category in the HEIS Data
2.3. Calculation of the Typical Amount of Nutrients by Food Category
3. Results
4. Discussion
Supplementary Materials
Author Contributions
Funding
Institutional Review Board Statement
Informed Consent Statement
Data Availability Statement
Conflicts of Interest
Appendix A
Appendix B

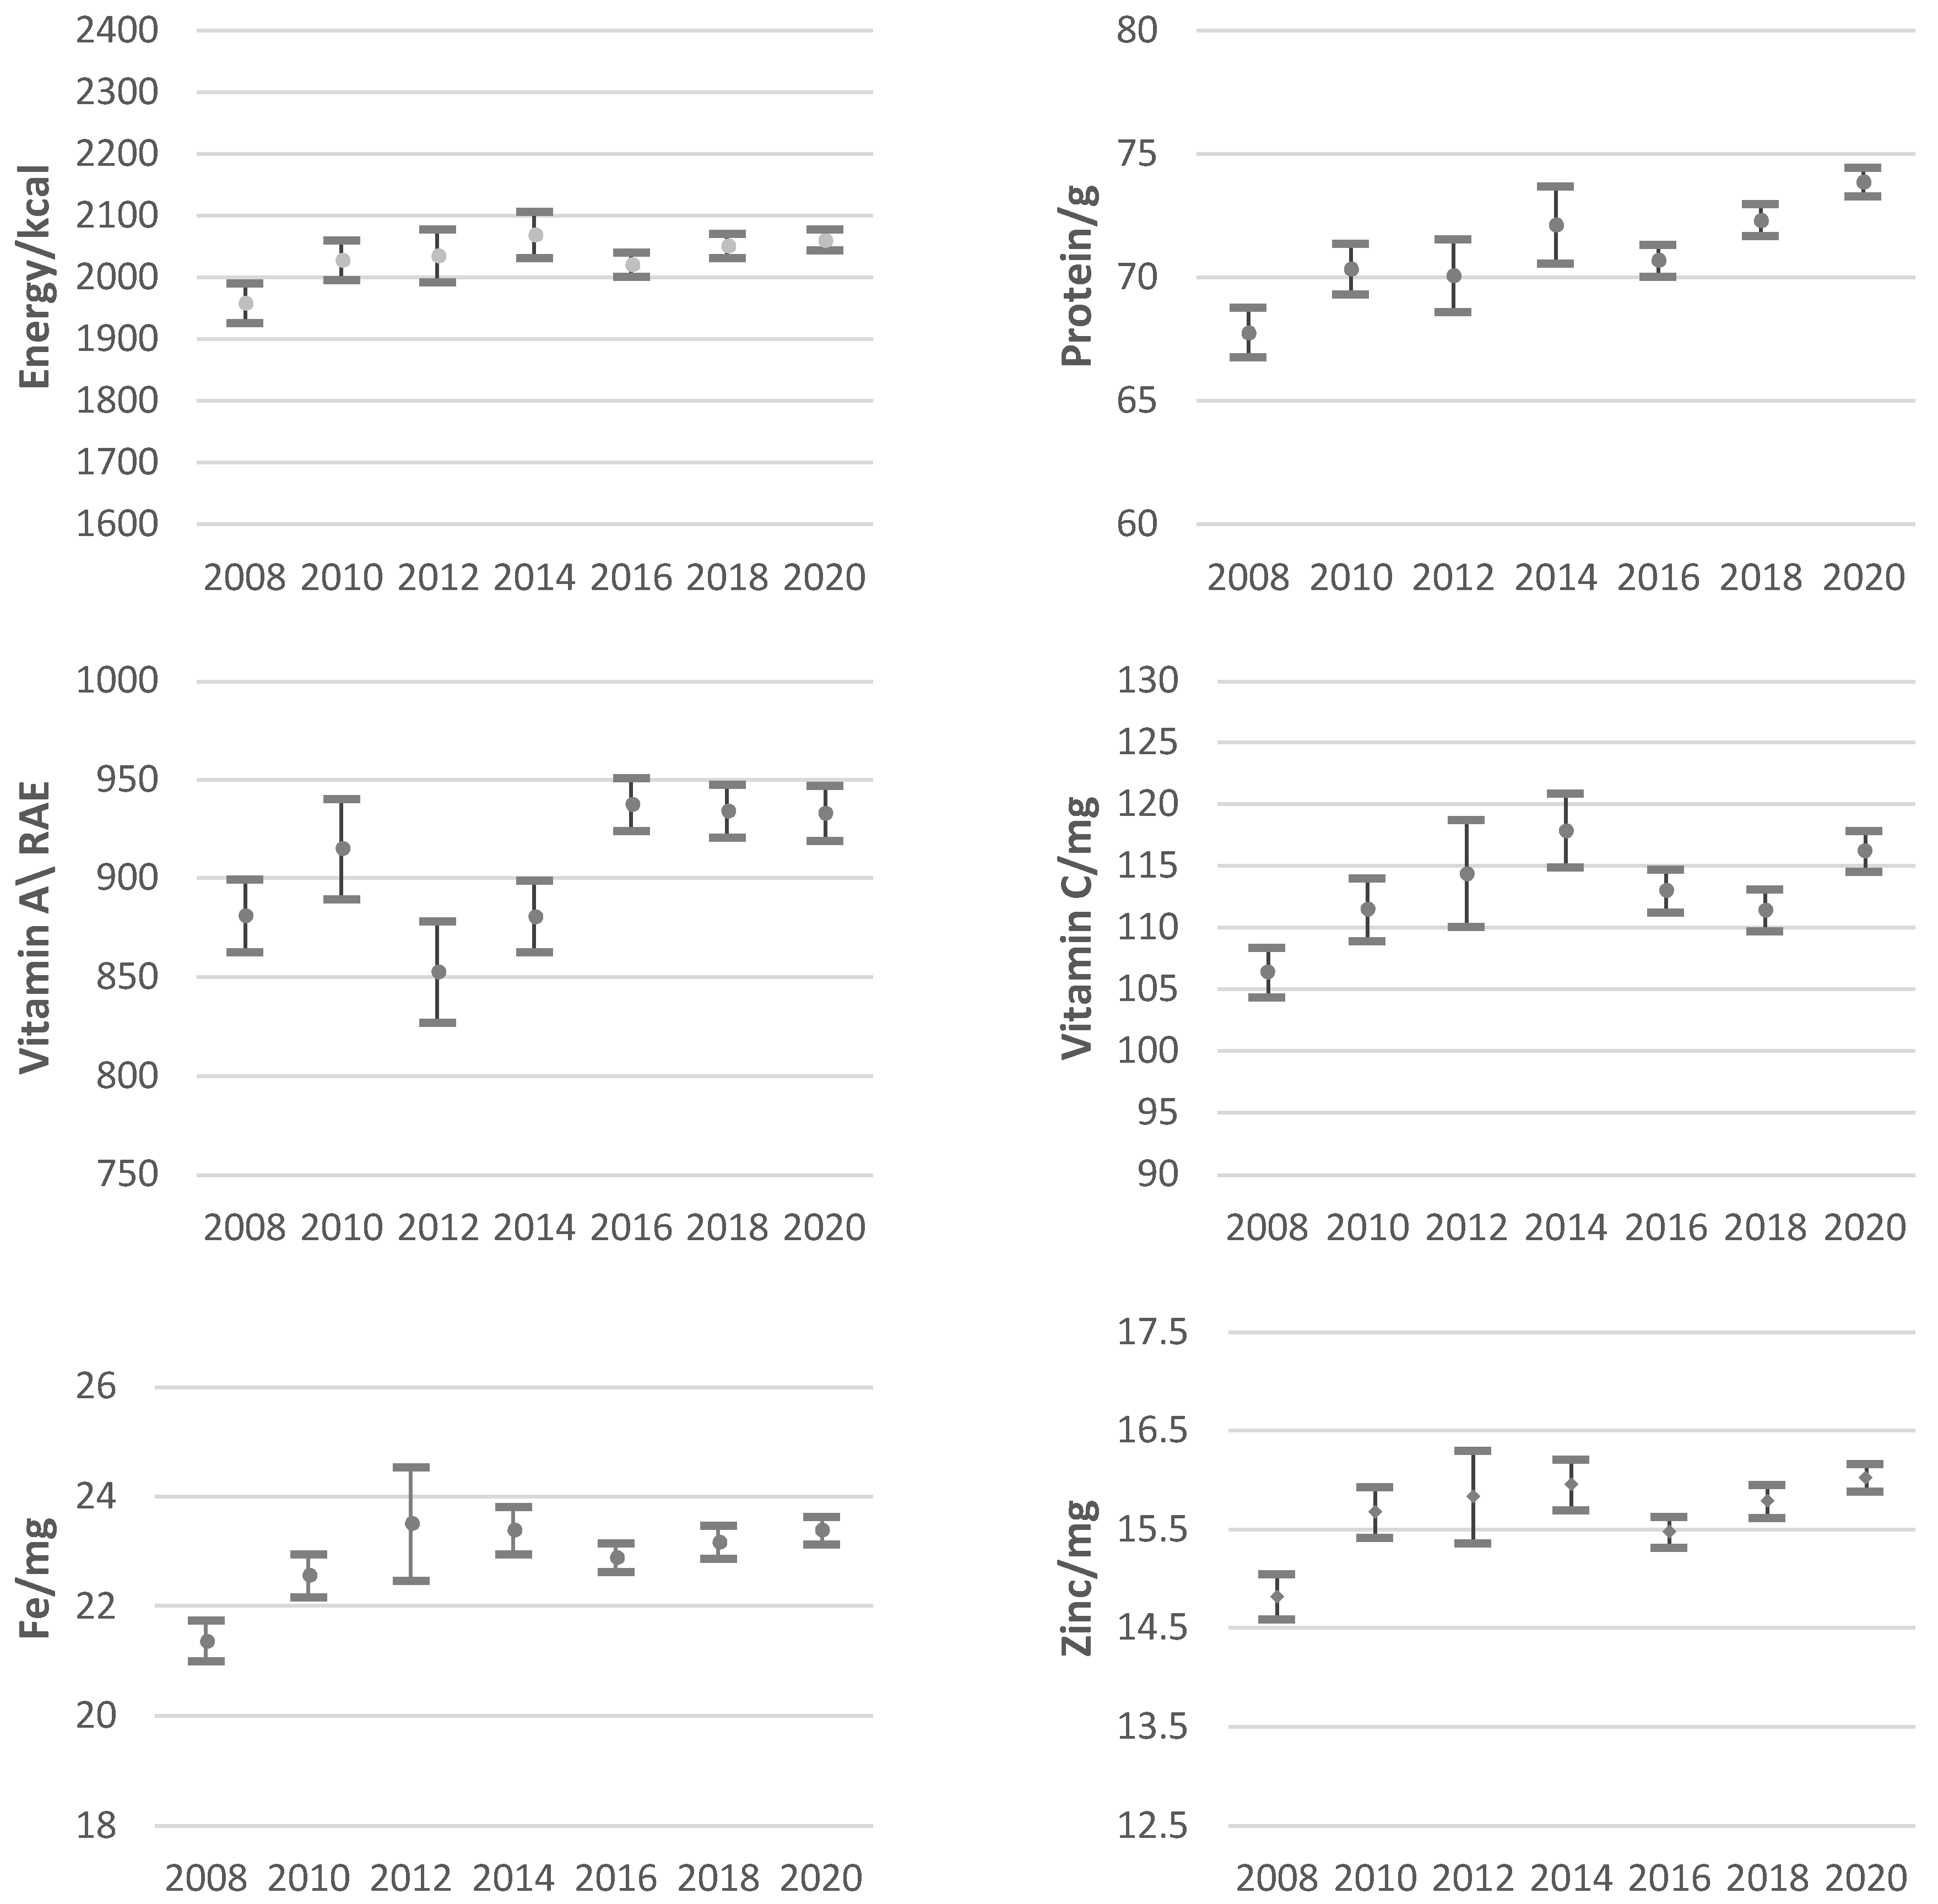
| Year | Energy/kcal | Protein/g | VitA/RAE | VitC/mg | Fe/mg | Zinc/mg |
|---|---|---|---|---|---|---|
| 2008 | 1888.1 | 65.3 | 847.4 | 102.2 | 20.6 | 14.3 |
| (1855.2, 1921.0) | (64.3, 66.4) | (829.3, 865.4) | (100.2, 104.2) | (20.2, 21.1) | (14.0, 14.5) | |
| 2010 | 1860.0 | 64.6 | 842.1 | 102.9 | 20.7 | 14.4 |
| (1829.7, 1890.4) | (63.6, 65.5) | (818.2, 866.0) | (100.5, 105.2) | (20.3, 21.1) | (14.1, 14.6) | |
| 2012 | 1872.1 | 64.5 | 787.3 | 106.1 | 21.7 | 14.6 |
| (1832.3, 1911.8) | (63.1, 65.9) | (763.2, 811.4) | (102.0, 110.2) | (20.7, 22.6) | (14.1, 15.0) | |
| 2014 | 1907.0 | 66.5 | 813.7 | 109.5 | 21.5 | 14.7 |
| (1870.8, 1943.1) | (65.0, 68.1) | (796.6, 830.8) | (106.6, 112.4) | (21.1, 22.0) | (14.5, 14.9) | |
| 2016 | 1867.9 | 65.4 | 869.4 | 105.2 | 21.1 | 14.3 |
| (1849.1, 1886.8) | (64.8, 66.0) | (856.6, 882.2) | (103.5, 106.8) | (20.9, 21.4) | (14.1, 14.4) | |
| 2018 | 1904.9 | 67.2 | 869.5 | 104.1 | 21.5 | 14.6 |
| (1886.3, 1923.6) | (66.6, 67.8) | (856.5, 882.4) | (102.5, 105.8) | (21.2, 21.8) | (14.5, 14.8) | |
| 2020 | 1927.1 | 69.1 | 875.0 | 109.3 | 21.9 | 15.0 |
| (1910.6, 1943.7) | (68.6, 69.7) | (861.4, 888.7) | (107.7, 110.9) | (21.6, 22.1) | (14.9, 15.1) |
References
- Fiedler, J.L.; Carletto, C.; Dupriez, O. Still Waiting for Godot? Improving Household Consumption and Expenditures Surveys (HCES) to Enable More Evidence-Based Nutrition Policies. Food Nutr. Bull. 2012, 33, S242–S251. [Google Scholar] [CrossRef]
- Strauss, J. Does Better Nutrition Raise Farm Productivity? J. Political Econ. 1986, 94, 297–320. [Google Scholar] [CrossRef]
- Tiwasing, P.; Dawson, P.; Garrod, G. The relationship between micronutrient intake and labour productivity: Evidence from rice-farming households in Thailand. Outlook Agric. 2019, 48, 58–65. [Google Scholar] [CrossRef]
- Valero-Gil, J.; Valero, M. Calories and poverty during a prolonged crisis. Food Policy 2018, 76, 56–69. [Google Scholar] [CrossRef]
- Schott, E.; Rezende, F.A.C.; Priore, S.E.; Ribeiro, A.Q.; Franceschini, S.D.C.C. Methodologies for assessing the household food availability in the context of food (in)security: A systematic review. Ciência Saúde Coletiva 2020, 25, 2677–2685. [Google Scholar] [CrossRef] [PubMed]
- Zezza, A.; Carletto, C.; Fiedler, J.L.; Gennari, P.; Jolliffe, D. Food counts. Measuring food consumption and expenditures in household consumption and expenditure surveys (HCES). Introduction to the special issue. Food Policy 2017, 72, 1–6. [Google Scholar] [CrossRef]
- Backiny-Yetna, P.; Steele, D.; Djima, I.Y. The impact of household food consumption data collection methods on poverty and inequality measures in Niger. Food Policy 2017, 72, 7–19. [Google Scholar] [CrossRef]
- Smith, L.C.; Subandoro, A. Measuring Food Security Using Household Expenditure Surveys; IFPRI: Washington, DC, USA, 2007. [Google Scholar] [CrossRef]
- Ravallion, M. The Economics of Poverty: History, Measurement, and Policy; Oxford University Press: Oxford, UK, 2016. [Google Scholar] [CrossRef]
- Shamah-Levy, T.; Rivera-Dommarco, J.; Bertozzi, S. Encuesta Nacional de Salud y Nutrición 2018–19: Resultados Nacionales; Instituto Nacional de Salud Pública: Cuernavaca, Mexico, 2020. [Google Scholar]
- Brinkman, H.-J.; De Pee, S.; Sanogo, I.; Subran, L.; Bloem, M.W. High Food Prices and the Global Financial Crisis Have Reduced Access to Nutritious Food and Worsened Nutritional Status and Health. J. Nutr. 2009, 140, 153S–161S. [Google Scholar] [CrossRef] [PubMed] [Green Version]
- Bouis, H.E.; Eozenou, P.; Rahman, A. Food Prices, Household Income, and Resource Allocation: Socioeconomic Perspectives on Their Effects on Dietary Quality and Nutritional Status. Food Nutr. Bull. 2011, 32 (Suppl. S1), S14–S23. [Google Scholar] [CrossRef]
- Yu, X.; Shimokawa, S. Nutritional impacts of rising food prices in African countries: A review. Food Secur. 2016, 8, 985–997. [Google Scholar] [CrossRef]
- Mekonnen, D.A.; Trijsburg, L.; Achterbosch, T.; Brouwer, I.D.; Kennedy, G.; Linderhof, V.; Ruben, R.; Talsma, E.F. Food consumption patterns, nutrient adequacy, and the food systems in Nigeria. Agric. Food Econ. 2021, 9, 16. [Google Scholar] [CrossRef]
- Shamah-Levy, T.; Mundo-Rosas, V.; A Rivera-Dommarco, J. La Magnitud de la Inseguridad Alimentaria en México: Su Relación con el Estado de Nutrición y con Factores Socioeconómicos; Salud Pública México: Cuernavaca, Mexico, 2013; Volume 56, p. 79. [Google Scholar] [CrossRef]
- Colchero, M.A.; Molina, M.; Guerrero-López, C.M. After Mexico Implemented a Tax, Purchases of Sugar-Sweetened Beverages Decreased and Water Increased: Difference by Place of Residence, Household Composition, and Income Level. J. Nutr. 2017, 147, 1552–1557. [Google Scholar] [CrossRef]
- Saldivar-Frausto, M.; Unar-Munguía, M.; Méndez-Gómez-Humarán, I.; Rodríguez-Ramírez, S.; Shamah-Levy, T. Effect of a conditional cash transference program on food insecurity in Mexican households: 2012–2016. Public Health Nutr. 2021, 25, 1084–1093. [Google Scholar] [CrossRef] [PubMed]
- Valero-Gil, J.; Valero, M. Nutritional Intake and Poverty in Mexico: 1984–2010. J. Dev. Stud. 2013, 49, 1375–1396. [Google Scholar] [CrossRef]
- Romo-Aviles, M.; Ortiz-Hernández, L. Energy and nutrient supply according to food insecurity severity among Mexican households. Food Secur. 2018, 10, 1163–1172. [Google Scholar] [CrossRef]
- Sánchez-Pimienta, T.G.; López-Olmedo, N.; Rodríguez-Ramírez, S.; García-Guerra, A.; A Rivera, J.; Carriquiry, A.L.; Villalpando, S. High Prevalence of Inadequate Calcium and Iron Intakes by Mexican Population Groups as Assessed by 24-Hour Recalls. J. Nutr. 2016, 146, 1874S–1880S. [Google Scholar] [CrossRef]
- Instituto Nacional de Estadística y Geografía. Encuesta Nacional de Ingresos y Gastos de los Hogares (ENIGH), 2018 Nueva serie. Available online: https://www.inegi.org.mx/programas/enigh/nc/2018/#Documentacion (accessed on 28 June 2022).
- Lambe, J.; Kearney, J.; Becker, W.; Hulshof, K.; Dunne, A.; Gibney, M.J. Predicting percentage of individuals consuming foods from percentage of households purchasing foods to improve the use of household budget surveys in estimating food chemical intakes. Public Health Nutr. 1998, 1, 239–247. [Google Scholar] [CrossRef] [Green Version]
- Jariseta, Z.R.; Dary, O.; Fiedler, J.L.; Franklin, N. Comparison of Estimates of the Nutrient Density of the Diet of Women and Children in Uganda by Household Consumption and Expenditures Surveys (HCES) and 24-Hour Recall. Food Nutr. Bull. 2012, 33 (Suppl. S2), S199–S207. [Google Scholar] [CrossRef]
- Murphy, S.; Ruel, M.; Carriquiry, A. Should Household Consumption and Expenditures Surveys (HCES) be Used for Nutritional Assessment and Planning? Food Nutr. Bull. 2012, 33 (Suppl. S2), S235–S241. [Google Scholar] [CrossRef]
- Fiedler, J.L.; Lividini, K.; Bermudez, O.I.; Smitz, M.F. Household Consumption and Expenditures Surveys (HCES): A primer for food and nutrition analysts in low-and middle-income countries. Food Nutr. Bull. 2012, 33 (Suppl. S3), S170–S184. [Google Scholar] [CrossRef]
- U.S. Department of Agriculture. Food Data Central. 2019. Available online: https://fdc.nal.usda.gov (accessed on 29 June 2022).
- FatSecret México—Contador de Calorías y Control de Dieta para Perder Peso. Available online: https://www.fatsecret.com.mx/ (accessed on 5 August 2022).
- Fallaize, R.; Franco, R.Z.; Pasang, J.; Hwang, F.; A Lovegrove, J. Popular Nutrition-Related Mobile Apps: An Agreement Assessment Against a UK Reference Method. JMIR mHealth uHealth 2019, 7, e9838. [Google Scholar] [CrossRef] [PubMed]
- Morales de León, J.C.; Bourges-Rodríguez, H.; Camacho-Parra, M.E. Tables of Composition of Foods and Food Products (Con-Densed Version 2015); Instituto Nacional de Ciencias Médicas y Nutrición Salvador Zubirán: Ciudad de México, Mexico, 2016; Available online: https://www.incmnsz.mx/2019/TABLAS_ALIMENTOS.pdf (accessed on 29 June 2022).
- Muñoz de Chávez, M.; Ledesma Solano, J.A. Composición de Alimentos: Valor Nutritivo de los Alimentos de Mayor Consumo, 2nd ed.; McGraw Hill Interamericana: Ciudad de México, Mexico, 2010. [Google Scholar]
- Pérez Lizaur, A.B.; Palacios González, B.; Castro Becerra, A.L.; Flores Galicia, I. Sistema Mexicano de Alimentos Equivalentes. Cuadernos De Nutricion; Fomento de Nutricion y Salud: México City, Mexico, 2014. [Google Scholar]
- Instituto de Nutrición de Centro América y Panamá. Tabla de Composición de Alimentos de Centroamérica, 2nd ed.; INCAP/OPS: Guatemala City, Guatemala, 2007; Available online: http://www.incap.int/mesocaribefoods/dmdocuments/TablaCAlimentos.pdf (accessed on 28 June 2022).
- Tukey, J.W. Exploratory Data Analysis, Reading; Addison-Wesley: Boston, MA, USA, 1977. [Google Scholar]
- Hernandez-Solano, A.; Perez-Hernandez, V.; Burrola-Méndez, S.; Aguirre, A.; Gallegos, J.; Teruel Belismelis, G. Nutritional Table to Estimate the Availability of Nutrients in Households from the Mexican National Survey of Household Income and Ex-Penditures (ENIGH) 2008–2020.[Data Set]. Available online: https://zenodo.org/record/7035566#.Yw7W0LRByNI (accessed on 12 August 2019).
- CONEVAL. Metodología Para la Medición Multidimensional de la Pobreza en México, 3rd ed.; Consejo Nacional de Evaluación de la Política de Desarrollo Social: Mexico City, Mexico, 2019; Available online: https://www.coneval.org.mx/InformesPublicaciones/InformesPublicaciones/Documents/Metodologia-medicion-multidimensional-3er-edicion.pdf (accessed on 29 June 2019).
- Silva, A.; Caro, J.C.; Magaña-Lemus, D. Household food security: Perceptions, behavior and nutritional quality of food purchases. J. Econ. Psychol. 2016, 55, 139–148. [Google Scholar] [CrossRef]
- López-Olmedo, N.; Carriquiry, A.L.; Rodríguez-Ramírez, S.; Ramírez-Silva, I.; Espinosa-Montero, J.; Hernández-Barrera, L.; Campirano, F.; Martínez-Tapia, B.; A Rivera, J. Usual Intake of Added Sugars and Saturated Fats Is High while Dietary Fiber Is Low in the Mexican Population. J. Nutr. 2016, 146, 1856S–1865S. [Google Scholar] [CrossRef] [PubMed]
- Ramírez-Silva, I.; Rodríguez-Ramírez, S.; Barragán-Vázquez, S.; Castellanos-Gutiérrez, A.; Reyes-García, A.; Martínez-Piña, A.; Pedroza-Tobías, A. Prevalence of Inadequate Intake of Vitamins and Minerals in the Mexican Population Correcting by Nutrient Retention Factors, Ensanut 2016; Salud Pública México: Cuernavaca, Mexico, 2020; Volume 62, pp. 521–531. [Google Scholar] [CrossRef]
- Mina, O.E.C.; Gómez, H.G. Efectos de la escolaridad en el consumo de calorías y nutrientes de las familias mexicanas. Probl. Desarro. Rev. Latinoam. Econ. 2020, 51, 3–27. [Google Scholar] [CrossRef]
- Pedroza-Tobías, A.; Hernández-Barrera, L.; López-Olmedo, N.; García-Guerra, A.; Rodríguez-Ramírez, S.; Ramírez-Silva, I.; Villalpando, S.; Carriquiry, A.; A Rivera, J. Usual Vitamin Intakes by Mexican Populations. J. Nutr. 2016, 146, 1866S–1873S. [Google Scholar] [CrossRef]
- Merchant, A.T.; Dehghan, M. Food composition database development for between country comparisons. Nutr. J. 2006, 5, 2. [Google Scholar] [CrossRef] [PubMed] [Green Version]
| Nutritional Tables | Number of Foods Paired | Number of Categories Paired |
|---|---|---|
| SZ [29] | 1023 | 185 |
| MZ [30] | 135 | 28 |
| SMAE [31] | 11 | 8 |
| INCAP [32] | 9 | 6 |
| USDA [26] | 5 | 5 |
| Other sources * | 7 | 5 |
| All pairings | 1190 | 237 |
| Year | Households with Consumption of Food Away from Home | Daily per Capita Expenditure in Food for Consumption in the Household 1,2 | Daily per Capita Expenditure in Food 1,2 | Proportion of Total Food Expenditure Spent on Food Away from Home | ||||
|---|---|---|---|---|---|---|---|---|
| % | IC 95% | MX$ | IC 95% | MX$ | IC 95% | % | IC 95% | |
| 2014 | 62.28 | (61.03, 63.54) | 33.12 | (32.58, 33.65) | 49.52 | (48.54, 50.50) | 22.73 | (22.13, 23.33) |
| 2016 | 68.65 | (68.02, 69.27) | 34.25 | (33.92, 34.59) | 54.35 | (53.73, 54.97) | 26.41 | (26.05, 26.76) |
| 2018 | 68.07 | (67.45, 68.69) | 35.17 | (34.83, 35.51) | 55.79 | (55.12, 56.46) | 26.48 | (26.11, 26.85) |
| 2020 | 53.78 | (53.18, 54.38) | 38.32 | (37.98, 38.67) | 52.99 | (52.47, 53.51) | 19.62 | (19.32, 19.92) |
| Quintile | Energy/kcal | Protein/g | VitA/RAE | VitC/mg | Fe/mg | Zinc/mg |
|---|---|---|---|---|---|---|
| I | 2050.97 | 67.61 | 755.88 | 84.51 | 23.44 | 15.66 |
| (2011.92, 2090.03) | (66.51, 68.71) | (740.20, 771.55) | (82.64, 86.38) | (22.99, 23.88) | (15.40, 15.93) | |
| II | 2001.59 | 69.74 | 875.54 | 99.56 | 22.84 | 15.54 |
| (1972.93, 2030.25) | (68.84, 70.63) | (856.38, 894.70) | (97.42, 101.71) | (22.43, 23.24) | (15.31, 15.76) | |
| III | 2000.89 | 72.02 | 928.20 | 114.63 | 22.81 | 15.69 |
| (1973.67, 2028.11) | (71.12, 72.93) | (906.63, 949.77) | (111.77, 117.49) | (22.36, 23.26) | (15.46, 15.93) | |
| IV | 2049.98 | 75.93 | 1003.78 | 128.04 | 22.83 | 15.94 |
| (2019.04, 2080.91) | (74.86, 76.99) | (975.28, 1032.27) | (124.81, 131.28) | (22.41, 23.25) | (15.70, 16.19) | |
| V | 2202.20 | 84.14 | 1105.25 | 154.86 | 25.03 | 17.30 |
| (2157.96, 2246.43) | (82.49, 85.80) | (1057.74, 1152.76) | (149.90, 159.81) | (24.34, 25.73) | (16.92, 17.67) |
| Nutrient | Source | Data | FAFH | Year | Population | Estimate |
|---|---|---|---|---|---|---|
| Energy/kcal | [18] | ENIGH | Yes | 2008 | Rural | 2454 |
| Urban | 2512 | |||||
| 2010 | Rural | 2485 | ||||
| Urban | 2444 | |||||
| [3] | ENIGH A | Yes | 2008 | National | 2699 | |
| 2010 | National | 2683 | ||||
| [36] | ENIGH | No | 2012 | National | 2771 | |
| [37] | ENSANUT | Yes | 2012 | Preschool-aged children (1–4 years) | 1380 | |
| School-aged boys (5–11 years) | 1910 | |||||
| School-aged girls (5–11 years) | 1770 | |||||
| Adolescent males (12–19 years) | 2360 | |||||
| Adolescent females (12–19 years) | 1900 | |||||
| Adult men (>=20 years) | 2030 | |||||
| Adult women (>=20 years) | 1778 | |||||
| [19] | ENIGH A | No | 2014 | National | 1581 | |
| [38] | ENSANUT | Yes | 2016 | National | 1903 | |
| [39] | ENIGH A | Yes | 2018 | National | 2845 | |
| Protein/g | [18] | ENIGH | Yes | 2008 | Rural | 84 |
| Urban | 93 | |||||
| 2010 | Rural | 82 | ||||
| Urban | 94 | |||||
| [37] | ENSANUT | Yes | 2012 | Preschool-aged children (1–4 years) | 48 | |
| School-aged boys (5–11 years) | 63 | |||||
| School-aged girls (5–11 years) | 60 | |||||
| Adolescent males (12–19 years) | 78 | |||||
| Adolescent females (12–19 years) | 61 | |||||
| Adult men (>=20 years) | 75 | |||||
| Adult women (>=20 years) | 62 | |||||
| VitA/RAE | [40] | ENSANUT | Yes | 2012 | Preschool-aged children (1–4 years) | 563 |
| School-aged boys (5–11 years) | 597 | |||||
| School-aged girls (5–11 years) | 578 | |||||
| Adolescent males (12–19 years) | 584 | |||||
| Adolescent females (12–19 years) | 532 | |||||
| Adult men (>=20 years) | 547 | |||||
| Adult women (>=20 years) | 536 | |||||
| [38] | ENSANUT | Yes | 2016 | National | 553.1 | |
| VitC/mgg | [40] | ENSANUT | Yes | 2012 | Preschool-aged children (1–4 years) | 98.3 |
| School-aged boys (5–11 years) | 107 | |||||
| School-aged girls (5–11 years) | 112 | |||||
| Adolescent males (12–19 years) | 109 | |||||
| Adolescent females (12–19 years) | 111 | |||||
| Adult men (>=20 years) | 107 | |||||
| Adult women (>=20 years) | 101 | |||||
| [38] | ENSANUT | Yes | 2016 | National | 102.6 | |
| Fe/mg | [20] | ENSANUT | Yes | 2012 | Preschool-aged children (1–4 years) | 10.3 |
| School-aged boys (5–11 years) | 13.2 | |||||
| School-aged girls (5–11 years) | 13.2 | |||||
| Adolescent males (12–19 years) | 15.4 | |||||
| Adolescent females (12–19 years) | 15.4 | |||||
| Adult men (>=20 years) | 13.6 | |||||
| Adult women (>=20 years) | 11.5 | |||||
| Zinc/mg | [20] | ENSANUT | Yes | 2012 | Preschool-aged children (1–4 years) | 8.00 |
| School-aged boys (5–11 years) | 10.1 | |||||
| School-aged girls (5–11 years) | 9.47 | |||||
| Adolescent males (12–19 years) | 12.5 | |||||
| Adolescent females (12–19 years) | 9.28 | |||||
| Adult men (>=20 years) | 11.4 | |||||
| Adult women (>=20 years) | 9.27 | |||||
| [38] | ENSANUT | Yes | 2016 | National | 9 |
Publisher’s Note: MDPI stays neutral with regard to jurisdictional claims in published maps and institutional affiliations. |
© 2022 by the authors. Licensee MDPI, Basel, Switzerland. This article is an open access article distributed under the terms and conditions of the Creative Commons Attribution (CC BY) license (https://creativecommons.org/licenses/by/4.0/).
Share and Cite
Hernández-Solano, A.; Pérez-Hernández, V.; Burrola-Méndez, S.; Aguirre, A.; Gallegos, J.; Teruel, G. Using Household Expenditure Surveys for Comparable and Replicable Nutritional Analysis: Evidence from México. Nutrients 2022, 14, 3588. https://doi.org/10.3390/nu14173588
Hernández-Solano A, Pérez-Hernández V, Burrola-Méndez S, Aguirre A, Gallegos J, Teruel G. Using Household Expenditure Surveys for Comparable and Replicable Nutritional Analysis: Evidence from México. Nutrients. 2022; 14(17):3588. https://doi.org/10.3390/nu14173588
Chicago/Turabian StyleHernández-Solano, Alan, Víctor Pérez-Hernández, Soraya Burrola-Méndez, Alejandra Aguirre, Jesús Gallegos, and Graciela Teruel. 2022. "Using Household Expenditure Surveys for Comparable and Replicable Nutritional Analysis: Evidence from México" Nutrients 14, no. 17: 3588. https://doi.org/10.3390/nu14173588
APA StyleHernández-Solano, A., Pérez-Hernández, V., Burrola-Méndez, S., Aguirre, A., Gallegos, J., & Teruel, G. (2022). Using Household Expenditure Surveys for Comparable and Replicable Nutritional Analysis: Evidence from México. Nutrients, 14(17), 3588. https://doi.org/10.3390/nu14173588