

Dietary Intake of Recreational Endurance Runners Associated with Race Distance—Results from the NURMI Study (Step 2)
 , ,
, ,  ,
,  ,
,  and
and
Abstract
:1. Introduction
2. Materials and Methods
2.1. Study Design and Ethical Approval
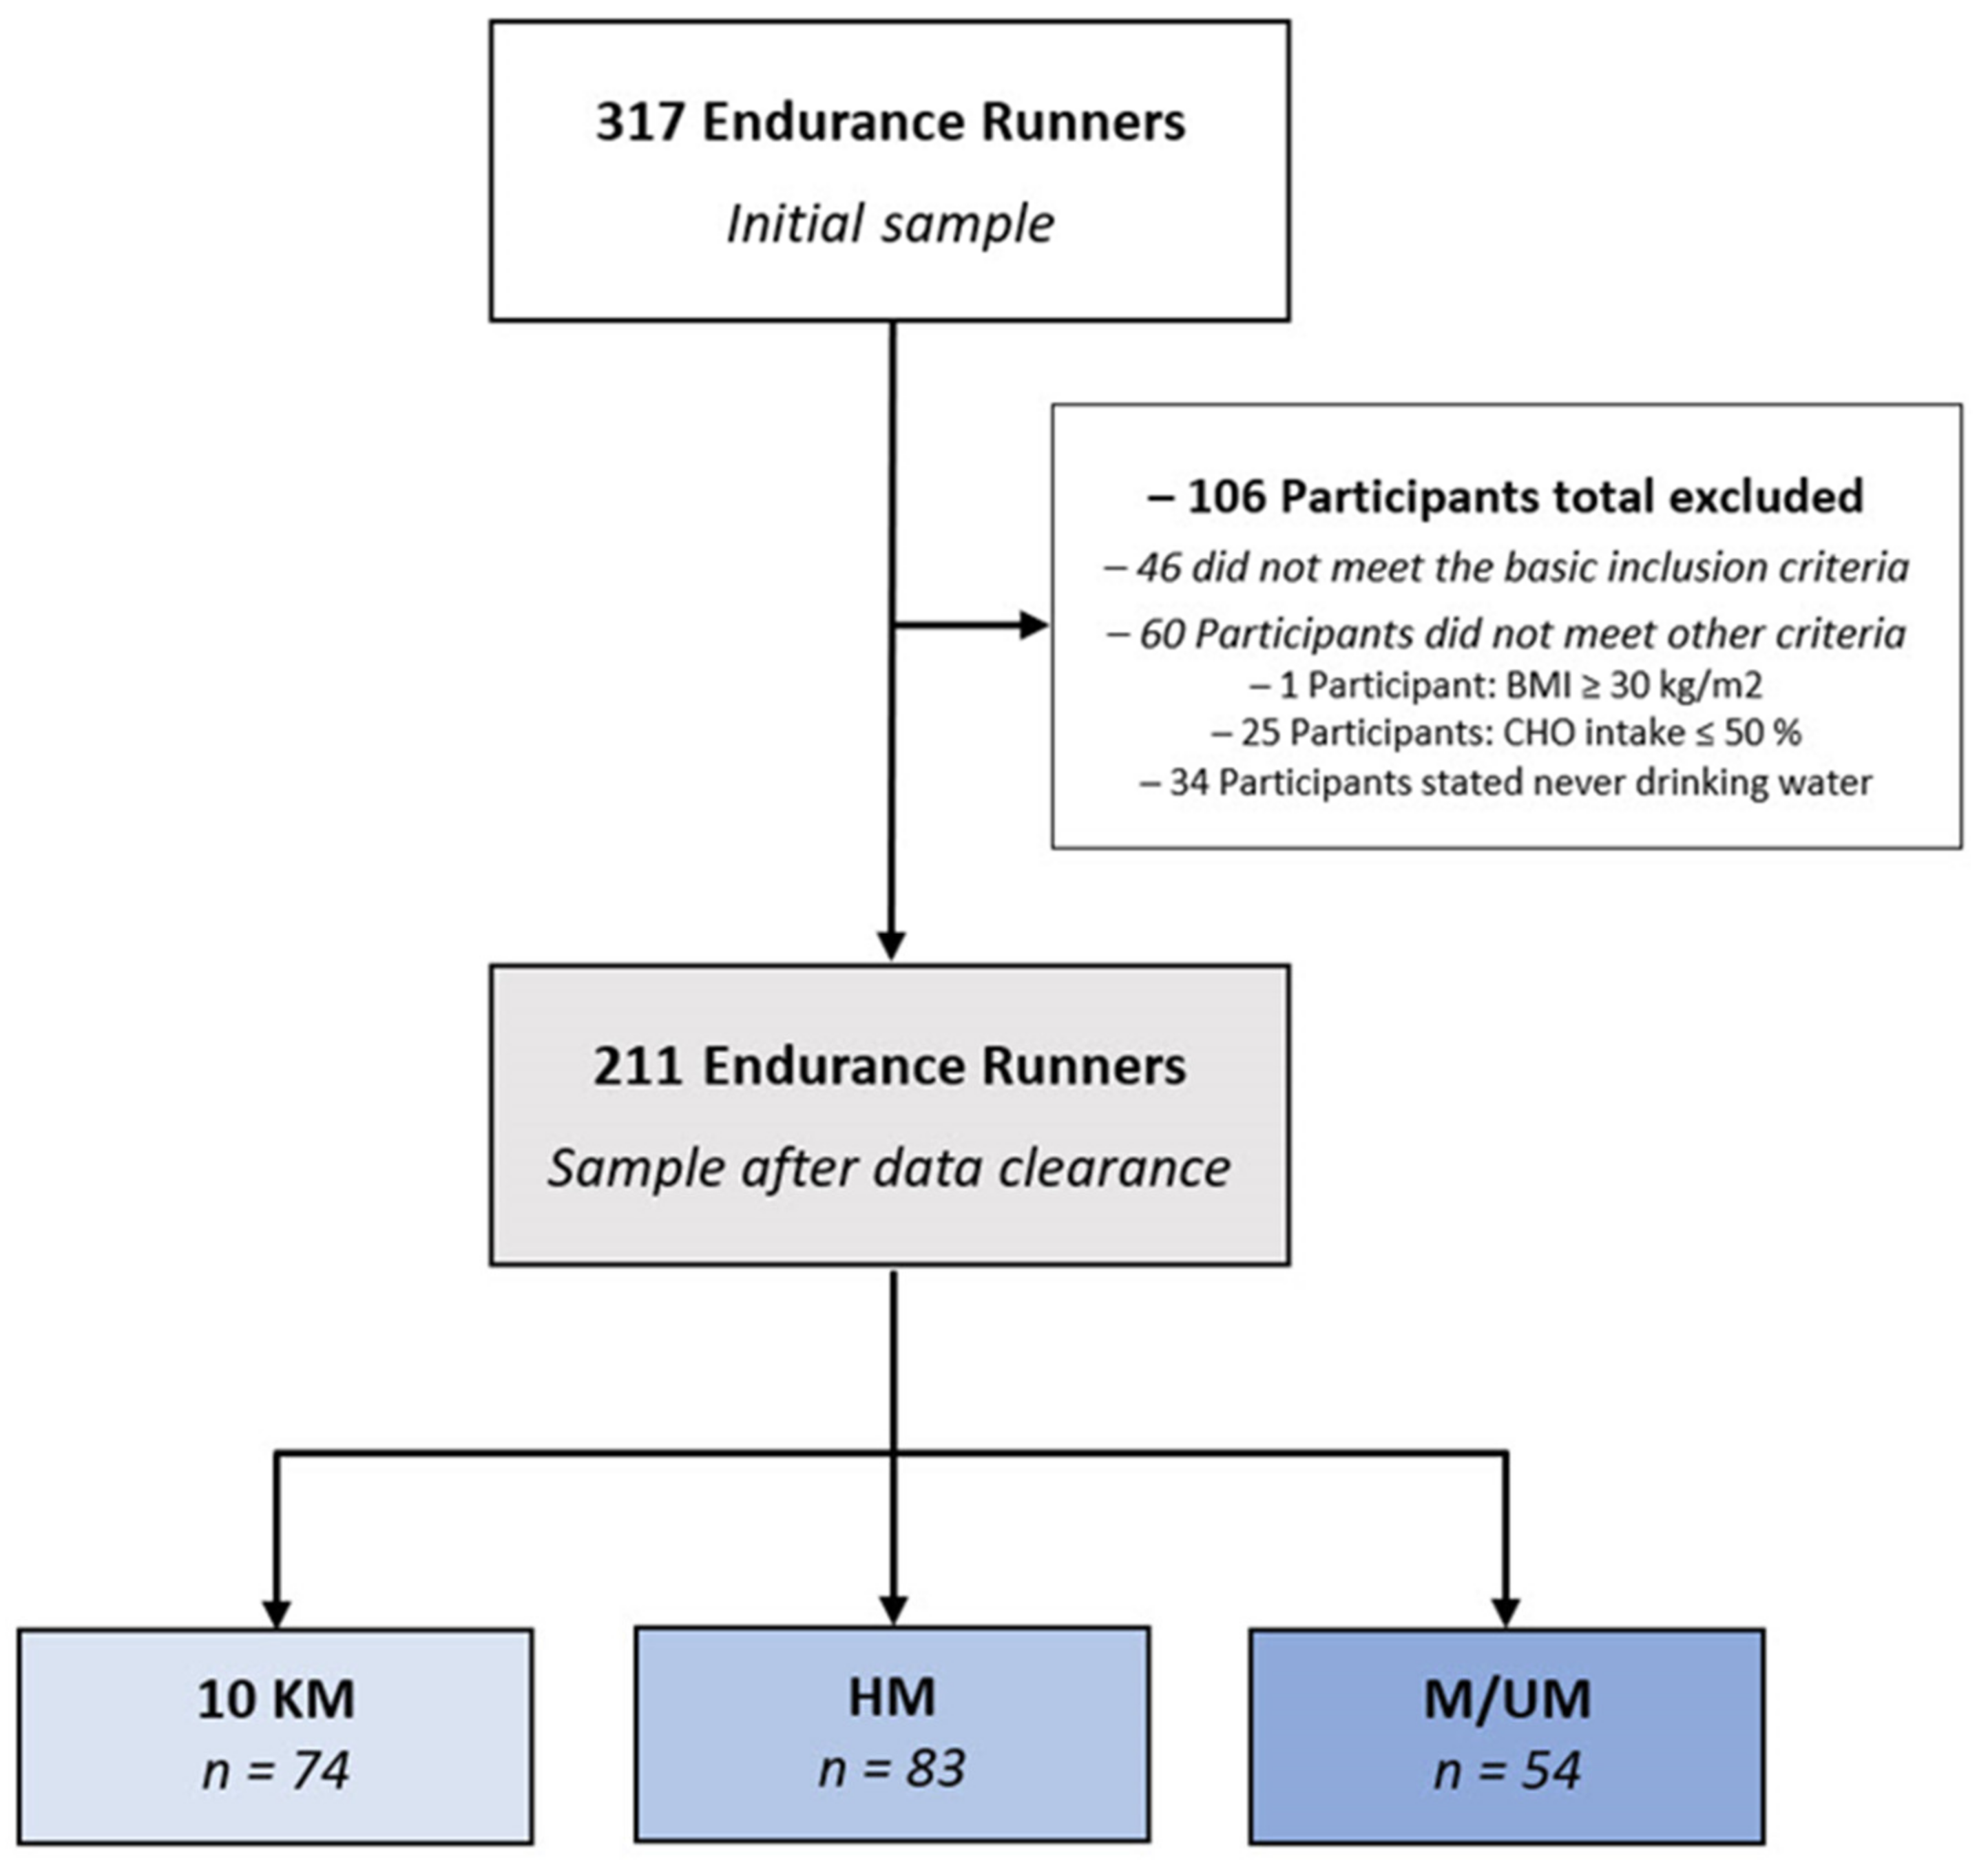
2.2. Participants and Experimental Approach
2.3. Data Clearance
2.4. Measures and Analytical Modelling
2.5. Statistical Analysis
3. Results
4. Discussion
5. Conclusions
Author Contributions
Funding
Institutional Review Board Statement
Informed Consent Statement
Data Availability Statement
Conflicts of Interest
References
- Andersen, J. The State of Running 2019 by RunRepeat.com and the IAAF—International Association of Athletics Federations. Available online: https://runrepeat.com/state-of-running (accessed on 20 July 2022).
- DeJong, A.F.; Fish, P.N.; Hertel, J. Running behaviors, motivations, and injury risk during the COVID-19 pandemic: A survey of 1147 runners. PLoS ONE 2021, 16, e0246300. [Google Scholar] [CrossRef] [PubMed]
- Waśkiewicz, Z.; Nikolaidis, P.T.; Gerasimuk, D.; Broysiuk, Z.; Rosemann, T.; Knechtle, B. What motivates successful marathon runners? The role of sex, age, education, and training experience in Polish runners. Front. Psychol. 2019, 10, 1671. [Google Scholar] [CrossRef]
- Wirnitzer, K.; Boldt, P.; Wirnitzer, G.; Leitzmann, C.; Tanous, D.; Motevalli, M.; Rosemann, T.; Knechtle, B. Health status of recreational runners over 10-km up to ultra-marathon distance based on data of the NURMI Study Step 2. Sci. Rep. 2022, 12, 10295. [Google Scholar] [CrossRef]
- Burke, L.M.; Jeukendrup, A.E.; Jones, A.M.; Mooses, M. Contemporary nutrition strategies to optimize performance in distance runners and race walkers. Int. J. Sport Nutr. Exerc. Metab. 2019, 29, 117–129. [Google Scholar] [CrossRef]
- Wirnitzer, K.C. Vegan diet in sports and exercise–health benefits and advantages to athletes and physically active people: A narrative review. Int. J. Sports Exerc. Med. 2020, 6, 165. [Google Scholar]
- Tiller, N.B.; Roberts, J.D.; Beasley, L.; Chapman, S.; Pinto, J.M.; Smith, L.; Wiffin, M.; Russell, M.; Sparks, S.A.; Duckworth, L.; et al. International Society of Sports Nutrition Position Stand: Nutritional considerations for single-stage ultra-marathon training and racing. J. Int. Soc. Sports Nutr. 2019, 16, 50. [Google Scholar] [CrossRef]
- Baar, K. Nutrition and the adaptation to endurance training. Sports Med. 2014, 44, S5–S12. [Google Scholar] [CrossRef] [PubMed]
- Burke, L.M.; Deakin, V. Clinical Sports Nutrition, 4th ed.; McGraw-Hill: North Ryde, Australia, 2010. [Google Scholar]
- Bytomski, J.R. Fueling for Performance. Sports Health 2018, 10, 47–53. [Google Scholar] [CrossRef]
- Malsagova, K.A.; Kopylov, A.T.; Sinitsyna, A.A.; Stepanov, A.A.; Izotov, A.A.; Butkova, T.V.; Chingin, K.; Klyuchnikov, M.S.; Kaysheva, A.L. Sports Nutrition: Diets, Selection Factors, Recommendations. Nutrients 2021, 13, 3771. [Google Scholar] [CrossRef]
- Black, K.; Slater, J.; Brown, R.C.; Cooke, R. Low energy availability, plasma lipids, and hormonal profiles of recreational athletes. J. Strength Cond. Res. 2018, 32, 2816–2824. [Google Scholar] [CrossRef]
- Meng, K.; Qiu, J.; Benardot, D.; Carr, A.; Yi, L.; Wang, J.; Liang, Y. The risk of low energy availability in Chinese elite and recreational female aesthetic sports. J. Int. Soc. Sports Nutr. 2020, 17, 13. [Google Scholar] [CrossRef] [PubMed] [Green Version]
- Melin, A.K.; Heikura, I.A.; Tenforde, A.; Mountjoy, M. Energy availability in athletics: Health, performance, and physique. Int. J. Sport Nutr. Exerc. Metab. 2019, 29, 152–164. [Google Scholar] [CrossRef] [PubMed]
- Burke, L.M.; Slater, G.; Broad, E.M.; Haukka, J.; Modulon, S.; Hopkins, W.G. Eating patterns and meal frequency of elite Australian athletes. Int. J. Sport Nutr. Exerc. Metab. 2003, 13, 521–538. [Google Scholar] [CrossRef]
- De Oliveira, E.P.; Burini, R.C. Food-dependent, exercise-induced gastrointestinal distress. J. Int. Soc. Sports Nutr. 2011, 8, 12. [Google Scholar] [CrossRef]
- Thomas, D.T.; Erdman, K.A.; Burke, L.M. Position of the academy of nutrition and dietetics, dietitians of Canada, and the American college of sports medicine: Nutrition and athletic performance. J. Acad. Nutr. Diet 2016, 116, 501–528. [Google Scholar] [CrossRef]
- Kerksick, C.M.; Wilborn, C.D.; Roberts, M.D.; Smith-Ryan, A.; Kleiner, S.M.; Jäger, R.; Collins, R.; Cooke, M.; Davis, J.N.; Galvan, E.; et al. ISSN exercise & sports nutrition review update: Research & recommendations. J. Int. Soc. Sports Nutr. 2018, 15, 38. [Google Scholar]
- Quinn, T.J.; Manley, M.J. The impact of a long training run on muscle damage and running economy in runners training for a marathon. J. Exerc. Sci. Fit. 2012, 10, 101–106. [Google Scholar] [CrossRef]
- Harty, P.S.; Cottet, M.L.; Malloy, J.K.; Kerksick, C.M. Nutritional and supplementation strategies to prevent and attenuate exercise-induced muscle damage: A brief review. Sports Med. Open 2019, 5, 1. [Google Scholar] [CrossRef]
- Heikura, I.A.; Stellingwerff, T.; Burke, L.M. Self-reported periodization of nutrition in elite female and male runners and race walkers. Front. Physiol. 2018, 9, 1732. [Google Scholar] [CrossRef]
- Knechtle, B.; Tanous, D.R.; Wirnitzer, G.; Leitzmann, C.; Rosemann, T.; Scheer, V.; Wirnitzer, K. Training and racing behavior of recreational runners by race distance—Results from the NURMI Study (Step 1). Front. Physiol. 2021, 12, 620404. [Google Scholar] [CrossRef]
- Škof, B.; Rotovnik Kozjek, N. A comparison of dietary habits between recreational runners and a randomly selected adult population in Slovenia. Zdr. Varst. 2015, 54, 212–221. [Google Scholar] [PubMed]
- Nogueira, J.A.D.; Da Costa, T.H.M. Nutrient intake and eating habits of triathletes on a Brazilian diet. Int. J. Sport Nutr. Exerc. Metab. 2004, 14, 684–697. [Google Scholar] [CrossRef] [PubMed]
- Wilson, P.B. Nutrition behaviors, perceptions, and beliefs of recent marathon finishers. Phys. Sportsmed. 2016, 44, 242–251. [Google Scholar] [CrossRef]
- Wirnitzer, K.; Motevalli, M.; Tanous, D.; Wirnitzer, G.; Leitzmann, C.; Wagner, K.-H.; Rosemann, T.; Knechtle, B. Training and racing behaviors of omnivorous, vegetarian, and vegan endurance runners—Results from the NURMI Study (Step 1). Nutrients 2021, 13, 3521. [Google Scholar] [CrossRef]
- Wirnitzer, K.; Seyfart, T.; Leitzmann, C.; Keller, M.; Wirnitzer, G.; Lechleitner, C.; Rüst, C.A.; Rosemann, T.; Knechtle, B. Prevalence in running events and running performance of endurance runners following a vegetarian or vegan diet compared to non-vegetarian endurance runners: The NURMI study. SpringerPlus 2016, 5, 458. [Google Scholar] [CrossRef] [PubMed]
- Wirnitzer, K.; Boldt, P.; Lechleitner, C.; Wirnitzer, G.; Leitzmann, C.; Rosemann, T.; Knechtle, B. Health status of female and male vegetarian and vegan endurance runners compared to omnivores-results from the NURMI study (step 2). Nutrients 2018, 11, 29. [Google Scholar] [CrossRef] [PubMed]
- Craig, W.J.; Mangels, A.R.; American Dietetic Association. Position of the American Dietetic Association: Vegetarian diets. J. Am. Diet. Assoc. 2009, 109, 1266–1282. [Google Scholar] [PubMed]
- Melina, V.; Craig, W.; Levin, S. Position of the Academy of Nutrition and Dietetics: Vegetarian diets. J. Acad. Nutr. Diet. 2016, 116, 1970–1980. [Google Scholar] [CrossRef]
- World Health Organization (WHO). A Healthy Lifestyle—WHO Recommendations. Available online: http://www.euro.who.int/en/health-topics/disease-prevention/nutrition/a-healthy-lifestyle/body-mass-index-bmi (accessed on 20 July 2022).
- World Health Organization (WHO). Noncommunicable Diseases: Risk Factors. Available online: http://www.who.int/gho/ncd/risk_factors/bmi_text/en/ (accessed on 20 July 2022).
- Elmadfa, I.; Leitzmann, C. Ernährung des Menschen (Human Nutrition), 6th ed.; UTB GmbH: Berlin, Germany, 2019; p. 618. [Google Scholar]
- König, D. Kohlenhydrate im Sport (Carbohydrates in sport). In Lehrbuch der Sporternährung (Textbook of Sports Nutrition), 1st ed.; Lamprecht, M., Ed.; ÖGSE—Österreichische Gesellschaft für Sporternährung: Graz, Austria, 2007; p. 448. [Google Scholar]
- Scheidt-Nave, C.; Kamtsiuris, P.; Goesswald, A.; Hölling, H. German Health Interview and Examination Survey for Adults (DEGS)—Design, objectives and implementations of the first data collection wave. BMC Public Health 2012, 12, 730. [Google Scholar] [CrossRef]
- Haftenberger, M.; Heuer, T.; Heidemann, C.; Kube, F. Relative validation of a food frequency questionnaire for national health and nutrition monitoring. Nutr. J. 2010, 9, 36. [Google Scholar] [CrossRef] [PubMed]
- Monteiro, C.A.; Cannon, G.; Lawrence, M.; Costa Louzada, M.L.P.; Ereira Machado, P. Ultra-Processed Foods, Diet Quality, and Health Using the NOVA Classification System; Food and Agriculture Organization (FAO) of the United Nations (UN): Rome, Italy, 2019. [Google Scholar]
- Open Food Facts—Freie Datenbank für Nahrungsmittel. Nova-Gruppen der Lebensmittelverarbeitung Eine Klassifizierung in 4 Gruppen, um den Grad der Verarbeitung von Lebensmitteln Darzustellen. Available online: https://de.openfoodfacts.org/nova (accessed on 23 August 2021).
- Fachgesellschaft für Ernährungstherapie und Prävention für Professionalität in der Ernährungsberatung (FETeV). 4-StufenSystem für Lebensmittel nach dem Verarbeitungsgrad. Available online: https://fet-ev.eu/lebensmittelbeurteilung/ (accessed on 23 August 2021).
- Redaktion Ernährungsumschau. Lebensmittelkennzeichnung: 4-Stufen-System für Lebensmittel nach dem Verarbeitungsgrad. ERNÄHRUNGSUMSCHAU 4/2020: M192. Available online: https://www.ernaehrungs-umschau.de/print-news/08-04-2020-4-stufen-system-fuer-lebensmittel-nach-dem-verarbeitungsgrad/ (accessed on 23 August 2021).
- Capling, L.; Beck, K.L.; Gifford, J.A.; Slater, G.; Flood, V.M.; O’Connor, H. Validity of dietary assessment in athletes: A systematic review. Nutrients 2017, 9, 1313. [Google Scholar] [CrossRef] [PubMed]
- Baranowski, T. Chapter 4, 24-hour recall and diet record methods. In Nutritional Epidemiology, 3rd ed.; Walter, W., Ed.; Oxford University Press: New York, NY, USA, 2013; pp. 49–69. [Google Scholar]
- Willett, W. Chapter 5, food frequency methods. In Nutritional Epidemiology, 3rd ed.; Walter, W., Ed.; Oxford University Press: New York, NY, USA, 2013; pp. 70–95. [Google Scholar]
- Braakhius, A.K.; Meredith, K.; Cox, G.R.; Hopkins, W.J.; Burke, L.M. Variability in estimation of self-reported dietary intake data from elite athletes resulting from processing by different sports dietitians. Int. J. Sport Nutr. Exerc. Metab. 2003, 13, 152–165. [Google Scholar] [CrossRef] [PubMed]
- Burke, L.M. Dietary assessment methods for the athlete: Pros and cons of different methods. Sports Sci. Exch. 2015, 28, 1–6. Available online: https://www.gssiweb.org/sports-science-exchange/article/sse-150-dietary-assessment-methods-for-the-athlete-pros-and-cons-of-different-methods (accessed on 16 August 2021).
- Sunami, A.; Sasaki, K.; Suzuki, Y.; Oguma, N.; Ishihara, J.; Nakai, A.; Yasuda, J.; Yokoyama, Y.; Yoshizaki, T.; Tada, Y.; et al. Validity of a semi-quantitative food frequency questionnaire for collegiate athletes. J. Epidemiol. 2016, 26, 284–291. [Google Scholar] [CrossRef] [PubMed]
- Braakhuis, A.J.; Hopkins, W.G.; Lowe, T.E.; Rush, E.C. Development and validation of a food-frequency questionnaire to assess shortterm antioxidant intake in athletes. Int. J. Sport Nutr. Exerc. Metab. 2011, 21, 105–112. [Google Scholar] [CrossRef] [PubMed]
- Rogerson, D. Vegan diets: Practical advice for athletes and exercisers. J. Int. Soc. Sports Nutr. 2017, 14, 36. [Google Scholar] [CrossRef]
- Boullosa, D.; Esteve-Lanao, J.; Casado, A.; Peyré-Tartaruga, L.A.; Gomes da Rosa, R.; Del Coso, J. Factors affecting training and physical performance in recreational endurance runners. Sports 2020, 8, 35. [Google Scholar] [CrossRef]
- Waśkiewicz, Z.; Kłapcińska, B.; Sadowska-Krępa, E.; Czuba, M.; Kempa, K.; Kimsa, E.; Gerasimuk, D. Acute metabolic responses to a 24-h ultra-marathon race in male amateur runners. Eur. J. Appl. Physiol. 2012, 112, 1679–1688. [Google Scholar] [CrossRef] [PubMed]
- O’Connor, P.J. Pain during a marathon run: Prevalence and correlates in a cross-sectional study of 1251 recreational runners in 251 marathons. Front. Sports Act. Living. 2021, 3, 630584. [Google Scholar] [CrossRef] [PubMed]
- Wirnitzer, K.; Motevalli, M.; Tanous, D.; Gregori, M.; Wirnitzer, G.; Leitzmann, C.; Hill, L.; Rosemann, T.; Knechtle, B. Supplement intake in half-marathon, (ultra-)marathon and 10-km runners—Results from the NURMI study (Step 2). J. Int. Soc. Sports Nutr. 2021, 18, 75. [Google Scholar] [CrossRef]
- Turner-McGrievy, G.M.; Moore, W.J.; Barr-Anderson, D. The Interconnectedness of diet choice and distance running: Results of the Research Understanding the NutritioN of Endurance Runners (RUNNER) Study. Int. J. Sport Nutr. Exerc. Metab. 2016, 26, 205–211. [Google Scholar] [CrossRef] [PubMed]
- Thompson, M.A. Physiological and biochemical mechanisms of distance specific human running performance. Integ. Comp. Biol. 2017, 57, 293–300. [Google Scholar] [CrossRef] [PubMed]
- Wardle, J.; Haase, A.M.; Steptoe, A.; Nillapun, M.; Jonwutiwes, K.; Bellisle, F. Gender differences in food choice: The contribution of health beliefs and dieting. Ann. Behav. Med. 2004, 27, 107–116. [Google Scholar] [CrossRef]
- Motevalli, M.; Wagner, K.-H.; Leitzmann, C.; Tanous, D.; Wirnitzer, G.; Knechtle, B.; Wirnitzer, K. Female endurance runners have a healthier diet than males—Results from the NURMI Study (Step 2). Nutrients 2022, 14, 2590. [Google Scholar] [CrossRef] [PubMed]
- Margetts, B.; Martine, J.A.; Saba, A.; Holm, L.; Kearney, M. Definitions of “healthy” eating: A pan-EU survey of consumer attitudes to food, nutrition and health. Eur. J. Clin. Nutr. 1997, 51, 23–29. [Google Scholar]
- Davy, S.R.; Benes, B.A.; Driskell, J.A. Sex differences in dieting trends, eating habits, and nutrition beliefs of a group of Midwestern college students. J. Am. Diet Assoc. 2006, 106, 1673–1677. [Google Scholar] [CrossRef]
- Martinsen, M.; Bratland-Sanda, S.; Eriksson, A.K.; Sundgot-Borgen, J. Dieting to win or to be thin? A study of dieting and disordered eating among adolescent elite athletes and non-athlete controls. Br. J. Sports Med. 2010, 44, 70–76. [Google Scholar] [CrossRef]
- Tapsell, L.C.; Neale, E.P.; Satija, A.; Hu, F.B. Foods, nutrients, and dietary patterns: Interconnections and implications for dietary guidelines. Adv. Nutr. 2016, 7, 445–454. [Google Scholar] [CrossRef] [PubMed]
- Mata, F.; Valenzuela, P.L.; Gimenez, J.; Tur, C.; Ferreria, D.; Domínguez, R.; Sanchez-Oliver, A.J.; Martínez Sanz, J.M. Carbohydrate availability and physical performance: Physical overview and practical recommendations. Nutrients 2019, 11, 1084. [Google Scholar] [CrossRef] [PubMed]
- Volek, J.S.; Noakes, T.; Phinney, S.D. Rethinking fat as a fuel for endurance exercise. Eur. J. Sport Sci. 2015, 15, 13–20. [Google Scholar] [CrossRef] [PubMed]
- Tarnopolsky, M. Protein requirements for endurance athletes. Nutrition 2004, 20, 662–668. [Google Scholar] [CrossRef]
- Moss, K.; Zhang, Y.; Kreutzer, A.; Graybeal, A.J.; Porter, R.R.; Braun-Trocchio, R.; Shah, M. The relationship between dietary intake and sleep quality in endurance athletes. Front. Sports Act. Living 2022, 4, 810402. [Google Scholar] [CrossRef] [PubMed]
- Baranauskas, M.; Stukas, R.; Tubelis, L.; Žagminas, K.; Šurkienė, G.; Švedas, E.; Giedraitis, V.R.; Dobrovolskij, V.; Abaravičius, J.A. Nutritional habits among high-performance endurance athletes. Medicina 2015, 51, 351–362. [Google Scholar] [CrossRef]
- Mahoney, S.E.; Carnes, A.D.; Wójcicki, T.R.; Frith, E.; Ferry, K. Habitual dietary intake among recreational ultra-marathon runners: Role of macronutrients on performance. J. Food Nutr. Res. 2016, 4, 205–209. [Google Scholar]
- Rodriquez, N.R.; DiMarco, N.M.; Langley, S. Position of the American Dietetic Association, dietitians of Canada, and the American College of Sports Medicine: Nutrition and athletic performance. Med. Sci. Sports Exerc. 2009, 41, 709–731. [Google Scholar]
- Kreider, R.B.; Wilborn, C.D.; Taylor, L.; Campbell, B.; Almada, A.A.; Collins, R.; Cooke, M.; Earnest, C.P.; Greenwood, M.; Kalman, D.S.; et al. Exercise and sport nutrition review: Research and recommendations. Int. J. Soc. Sports Nutr. 2010, 2, 7–17. [Google Scholar] [CrossRef] [Green Version]
- Williams, C.; Rollo, I. Carbohydrate nutrition and team sport performance. Sports Med. 2015, 45, S13–S22. [Google Scholar] [CrossRef]
- Burke, L.M.; Hawley, J.A.; Wong, S.H.; Jeukendrup, A.E. Carbohydrates for training and competition. J. Sports Sci. 2011, 29, S17–S27. [Google Scholar] [CrossRef] [PubMed]
- Goulet, E.D. Dehydration and endurance performance in competitive athletes. Nutr Rev. 2012, 70, S132–S136. [Google Scholar] [CrossRef] [PubMed]
- Uchizawa, A.; Funayama, A.; Osumi, H.; Enomoto, Y.; Zhang, S.; Tokuyama, K.; Omi, N.; Sagayama, H. Food quotient assessments using one-week dietary records and food frequency questionnaires of young Japanese runners. J. Nutr. Sci. Vitaminol. 2022, 68, 47–54. [Google Scholar] [CrossRef]
- Wirnitzer, K.; Motevalli, M.; Tanous, D.; Wirnitzer, G.; Leitzmann, C.; Pichler, R.; Rosemann, T.; Knechtle, B. Who is running in the D-A-CH countries? An epidemiological approach of 2455 omnivorous, vegetarian, and vegan recreational runners—Results from the NURMI Study (Step 1). Nutrients 2022, 14, 677. [Google Scholar] [CrossRef] [PubMed]
- McLeman, L.A.; Ratcliffe, K.; Clifford, T. Pre- and post-exercise nutritional practices of amateur runners in the UK: Are they meeting the guidelines for optimal carbohydrate and protein intakes? Sport Sci. Health 2019, 15, 511–517. [Google Scholar] [CrossRef]
- Walsh, V.R. Health beliefs and practices of runners versus nonrunners. Nurs. Res. 1985, 34, 353–356. [Google Scholar] [CrossRef]
- Desbrow, B.; Slater, G.; Cox, G.R. Sports nutrition for the recreational athlete. Aust. J. Gen. Pract. 2020, 49, 17–22. [Google Scholar] [CrossRef] [PubMed]
- Beis, L.Y.; Willkomm, L.; Ross, R.; Bekele, Z.; Wolde, B.; Fudge, B.; Pitsiladis, Y.P. Food and macronutrient intake of elite Ethiopian distance runners. J. Int. Soc. Sports Nutr. 2011, 8, 7. [Google Scholar] [CrossRef]
- Gillen, J.B.; Trommelen, J.; Wardenaar, F.C.; Brinkmans, N.Y.J.; Versteegen, J.J.; Jonvik, K.L.; Kapp, C.; de Vries, J.; van den Borne, J.J.G.C.; Gibala, M.J.; et al. Dietary protein intake and distribution patterns of well-trained Dutch athletes. Int. J. Sport Nutr. Exerc. Metab. 2017, 27, 105–114. [Google Scholar] [CrossRef]
- Health Canada. Canada’s Food Guide. Available online: https://food-guide.canada.ca/en/ (accessed on 13 July 2021).
- Vatanparast, H.; Islam, N.; Shafiee, M.; Ramdath, D.D. Increasing plant-based meat alternatives and decreasing red and processed meat in the diet differentially affect the diet quality and nutrient intakes of Canadians. Nutrients 2020, 12, 2034. [Google Scholar] [CrossRef]
- Grzymisławska, M.; Puch, E.A.; Zawada, A.; Grzymisławski, M. Do nutritional behaviors depend on biological sex and cultural gender? Adv. Clin. Exp. Med. 2020, 29, 165–172. [Google Scholar] [CrossRef]
- Petroczi, A.; Naughton, D.P. The age-gender-status profile of high performing athletes in the UK taking nutritional supplements: Lessons for the future. J. Int. Soc. Sports Nutr. 2008, 5, 2. [Google Scholar] [CrossRef]
- Jenner, S.L.; Buckley, G.L.; Belski, R.; Devlin, B.L.; Forsyth, A.K. Dietary intakes of professional and semi-professional team sport athletes do not meet sport nutrition recommendations-a systematic literature review. Nutrients 2019, 11, 1160. [Google Scholar] [CrossRef]
- Varì, R.; Scazzocchio, B.; D’Amore, A.; Giovannini, C.; Gessani, S.; Masella, R. Gender-related differences in lifestyle may affect health status. Ann. Ist. Super Sanita. 2016, 52, 158–166. [Google Scholar] [PubMed]
- Julia, C.; Martinez, L.; Allès, B.; Touvier, M.; Hercberg, S.; Méjean, C.; Kesse-Guyot, E. Contribution of ultra-processed foods in the diet of adults from the French NutriNet-Santé Study. Public Health Nutr. 2018, 21, 27–37. [Google Scholar] [CrossRef] [PubMed] [Green Version]


| Basic Food Clusters | ||
| Cluster 1 | Grains | |
| a-grains | white bread; white pasta; cornflakes | |
| b-whole grains | wholegrain; mixed bread; muesli; wholegrain pasta; wholegrain rice; other grains | |
| Cluster 2 | Legumes, nuts, and pulses | pulses; legumes; nuts and seeds |
| Cluster 3 | Fruit and vegetables | vegetable juice; vegetables; fruit |
| Cluster 4 | Dairy products | cheese; milk; yogurt |
| Cluster 5 | Dairy alternatives | milk alternatives |
| Cluster 6 | Meat | |
| a-meat | beef; chicken; pork; deer | |
| b-processed meat | hamburger; sausage; fried nuggets; kebab; pork; processed meat | |
| Cluster 7 | Meat alternatives | tofu; tempeh; seitan; etc. |
| Cluster 8 | Fish, shellfish, and seafood | |
| Cluster 9 | Eggs | |
| Cluster 10 | Oils and spreads | butter; margarine; oils |
| Cluster 11 | Sweets and snacks | snacks; sweets; salty snacks |
| Cluster 12 | Water and unsweetened tea | |
| Cluster 13 | Beverages | |
| Cluster 14 | Alcohol | |
| Preparation/Umbrella Clusters | ||
| Cluster 15 | Protein | |
| a-plant protein | legumes and beans; grains (couscous, quinoa); vegetables; dairy alternatives (e.g., soy products); meat alternatives | |
| b-animal protein | eggs; meat and processed meat products; dairy products; fish, seafood, and shellfish | |
| Cluster 16 | (Ultra-)processed foods and free/added sugar | kcal reduced/artificially sweetened drinks; sugary carbonated drinks; fruit juice; free sugar in tea; free sugar in coffee; cereals; sweet and savory spreads; pasta; sweets, cakes, and biscuits; salty snacks, margarine; butter; processed meat; processed plant products |
| Cluster 17 | Free/added sugar | sugary carbonated drinks; fruit juice; free sugar in tea; free sugar in coffee; sweet spread; cereals; sweets, cakes, and biscuits |
| Total n = 211 | 10-km n = 74 | HM n = 83 | M/UM n = 54 | Statistics | ||
|---|---|---|---|---|---|---|
| Age (years) | 38 (IQR 18) | 36 (IQR 17) | 37 (IQR 18) | 43 (IQR 16) | F(2, 208) = 2.89; p = 0.058 | |
| Sex | Females | 57% (121) | 74% (55) | 55% (46) | 37% (20) | χ2(2) = 17.95; p < 0.001 |
| Males | 43% (90) | 26% (19) | 45% (37) | 63% (34) | ||
| Body weight (kg) | 65.0 (IQR 14.1) | 62.1 (IQR 11.7) | 65.0 (IQR 12.3) | 69.3 (IQR 18.4) | F(2, 208) = 5.85; p = 0.003 | |
| Height (m) | 1.7 (IQR 0.1) | 1.7 (IQR 0.1) | 1.7 (IQR 0.1) | 1.8 (IQR 0.1) | F(2, 208) = 5.71; p = 0.004 | |
| BMI (kg/m2) | 21.7 (IQR 3.4) | 21.3 (IQR 3.9) | 21.9 (IQR 3.4) | 22.2 (IQR 2.9) | F(2, 208) = 1.78; p = 0.172 | |
| Marital Status | Divorced/Separated | 5% (11) | 5% (4) | 5% (4) | 6% (3) | χ2(4) = 1.05; p = 0.903 |
| Married/Partner | 68% (143) | 68% (50) | 65% (54) | 72% (39) | ||
| Single | 27% (57) | 27% (20) | 30% (25) | 22% (12) | ||
| Academic Qualification | Upper Secondary | 33% (69) | 23% (17) | 37% (31) | 39% (21) | χ2(6) = 13.40; p = 0.099 |
| A Level or Equivalent | 23% (49) | 30% (22) | 17% (14) | 24% (13) | ||
| University/College | 34% (72) | 42% (31) | 30% (25) | 30% (16) | ||
| No Answer | 9% (21) | 5% (4) | 15% (13) | 7% (4) | ||
| Nationality | Austria | 17% (36) | 18% (13) | 17% (14) | 17% (9) | χ2(6) = 2.47; p = 0.871 |
| Germany | 74% (156) | 74% (55) | 75% (62) | 72% (39) | ||
| Switzerland | 5% (11) | 3% (2) | 6% (5) | 7% (4) | ||
| Other Countries | 4% (8) | 5% (4) | 2% (2) | 4% (2) | ||
| Diet Type | Omnivorous | 45% (95) | 46% (34) | 43% (36) | 37% (20) | χ2(4) = 1.41; p = 0.843 |
| Vegetarian | 19% (40) | 16% (12) | 23% (19) | 17% (9) | ||
| Vegan | 36% (76) | 38% (28) | 34% (28) | 37% (20) | ||
| Motives for Specified Diet Type | Health & Wellbeing | 85% (106) | 74% (32) | 94% (49) | 86% (25) | χ2(2) = 7.46; p = 0.024 |
| Sport Performance | 51% (63) | 42% (18) | 54% (28) | 59% (17) | χ2(2) = 2.28; p = 0.320 | |
| Food Scandals | 35% (44) | 33% (14) | 37% (19) | 38% (11) | χ2(2) = 0.26; p = 0.877 | |
| Animal Ethics | 78% (97) | 77% (33) | 79% (41) | 79% (23) | χ2(2) = 0.09; p = 0.957 | |
| Ecological Aspects | 73% (91) | 74% (32) | 65% (34) | 86% (25) | χ2(2) = 4.17; p = 0.124 | |
| Social Aspects | 49% (61) | 63% (27) | 42% (22) | 41% (12) | χ2(2) = 4.88; p = 0.087 | |
| Economic Aspects | 18% (22) | 21% (9) | 17% (9) | 14% (4) | χ2(2) = 0.62; p = 0.735 | |
| Religion/ Spirituality | 6% (8) | 7% (3) | 6% (3) | 7% (2) | χ2(2) = 0.07; p = 0.966 | |
| Custom/Tradition | 5% (6) | 7% (3) | 4% (2) | 3% (1) | χ2(2) = 0.66 p = 0.719 | |
| Taste & Enjoyment | 44% (54) | 37% (16) | 44% (23) | 52% (15) | χ2(2) = 1.50; p = 0.472 | |
| No Specified Reason | <1% (1) | - | 2% (1) | - | χ2(2) = 1.40; p = 0.498 | |
| 10-km n = 74 | HM n = 83 | M/UM n = 54 | Statistics | |
|---|---|---|---|---|
| Part A—Basic Clusters | ||||
| FC—1: Total of grains | 17.41 ± 7.75 | 18.35 ± 7.85 | 19.00 ± 10.64 | F(2, 208) = 0.49; p = 0.610 |
| FC—1a (Total of refined grains) | 12.02 ± 9.06 | 12.81 ± 8.75 | 12.12 ± 10.10 | F(2, 208) = 0.43; p = 0.651 |
| Cornflakes | 2.41 ± 5.65 | 1.13 ± 3.23 | 0.96 ± 3.00 | F(2, 208) = 2.77; p = 0.065 |
| White bread | 6.92 ± 7.26 | 8.31 ± 8.24 | 8.59 ± 8.40 | F(2, 208) = 0.64; p = 0.530 |
| White pasta | 10.51 ± 9.86 | 11.69 ± 7.90 | 10.44 ± 10.22 | F(2, 208) = 1.10; p = 0.333 |
| FC—1b (Total of whole grains) | 18.57 ± 8.31 | 19.45 ± 8.36 | 21.28 ± 11.38 | F(2, 208) = 1.26; p = 0.286 |
| Muesli | 15.15 ± 12.86 | 16.00 ± 12.66 | 19.28 ± 14.16 | F(2, 206) = 1.44; p = 0.239 |
| Whole grain bread | 14.89 ± 8.18 | 17.41 ± 9.02 | 16.87 ± 10.52 | F(2, 208) = 1.73; p = 0.180 |
| Whole grain pasta | 10.76 ± 9.17 | 9.52 ± 7.44 | 10.33 ± 9.82 | F(2, 208) = 0.22; p = 0.804 |
| Whole grain rice | 7.43 ± 7.99 | 6.29 ± 6.81 | 8.22 ± 7.72 | F(2, 208) = 1.01; p = 0.368 |
| Other whole grains | 6.92 ± 7.26 | 8.31 ± 8.24 | 8.59 ± 8.40 | F(2, 208) = 0.64; p = 0.530 |
| FC—2: Total of beans and seeds | 28.40 ± 14.14 | 24.96 ± 14.22 | 26.01 ± 13.37 | F(2, 208) = 1.48; p = 0.229 |
| Nuts & seeds | 21.81 ± 13.54 | 18.84 ± 13.68 | 17.85 ± 12.19 | F(2, 208) = 1.87; p = 0.157 |
| Legumes | 16.32 ± 11.12 | 14.67 ± 9.27 | 17.07 ± 11.97 | F(2, 208) = 0.52; p = 0.596 |
| FC—3: Total of fruit and vegetables | 34.73 ± 13.60 | 28.98 ± 12.23 | 28.97 ± 12.33 | F(2, 208) = 4.68; p = 0.010 |
| Vegetable juice | 6.70 ± 11.08 | 3.90 ± 8.18 | 6.59 ± 12.66 | F(2, 208) = 0.82; p = 0.440 |
| Fruit | 18.97 ± 10.24 | 18.71 ± 7.69 | 20.17 ± 9.45 | F(2, 208) = 0.37; p = 0.689 |
| Vegetables | 34.78 ± 12.99 | 30.20 ± 11.80 | 28.85 ± 11.27 | F(2, 208) = 4.53; p = 0.012 |
| FC—4: Total of dairy | 10.86 ± 12.16 | 8.74 ± 10.10 | 11.38 ± 11.11 | F(2, 208) = 0.79; p = 0.455 |
| Milk | 8.65 ± 10.66 | 8.43 ± 12.45 | 8.26 ± 11.28 | F(2, 208) = 0.15; p = 0.859 |
| Cheese | 7.91 ± 8.84 | 6.35 ± 7.74 | 8.83 ± 9.18 | F(2, 208) = 1.05; p = 0.353 |
| Yogurt | 8.61 ± 11.66 | 5.46 ± 7.76 | 9.26 ± 11.02 | F(2, 208) = 1.69; p = 0.186 |
| FC—5: Dairy alternatives | 16.11 ± 14.71 | 16.02 ± 15.64 | 16.63 ± 16.07 | F(2, 208) = 0.03; p = 0.969 |
| FC—6: Total of meat | 7.41 ± 11.56 | 8.72 ± 13.08 | 8.30 ± 11.75 | F(2, 208) = 0.27; p = 0.761 |
| FC—6a (Total of unprocessed meat) | 8.05 ± 12.52 | 9.01 ± 13.67 | 9.01 ± 12.67 | F(2, 208) = 0.21; p = 0.808 |
| Chicken | 3.71 ± 6.07 | 3.23 ± 5.60 | 3.67 ± 5.90 | F(2, 208) = 0.07; p = 0.935 |
| Beef, pork, or deer | 6.32 ± 10.54 | 7.98 ± 12.34 | 7.55 ± 11.31 | F(2, 208) = 0.27; p = 0.762 |
| FC—6b (Total of processed meat) | 5.95 ± 10.14 | 7.49 ± 11.88 | 6.68 ± 10.48 | F(2, 208) = 0.17; p = 0.843 |
| Fried nuggets | 1.97 ± 3.30 | 1.76 ± 3.66 | 1.93 ± 3.34 | F(2, 208) = 0.11; p = 0.893 |
| Hamburger | 0.78 ± 2.22 | 0.99 ± 2.24 | 1.15 ± 2.79 | F(2, 208) = 0.32; p = 0.727 |
| Sausage | 0.51 ± 1.93 | 0.99 ± 2.68 | 0.78 ± 2.21 | F(2, 208) = 0.82; p = 0.441 |
| Kebab | 0.65 ± 1.88 | 0.99 ± 2.13 | 0.96 ± 2.20 | F(2, 208) = 0.82; p = 0.442 |
| Other processed meat | 5.76 ± 11.07 | 7.45 ± 12.89 | 6.04 ± 9.65 | F(2, 208) = 0.24; p = 0.784 |
| FC—7: Meat alternatives | 6.17 ± 6.64 | 5.75 ± 6.46 | 6.38 ± 7.05 | F(2, 208) = 0.21; p = 0.807 |
| FC—8: Fish | 5.30 ± 6.82 | 4.29 ± 6.02 | 3.94 ± 5.94 | F(2, 208) = 0.55; p = 0.580 |
| FC—9: Eggs | 8.00 ± 8.70 | 7.11 ± 8.67 | 8.85 ± 9.15 | F(2, 208) = 0.75; p = 0.473 |
| FC—10: Total of oils | 11.65 ± 11.14 | 12.76 ± 13.18 | 13.19 ± 14.83 | F(2, 208) = 0.03; p = 0.969 |
| Butter | 5.49 ± 9.54 | 5.45 ± 11.03 | 7.52 ± 13.28 | F(2, 208) = 0.13; p = 0.877 |
| Margarine | 6.30 ± 9.62 | 7.35 ± 10.59 | 5.81 ± 9.45 | F(2, 208) = 0.66; p = 0.516 |
| Other oils | 5.69 ± 5.59 | 6.35 ± 6.62 | 6.44 ± 7.47 | F(2, 208) = 0.08; p = 0.919 |
| FC—11: Total of snacks | 11.42 ± 7.34 | 10.48 ± 6.81 | 9.97 ± 7.40 | F(2, 208) = 0.77; p = 0.464 |
| Sweet snacks | 10.29 ± 6.09 | 10.07 ± 6.84 | 9.83 ± 6.91 | F(2, 208) = 0.27; p = 0.761 |
| Salty snacks | 7.21 ± 7.80 | 5.90 ± 7.14 | 5.47 ± 6.29 | F(2, 206) = 0.77; p = 0.466 |
| FC—12: Total of water | 34.08 ± 19.93 | 36.20 ± 21.41 | 35.54 ± 22.10 | F(2, 208) = 0.08; p = 0.925 |
| Water | 56.24 ± 26.31 | 61.40 ± 28.42 | 60.89 ± 28.08 | F(2, 208) = 0.92; p = 0.400 |
| Unsweetened tea | 22.92 ± 14.76 | 21.07 ± 17.73 | 20.56 ± 18.18 | F(2, 208) = 1.79; p = 0.170 |
| FC—13: Beverages | 13.60 ± 4.87 | 13.81 ± 5.00 | 14.27 ± 5.08 | F(2, 208) = 0.33; p = 0.718 |
| FC—14: Alcohol | 3.73 ± 4.76 | 3.90 ± 5.15 | 3.50 ± 4.29 | F(2, 208) = 0.09; p = 0.914 |
| Part B—Umbrella Clusters | ||||
| FC—15: Total of protein | 42.40 ± 13.82 | 36.14 ± 14.21 | 39.49 ± 13.42 | F(2, 208) = 4.24; p = 0.016 |
| 15a (Plant protein) | 35.73 ± 14.52 | 31.35 ± 14.99 | 31.98 ± 14.13 | F(2, 208) = 2.38; p = 0.095 |
| FC—15b (Animal protein) | 15.67 ± 15.35 | 14.40 ± 15.13 | 16.29 ± 14.85 | F(2, 208) = 0.20; p = 0.822 |
| FC—16: Processed foods & free/added sugar | 25.05 ± 12.64 | 28.13 ± 15.47 | 25.00 ± 14.79 | F(2, 208) = 1.34; p = 0.264 |
| FC—17: Free/added sugar | 13.98 ± 9.33 | 16.57 ± 10.83 | 12.86 ± 8.60 | F(2, 208) = 2.23; p = 0.110 |
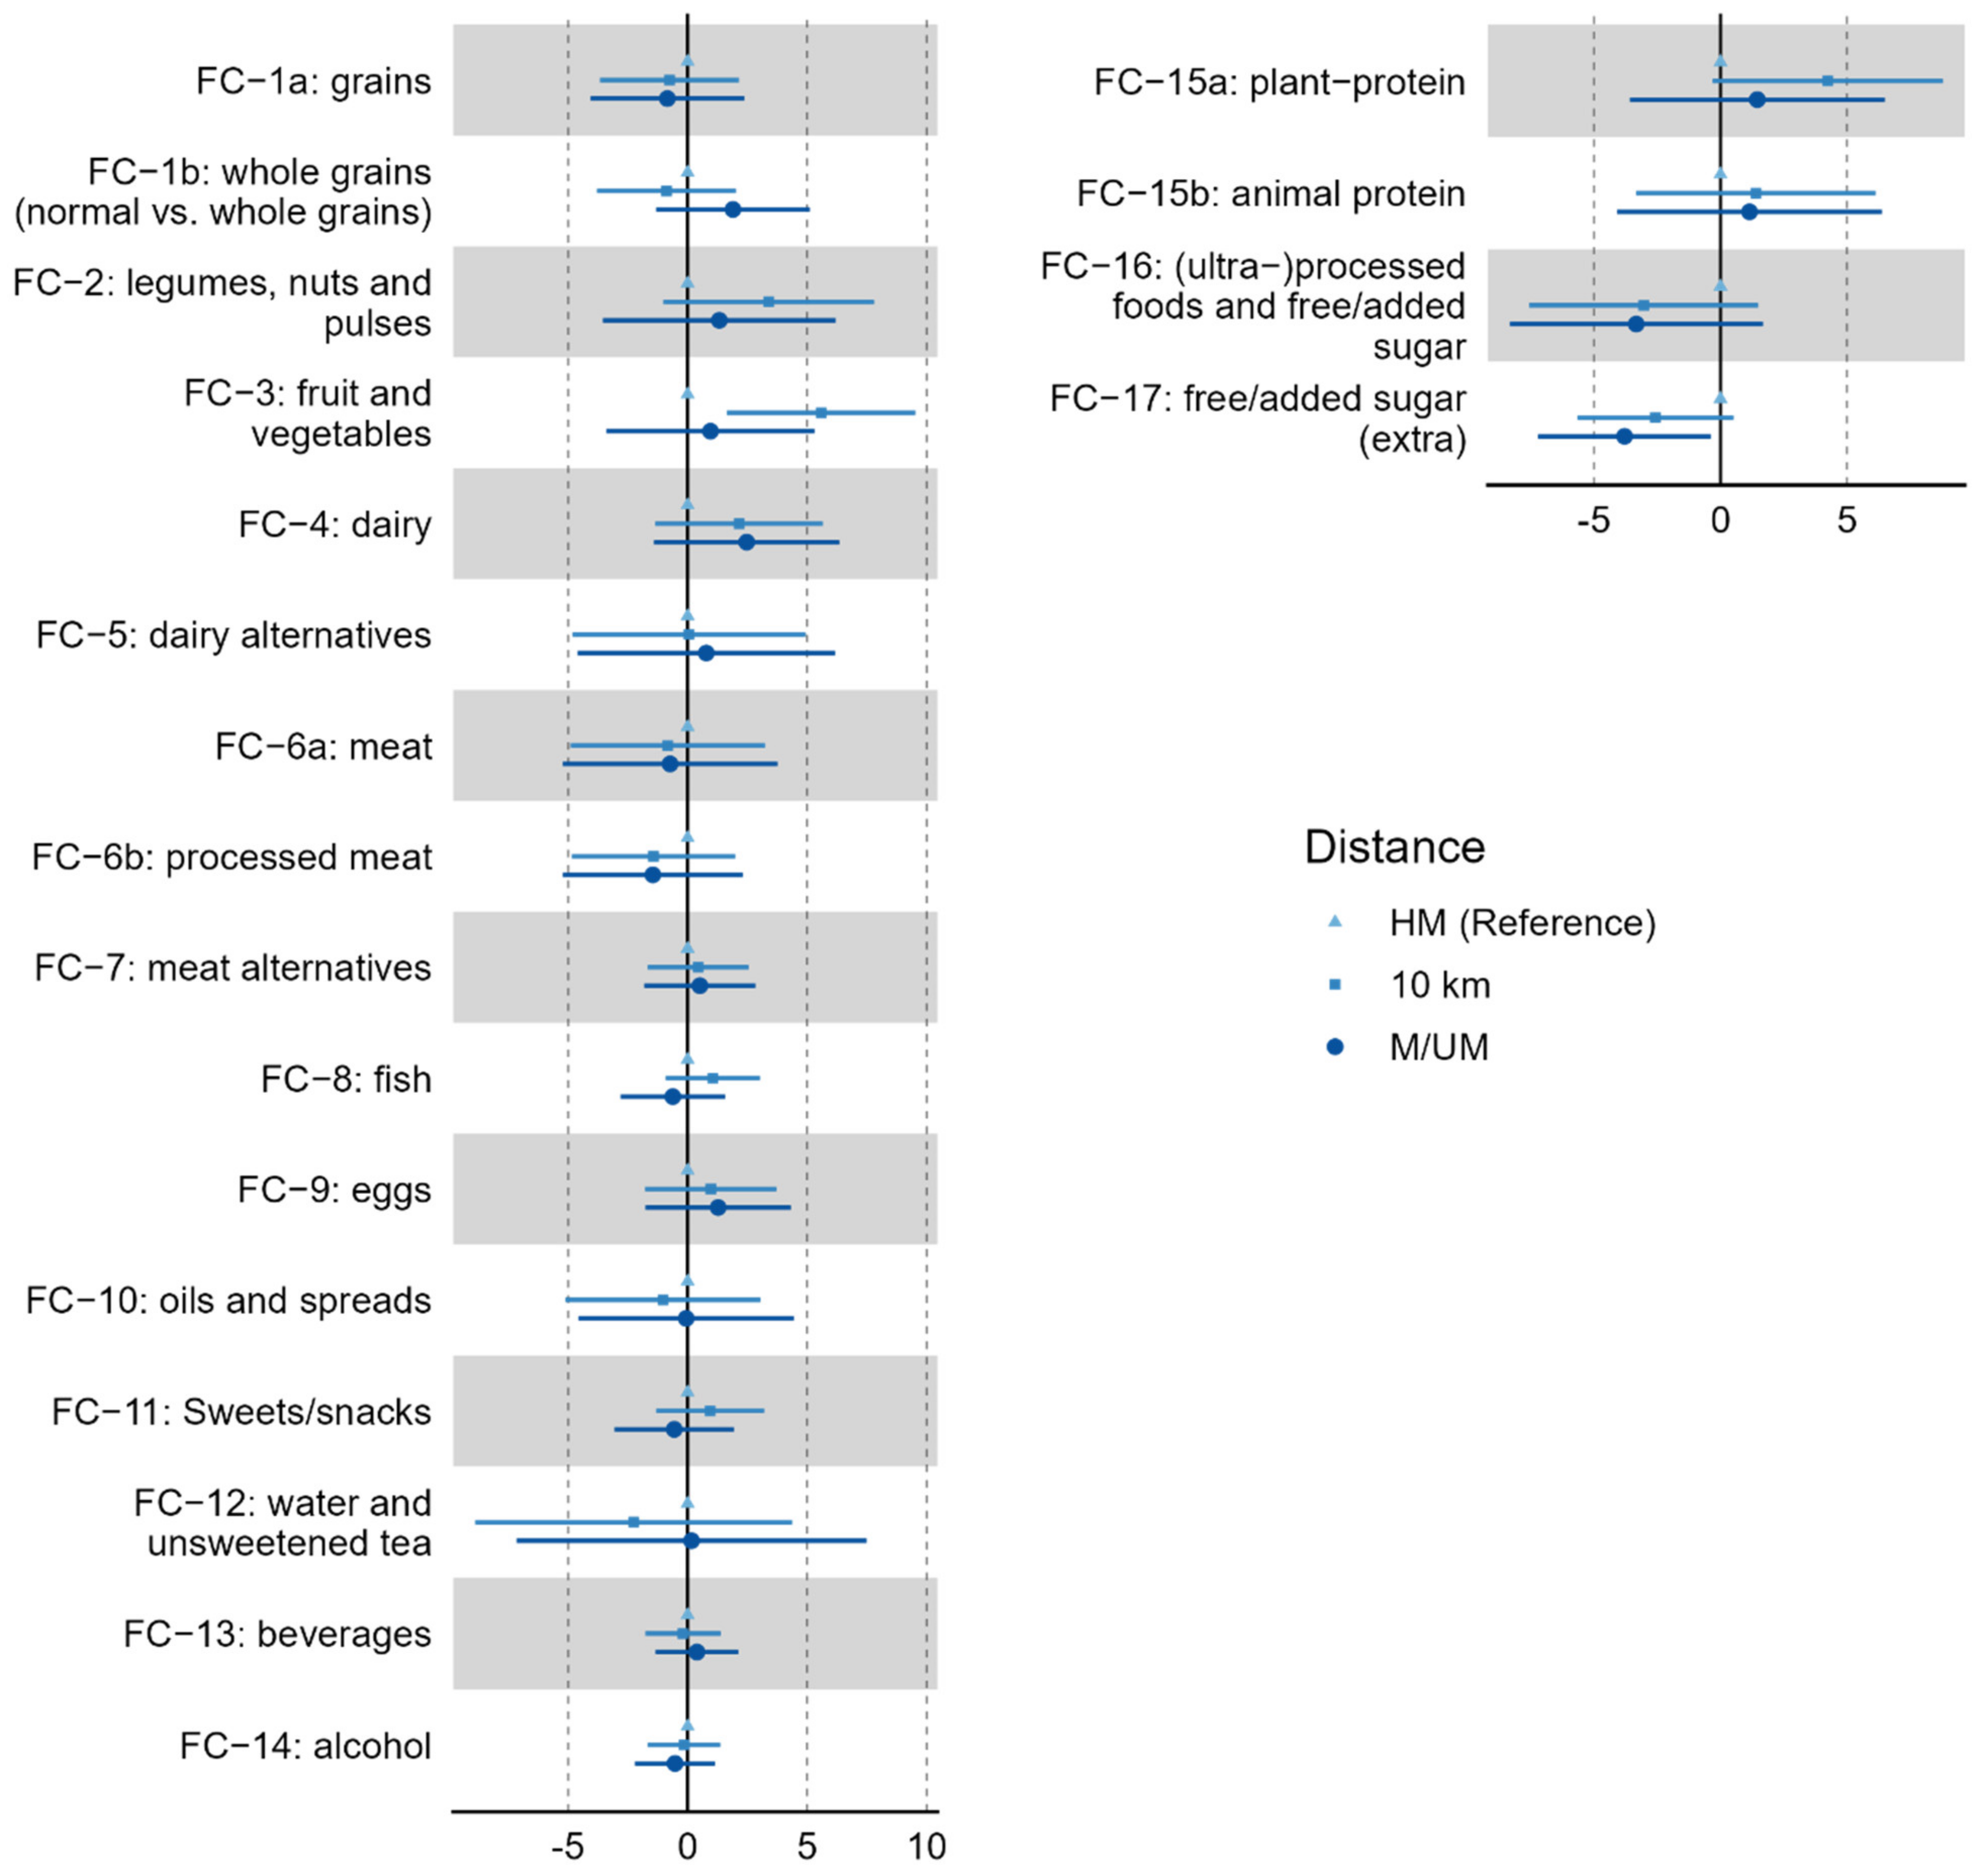
| Age | HM vs. 10-km | HM vs. M/UM | |||||||
|---|---|---|---|---|---|---|---|---|---|
| β | 95%-CI | p | β | 95%-CI | p | β | 95%-CI | p | |
| Part A—Basic Clusters | |||||||||
| FC—1a: Total of refined grains | 0.42 | [1.62, −0.78] | 0.495 | −0.76 | [2.15, −3.67] | 0.608 | −0.85 | [2.37, −4.06] | 0.603 |
| FC—1b: Total of whole grains | −0.17 | [1.03, −1.36] | 0.786 | −0.88 | [2.03, −3.79] | 0.550 | 1.90 | [5.11, −1.32] | 0.246 |
| FC—2: Total of beans and seeds | −0.71 | [1.11, −2.53] | 0.444 | 3.39 | [7.81, −1.02] | 0.131 | 1.33 | [6.20, −3.55] | 0.593 |
| FC—3: Total of fruit and vegetables | −2.46 | [−0.83, −4.09] | 0.003 | 5.58 | [9.53, 1.64] | 0.006 | 0.96 | [5.32, −3.40] | 0.666 |
| FC—4: Total of dairy | 0.42 | [1.87, −1.02] | 0.563 | 2.15 | [5.66, −1.36] | 0.228 | 2.47 | [6.35, −1.41] | 0.211 |
| FC—5: Dairy alternatives | −0.45 | [1.56, −2.46] | 0.661 | 0.05 | [4.93, −4.82] | 0.982 | 0.78 | [6.17, −4.61] | 0.775 |
| FC—6a: Total of unprocessed meat | 1.89 | [3.57, 0.21] | 0.027 | −0.83 | [3.24, −4.90] | 0.688 | −0.74 | [3.76, −5.23] | 0.747 |
| FC—6b: Total of processed meat | 1.65 | [3.05, 0.24] | 0.022 | −1.43 | [1.99, −4.84] | 0.411 | −1.46 | [2.32, −5.23] | 0.448 |
| FC—7: Meat alternatives | 0.31 | [1.17, −0.56] | 0.489 | 0.44 | [2.55, −1.67] | 0.681 | 0.51 | [2.84, −1.82] | 0.665 |
| FC—8: Fish | 0.71 | [1.52, −0.11] | 0.089 | 1.05 | [3.03, −0.92] | 0.294 | −0.62 | [1.56, −2.80] | 0.575 |
| FC—9: Eggs | 1.19 | [2.33, 0.06] | 0.040 | 0.97 | [3.72, −1.79] | 0.489 | 1.28 | [4.32, −1.77] | 0.410 |
| FC—10: Total of oils | 1.23 | [2.91, −0.45] | 0.150 | −1.03 | [3.04, −5.11] | 0.618 | −0.06 | [4.45, −4.57] | 0.979 |
| FC—11: Total of snacks | 0.13 | [1.07, −0.80] | 0.778 | 0.95 | [3.21, −1.31] | 0.410 | −0.56 | [1.94, −3.06] | 0.659 |
| FC—12: Total of water | −2.09 | [0.64, −4.83] | 0.133 | −2.26 | [4.37, −8.89] | 0.503 | 0.16 | [7.49, −7.16] | 0.965 |
| FC—13: Beverages | 0.19 | [0.83, −0.46] | 0.573 | −0.20 | [1.38, −1.77] | 0.807 | 0.39 | [2.13, −1.35] | 0.659 |
| FC—14: Alcohol | 0.33 | [0.96, −0.29] | 0.293 | −0.15 | [1.37, −1.66] | 0.847 | −0.53 | [1.15, −2.20] | 0.535 |
| Part B—Umbrella Clusters | |||||||||
| FC—15a: Plant protein | −2.10 | [−0.22, −3.98] | 0.029 | 4.24 | [8.80, −0.33] | 0.069 | 1.45 | [6.50, −3.59] | 0.571 |
| FC—15b: Animal protein | 1.90 | [3.86, −0.06] | 0.057 | 1.40 | [6.14, −3.34] | 0.561 | 1.15 | [6.39, −4.09] | 0.667 |
| FC—16: Processed foods & free/added sugar | 0.53 | [2.40, −1.34] | 0.578 | −3.04 | [1.49, −7.58] | 0.187 | −3.33 | [1.68, −8.34] | 0.191 |
| FC—17: Free/added sugar | 0.23 | [1.50, −1.05] | 0.724 | −2.57 | [0.52, −5.66] | 0.102 | −3.80 | [−0.38, −7.21] | 0.030 |
Publisher’s Note: MDPI stays neutral with regard to jurisdictional claims in published maps and institutional affiliations. |
© 2022 by the authors. Licensee MDPI, Basel, Switzerland. This article is an open access article distributed under the terms and conditions of the Creative Commons Attribution (CC BY) license (https://creativecommons.org/licenses/by/4.0/).
Share and Cite
Tanous, D.; Wagner, K.-H.; Leitzmann, C.; Motevalli, M.; Wirnitzer, G.; Rosemann, T.; Knechtle, B.; Wirnitzer, K. Dietary Intake of Recreational Endurance Runners Associated with Race Distance—Results from the NURMI Study (Step 2). Nutrients 2022, 14, 3698. https://doi.org/10.3390/nu14183698
Tanous D, Wagner K-H, Leitzmann C, Motevalli M, Wirnitzer G, Rosemann T, Knechtle B, Wirnitzer K. Dietary Intake of Recreational Endurance Runners Associated with Race Distance—Results from the NURMI Study (Step 2). Nutrients. 2022; 14(18):3698. https://doi.org/10.3390/nu14183698
Chicago/Turabian StyleTanous, Derrick, Karl-Heinz Wagner, Claus Leitzmann, Mohamad Motevalli, Gerold Wirnitzer, Thomas Rosemann, Beat Knechtle, and Katharina Wirnitzer. 2022. "Dietary Intake of Recreational Endurance Runners Associated with Race Distance—Results from the NURMI Study (Step 2)" Nutrients 14, no. 18: 3698. https://doi.org/10.3390/nu14183698