

Effects of 10-Day Complete Fasting on Physiological Homeostasis, Nutrition and Health Markers in Male Adults

 , ,
, ,
Abstract
:1. Introduction
2. Materials and Methods
2.1. Participants
2.2. Study Design
2.3. Physiological Parameters and Blood Chemistry
2.4. Anthropometric and Body Composition Measures
2.5. Circumference and Skinfold Thickness Measurements
2.6. Resting Metabolic Rate Analysis
2.7. Statistical Analysis
3. Results
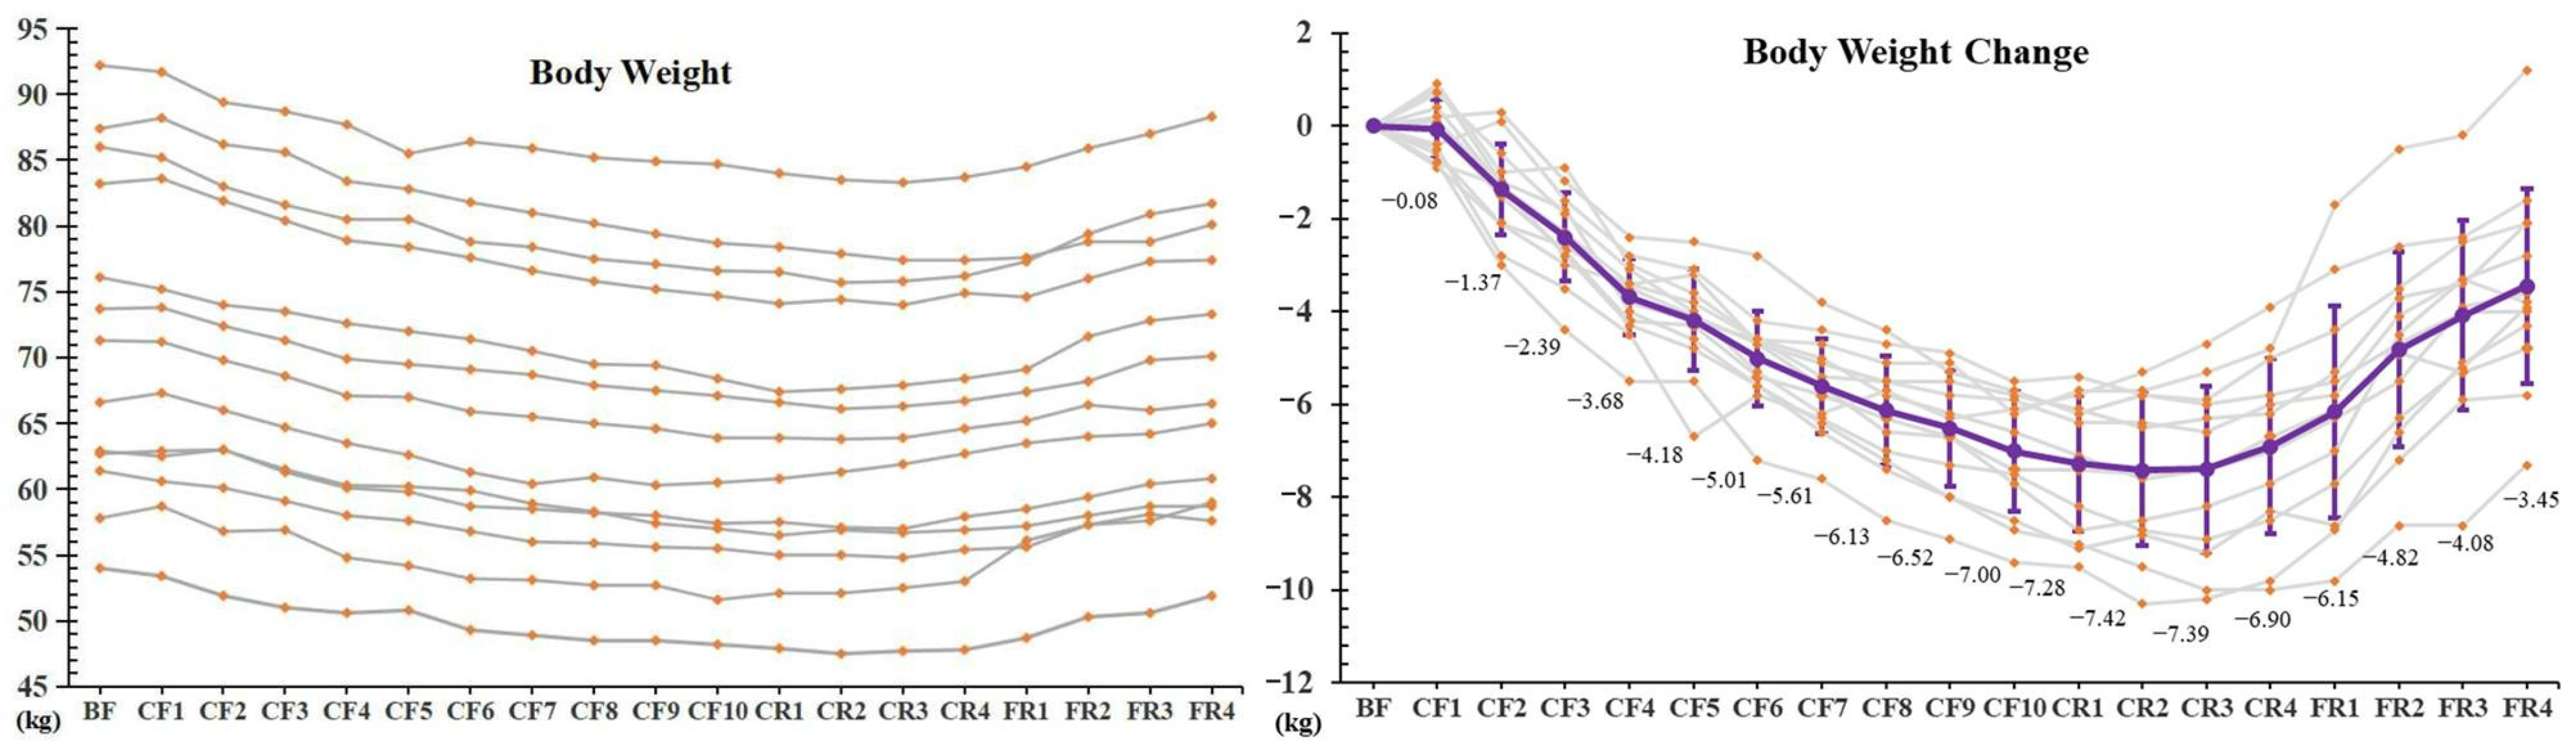
3.1. Body Weight
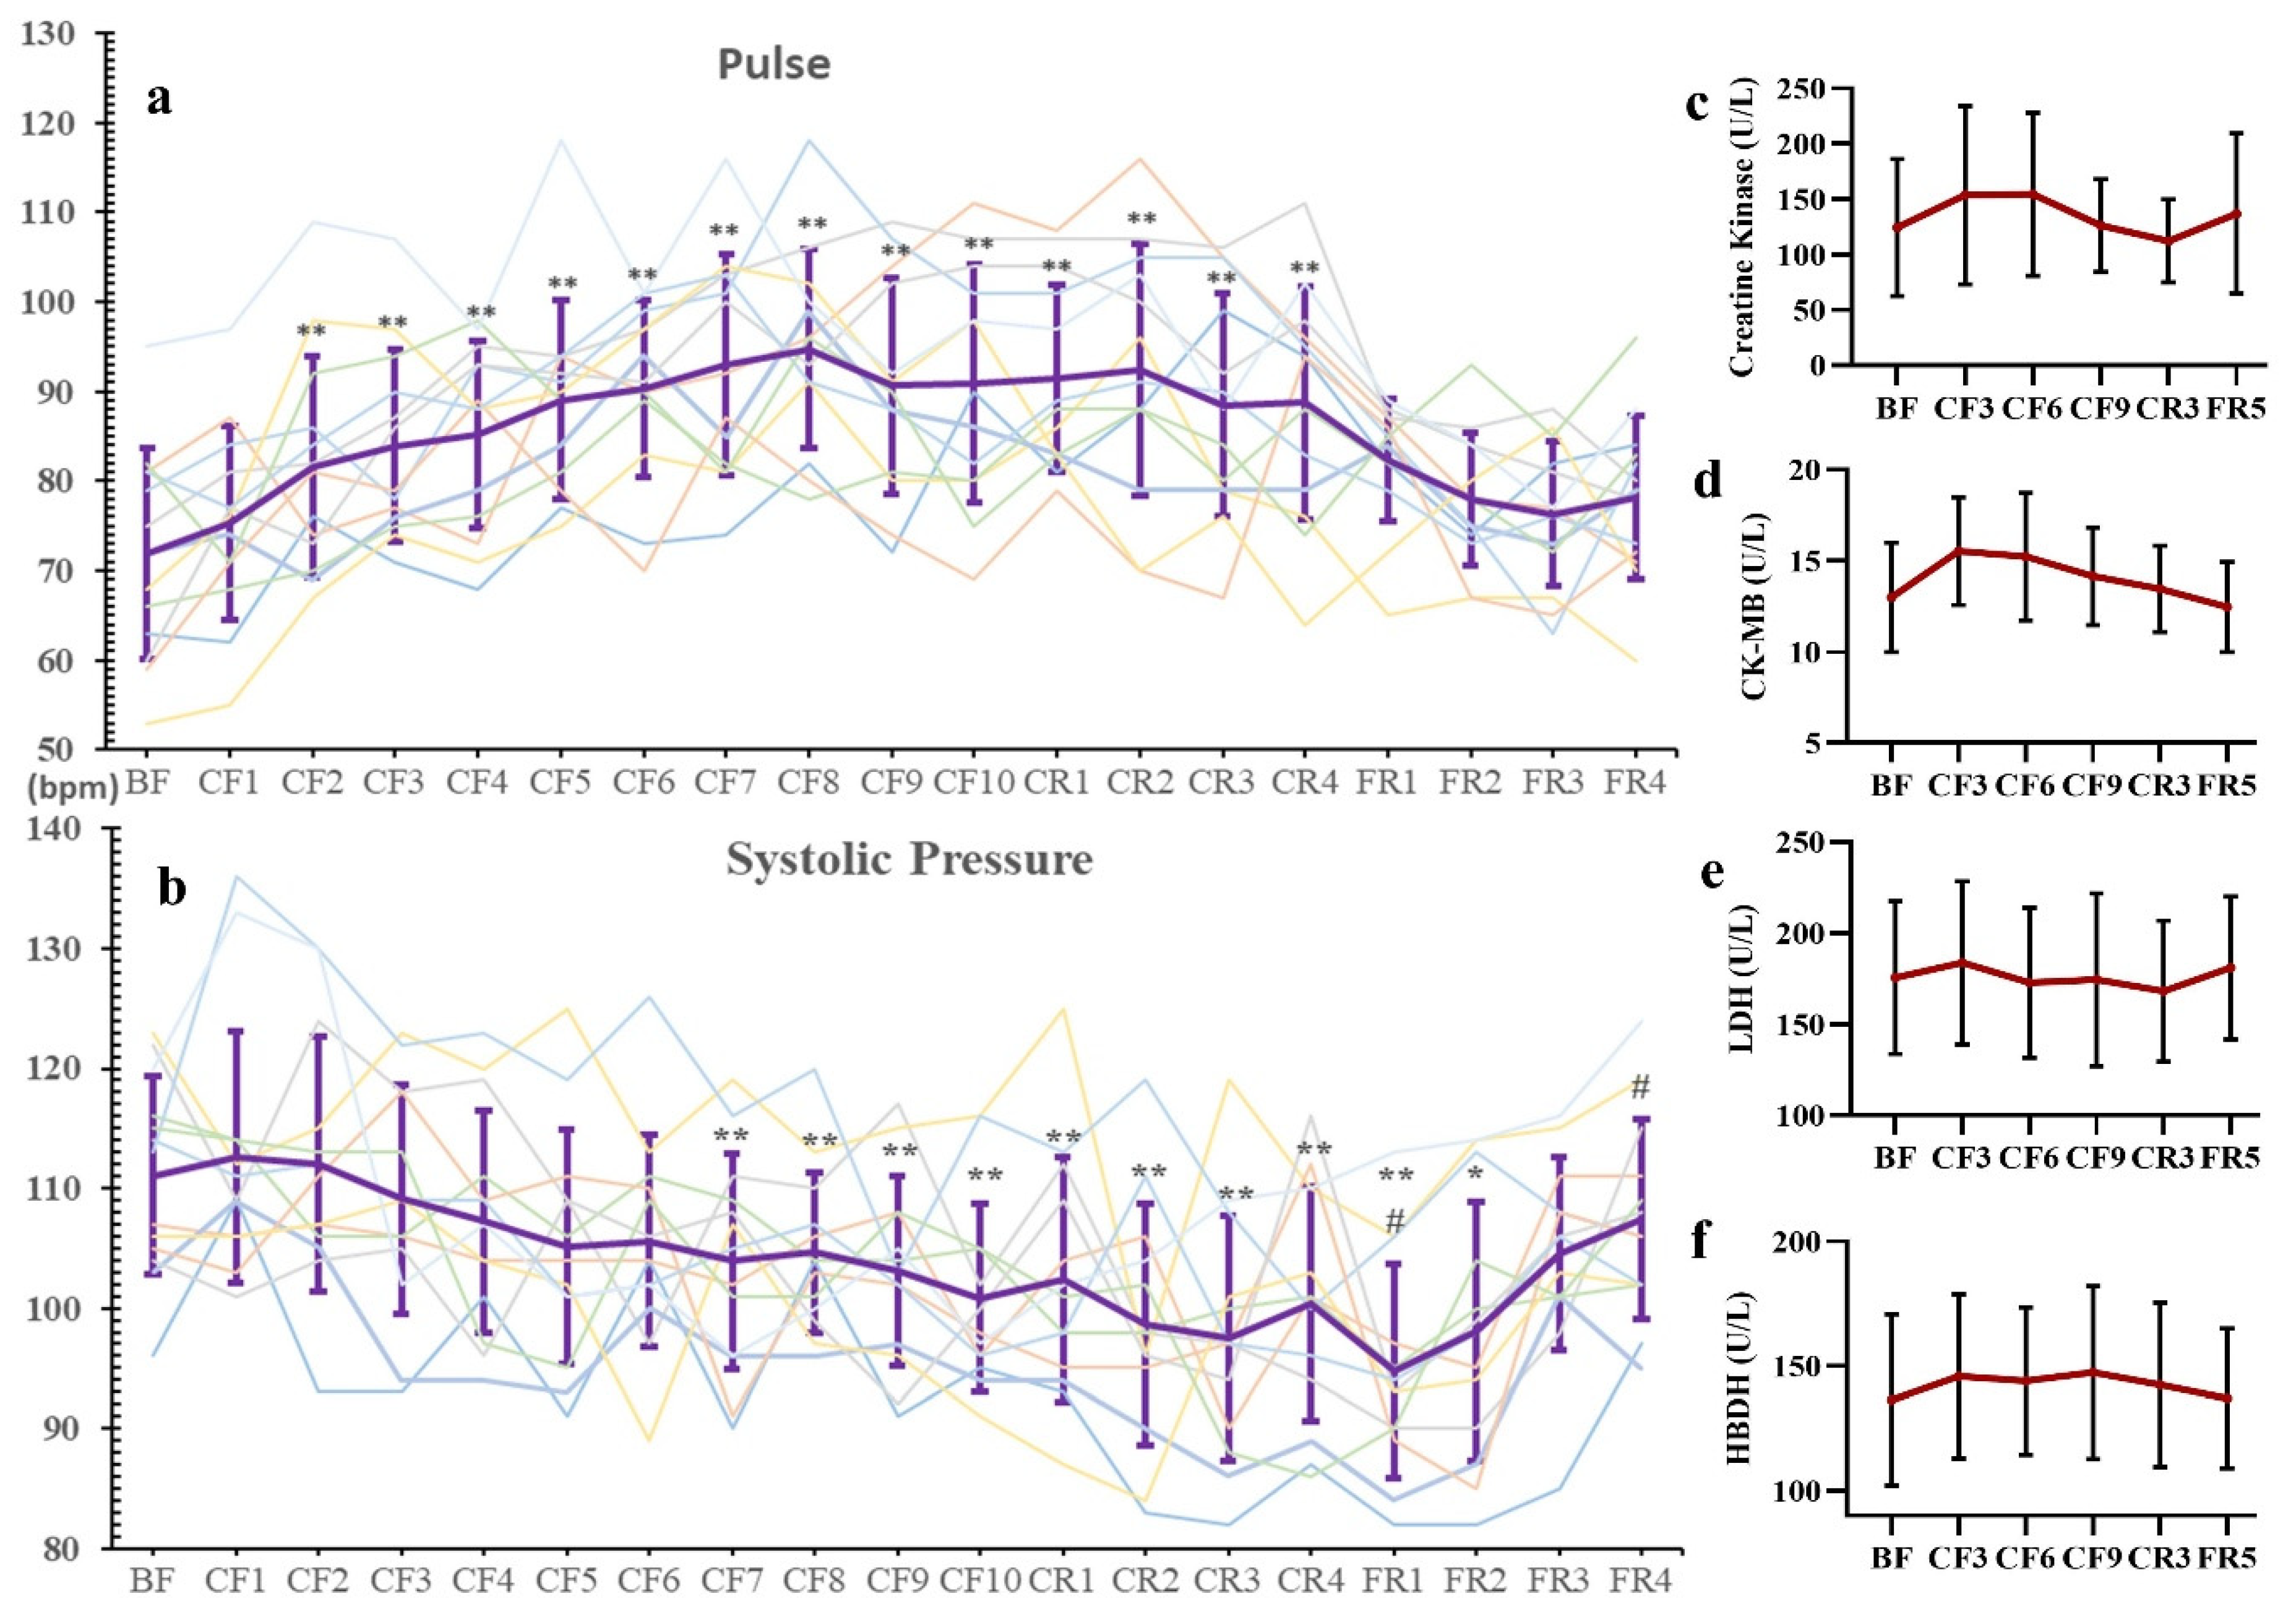
3.2. Blood Pressure, Pulse and Myocardial Enzymograms
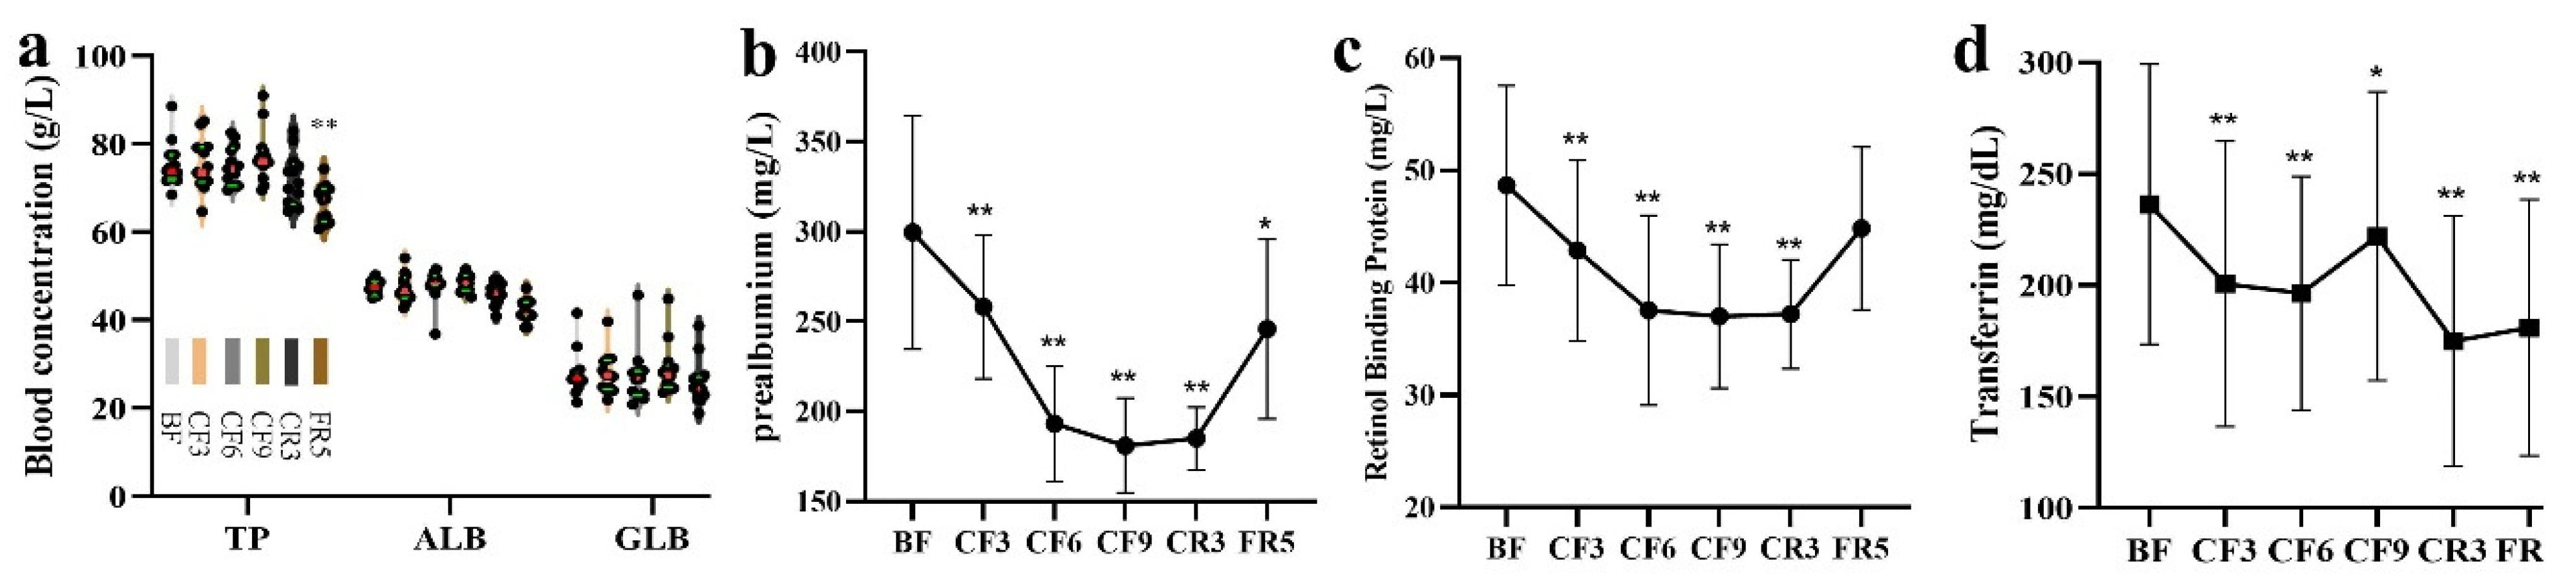
3.3. Blood Routine Index and Nutrition Indicator
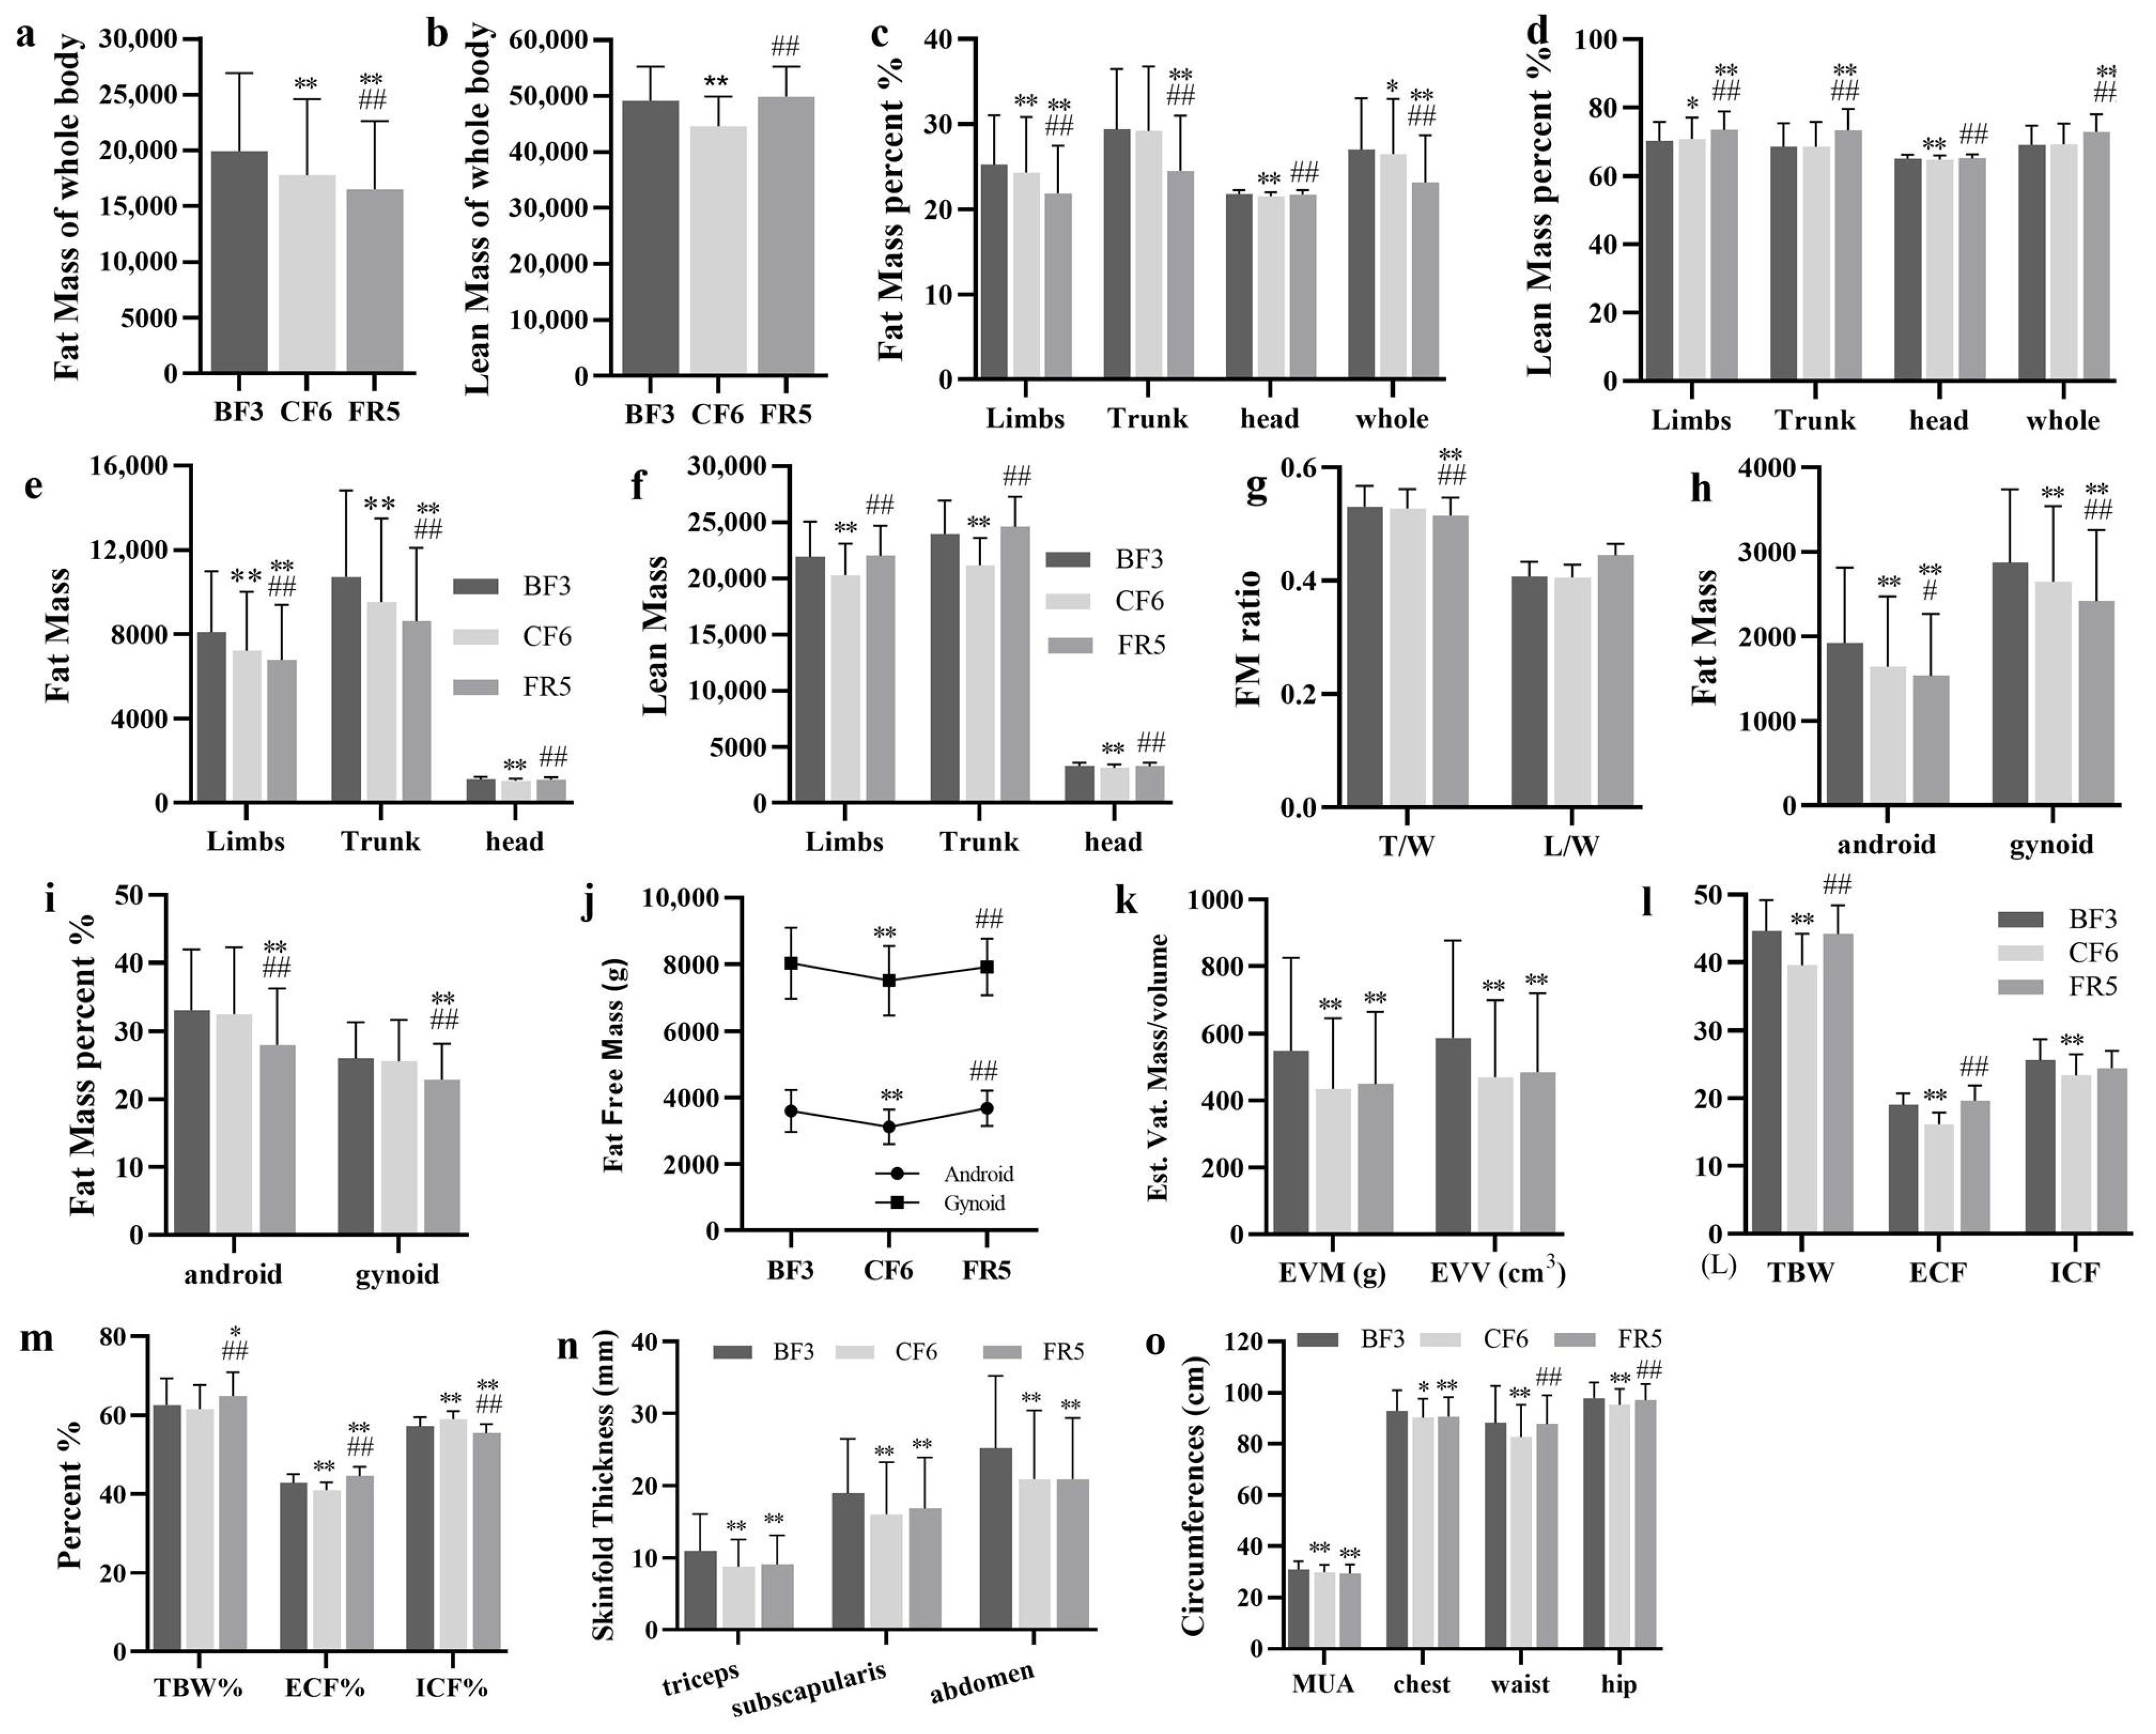
3.4. Body Composition
3.5. Glycometabolism and Lipometabolism
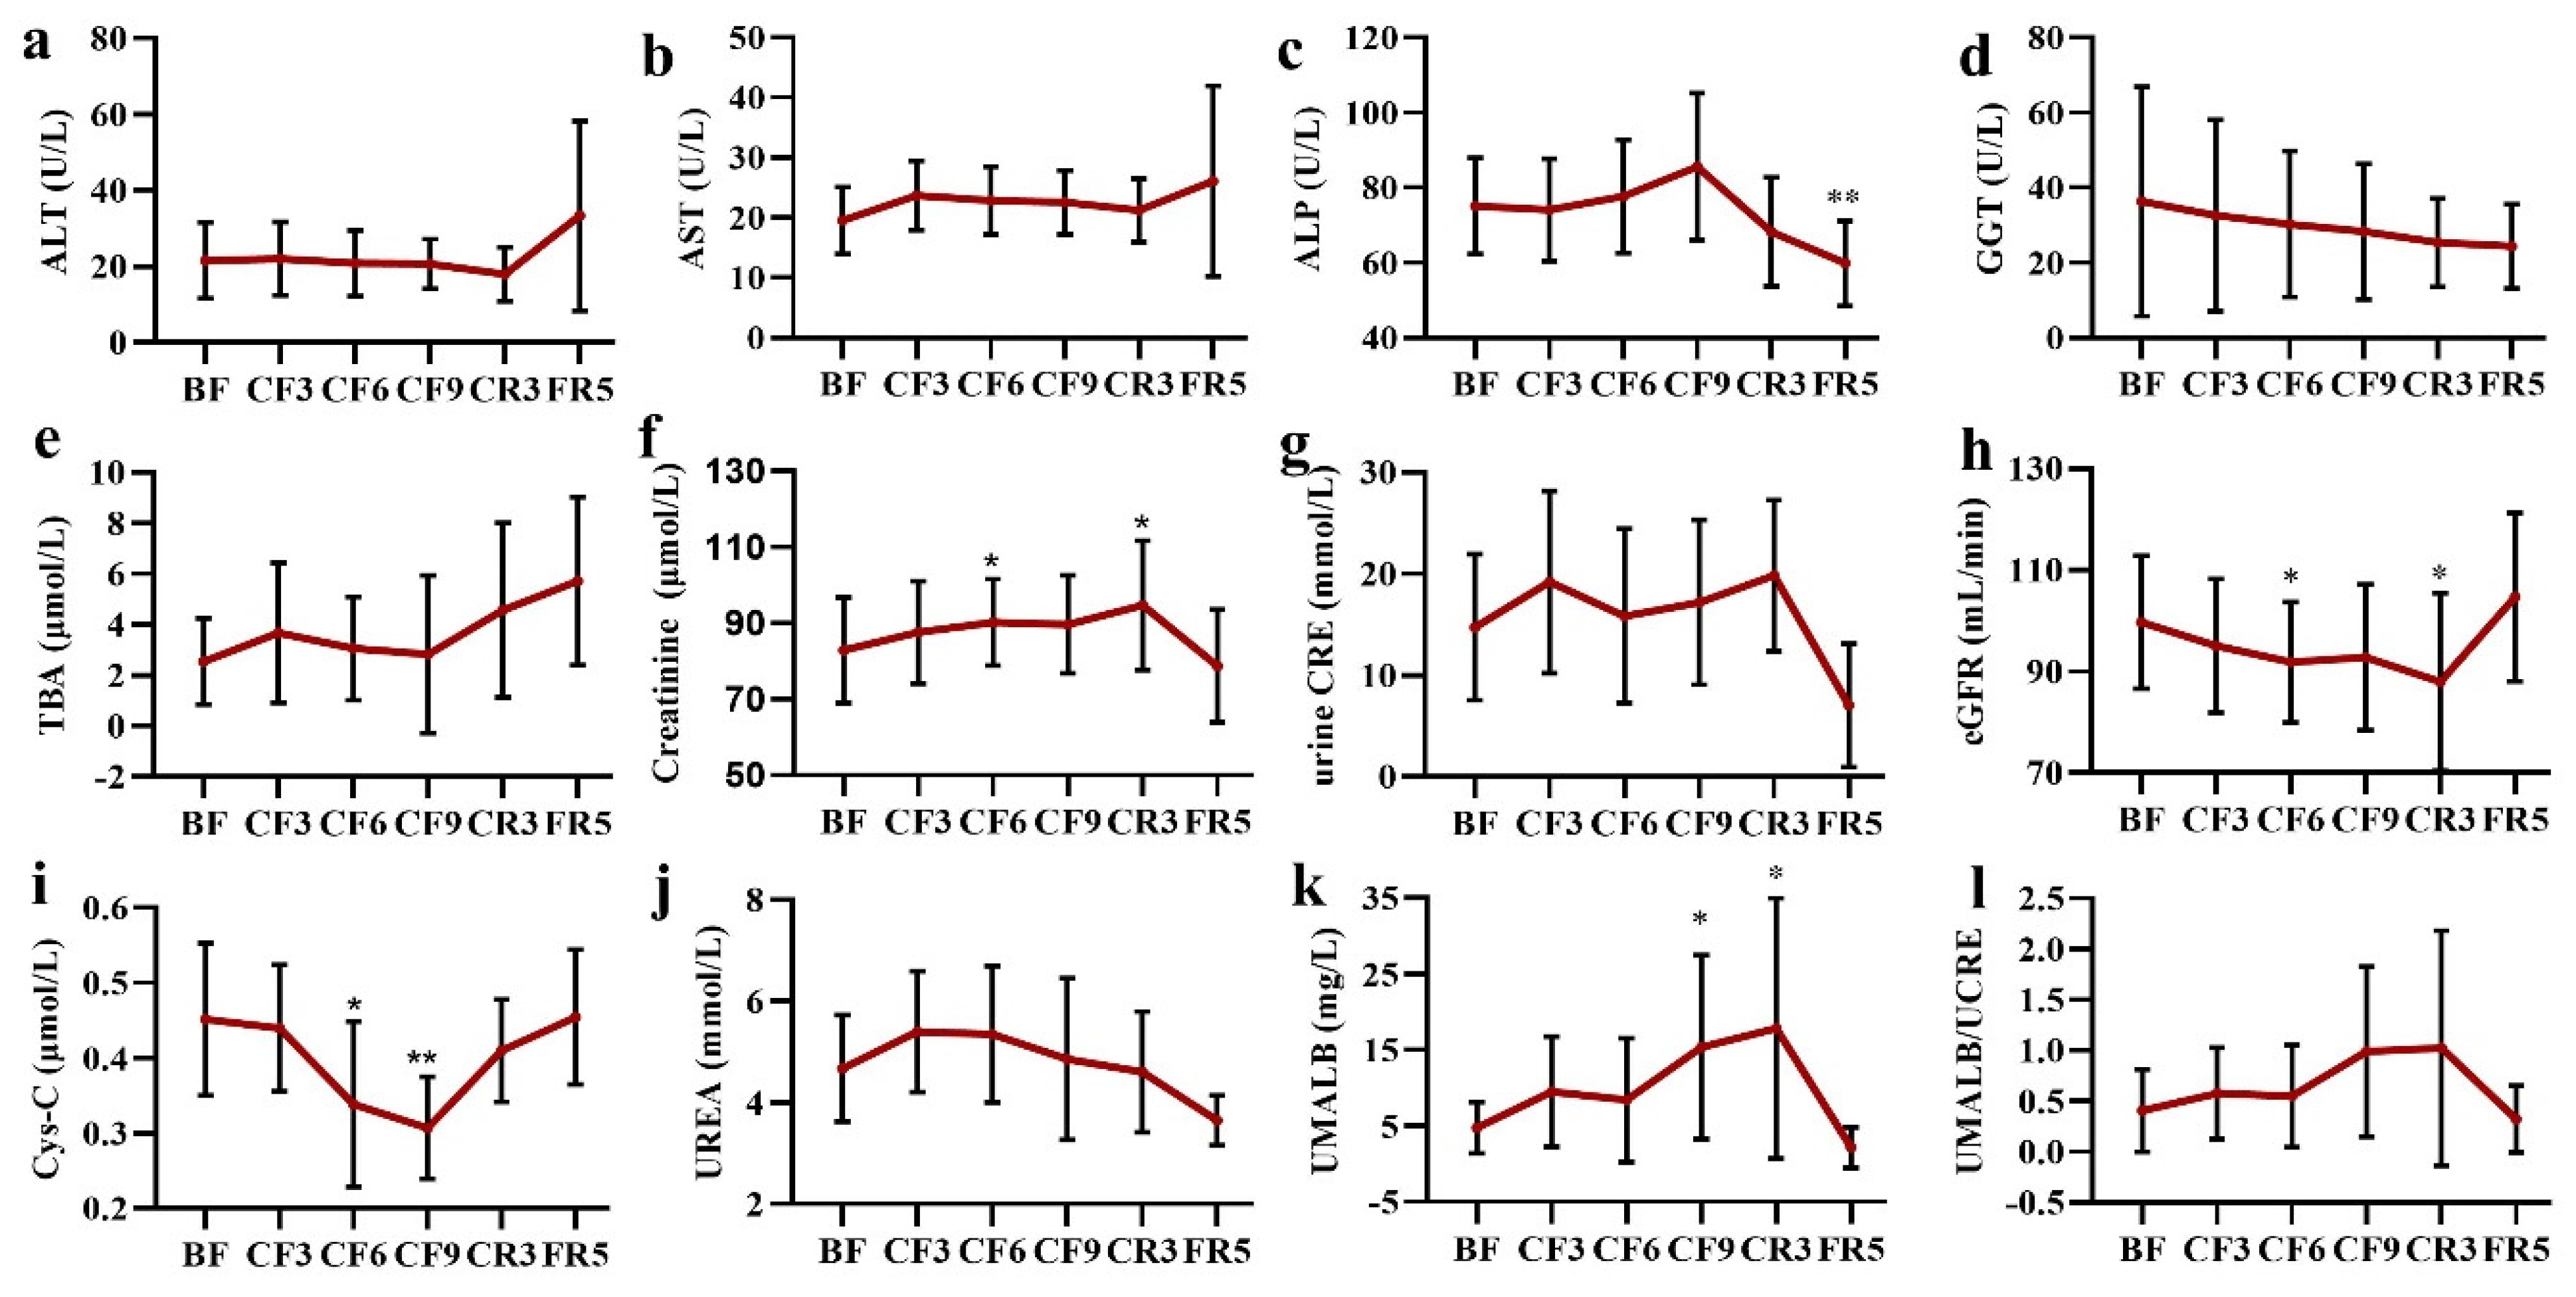
3.6. Liver and Kidney Functions
3.7. Vitamins and Electrolyte Ions
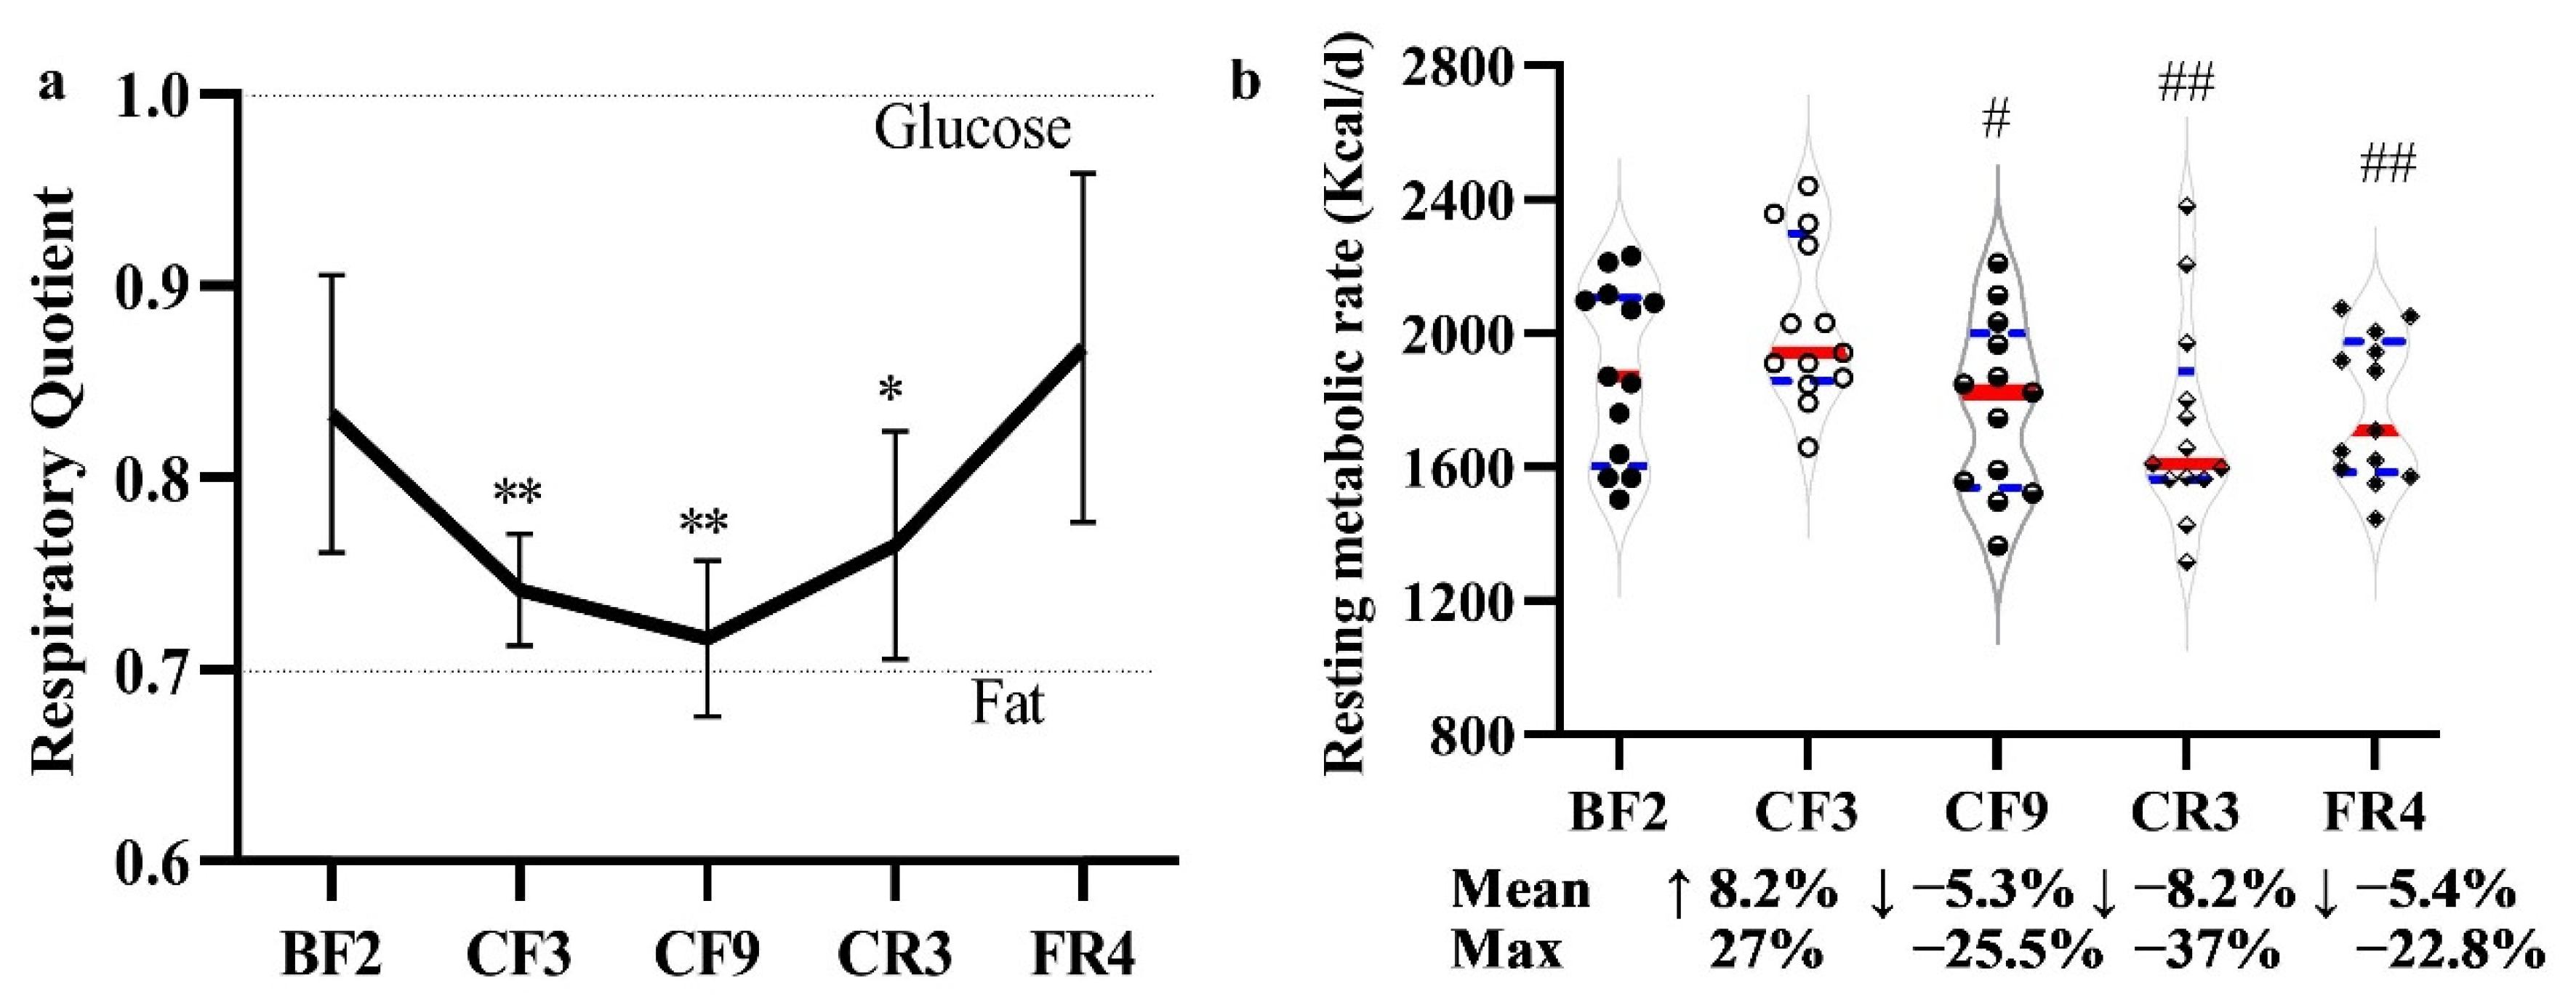
3.8. Resting Metabolic Rate and Respiratory Quotient
4. Discussion
5. Conclusions
Supplementary Materials
Author Contributions
Funding
Institutional Review Board Statement
Informed Consent Statement
Data Availability Statement
Acknowledgments
Conflicts of Interest
References
- Buscemi, S.; Sprini, D.; Grosso, G.; Galvano, F.; Nicolucci, A.; Lucisano, G.; Massenti, F.M.; Amodio, E.; Rini, G.B. Impact of lifestyle on metabolic syndrome in apparently healthy people. Eat. Weight Disord.-Stud. Anorex. Bulim. Obes. 2014, 19, 225–232. [Google Scholar] [CrossRef]
- Deligiorgi, M.V.; Liapi, C.; Trafalis, D.T. How Far Are We from Prescribing Fasting as Anticancer Medicine? Int. J. Mol. Med. 2020, 21, 9175. [Google Scholar] [CrossRef]
- Montesi, L.; Moscatiello, S.; Malavolti, M.; Marzocchi, R.; Marchesini, G. Physical activity for the prevention and treatment of metabolic disorders. Intern. Emerg. Med. 2013, 8, 655–666. [Google Scholar] [CrossRef]
- Longo, V.D.; Mattson, M.P. Fasting: Molecular mechanisms and clinical applications. Cell Metab. 2014, 19, 181–192. [Google Scholar] [CrossRef]
- Crupi, A.N.; Haase, J.; Brandhorst, S.; Longo, V.D. Periodic and Intermittent Fasting in Diabetes and Cardiovascular Disease. Curr. Diabetes Rep. 2020, 20, 83. [Google Scholar] [CrossRef]
- Zhu, S.; Surampudi, P.; Rosharavan, B.; Chondronikola, M. Intermittent fasting as a nutrition approach against obesity and metabolic disease. Curr. Opin. Clin. Nutr. Metab. Care 2020, 23, 387–394. [Google Scholar] [CrossRef]
- Patterson, R.E.; Sears, D.D. Metabolic Effects of Intermittent Fasting. Annu. Rev. Nutr. 2017, 37, 371–393. [Google Scholar] [CrossRef]
- Phillips, M.C.L. Fasting as a Therapy in Neurological Disease. Nutrients 2019, 11, 2501. [Google Scholar] [CrossRef]
- Conley, M.; Le Fevre, L.; Haywood, C.; Proietto, J. Is two days of intermittent energy restriction per week a feasible weight loss approach in obese males? A randomised pilot study. Nutr. Diet. 2018, 75, 65–72. [Google Scholar] [CrossRef]
- Lowe, D.A.; Wu, N.; Rohdin-Bibby, L.; Moore, A.H.; Kelly, N.; Liu, Y.E.; Philip, E.; Vittinghoff, E.; Heymsfield, S.B.; Olgin, J.E.; et al. Effects of Time-Restricted Eating on Weight Loss and Other Metabolic Parameters in Women and Men With Overweight and Obesity: The TREAT Randomized Clinical Trial. JAMA Intern. Med. 2020, 180, 1491–1499. [Google Scholar] [CrossRef]
- Trepanowski, J.F.; Kroeger, C.M.; Barnosky, A.; Klempel, M.C.; Bhutani, S.; Hoddy, K.K.; Gabel, K.; Freels, S.; Rigdon, J.; Rood, J.; et al. Effect of Alternate-Day Fasting on Weight Loss, Weight Maintenance, and Cardioprotection Among Metabolically Healthy Obese Adults: A Randomized Clinical Trial. JAMA Intern. Med. 2017, 177, 930–938. [Google Scholar] [CrossRef]
- Templeman, I.; Smith, H.A.; Chowdhury, E.; Chen, Y.C.; Carroll, H.; Johnson-Bonson, D.; Hengist, A.; Smith, R.; Creighton, J.; Clayton, D.; et al. A randomized controlled trial to isolate the effects of fasting and energy restriction on weight loss and metabolic health in lean adults. Sci. Transl. Med. 2021, 13, eabd8034. [Google Scholar] [CrossRef]
- Antoni, R.; Johnston, K.L.; Collins, A.L.; Robertson, M.D. Effects of intermittent fasting on glucose and lipid metabolism. Proc. Nutr. Soc. 2017, 76, 361–368. [Google Scholar] [CrossRef]
- Wilhelmi de Toledo, F.; Grundler, F.; Sirtori, C.R.; Ruscica, M. Unravelling the health effects of fasting: A long road from obesity treatment to healthy life span increase and improved cognition. Ann. Med. 2020, 52, 147–161. [Google Scholar] [CrossRef]
- Fazeli, P.K.; Zhang, Y.; O’Keefe, J.; Pesaresi, T.; Lun, M.; Lawney, B.; Steinhauser, M.L. Prolonged fasting drives a program of metabolic inflammation in human adipose tissue. Mol. Metab. 2020, 42, 101082. [Google Scholar] [CrossRef]
- van der Crabben, S.N.; Allick, G.; Ackermans, M.T.; Endert, E.; Romijn, J.A.; Sauerwein, H.P. Prolonged fasting induces peripheral insulin resistance, which is not ameliorated by high-dose salicylate. J. Clin. Endocrinol. Metab. 2008, 93, 638–641. [Google Scholar] [CrossRef]
- van Herpen, N.A.; Sell, H.; Eckel, J.; Schrauwen, P.; Mensink, R.P. Prolonged fasting and the effects on biomarkers of inflammation and on adipokines in healthy lean men. Horm. Metab. Res. 2013, 45, 378–382. [Google Scholar] [CrossRef]
- Attinà, A.; Leggeri, C.; Paroni, R.; Pivari, F.; Dei Cas, M.; Mingione, A.; Dri, M.; Marchetti, M.; Di Renzo, L. Fasting: How to Guide. Nutrients 2021, 13, 1570. [Google Scholar] [CrossRef]
- Visioli, F.; Mucignat-Caretta, C.; Anile, F.; Panaite, S.A. Traditional and Medical Applications of Fasting. Nutrients 2022, 14, 433. [Google Scholar] [CrossRef]
- Tinsley, G.M.; La Bounty, P.M. Effects of intermittent fasting on body composition and clinical health markers in humans. Nutr. Rev. 2015, 73, 661–674. [Google Scholar] [CrossRef]
- Cherkas, A.; Golota, S. An intermittent exhaustion of the pool of glycogen in the human organism as a simple universal health promoting mechanism. Med. Hypotheses 2014, 82, 387–389. [Google Scholar] [CrossRef]
- Grajower, M.M.; Horne, B.D. Clinical Management of Intermittent Fasting in Patients with Diabetes Mellitus. Nutrients 2019, 11, 873. [Google Scholar] [CrossRef]
- Murray, B.; Rosenbloom, C. Fundamentals of glycogen metabolism for coaches and athletes. Nutr. Rev. 2018, 76, 243–259. [Google Scholar] [CrossRef]
- Thissen, J.P.; Ketelslegers, J.M.; Underwood, L.E. Nutritional regulation of the insulin-like growth factors. Endocr. Rev. 1994, 15, 80–101. [Google Scholar] [CrossRef]
- Fontana, L.; Weiss, E.P.; Villareal, D.T.; Klein, S.; Holloszy, J.O. Long-term effects of calorie or protein restriction on serum IGF-1 and IGFBP-3 concentration in humans. Aging Cell 2008, 7, 681–687. [Google Scholar] [CrossRef]
- Harder-Lauridsen, N.M.; Rosenberg, A.; Benatti, F.B.; Damm, J.A.; Thomsen, C.; Mortensen, E.L.; Pedersen, B.K.; Krogh-Madsen, R. Ramadan model of intermittent fasting for 28 d had no major effect on body composition, glucose metabolism, or cognitive functions in healthy lean men. Nutrition 2017, 37, 92–103. [Google Scholar] [CrossRef]
- Yang, C.; Ma, Q.; Zhang, H.; Wu, F.; Wu, M.; Yang, C.; Chen, Y.; Xiong, J.; Liu, W.; Wang, H.; et al. Ten days of complete fasting affected subjective sensations but not cognitive abilities in healthy adults. Eur. J. Nutr. 2021, 60, 2747–2758. [Google Scholar] [CrossRef]
- Ma, Q.; Yang, C.; Wu, R.; Wu, M.; Liu, W.; Dai, Z.; Li, Y. How Experiences Affect Psychological Responses During Supervised Fasting: A Preliminary Study. Front. Psychol. 2021, 12, 651760. [Google Scholar] [CrossRef]
- de, V.; Weir, J.B. New methods for calculating metabolic rate with special reference to protein metabolism. J. Physiol. 1949, 109, 1–9. [Google Scholar]
- Judge, A.; Dodd, M.S. Metabolism. Essays Biochem. 2020, 64, 607–647. [Google Scholar] [CrossRef]
- Michalsen, A.; Li, C. Fasting therapy for treating and preventing disease-current state of evidence. Forsch Komplementmed. 2013, 20, 444–453. [Google Scholar] [CrossRef]
- de Toledo, F.W.; Grundler, F.; Bergouignan, A.; Drinda, S.; Michalsen, A. Safety, health improvement and well-being during a 4 to 21-day fasting period in an observational study including 1422 subjects. PLoS ONE 2019, 14, e0209353. [Google Scholar] [CrossRef]
- Goldhamer, A.C.; Lisle, D.J.; Sultana, P.; Anderson, S.V.; Parpia, B.; Hughes, B.; Campbell, T.C. Medically supervised water-only fasting in the treatment of borderline hypertension. J. Altern. Complement. Med. 2002, 8, 643–650. [Google Scholar] [CrossRef]
- Stange, R.; Pflugbeil, C.; Michalsen, A.; Uehleke, B. Therapeutic fasting in patients with metabolic syndrome and impaired insulin resistance. Forsch Komplementmed. 2013, 20, 421–426. [Google Scholar] [CrossRef]
- Lithell, H.; Bruce, A.; Gustafsson, I.B.; Hoglund, N.J.; Karlstrom, B.; Ljunghall, K.; Sjolin, K.; Venge, P.; Werner, I.; Vessby, B. A fasting and vegetarian diet treatment trial on chronic inflammatory disorders. Acta Derm. Venereol. 1983, 63, 397–403. [Google Scholar]
- Mesnage, R.; Grundler, F.; Schwiertz, A.; Le Maho, Y.; Wilhelmi de Toledo, F. Changes in human gut microbiota composition are linked to the energy metabolic switch during 10 d of Buchinger fasting. J. Nutr. Sci. 2019, 8, e36. [Google Scholar] [CrossRef]
- Balasse, E.O.; Fery, F. Ketone body production and disposal: Effects of fasting, diabetes, and exercise. Diabetes Metab. Rev. 1989, 5, 247–270. [Google Scholar] [CrossRef]
- Baba, H.; Zhang, X.J.; Wolfe, R.R. Glycerol gluconeogenesis in fasting humans. Nutrition 1995, 11, 149–153. [Google Scholar]
- Schutz, Y. Protein turnover, ureagenesis and gluconeogenesis. Int. J. Vitam. Nutr. Res. 2011, 81, 101–107. [Google Scholar] [CrossRef]
- Mojto, V.; Gvozdjakova, A.; Kucharska, J.; Rausova, Z.; Vancova, O.; Valuch, J. Effects of complete water fasting and regeneration diet on kidney function, oxidative stress and antioxidants. Bratisl. Lek. Listy 2018, 119, 107–111. [Google Scholar] [CrossRef]
- Tang, L.; Li, L.; Bu, L.; Guo, S.; He, Y.; Liu, L.; Xing, Y.; Lou, F.; Zhang, F.; Wang, S.; et al. Bigu-Style Fasting Affects Metabolic Health by Modulating Taurine, Glucose, and Cholesterol Homeostasis in Healthy Young Adults. J. Nutr. 2021, 151, 2175–2187. [Google Scholar] [CrossRef]
- Li, C.; Sadraie, B.; Steckhan, N.; Kessler, C.; Stange, R.; Jeitler, M.; Michalsen, A. Effects of A One-week Fasting Therapy in Patients with Type-2 Diabetes Mellitus and Metabolic Syndrome—A Randomized Controlled Explorative Study. Exp. Clin. Endocrinol. Diabetes 2017, 125, 618–624. [Google Scholar] [CrossRef]
- Maislos, M.; Khamaysi, N.; Assali, A.; Abou-Rabiah, Y.; Zvili, I.; Shany, S. Marked increase in plasma high-density-lipoprotein cholesterol after prolonged fasting during Ramadan. Am. J. Clin. Nutr. 1993, 57, 640–642. [Google Scholar] [CrossRef]
- Thampy, K.G. Hypercholesterolaemia of prolonged fasting and cholesterol lowering of re-feeding in lean human subjects. Scand. J. Clin. Lab. Investig. 1995, 55, 351–357. [Google Scholar] [CrossRef]
- Grundler, F.; Plonne, D.; Mesnage, R.; Muller, D.; Sirtori, C.R.; Ruscica, M.; Wilhelmi de Toledo, F. Long-term fasting improves lipoprotein-associated atherogenic risk in humans. Eur. J. Nutr. 2021, 60, 4031–4044. [Google Scholar] [CrossRef]
- Kunduraci, Y.E.; Ozbek, H. Does the Energy Restriction Intermittent Fasting Diet Alleviate Metabolic Syndrome Biomarkers? A Randomized Controlled Trial. Nutrients 2020, 12, 3213. [Google Scholar] [CrossRef]
- Savendahl, L.; Underwood, L.E. Fasting increases serum total cholesterol, LDL cholesterol and apolipoprotein B in healthy, nonobese humans. J. Nutr. 1999, 129, 2005–2008. [Google Scholar] [CrossRef]
- Kord, H.V.; Tinsley, G.M.; Santos, H.O.; Zand, H.; Nazary, A.; Fatahi, S.; Mokhtari, Z.; Salehi-Sahlabadi, A.; Tan, S.C.; Rahmani, J.; et al. The influence of fasting and energy-restricted diets on leptin and adiponectin levels in humans: A systematic review and meta-analysis. Clin. Nutr. 2021, 40, 1811–1821. [Google Scholar] [CrossRef]
- Perry, R.J.; Shulman, G.I. The Role of Leptin in Maintaining Plasma Glucose During Starvation. Postdoc J. 2018, 6, 3–19. [Google Scholar] [CrossRef]
- Sanchetee, P.; Sanchetee, P.; Garg, M.K. Effect of Jain Fasting on Anthropometric, Clinical and Biochemical Parameters. Indian J. Endocrinol. Metab. 2020, 24, 187–190. [Google Scholar] [CrossRef]
- Liu, Y.; Li, Q.; Wang, K.; He, R.; Dai, Z.; Zhang, H.; Liu, C.; Ma, Q.; Yuan, Y.; Yang, C.; et al. Effects of long-term fasting and confinement on the cardiovascular activity. Med. Biol. Eng. Comput. 2021, 59, 1901–1915. [Google Scholar] [CrossRef]
- Hammoud, S.; Saad, I.; Karam, R.; Abou Jaoude, F.; van den Bemt, B.J.F.; Kurdi, M. Impact of Ramadan Intermittent Fasting on the Heart Rate Variability and Cardiovascular Parameters of Patients with Controlled Hypertension. J. Nutr. Metab. 2021, 2021, 6610455. [Google Scholar] [CrossRef]
- Al-Jafar, R.; Zografou Themeli, M.; Zaman, S.; Akbar, S.; Lhoste, V.; Khamliche, A.; Elliott, P.; Tsilidis, K.K.; Dehghan, A. Effect of Religious Fasting in Ramadan on Blood Pressure: Results From LORANS (London Ramadan Study) and a Meta-Analysis. J. Am. Heart Assoc. 2021, 10, e021560. [Google Scholar] [CrossRef]
- Harper, S.M.; Drenick, E.J.; Swendseid, M.E. Folic acid and vitamin B 12 nutriture in obese men during prolonged fasting and refeeding. Am. J. Clin. Nutr. 1970, 23, 4–7. [Google Scholar] [CrossRef]
- Savendahl, L.; Mar, M.H.; Underwood, L.E.; Zeisel, S.H. Prolonged fasting in humans results in diminished plasma choline concentrations but does not cause liver dysfunction. Am. J. Clin. Nutr. 1997, 66, 622–625. [Google Scholar] [CrossRef]
- Zychowska, M.; Rola, R.; Borkowska, A.; Tomczyk, M.; Kortas, J.; Anczykowska, K.; Pilis, K.; Kowalski, K.; Pilch, W.; Antosiewicz, J. Fasting and Exercise Induce Changes in Serum Vitamin D Metabolites in Healthy Men. Nutrients 2021, 13, 1963. [Google Scholar] [CrossRef]
- Aksungar, F.B.; Topkaya, A.E.; Akyildiz, M. Interleukin-6, C-reactive protein and biochemical parameters during prolonged intermittent fasting. Ann. Nutr. Metab. 2007, 51, 88–95. [Google Scholar] [CrossRef]


| BF | CF3 | CF6 | CF9 | CR3 | FR5 | |
|---|---|---|---|---|---|---|
| MONO% | 8.16 ± 1.67 | 9.53 ± 2.38 | 9.85 ± 2.86 | 9.90 ± 2.39 * | 8.88 ± 1.54 | 9.37 ± 1.70 |
| MONO (109/L) | 0.47 ± 0.10 | 0.61 ± 0.19 * | 0.58 ± 0.19 | 0.57 ± 0.19 | 0.45 ± 0.12 | 0.49 ± 0.12 |
| NEUT (109/L) | 3.27 ± 1.20 | 3.85 ± 1.73 | 3.33 ± 1.12 | 3.24 ± 1.65 * | 2.44 ± 0.82 * | 2.70 ± 1.02 |
| NEUT% | 53.60 ± 5.92 | 57.15 ± 6.78 | 54.83 ± 6.22 | 51.54 ± 9.25 * | 47.78 ± 7.97 * | 50.21 ± 7.28 |
| RBC (1012/L) | 4.77 ± 0.57 | 4.78 ± 0.58 | 5.03 ± 0.61 | 5.39 ± 0.63 * | 5.08 ± 0.60 | 4.61 ± 0.49 |
| HGB (g/L) | 147.92 ± 14.36 | 148.69 ± 15.30 | 156.62 ± 15.60 | 160.46 ± 14.65 * | 153.08 ± 12.66 | 137.77 ± 13.75 |
| HCT (%) | 43.22 ± 3.51 | 43.35 ± 3.56 | 45.28 ± 3.49 | 47.30 ± 3.40 ** | 44.10 ± 2.67 | 42.25 ± 3.39 |
Publisher’s Note: MDPI stays neutral with regard to jurisdictional claims in published maps and institutional affiliations. |
© 2022 by the authors. Licensee MDPI, Basel, Switzerland. This article is an open access article distributed under the terms and conditions of the Creative Commons Attribution (CC BY) license (https://creativecommons.org/licenses/by/4.0/).
Share and Cite
Dai, Z.; Zhang, H.; Wu, F.; Chen, Y.; Yang, C.; Wang, H.; Sui, X.; Guo, Y.; Xin, B.; Guo, Z.; et al. Effects of 10-Day Complete Fasting on Physiological Homeostasis, Nutrition and Health Markers in Male Adults. Nutrients 2022, 14, 3860. https://doi.org/10.3390/nu14183860
Dai Z, Zhang H, Wu F, Chen Y, Yang C, Wang H, Sui X, Guo Y, Xin B, Guo Z, et al. Effects of 10-Day Complete Fasting on Physiological Homeostasis, Nutrition and Health Markers in Male Adults. Nutrients. 2022; 14(18):3860. https://doi.org/10.3390/nu14183860
Chicago/Turabian StyleDai, Zhongquan, Hongyu Zhang, Feng Wu, Ying Chen, Chao Yang, Hailong Wang, Xiukun Sui, Yaxiu Guo, Bingmu Xin, Zhifeng Guo, and et al. 2022. "Effects of 10-Day Complete Fasting on Physiological Homeostasis, Nutrition and Health Markers in Male Adults" Nutrients 14, no. 18: 3860. https://doi.org/10.3390/nu14183860