Article

Intestinal Taxa Abundance and Diversity in Inflammatory Bowel Disease Patients: An Analysis including Covariates and Confounders

1
Department of Biology, University of Rome Tor Vergata, Via Montpellier 1, 00133 Rome, Italy
2
Department of Systems Medicine, University of Rome Tor Vergata, Via Montpellier 1, 00133 Rome, Italy
3
Department for Innovation in Biological, Agro-food and Forest Systems, University of Tuscia, 01100 Viterbo, Italy
4
Institute of Biomembranes, Bioenergetics and Molecular Biotechnologies, IBIOM, CNR, 70126 Bari, Italy
*
Authors to whom correspondence should be addressed.
These authors contributed equally to the study.
Nutrients 2022, 14(2), 260; https://doi.org/10.3390/nu14020260
Submission received: 15 November 2021 / Revised: 29 December 2021 / Accepted: 4 January 2022 / Published: 8 January 2022
(This article belongs to the Section Nutrition and Metabolism)

Abstract

:
Intestinal dysbiosis has been widely documented in inflammatory bowel diseases (IBDs) and is thought to influence the onset and perpetuation of gut inflammation. However, it remains unclear whether such bacterial changes rely in part on the modification of an IBD-associated lifestyle (e.g., smoking and physical activity) and diet (e.g., rich in dairy products, cereals, meat and vegetables). In this study, we investigated the impact of these habits, which we defined as confounders and covariates, on the modulation of intestinal taxa abundance and diversity in IBD patients. 16S rRNA gene sequence analysis was performed using genomic DNA extracted from the faecal samples of 52 patients with Crohn’s disease (CD) and 58 with ulcerative colitis (UC), which are the two main types of IBD, as well as 42 healthy controls (HC). A reduced microbial diversity was documented in the IBD patients compared with the HC. Moreover, we identified specific confounders and covariates that influenced the association between some bacterial taxa and disease extent (in UC patients) or behaviour (in CD patients) compared with the HC. In particular, a PERMANOVA stepwise regression identified the variables “age”, “eat yogurt at least four days per week” and “eat dairy products at least 4 days per week” as covariates when comparing the HC and patients affected by ulcerative proctitis (E1), left-sided UC (distal UC) (E2) and extensive UC (pancolitis) (E3). Instead, the variables “age”, “gender”, “eat meat at least four days per week” and “eat bread at least 4 days per week” were considered as covariates when comparing the HC with the CD patients affected by non-stricturing, non-penetrating (B1), stricturing (B2) and penetrating (B3) diseases. Considering such variables, our analysis indicated that the UC extent differentially modulated the abundance of the Bifidobacteriaceae, Rikenellaceae, Christensenellaceae, Marinifilaceae, Desulfovibrionaceae, Lactobacillaceae, Streptococcaceae and Peptostreptococcaceae families, while the CD behaviour influenced the abundance of Christensenellaceae, Marinifilaceae, Rikenellaceae, Ruminococcaceae, Barnesiellaceae and Coriobacteriaceae families. In conclusion, our study indicated that some covariates and confounders related to an IBD-associated lifestyle and dietary habits influenced the intestinal taxa diversity and relative abundance in the CD and UC patients compared with the HC. Indeed, such variables should be identified and excluded from the analysis to characterize the bacterial families whose abundance is directly modulated by IBD status, as well as disease extent or behaviour.

1. Introduction

Inflammatory bowel diseases (IBDs), which include Crohn’s disease (CD) and ulcerative colitis (UC), are chronic immune-mediated disorders of the gastrointestinal tract of unknown aetiology. A large body of evidence suggests that, in IBD, the pathological process results from the interaction between genetic and environmental factors, which promotes an abnormal immune response against a component of normal intestinal flora [1,2,3]. Intestinal dysbiosis, which is characterized by the loss of beneficial bacteria, overgrowth of potentially pathogenic bacteria and loss of bacterial diversity, has been widely documented in IBD and is thought to influence the onset and perpetuation of gut inflammation [4,5,6,7,8]. Several factors may contribute to intestinal dysbiosis, such as host genetics, concomitant medications and lifestyle. Dietary habits are known to deeply shape gut microbiota composition [9,10,11,12]. The fact that IBD has a high prevalence in countries with “Westernized” dietary habits supports a direct relationship between flora composition and diet [13,14,15]. High-fat, high-sugar and low-fibre diets reduce the richness of gut microbiota and promote the expansion of pathogenic species [16,17,18]. Food additives, which are highly prevalent in the Western diet, also impair gut homeostasis and promote intestinal inflammation [19,20,21,22,23].
In this context, it is also noteworthy that modification of the patient’s usual diet by excluding food groups, restricting or adding dietary components, is often used to mitigate the ongoing inflammation and/or attenuate IBD-related symptoms [24]. These observations raise the possibility that some of the bacterial changes seen in IBD may rely on specific lifestyle and dietary habits.
The aim of this study was to analyze the potential role of covariates and confounders in modulating the taxa diversity and relative abundances in IBD.

2. Materials and Methods

2.1. Patients and Samples

One hundred and ten patients with a confirmed diagnosis of IBD and 42 HC were prospectively recruited between April 2019 and February 2020 at a single university hospital (University of Rome Tor Vergata). Participants, aged between 19 and 72 years old, provided faecal samples collected in Pre-Analytical Sample Processing (PSP) stool collection tubes (Invitek Molecular). For each patient, the following variables were collected: gender, age, smoking habit, anthropometric parameters, disease extent and behaviour. Disease characteristics were defined according to the Montreal classification. Patients with a history of infectious disease in the last three months and who had been using antibiotics, nonsteroidal anti-inflammatory drugs (NSAIDs) or proton pump inhibitors in the last 4 weeks before enrolment were excluded. Disease activity was assessed using the Harvey–Bradshaw index for CD patients (remission: n = 39, mild activity: n = 8, moderate activity: n = 5) and partial Mayo Clinic scores for UC patients (remission: n = 35, mild activity: n = 19, moderate activity: n = 4). Faecal calprotectin (fCal) levels were analyzed from 28 CD patients (fCal > 250 mg/kg in 6 patients) and 34 UCpatients (fCal > 250 mg/kg in 14 patients). Information about the patients’ lifestyle and dietary habits was collected through a questionnaire modified by an anamnestic interview applied in a previous study [25], where the effects of confounders and covariates modulating the differential abundance of microbial species between Parkinson’s disease patients and healthy controls was analyzed. The anamnestic interview, modified according to the Italian diet and lifestyle habits, was successfully used in our previous work to assess the role of possible confounders and covariates in a selected population of Italian patients affected by Parkinson’s disease [26] and it was applied in the present study. All patients gave informed consent and the study was approved by the local ethics committee.

2.2. Sequencing and Bioinformatic Analysis of 16S rRNA Amplicons

Faecal samples were collected using PSP stool collection tubes (Invitek Molecular) containing 8 mL of Stool DNA Stabilizer. DNA extraction from the stool samples was performed with PSP Spin Stool DNA Kit Plus (Invitek Molecular) following the manufacturer’s instructions. The purified DNA was quantified using a NanoDrop spectrophotometer ND1000 (Termofisher). 16S rRNA amplicon (V3–V4 regions) sequencing analysis was performed using an Illumina MiSeq 2×300bp. The quality of the raw sequences was checked using FastQC software and the primers, together with the adapters, were removed using Cutadapt, while the QIIME 2 pipeline was used to analyse the preprocessed reads [27]. In detail, reads were chimaera-checked and clustered in amplicon sequence variants (ASVs) using the DADA2 algorithm [28]. The q2-feature-classifier and the Silva database vr. 138 were used for taxonomic assignment of representative sequences obtained by DADA2 [29,30]. Statistical analyses of the ASV tables were performed in R using phyloseq, DESeq2, vegan and ggplot packages; ASVs with low frequencies were removed from the analyses [29] and data that were normalized by DESeq2 [31,32,33] were used to measure the α- and β-diversity metrics. The tax_glom function in the phyloseq package was used to sum up the data to different taxonomic levels and compare between samples.

2.3. Statistical Analysis

We performed the statistical analyses in the R 3.6.1 environment, using the vegan 2.5.6 and phyloseq 1.30.0 packages. Sample data were normalized by the DESeq2 R package, which is widely used to normalize data from 16S sequencing [33] and adopts a normalization method in order to estimate the dispersion across genes when the sample size is small [31]. We filtered OTUs by their prevalence, considering only those present in at least 10% of the samples. Alpha-diversity was computed at the species level using three metrics: Chao1, Shannon and Simpson. Beta-diversity was computed using four metrics: Bray–Curtis and weighted, unweighted and generalized Unifrac metrics. In our analysis, we considered both covariate and confounder variables as possible biasing factors and we assessed for their marginal effects using a generalized linear model (GLM), as previously applied [26]. Covariates are those variables that explain part of the variability in the outcome, while confounders may distort or mask the effects of the target variable (IBD status) on the outcome. We looked for covariates and confounders between 16 lifestyle and diet variables collected from participants. To find unbalanced variables, we used the Kruskal–Wallis test (non-parametric method) for numerical variables, while the Fisher’s exact test for the categorical variables and variables with a p < 0.05 were considered as potential confounders. The covariates were identified using the PERMANOVA test with 9999 permutations, assessing each variable’s marginal effect. For each of the four metrics used in measuring the β-diversity, we identified microbiota-shaping variables using a stepwise regression through manual backward elimination. We considered all the variables that were statistically significant (p < 0.05) for at least one metric, besides the target variable, as covariates. The PERMANOVA test was also used to confirm the effect of IBD status on the microbiome composition. The GLM multivariate analysis, adjusting for confounders and covariates, allows the comparison between unbalanced groups and to consider the part of variability explained by the covariates. We evaluated the differential abundance of each taxon by fitting four distributions: negative binomial, zero-inflated negative binomial, Poisson and hurdle distribution (using R packages: stats 3.4.4, MASS 7.3–50 and pscl 1.5.2.), and we chose the model with the lowest Bayesian information criteria score.
In a first approach, which we named the IBDCC model, for each distribution, we compared a “full” model with a “nested” model. The “full” GLM described the taxon behaviour, taking into account the target variable and all the covariates and confounders previously identified:
Taxon ~ IBD status + sex + age + yogurt + dairy products + cereals + fruits and vegetables + legumes + bread.
The “nested” model instead described the taxon behaviour by only considering the covariates and confounders:
Taxon ~ sex + age + yogurt + dairy products + cereals + fruits and vegetables + legumes + bread.
In a second approach, called the IBD model, where the role of the covariates and confounders were not taken into account, for each distribution, we compared a “full” model, which only included the IBD status, with a “null” model, which included a constant (i.e., 1). We compared the “full” model with the “nested” or the “null” model using the ANOVA function in R and corrected the p-values for multiple testing using the Benjamini–Hochberg procedure. We considered only those with a p < 0.05 as differentially abundant taxa.

3. Results

3.1. Microbiota Diversity Analysis, Study Cohort Characteristics and Identification of Covariates and Confounders

We collected 152 faecal samples from 52 CD patients, 58 UC patients and 42 HC. Genomic DNA was extracted from all samples and the 16S rRNA V3-V4 regions were amplified. The α-diversity was statistically significant for all the three indices (p = 4.401 × 10 9 for Chao1, p =   3.650 × 10 9 for Shannon, p = 1.617 × 10 7 for Simpson), indicating a reduced microbial diversity for the CD and UC patients compared with the HC, as previously reported [34,35]. Results from the microbiome structure and composition in IBD patients and HC were assessed by using a PERMANOVA test with four β-diversity metrics (Bray–Curtis and weighted, unweighted Unifrac and Canberra metrics).
Since environmental factors could act as confounders, affecting the differential abundance analysis of bacterial species and causing spurious associations, we provided each participant with a specific questionnaire to gather information about their lifestyle and dietary habits. We observed that some variables were skewed among the three groups. In particular, four variables, namely “eat dairy products at least 4 days per week”, “eat fruit and vegetables at least 4 days per week”, “eat cereals at least 4 days per week” and “eat legumes at least 4 days per week”, were found to be unbalanced in the UC and CD patients compared with the HC and were therefore considered as possible confounders (Table A1). A PERMANOVA test considering only IBD status as a grouping variable indicated that this condition was a statistically significant predictor of gut microbiota composition for all the metrics (p-value < 0.0001 for Bray–Curtis, Canberra and weighted and unweighted Unifrac). Results from another PERMANOVA test showed that the microbiota differences between the CD and HC were still significant when considering all the variables reported in Table A1. Moreover, these data also indicated that five variables, namely “age”, “gender”, “eat bread at least 4 days per week”, “eat yogurt at least 4 days per week” and “eat dairy products at least 4 days per week”, were statistically significant for at least one metrics. Therefore, these variables were considered as covariates since they explained part of the variability in the microbiota structure (Table 1). Given that both confounders and covariates may introduce biases in the differential abundance analysis, we assessed their relative importance in the analysis of the faecal microbiota composition in the UC and CD patients and the HC.

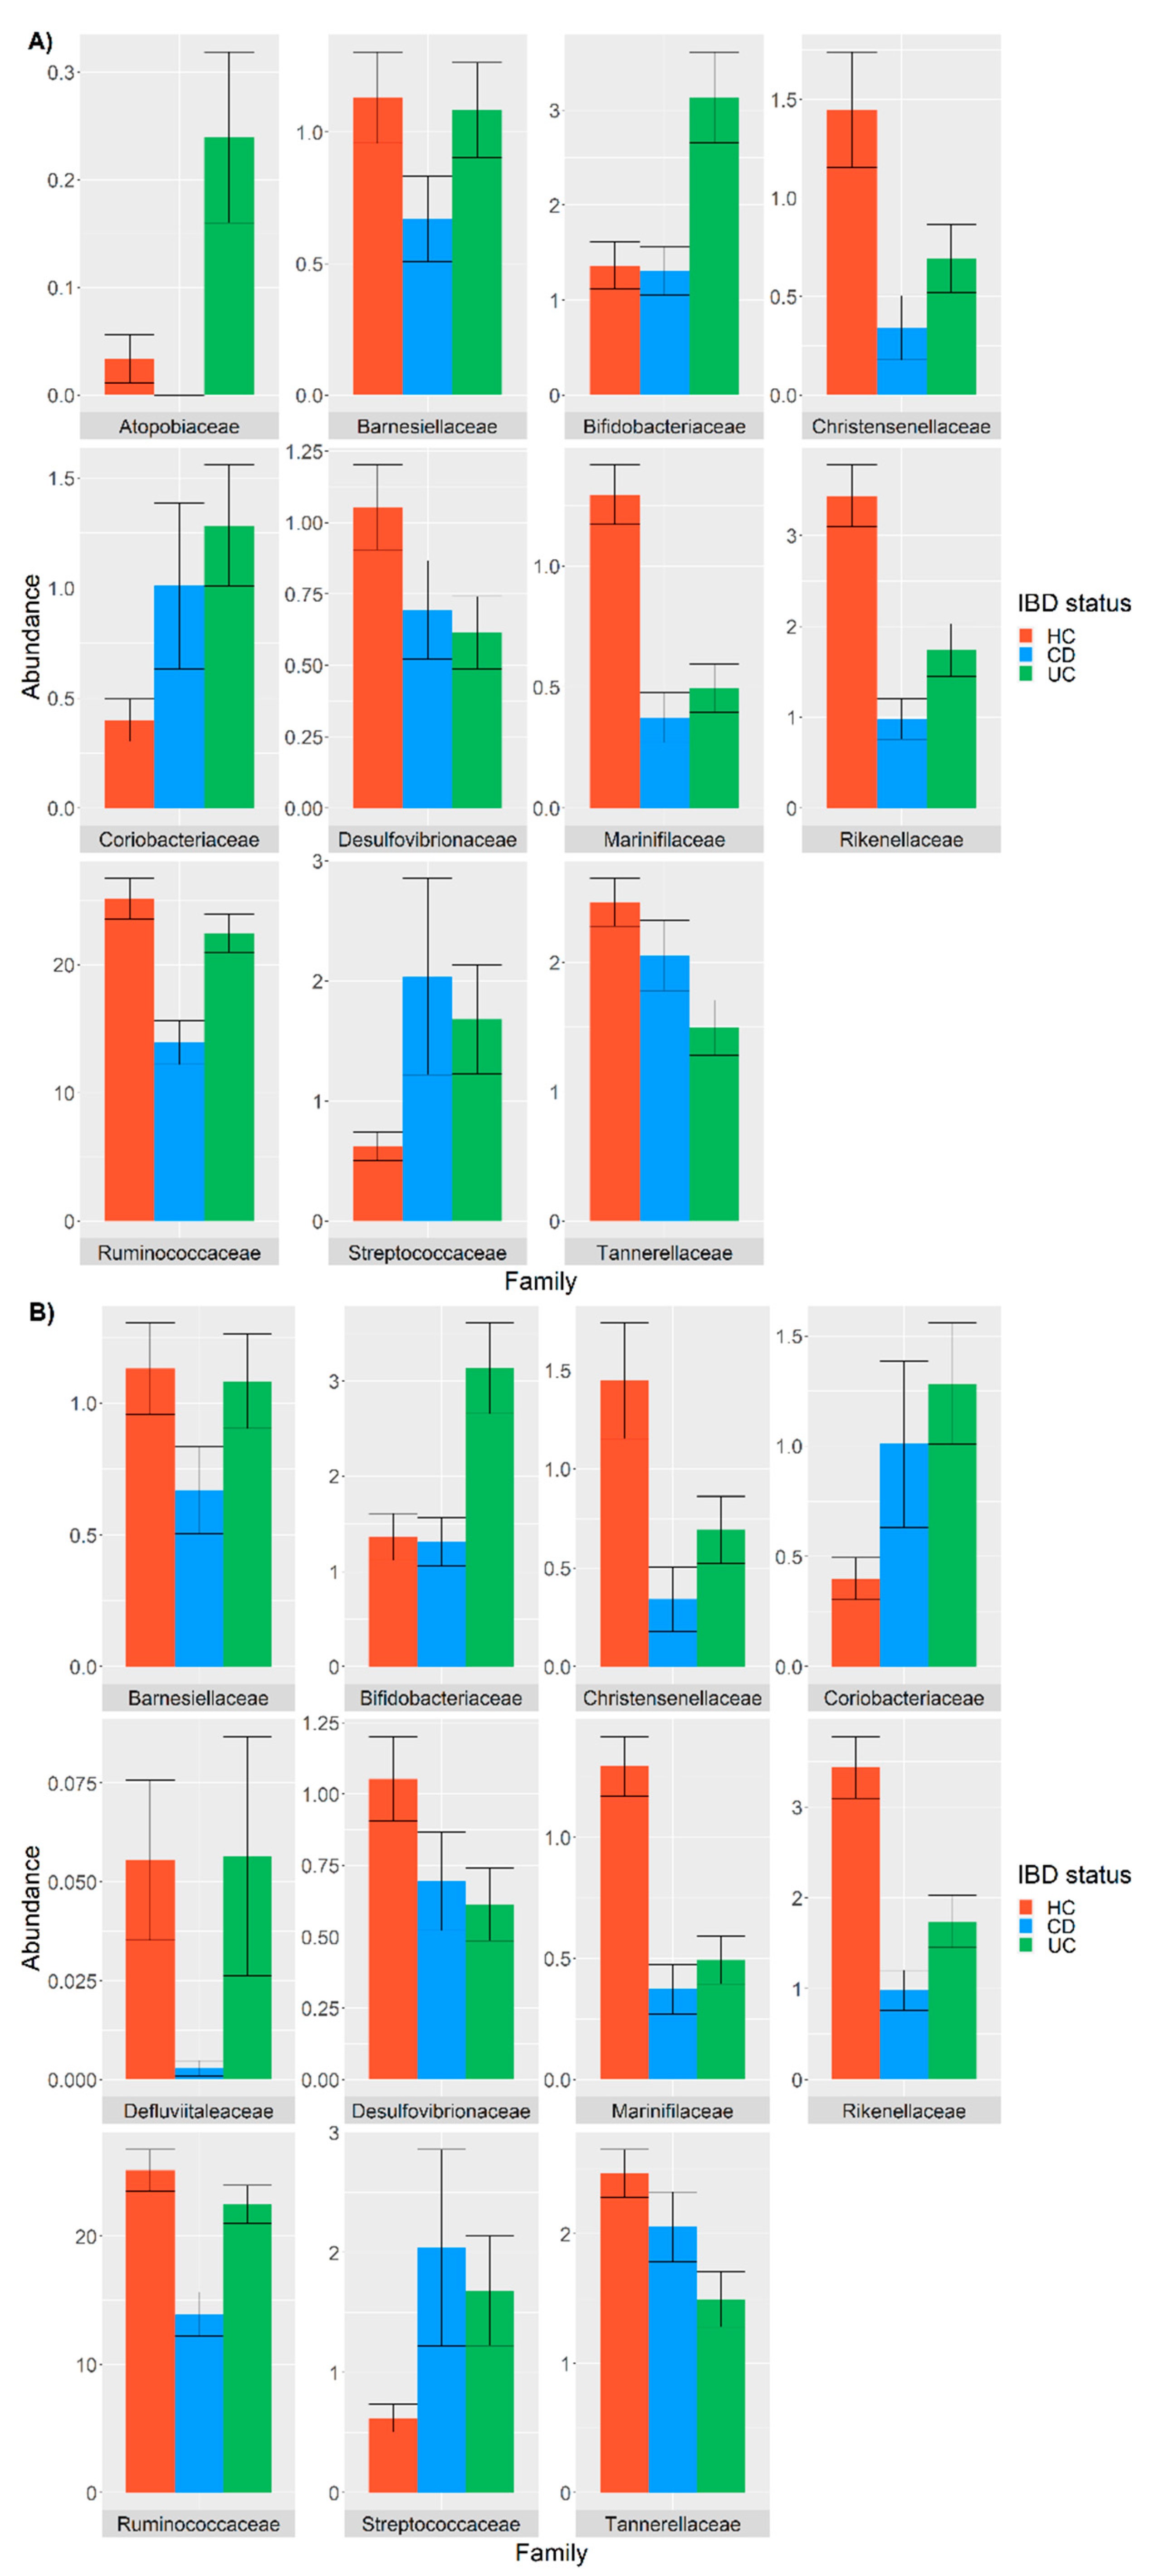
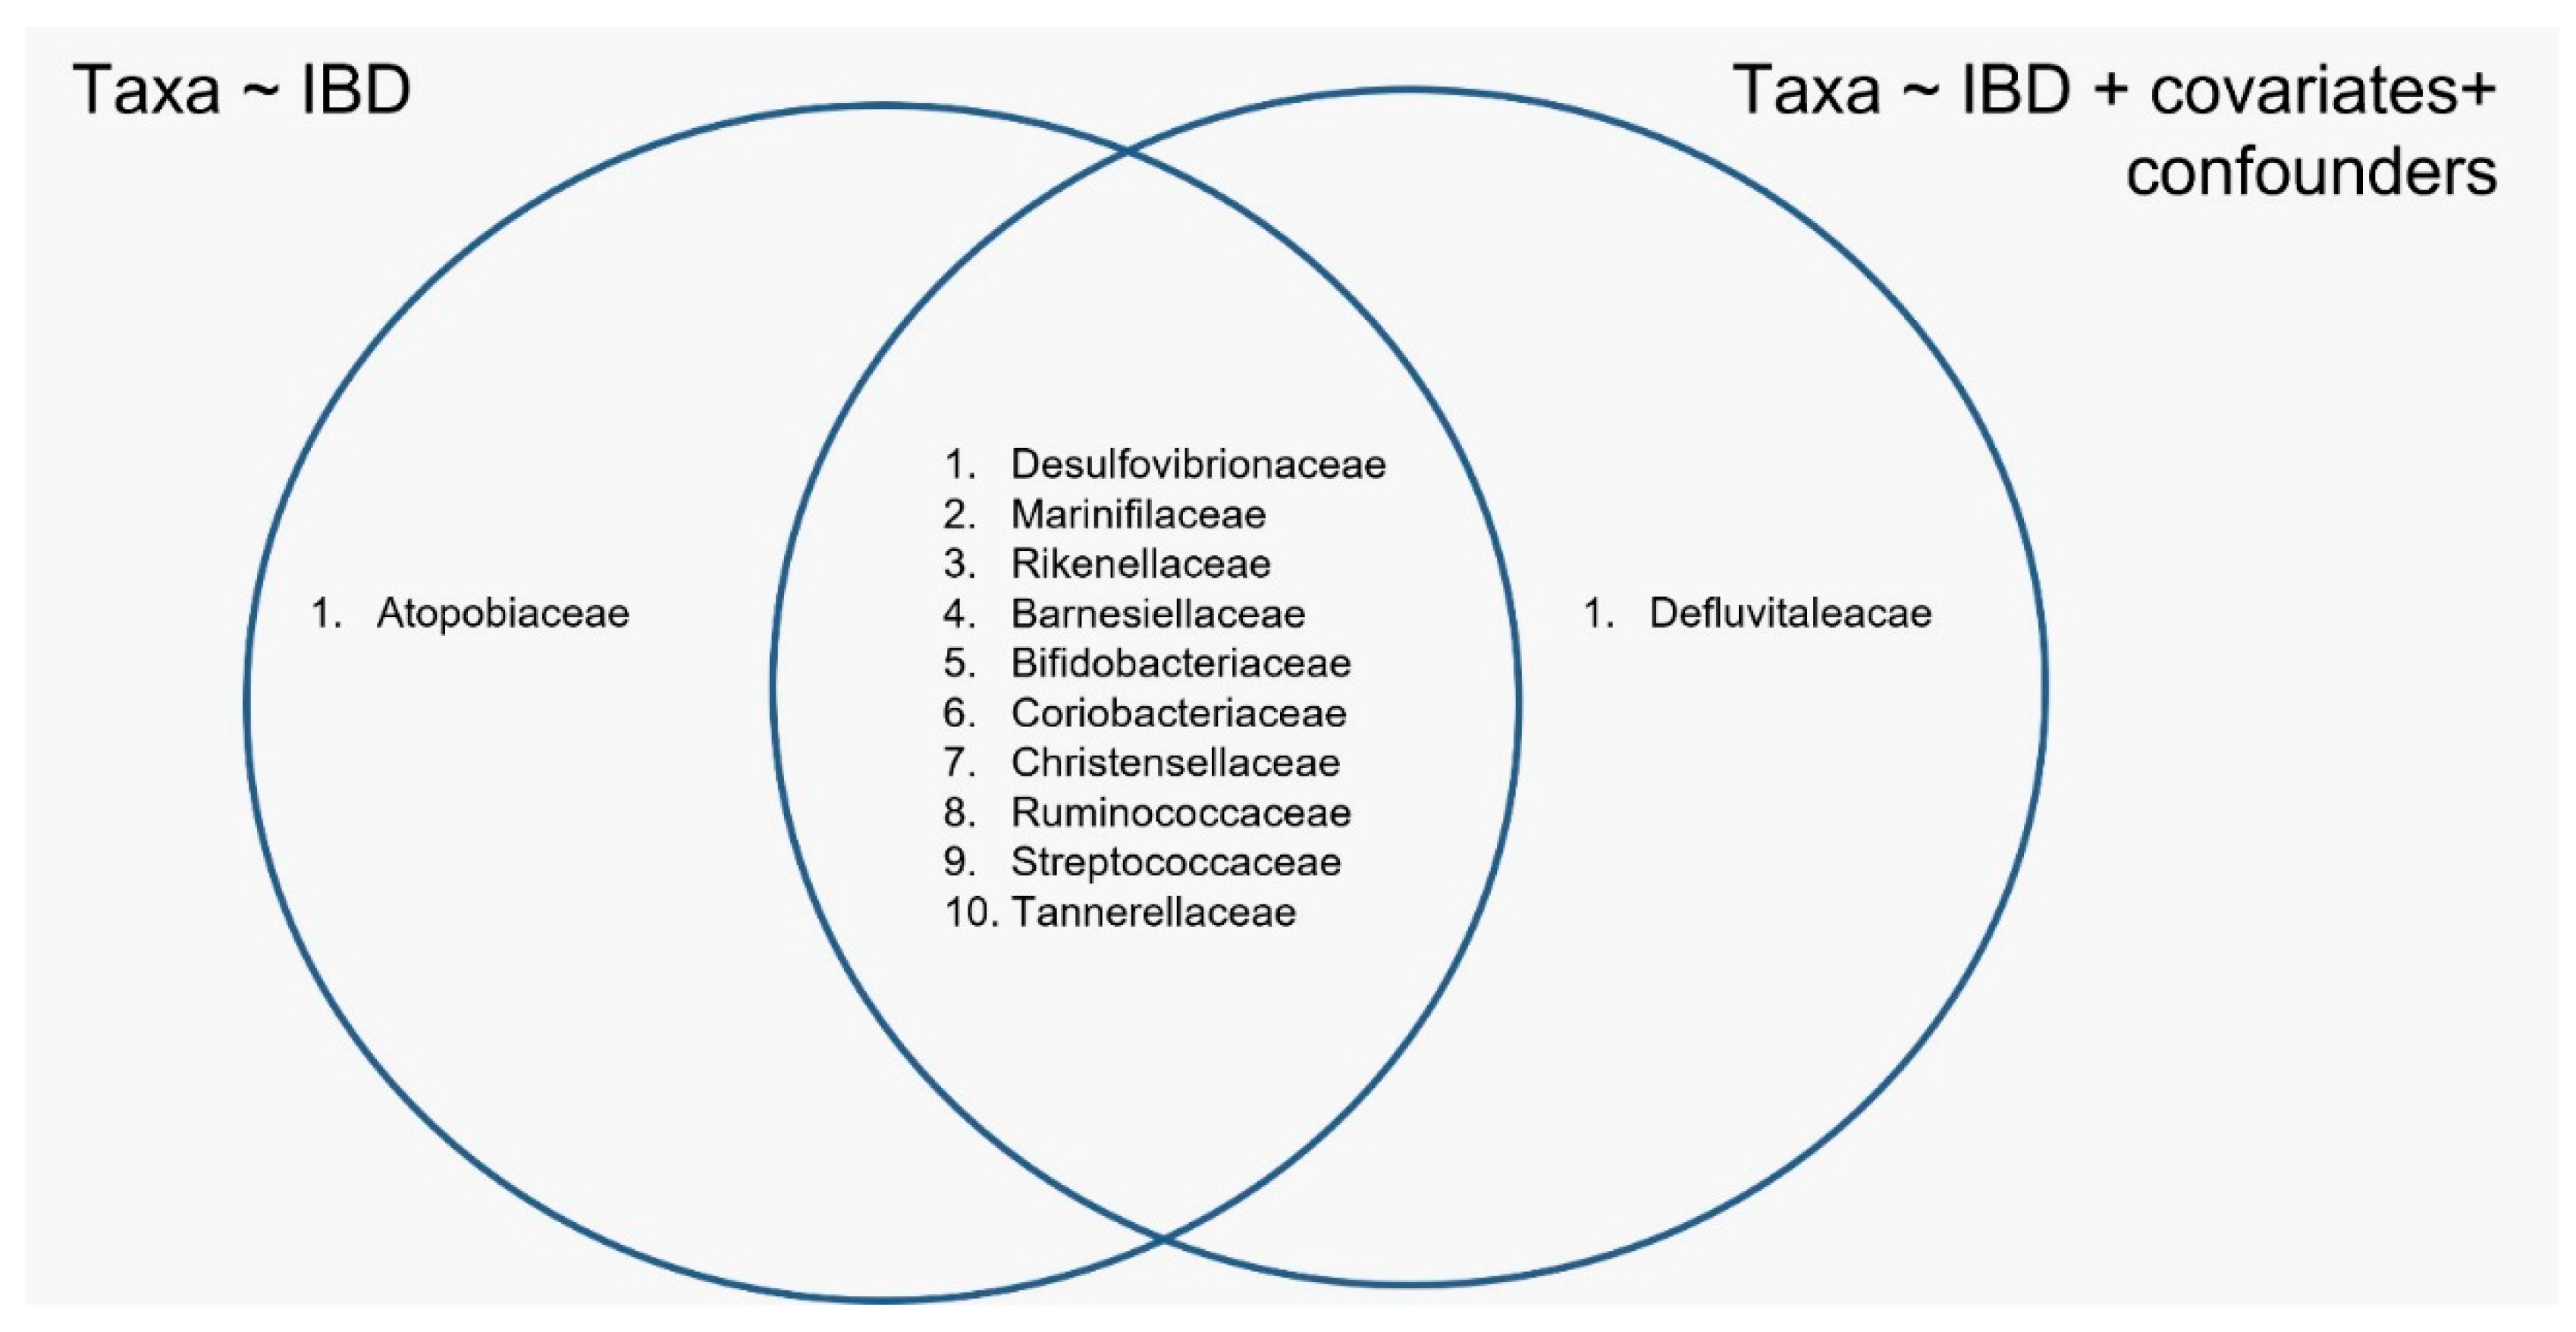
3.2. Differential Abundance Analysis between IBD and HC Taxa

A generalized linear model (GLM) was used to evaluate the influence of IBD status on taxa abundance, comparing a GLM where the IBD status was the only possible variable (IBD model) with a GLM that was a linear combination of IBD status, covariates and confounders (IBDCC model). The analysis indicated that the bacterial families that were differentially abundant in the CD and UC patients compared with the HC were different when considering the IBD and IBDCC models (Figure 1 and Figure 2). The two methods converged in identifying a different abundance of 10 bacterial families (Figure 2), but the difference in the abundance of the Atopobiaceae family was found to be significant only when testing the IBD model, while the IBDCC model indicated that Defluvitaleacae was the only family to be differentially abundant in IBD samples compared with the HC (Figure 2).
Concerning the commonly identified families, Coriobacteriaceae and Streptococcaceae showed a higher abundance in both the CD and UC patients compared with the HC, while reduced frequencies of Christensenellaceae, Desulfovibrionellaceae, Marinifilaceae, Rikenellaceae, Ruminococcaceae, Tannerelleaceae and Barneselliaceae were observed in the CD and UC patients compared with HC (Figure 1). Moreover, the frequency of Atopobiaceae, Bifidobacteriaceae and Defluvitillaceae were increased in the UC patients and decreased in the CD patients compared with the HC (Figure 1).
The Atopobiaceae and Defluvitaleacae families, named as “non-overlapping families” (NOFs), were investigated to identify the influence of one or more variables on their relative abundance.

3.3. Analysis of the Covariates and Confounders Influencing Taxa Abundance

We tested the influence of each covariate and confounder related to lifestyle and dietary habits on the abundance of the two NOFs using two different approaches. In the first one, we compared the IBD model with a linear model considering the IBD status plus an additional single variable. In the second approach, we compared the IBDCC model with a linear model that included the IBD status plus all variables except one, which was excluded in an iterative procedure. The first approach showed that the differential abundance of the Atopobiaceae family among the UC, CD and HC groups was not significant when the condition “eat cereals at least 4 days per week” was included in the model. In line with these results, the difference between the UC, CD and HC groups observed for the Atopobiaceae family was not any more significant when excluding “eat cereals at least 4 days per week” from the covariates by using the second approach (Table 2). These results indicated that “eat cereals at least 4 days per week” strongly impacted the Atopobiaceae abundance. In line with our data, it was recently reported that cereals can perturb Atopobiaceae family abundances [36].
The same approach, which was applied to analyse the abundance of the Defluvitaleacae family, indicated that this family was not differentially modulated by a single variable, but by a combination of several variables.

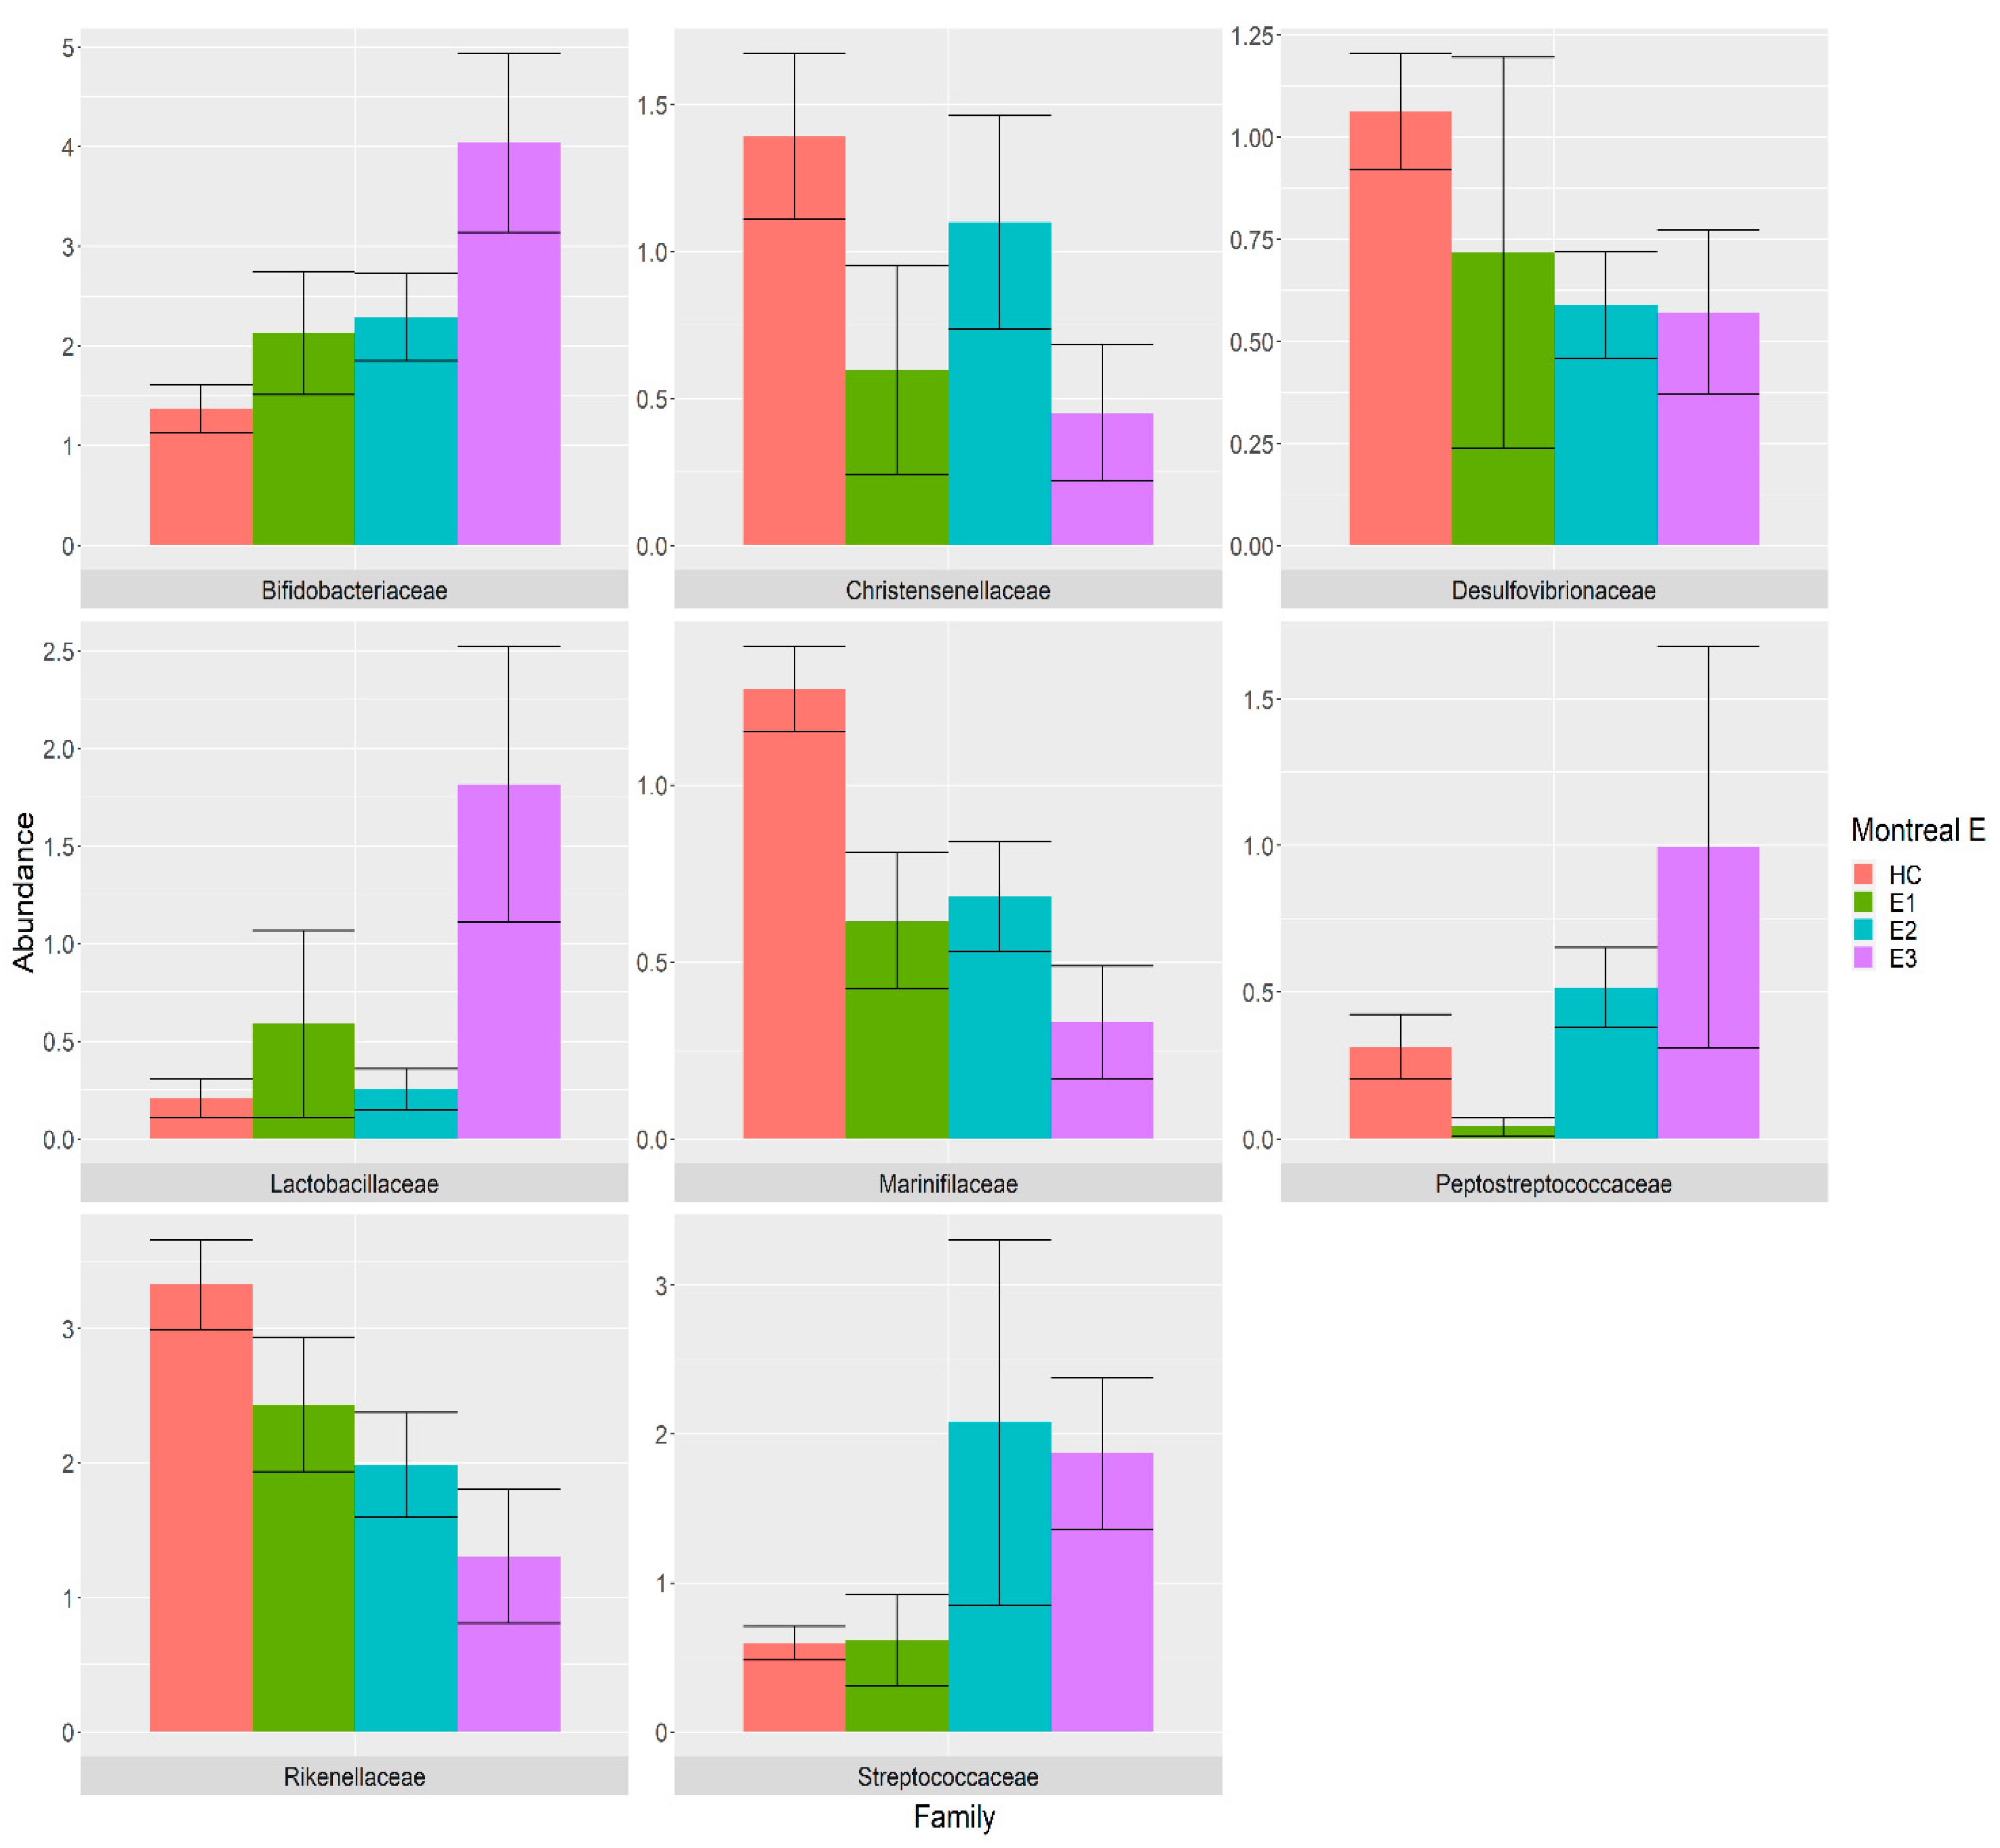
3.4. Association between Gut Microbiota and Montreal Classification

We next assessed whether the frequency of specific bacterial families correlated with the extent and behaviour of the disease using the IBDCC model. The UC extent was classified using the Montreal classification as ulcerative proctitis (E1), left-sided UC (distal UC) (E2) and extensive UC (pancolitis) (E3). In contrast, the CD behaviour was classified using the Montreal and Vienna classification as non-stricturing, non-penetrating (B1), stricturing (B2) and penetrating (B3) [37]. The analysis, which was carried out on 42 HC, 9 E1, 18 E2 and 28 E3 samples for the UC patients and on 42 HC, 27 B1, 22 B2 and 3 B3 samples for the CD patients, indicated that alpha-diversity was statistically significant for both classifications for all the three indices: p =   9.881 × 10 5 (Chao1), p = 3.499 × 10 5 (Shannon) and p = 5.763 × 10 4 (Simpson) for the E1, E2 and E3 groups, respectively, compared with the HC; and p = 7.166 × 10 8 (Chao1), p = 7.445 × 10 8 (Shannon) and p =   1.220 × 10 6 (Simpson) for the B1, B2 and B3 groups, respectively, compared with the HC. A PERMANOVA test confirmed that the gut microbiota composition was a good predictor for the UC extent and CD behaviour.
Table A2 shows that three variables, namely, “lost 5 kg in the last year”, “eat dairy products at least 4 days per week” and “drink alcohol at least 4 days per week”, were significantly unbalanced across the E1, E2, E3 and HC groups, while Table A3 indicates that four variables, namely, “lost 5 kg in the last year”, “gained 5 kg in the last year”, “eat bread at least 4 days per week” and “eat legumes at least 4 days per week”, were significantly unbalanced across the B1, B2, B3 and HC groups. A PERMANOVA stepwise regression identified the variables “age”, “eat yogurt at least 4 days per week” and “eat dairy products at least 4 days per week” as covariates for the E1, E2 and E3 groups, while the variables “age”, “gender”, “eat meat at least 4 days per week” and “eat bread at least 4 days per week” were considered as covariates for the B1, B2 and B3 groups.
The influence of the UC extent and CD behaviour on the taxa abundances, considering their covariates and confounders, indicated that the UC extent differentially modulated the abundances of eight bacterial families (Figure 3), while the CD behaviour influenced the abundance of six bacterial families (Figure 4) compared with the HC. Among them, the Christensenellaceae family was consistently decreased in the B1 class when compared with HC and absent in the B2 and B3 classes. Similarly, the Marinifilaceae, Rikenellaceae and Ruminococcaceae families were decreased in the B1, B2 and B3 classes compared with the HC. In contrast, the relative abundance of Barnesiellaceae was found to be decreased in the B1 and B2 classes compared with the HC, while it was increased in the B3 class. Interestingly, the abundance of the Coriobacteriaceae family was found to be higher in the B1 class, similar in the B2 class and absent in the B3 class compared with the HC (Figure 3).
Among those families that were differentially abundant among the UC extent classes, the Bifidobacteriaceae family showed a clear increasing trend in the HC, E1, E2 and E3 groups, while Desulfovibrionaceae and Rikenellaceae showed decreasing trends compared with the HC. The abundance of the Christensenellaceae and Marinifilaceae families were decreased in the E1, E2 and E3 classes compared with the HC, while the Lactobacillaceae abundance was greatly increased in the E3 class compared with HC. Moreover, the frequency of Streptococcaceae family was increased in the E2 and E3 classes compared with the HC, while Peptostreptococcaceae was found to be decreased in the E1 class and increased in the E2 and E3 classes compared with the HC (Figure 4).

4. Discussion

In this study, we evaluated the differences in microbiota structure and composition in faecal samples isolated from IBD patients (52 CD, 58 UC) and healthy controls (42 HC) using 16S rRNA sequencing, considering the contribution of covariates and confounders that may bias the associations between microbiota composition and the pathological status. We focused our attention on the effect of common confounding factors (age, gender, diet) since they are known to deeply impact gut microbiota composition [38,39,40,41,42,43]. We confirmed that the variables “age”, “gender” and “dietary habits” influenced the variance of the gut microbiota and the taxa abundance across cases (Table A1). In particular, our data indicated that bread consumption could modulate the abundance of some microbial species, in line with previous studies showing that the consumption of industrial bread induced the proliferation of Bacteroides, leading to systemic inflammation [44]. In order to identify potential variables that are able to influence the microbiota composition independently of the disease, we compared two generalized linear models: the IBD model, which did not consider the contribution of confounders and covariates, and the IBDCC model, which included confounders and covariates. Interestingly, our results showed the differential abundance of the Atopobiaceae family, identified by the IBD model, was no more significant when using the IBDCC model, indicating that its abundance was strictly dependent on the variable “eat cereals at least 4 days per week”. In line with this observation, a significant increase in the Atopobium genus was previously reported to correlate with the consumption of wholegrain products [36]. In contrast, the differential abundance of the Defluvitaleacae family was not modulated by a single variable, suggesting that a combination of more than a single external factor was necessary to influence its frequency in the IBD patients compared with the HC.
However, both the IBD and IBDCC models converged to identify a differential abundance of 10 bacterial families, thus confirming a crucial role of the disease in modulating the microbiota composition. In particular, the models identified a lower abundance of the Christensenellaceae, Ruminococcaceae, Rikenellaceae and Tannerellaceae families in IBD patients, which are butyrate-producing bacteria that are able to protect the host from gut inflammation and IBD exacerbation, as previously described [45,46,47,48,49]. We also observed a higher abundance of the Coriobacteriaceae family in both the CD and UC samples compared with the HC, thus confirming previous studies [49]. A possible explanation could be that some members of this family (e.g., A. parvolum) can produce hydrogen sulfide, thus promoting rapid and severe pancolitis [50]. We reported a reduction in the Desulfovibrionaceae family in our UC and CD samples compared with the HC, in contrast with some previous studies [51]. This discrepancy may have been due to the administration of 5-aminosalicylic acid-based drugs in some patients, which may have affected the activity of sulfate-reducing bacteria [52]. We also observed a higher frequency of the Bifidobacteriaceae family in the UC samples compared with the CD and HC samples, in contrast with previous observations [49,53]. The abundance of Bifidobacterium is known to be strictly dependent on the disease phase [54], thus providing a possible explanation for the discrepancy between our results and previous observations. Moreover, we found that the Streptococcaceae family was increased in both the UC and CD samples compared with the HC, in line with other studies [49,55].
The association between frequencies of microbial species and the Montreal classification of IBD was investigated by comparing 42 HC samples with 58 UC samples organized into E1 (n = 9), E2 (n = 18) and E3 (n = 28) classes and comparing 42 HC samples with 52 CD samples organized into B1 (n = 27), B2 (n = 22) and B3 (n = 3) classes. The alpha-diversity was decreased in the UC and CD samples compared with the HC group depending on the disease extent and behaviour, respectively. Using a GLM model corrected for covariates and confounders, we found six differentially abundant families in the CD classes and eight families in the UC classes when compared with the HC (Figure 3 and Figure 4).

5. Conclusions and Limitations of the Study

Multivariate models are the most reliable statistical methods used to identify and adjust for several factors related to a patient’s lifestyle and habits, allowing for handling several covariates and confounders simultaneously. Indeed, the most promising strategy used to properly correlate a pathological status to microbiota composition should match the case and controls participants with confounding variables, reducing the underlying noise derived from factors independently from the pathological status [56]. In this work, we showed that a multivariate GLM model allowed for identifying the microbial community variation according to the disease status. However, we must be aware that the characterization of human microbiota composition, achieved by comparing two different experimental conditions, is still challenging. The analysis of the microbiota composition of healthy patients and patients affected by a disease leads to more reliable results when including the effect of different habits and diets, even if there is still a part of the variance that remains unexplained. We underline the importance of choosing appropriate confounders and covariates to better suit the characteristics of the population in the study, i.e., Mediterranean diet variables in the case of the Italian population. However, the use of a highly specific habits questionnaire introduced difficulties in transferring the research results to different populations.
Another important comment concerns the results obtained in this study comparing the different Montreal classification classes. We want to point out that the results showing alteration in specific families between the different Montreal scales were obtained by comparing groups made up of a small number of patients. The data were analyzed using the DESeq2 package, which adopts a normalization method to estimate the dispersion across genes when the sample size is small. However, the study still suffered from a limited number of samples and the final results must be confirmed by considering a larger sample size.

Author Contributions

Conceptualization, A.D., F.L., I.M. and G.M.; Methodology, A.D., A.T., D.P., F.L., I.M., G.M., S.B., S.S. and V.U.; Formal analysis, A.T. and D.P.; Resources, F.L., I.M., S.S. and V.U.; Investigation, F.L., I.M., S.S. and V.U.; Data curation, A.T., D.P., F.L., I.M. and S.S.; Data visualization, A.T. and D.P.; Writing—original draft, A.T., F.L. and I.M.; Writing—review and editing, A.D., A.T., D.P., F.L., I.M., G.M., S.B., S.S. and V.U.; Supervision, A.D. and G.M.; Funding acquisition, A.D. and G.M. All authors have read and agreed to the published version of the manuscript.

Funding

This research received no external funding.

Institutional Review Board Statement

The study was conducted according to the guidelines of the Declaration of Helsinki and approved by the Ethics Committee of Policlinico Tor Vergata (protocol code 124/09, date of approval: 18/09/2019).

Informed Consent Statement

Informed consent was obtained from all subjects involved in the study.

Data Availability Statement

The datasets used and/or analyzed during the current study are available from the corresponding author upon reasonable request.

Conflicts of Interest

The authors declare no conflict of interest.

Appendix A

Table A1. Demographic and habit-related parameters of the cohort. The p-values refer to the Kruskall–Wallis test and Fisher’s test between IBD and the numerical or categorical variables, respectively. n = no, Y = yes. The variables in bold were significantly unbalanced between the HC (42 samples), CD (52 samples) and UC (58 samples) groups.
p-ValueHCCDUC
Age0.26Mean: 38.02Mean: 42.42Mean: 43.43
Median: 32.5Median: 42Median: 42
Std.Dev: 15.95Std.Dev: 15.95Std.Dev: 14.04
Min: 22Min: 19Min: 19
Max: 72Max: 67Max: 69
Gender0.21F = 0.64,F = 0.47,F = 0.5,
M = 0.36M = 0.53M = 0.5
Currently smokes0.46n = 0.81,n = 0.91,n = 0.88,
Y = 0.17Y = 0.09Y = 0.12
Height0.66Mean: 167.33Mean: 168.3Mean: 170.02
Median: 168Median: 173Median: 170
Std.Dev: 7.78Std.Dev: 7.78Std.Dev: 10.04
Min: 150Min: 0Min: 150
Max: 185Max: 186Max: 188
Caesarean 0.46n = 0.81, Y = 0.17n = 0.91, Y = 0.09n = 0.88, Y = 0.12
Eat yogurt at least 4 days/week0.07n = 0.74, Y = 0.26n = 0.91, Y = 0.09n = 0.78, Y = 0.22
Eat bread at least 4 days/week0.15n = 0.33, Y = 0.67n = 0.19, Y = 0.81n = 0.17, Y = 0.83
Eat pasta at least 4 days/week0.06n = 0.29, Y = 0.71n = 0.15, Y = 0.85n = 0.34, Y = 0.66
Eat dairy products at least 4 days/week0.04n = 0.36, Y = 0.64n = 0.4, Y = 0.6n = 0.59, Y = 0.41
Eat fruit and vegetables at least 4 days/week0.01n = 0.14, Y = 0.86n = 0.34, Y = 0.66n = 0.14, Y = 0.86
Eat meat at least 4 days/week0.33n = 0.24, Y = 0.76n = 0.3, Y = 0.7n = 0.38, Y = 0.62
Eat fish at least 4 days/week0.45n = 0.74, Y = 0.26n = 0.83, Y = 0.17n = 0.74, Y = 0.26
Eat cereals at least 4 days/week0.02n = 0.71, Y = 0.29n = 0.89, Y = 0.11n = 0.67, Y = 0.33
Eat legumes at least 4 days/week0.002n = 0.62, Y = 0.38, n = 0.90, Y = 0.10, n = 0.84, Y = 0.16,
Drink coffee at least 4 days/week0.20n = 0.14, Y = 0.86n = 0.28, Y = 0.72n = 0.28, Y = 0.72
Physical activity0.10n = 0.4, Y = 0.6n = 0.56, Y = 0.44n = 0.36, Y = 0.64

Appendix B

Table A2. Demographic and habits-related parameters of the cohort. The p-values refer to the Kruskall–Wallis test and Fisher’s test between the Montreal E scale and the numeric or categorical variables, respectively. n = no, Y = yes. The variable in bold was significantly unbalanced between HC (42 samples), E1 (9 samples), E2 (18 samples) and E3 (28 samples) groups.
p-ValueHCE1E2E3
Height0.39Mean: 167.73Mean: 173.33Mean: 169.28Mean: 169.36
Median: 168Median: 175Median: 168.5Median: 171
Std.Dev: 7.92Std.Dev: 10.69Std.Dev: 10.25Std.Dev: 9.96
Min: 150Min: 158Min: 155Min: 150
Max: 185Max: 188Max: 185Max: 188
Drink coffee at least 4 days/week0.45n = 0.16, Y = 0.84n = 0.22, Y = 0.78n = 0.22, Y = 0.78n = 0.32, Y = 0.68
Eat meat at least 4 days/week0.33n = 0.23, Y = 0.77n = 0.33, Y = 0.67n = 0.44, Y = 0.56n = 0.36, Y = 0.64
Eat cereals at least 4 days/week0.47n = 0.73, Y = 0.27n = 0.56, Y = 0.44n = 0.78, Y = 0.22n = 0.61, Y = 0.39
Physical activity0.72n = 0.39, Y = 0.61n = 0.56, Y = 0.44n = 0.33, Y = 0.67n = 0.36, Y = 0.64
Age0.13Mean: 38.98Mean: 39.22Mean: 44.28Mean: 43.18
Median: 34.5Median: 40Median: 46.5Median: 41
Std.Dev: 16.33Std.Dev: 10.31Std.Dev: 13.37Std.Dev: 15.51
Min: 22Min: 25Min: 20Min: 19
Max: 72Max: 58Max: 69Max: 68
Eat fruit and vegetables at least 4 days/week0.67n = 0.14, Y = 0.86Y = 1n = 0.17, Y = 0.83n = 0.18, Y = 0.82
Currently smokes0.49n = 0.68, Y = 0.32n = 0.89, Y = 0.11n = 0.72, Y = 0.28n = 0.82, Y = 0.18
Gender 0.54F = 0.64,F = 0.44,F = 0.5,F = 0.5,
M = 0.36M = 0.56M = 0.5M = 0.5
Eat dairy products at least 4 days/week0.01n = 0.36, Y = 0.64n = 0.56, Y = 0.44n = 0.83, Y = 0.17n = 0.46, Y = 0.54
Eat legumes at least 4 days/week0.07n = 0.64, Y = 0.36n = 0.78, Y = 0.22n = 0.94, Y = 0.06n = 0.79, Y = 0.21
Eat bread at least 4 days/week0.23n = 0.34, Y = 0.66n = 0.11, Y = 0.89n = 0.22, Y = 0.78n = 0.14, Y = 0.86
Caesarean section0.96n = 0.82, Y = 0.16n = 0.89, Y = 0.11n = 0.83, Y = 0.17n = 0.89, Y = 0.11
Eat pasta at least 4 days/week0.71n = 0.3, Y = 0.7n = 0.44, Y = 0.56n = 0.39, Y = 0.61n = 0.29, Y = 0.71
Eat fish at least 4 days/week0.71n = 0.75, Y = 0.25n = 0.89, Y = 0.11n = 0.72, Y = 0.28n = 0.68, Y = 0.32
Eat yogurt at least 4 days/week0.95n = 0.75, Y = 0.25n = 0.78, Y = 0.22n = 0.83, Y = 0.17n = 0.75, Y = 0.25

Appendix C

Table A3. Demographic and habits-related parameters of the cohort. The p-values refer to the Kruskall–Wallis test and Fisher’s test between the Montreal B scale and the numeric or categorical variables, respectively. n = No, Y = yes. The variables in bold were unbalanced between the HC (42 samples), B1 (27 samples), B2 (22 samples) and B3 (3 samples) groups.
p-ValueHCB1B2B3
Height0.28Mean: 167.33Mean: 170.07Mean: 166.27Mean: 167.5
Median: 168Median: 173Median: 176Median: 165
Std.Dev: 7.78Std.Dev: 9.77Std.Dev: 38.34Std.Dev: 13
Min: 150Min: 153Min: 0Min: 155
Max: 185Max: 185Max: 186Max: 185
Drink coffee at least 4 days/week0.02n = 0.14, Y = 0.86n = 0.33, Y = 0.67n = 0.14, Y = 0.86n = 0.75, Y = 0.25
Eat meat at least 4 days/week0.33n = 0.24, Y = 0.76n = 0.26, Y = 0.74n = 0.41, Y = 0.59Y = 1
Eat cereals at least 4 days/week0.09n = 0.71, Y = 0.29n = 0.85, Y = 0.15n = 0.95, Y = 0.05n = 0.75, Y = 0.25
Physical activity0.03n = 0.4, Y = 0.6n = 0.67, Y = 0.33n = 0.55, Y = 0.45Y = 1
Age0.03Mean: 38.02Mean: 42.41Mean: 42.82Mean: 40.25
Median: 32.5Median: 45Median: 41.5Median: 41
Std.Dev: 15.95Std.Dev: 13.84Std.Dev: 11.39Std.Dev: 16.82
Min: 22Min: 19Min: 26Min: 21
Max: 72Max: 67Max: 64Max: 58
Eat fruit and vegetables at least 4 days/week0.09n = 0.14, Y = 0.86n = 0.3, Y = 0.7n = 0.41, Y = 0.59n = 0.25, Y = 0.75
Currently smokes0.08n = 0.67, Y = 0.33n = 0.48, Y = 0.52n = 0.73, Y = 0.23n = 1
Gender0.07F = 0.64,F = 0.56,F = 0.32,F = 0.75,
M = 0.36M = 0.44M = 0.68M = 0.25
Eat dairy products at least 4 days/week0.45n = 0.36, Y = 0.64n = 0.41, Y = 0.59n = 0.32, Y = 0.68n = 0.75, Y = 0.25
Eat legumes at least 4 days/week0.00n = 0.62, Y = 0.38n = 0.85, Y = 0.15n = 0.95, Y = 0.05n = 0.75, Y = 0.25
Eat bread at least 4 days/week0.02n = 0.33, Y = 0.67n = 0.19, Y = 0.81n = 0.09, Y = 0.91n = 0.75, Y = 0.25
Caesarean section0.4n = 0.81, Y = 0.17n = 0.96, Y = 0.04n = 0.82, Y = 0.18n = 1
Eat pasta at least 4 days/week0.07n = 0.29, Y = 0.71n = 0.07, Y = 0.93n = 0.18, Y = 0.82n = 0.5, Y = 0.5
Eat fish at least 4 days/week0.65n = 0.74, Y = 0.26n = 0.85, Y = 0.15n = 0.82, Y = 0.18n = 0.75, Y = 0.25
Eat yogurt at least 4 days/week0.1n = 0.74, Y = 0.26n = 0.89, Y = 0.11n = 0.95, Y = 0.05n = 0.75, Y = 0.25

References

  1. Abraham, C.; Cho, J.H. Inflammatory bowel disease. N. Engl. J. Med. 2009, 361, 2066–2078. [Google Scholar] [CrossRef]
  2. Bouma, G.; Strober, W. The immunological and genetic basis of inflammatory bowel disease. Nat. Rev. Immunol. 2003, 3, 521–533. [Google Scholar] [CrossRef]
  3. Jostins, L.; Ripke, S.; Weersma, R.K.; Duerr, R.H.; McGovern, D.P.; Hui, K.Y.; Lee, J.C.; Schumm, L.P.; Sharma, Y.; Anderson, C.A.; et al. Host–microbe interactions have shaped the genetic architecture of inflammatory bowel disease. Nature 2012, 491, 119–124. [Google Scholar] [CrossRef] [PubMed] [Green Version]
  4. Takaishi, H.; Matsuki, T.; Nakazawa, A.; Takada, T.; Kado, S.; Asahara, T.; Kamada, N.; Sakuraba, A.; Yajima, T.; Higuchi, H.; et al. Imbalance in intestinal microflora constitution could be involved in the pathogenesis of inflammatory bowel disease. Int. J. Med Microbiol. 2008, 298, 463–472. [Google Scholar] [CrossRef]
  5. Halfvarson, J.; Brislawn, C.J.; Lamendella, R.; Vázquez-Baeza, Y.; Walters, W.A.; Bramer, L.M.; D’Amato, M.; Bonfiglio, F.; McDonald, D.; Gonzalez, A.; et al. Dynamics of the human gut microbiome in inflammatory bowel disease. Nat. Microbiol. 2017, 2, 1–7. [Google Scholar] [CrossRef] [Green Version]
  6. Frank, D.N.; St Amand, A.L.; Feldman, R.A.; Boedeker, E.C.; Harpaz, N.; Pace, N.R. Molecular-phylogenetic characterization of microbial community imbalances in human inflammatory bowel diseases. Proc. Natl. Acad. Sci. USA 2007, 104, 13780–13785. [Google Scholar] [CrossRef] [PubMed] [Green Version]
  7. Scanlan, P.D.; Shanahan, F.; Mahony, C.O.; Marchesi, J.R. Culture-Independent Analyses of Temporal Variation of the Dominant Fecal Microbiota and Targeted Bacterial Subgroups in Crohn’ s Disease. J. Clin. Microbiol. 2006, 44, 3980–3988. [Google Scholar] [CrossRef] [Green Version]
  8. Lai, S.; Molfino, A.; Testorio, M.; Perrotta, A.M.; Currado, A.; Pintus, G.; Pietrucci, D.; Unida, V.; La Rocca, D.; Biocca, S.; et al. Effect of Low-Protein Diet and Inulin on Microbiota and Clinical Parameters in Patients with Chronic Kidney Disease. Nutrients 2019, 11, 3006. [Google Scholar] [CrossRef] [PubMed] [Green Version]
  9. Levine, A.; Boneh, R.S.; Wine, E. Evolving role of diet in the pathogenesis and treatment of inflammatory bowel diseases. Gut 2018, 67, 1726–1738. [Google Scholar] [CrossRef] [PubMed]
  10. Lo, C.-H.; Lochhead, P.; Khalili, H.; Song, M.; Tabung, F.K.; Burke, K.E.; Richter, J.M.; Giovannucci, E.L.; Chan, A.T.; Ananthakrishnan, A.N. Dietary Inflammatory Potential and Risk of Crohn’s Disease and Ulcerative Colitis. Gastroenterology 2020, 159, 873–883.e1. [Google Scholar] [CrossRef]
  11. Hildebrandt, M.A.; Hoffmann, C.; Sherrill–Mix, S.A.; Keilbaugh, S.A.; Hamady, M.; Chen, Y.-Y.; Knight, R.; Ahima, R.S.; Bushman, F.; Wu, G.D. High-Fat Diet Determines the Composition of the Murine Gut Microbiome Independently of Obesity. Gastroenterology 2009, 137, 1716–1724.e2. [Google Scholar] [CrossRef] [Green Version]
  12. De Filippo, C.; Cavalieri, D.; Di Paola, M.; Ramazzotti, M.; Poullet, J.B.; Massart, S.; Collini, S.; Pieraccini, G.; Lionetti, P. Impact of diet in shaping gut microbiota revealed by a comparative study in children from Europe and rural Africa. Proc. Natl. Acad. Sci. USA 2010, 107, 14691–14696. [Google Scholar] [CrossRef] [Green Version]
  13. Probert, C.S.; Jayanthi, V.; Hughes, A.O.; Thompson, J.R.; Wicks, A.C.; Mayberry, J.F. 1993. Prevalence and family risk of ulcerative colitis and Crohn’s disease: An epidemiological study among Europeans and south Asians in Leicestershire. Gut 1993, 34, 1547–1551. [Google Scholar] [CrossRef] [Green Version]
  14. Acosta, M.B.-D.; Castro, A.A.; Souto, R.; Iglesias, M.; Lorenzo, A.; Dominguez-Muñoz, J. Emigration to western industrialized countries: A risk factor for developing inflammatory bowel disease. J. Crohn’s Coliti 2011, 5, 566–569. [Google Scholar] [CrossRef] [Green Version]
  15. Li, X.; Sundquist, J.; Hemminki, K.; Sundquist, K. Risk of inflammatory bowel disease in first- and second-generation immigrants in Sweden: A nationwide follow-up study. Inflamm Bowel Dis. 2011, 17, 1784–1791. [Google Scholar] [CrossRef]
  16. Desai, M.S.; Seekatz, A.M.; Koropatkin, N.M.; Kamada, N.; Hickey, C.A.; Wolter, M.; Pudlo, N.A.; Kitamoto, S.; Terrapon, N.; Muller, A.; et al. A Dietary Fiber-Deprived Gut Microbiota Degrades the Colonic Mucus Barrier and Enhances Pathogen Susceptibility. Cell 2016, 167, 1339–1353.e21. [Google Scholar] [CrossRef] [Green Version]
  17. Khan, S.; Waliullah, S.; Godfrey, V.; Khan, A.W.; Ramachandran, R.A.; Cantarel, B.L.; Behrendt, C.; Peng, L.; Hooper, L.V.; Zaki, H. Dietary simple sugars alter microbial ecology in the gut and promote colitis in mice. Sci. Transl. Med. 2020, 12. [Google Scholar] [CrossRef] [PubMed]
  18. Devkota, S.; Wang, Y.; Musch, M.W.; Leone, V.; Fehlner-Peach, H.; Nadimpalli, A.; Antonopoulos, D.A.; Jabri, B.; Chang, E.B. Dietary-fat-induced taurocholic acid promotes pathobiont expansion and colitis in Il10−/− mice. Nature 2012, 487, 104–108. [Google Scholar] [CrossRef] [Green Version]
  19. Ruiz, P.A.; Morón, B.; Becker, H.M.; Lang, S.; Atrott, K.; Spalinger, M.R.; Scharl, M.; Wojtal, K.A.; Fischbeck-Terhalle, A.; Frey-Wagner, I.; et al. Titanium dioxide nanoparticles exacerbate DSS-induced colitis: Role of the NLRP3 inflammasome. Gut 2017, 66, 1216–1224. [Google Scholar] [CrossRef] [Green Version]
  20. Suez, J.; Korem, T.; Zeevi, D.; Zilberman-Schapira, G.; Thaiss, C.A.; Maza, O.; Israeli, D.; Zmora, N.; Gilad, S.; Weinberger, A.; et al. Artificial sweeteners induce glucose intolerance by altering the gut microbiota. Nature 2014, 514, 181–186. [Google Scholar] [CrossRef]
  21. Chassaing, B.; Koren, O.; Goodrich, J.K.; Poole, A.C.; Srinivasan, S.; Ley, R.E.; Gewirtz, A.T. Dietary emulsifiers impact the mouse gut microbiota promoting colitis and metabolic syndrome. Nature 2015, 519, 92–96. [Google Scholar] [CrossRef] [Green Version]
  22. Chassaing, B.; Van De Wiele, T.; De Bodt, J.; Marzorati, M.; Gewirtz, A.T. Dietary emulsifiers directly alter human microbiota composition and gene expression ex vivo potentiating intestinal inflammation. Gut 2017, 66, 1414–1427. [Google Scholar] [CrossRef]
  23. Laudisi, F.; Stolfi, C.; Monteleone, G. Impact of Food Additives on Gut Homeostasis. Nutrients 2019, 11, 2334. [Google Scholar] [CrossRef] [Green Version]
  24. Barros, V.J.D.S.; Severo, J.S.; Mendes, P.H.M.; da Silva, A.C.A.; de Oliveira, K.B.V.; Parente, J.M.L.; Lima, M.M.; Neto, E.M.M.; dos Santos, A.A.; Tolentino, M. Effect of dietary interventions on inflammatory biomarkers of inflammatory bowel diseases: A systematic review of clinical trials. Nutrition 2021, 91–92, 111457. [Google Scholar] [CrossRef]
  25. Hill-Burns, E.M.; Debelius, J.W.; Morton, J.T.; Wissemann, W.T.; Lewis, M.R.; Wallen, Z.D.; Peddada, S.D.; Factor, S.A.; Molho, E.; Zabetian, C.P.; et al. Parkinson’s Disease and Parkinson’s Disease Medications Have Distinct Signatures of the Gut Microbiome. Mov. Disord. 2017, 32, 739–749. [Google Scholar] [CrossRef]
  26. Pietrucci, D.; Cerroni, R.; Unida, V.; Farcomeni, A.; Pierantozzi, M.; Mercuri, N.B.; Biocca, S.; Stefani, A.; Desideri, A. Dysbiosis of gut microbiota in a selected population of Parkinson’s patients. Parkinsonism Relat. Disord. 2019, 65, 124–130. [Google Scholar] [CrossRef]
  27. Bolyen, E.; Rideout, J.R.; Dillon, M.R.; Bokulich, N.A.; Abnet, C.C.; Al-Ghalith, G.A.; Alexander, H.; Alm, E.J.; Arumugam, M.; Asnicar, F.; et al. Reproducible, interactive, scalable and extensible microbiome data science using QIIME 2. Nat. Biotechnol. 2019, 37, 852–857. [Google Scholar] [CrossRef]
  28. Callahan, B.J.; Mcmurdie, P.J.; Rosen, M.J.; Han, A.W.; Johnson, A.J.A.; Holmes, S.P. DADA2: High-resolution sample inference from Illumina amplicon data. Nat. Methods 2016, 13, 581–583. [Google Scholar] [CrossRef] [Green Version]
  29. Bokulich, N.A.; Subramanian, S.; Faith, J.J.; Gevers, D.; Gordon, J.I.; Knight, R.; Mills, D.A.; Caporaso, J.G. Quality-filtering vastly improves diversity estimates from Illumina amplicon sequencing. Nat. Methods 2013, 10, 57–59. [Google Scholar] [CrossRef]
  30. Quast, C.; Pruesse, E.; Yilmaz, P.; Gerken, J.; Schweer, T.; Yarza, P.; Peplies, J.; Glockner, F.O. The SILVA ribosomal RNA gene database project: Improved data processing and web-based tools. Nucleic Acids Res. 2013, 41, D590–D596. [Google Scholar] [CrossRef]
  31. Love, M.I.; Huber, W.; Anders, S. Moderated estimation of fold change and dispersion for RNA-seq data with DESeq2. Genome Biol. 2014, 15, 550. [Google Scholar] [CrossRef] [Green Version]
  32. McMurdie, P.J.; Holmes, S. phyloseq: An R Package for Reproducible Interactive Analysis and Graphics of Microbiome Census Data. PLoS ONE 2013, 8, e61217. [Google Scholar] [CrossRef] [Green Version]
  33. McMurdie, P.; Holmes, S. Waste Not, Want Not: Why Rarefying Microbiome Data Is Inadmissible. PLOS Comput. Biol. 2014, 10, e1003531. [Google Scholar] [CrossRef] [Green Version]
  34. Clooney, A.G.; Eckenberger, J.; Laserna-Mendieta, E.; A Sexton, K.; Bernstein, M.T.; Vagianos, K.; Sargent, M.; Ryan, F.; Moran, C.; Sheehan, D.; et al. Ranking microbiome variance in inflammatory bowel disease: A large longitudinal intercontinental study. Gut 2020, 70, 499–510. [Google Scholar] [CrossRef]
  35. Manichanh, C.; Rigottier-Gois, L.; Bonnaud, E.; Gloux, K.; Pelletier, E.; Frangeul, L.; Nalin, R.; Jarrin, C.; Chardon, P.; Marteau, P.; et al. Reduced diversity of faecal microbiota in Crohn’s disease revealed by a metagenomic approach. Gut 2006, 55, 205–211. [Google Scholar] [CrossRef] [Green Version]
  36. Connolly, M.L.; Tuohy, K.M.; Lovegrove, J.A. Wholegrain oat-based cereals have prebiotic potential and low glycaemic index. Br. J. Nutr. 2012, 108, 2198–2206. [Google Scholar] [CrossRef] [Green Version]
  37. Satsangi, J.; Silverberg, M.S.; Vermeire, S.; Colombel, J.F. The Montreal classification of inflammatory bowel disease: Controversies, consensus, and implications. Gut 2006, 55, 749–753. [Google Scholar] [CrossRef] [Green Version]
  38. Yurkovetskiy, L.; Burrows, M.; Khan, A.A.; Graham, L.; Volchkov, P.; Becker, L.; Antonopoulos, D.; Umesaki, Y.; Chervonsky, A.V. Gender Bias in Autoimmunity Is Influenced by Microbiota. Immunity 2013, 39, 400–412. [Google Scholar] [CrossRef] [Green Version]
  39. Markle, J.G.M.; Frank, D.N.; Mortin-Toth, S.; Robertson, C.E.; Feazel, L.M.; Rolle-Kampczyk, U.; von Bergen, M.; McCoy, K.D.; Macpherson, A.J.; Danska, J.S. Sex Differences in the Gut Microbiome Drive Hormone-Dependent Regulation of Autoimmunity. Science 2013, 339, 1084–1088. [Google Scholar] [CrossRef] [Green Version]
  40. Mueller, S.; Saunier, K.; Hanisch, C.; Norin, E.; Alm, L.; Midtvedt, T.; Cresci, A.; Silvi, S.; Orpianesi, C.; Verdenelli, M.C.; et al. Differences in Fecal Microbiota in Different European Study Populations in Relation to Age, Gender, and Country: A Cross-Sectional Study. Appl. Environ. Microbiol. 2006, 72, 1027–1033. [Google Scholar] [CrossRef] [Green Version]
  41. David, L.A.; Maurice, C.F.; Carmody, R.N.; Gootenberg, D.B.; Button, J.E.; Wolfe, B.E.; Ling, A.V.; Devlin, A.S.; Varma, Y.; Fischbach, M.A.; et al. Diet rapidly and reproducibly alters the human gut microbiome. Nature 2014, 505, 559–563. [Google Scholar] [CrossRef] [Green Version]
  42. Zhu, Y.; Lin, X.; Zhao, F.; Shi, X.; Li, H.; Li, Y.; Zhu, W.; Xu, X.; Li, C.; Zhou, G. Meat, dairy and plant proteins alter bacterial composition of rat gut bacteria. Sci. Rep. 2015, 5, 15220. [Google Scholar] [CrossRef] [Green Version]
  43. Salles, N. Basic Mechanisms of the Aging Gastrointestinal Tract. Dig. Dis. 2007, 25, 112–117. [Google Scholar] [CrossRef]
  44. Arias, M.; Cobo, M.; Jaime-Sánchez, P.; Pastor, J.; Marijuan, P.; Pardo, J.; Rezusta, A.; Del Campo, R. Gut microbiota and systemic inflammation changes after bread consumption: The ingredients and the processing influence. J. Funct. Foods 2017, 32, 98–105. [Google Scholar] [CrossRef]
  45. Parada Venegas, D.; De la Fuente, M.K.; Landskron, G.; Gonzalez, M.J.; Quera, R.; Dijkstra, G.; Harmsen, H.J.M.; Faber, K.N.; Hermoso, M.A. Short Chain Fatty Acids (SCFAs)-Mediated Gut Epithelial and Immune Regulation and Its Relevance for Inflammatory Bowel Diseases. Front Immunol. 2019, 10, 277. [Google Scholar] [CrossRef] [Green Version]
  46. Waters, J.L.; Ley, R.E. The human gut bacteria Christensenellaceae are widespread, heritable, and associated with health. BMC Biol. 2019, 17, 1–11. [Google Scholar] [CrossRef]
  47. Morgan, X.C.; Tickle, T.L.; Sokol, H.; Gevers, D.; Devaney, K.L.; Ward, D.V.; Reyes, J.A.; Shah, S.A.; LeLeiko, N.; Snapper, S.B.; et al. Dysfunction of the intestinal microbiome in inflammatory bowel disease and treatment. Genome Biol. 2012, 13, R79. [Google Scholar] [CrossRef]
  48. Presti, A.L.; Zorzi, F.; Del Chierico, F.; Altomare, A.; Cocca, S.; Avola, A.; De Biasio, F.; Russo, A.; Cella, E.; Reddel, S.; et al. Fecal and Mucosal Microbiota Profiling in Irritable Bowel Syndrome and Inflammatory Bowel Disease. Front. Microbiol. 2019, 10, 1655. [Google Scholar] [CrossRef] [Green Version]
  49. Alam, M.T.; Amos, G.; Murphy, A.R.J.; Murch, S.; Wellington, E.M.H.; Arasaradnam, R.P. Microbial imbalance in inflammatory bowel disease patients at different taxonomic levels. Gut Pathog. 2020, 12, 1–8. [Google Scholar] [CrossRef]
  50. Mottawea, W.; Chiang, C.-K.; Mühlbauer, M.; Starr, A.E.; Butcher, J.; Abujamel, T.; Deeke, S.A.; Brandel, A.; Zhou, H.; Shokralla, S.; et al. Altered intestinal microbiota–host mitochondria crosstalk in new onset Crohn’s disease. Nat. Commun. 2016, 7, 13419. [Google Scholar] [CrossRef]
  51. Nagao-Kitamoto, H.; Kamada, N. Host-microbial Cross-talk in Inflammatory Bowel Disease. Immune Netw. 2017, 17, 1–12. [Google Scholar] [CrossRef] [Green Version]
  52. Pitcher, M.C.L.; Beatty, E.R.; Cummings, J.H. The contribution of sulphate reducing bacteria and 5-aminosalicylic acid to faecal sulphide in patients with ulcerative colitis. Gut 2000, 46, 64–72. [Google Scholar] [CrossRef] [Green Version]
  53. Papa, E.; Docktor, M.; Smillie, C.; Weber, S.; Preheim, S.P.; Gevers, D.; Giannoukos, G.; Ciulla, D.; Tabbaa, D.; Ingram, J.; et al. Non-Invasive Mapping of the Gastrointestinal Microbiota Identifies Children with Inflammatory Bowel Disease. PLoS ONE 2012, 7, e39242. [Google Scholar] [CrossRef] [Green Version]
  54. Wang, W.; Chen, L.; Zhou, R.; Wang, X.; Song, L.; Huang, S.; Wang, G.; Xia, B.; Forbes, B.A. Increased Proportions of Bifidobacterium and the Lactobacillus Group and Loss of Butyrate-Producing Bacteria in Inflammatory Bowel Disease. J. Clin. Microbiol. 2013, 52, 398–406. [Google Scholar] [CrossRef] [Green Version]
  55. Chen, L.; Wang, W.; Zhou, R.; Ng, S.C.; Li, J.; Huang, M.; Zhou, F.; Wang, X.; Shen, B.; Kamm, M.A.; et al. Characteristics of Fecal and Mucosa-Associated Microbiota in Chinese Patients With Inflammatory Bowel Disease. Medicine 2014, 93, e51. [Google Scholar] [CrossRef]
  56. Vujkovic-Cvijin, I.; Sklar, J.; Jiang, L.; Natarajan, L.; Knight, R.; Belkaid, Y. Host variables confound gut microbiota studies of human disease. Nature 2020, 587, 448–454. [Google Scholar] [CrossRef]
Figure 1. Differentially abundant bacterial families in samples from the CD (cyan) and UC patients (green) compared with the HC (pink), as detected using a GLM model only considering the IBD status (A) or using a GLM considering the IBD status and covariates and confounders (B). The relative abundance is plotted in log10 on the y-axis.
Nutrients 14 00260 g001
Figure 2. Venn diagram indicating the bacterial families identified using the IBD and IBDCC models.
Nutrients 14 00260 g002
Figure 3. Bacterial families that were differentially present in the samples from the B1 (green), B2 (cyan) and B3 (purple) patients compared with the HC (pink). The relative abundance is plotted in log10 on the y-axis.
Nutrients 14 00260 g003
Figure 4. Bacterial families that were differentially abundant in samples from the E1 (green), E2 (cyan) and E3 (purple) patients compared with the HC (pink). The relative abundance is plotted in log10 on the y-axis.
Nutrients 14 00260 g004
Table 1. Regression PERMANOVA using four metrics to evaluate the β-diversity and identify microbiota shaping variables using a stepwise regression through manual backward elimination. The symbols indicate the p-value threshold (‘’*”: p-value ≤ 0.05, “**”: p-value ≤ 0.01 and “***”: p-value ≤ 0.001).
Bray–CurtisUnweighted UnifracWeighted UnifracCanberra
IBD0.0001 ***0.0001 ***0.0001 ***0.0001 ***
Age0.0473 * 0.0265 *
Gender0.0399 * 0.0052 **
Bread 0.0304 *
Yogurt 0.0367 *
Dairy products 0.0178 *
Table 2. Analysis of the variables’ (covariates and confounders) impact on bacterial families that were differently identified using the IBD and IBDCC models. The significance of the Atopobiaceae family was related to the presence of the “cereals” variable. The symbol “*” indicates a p-value ≤ 0.05.
ModelAtopobiaceae
IBD + cerealsN.S.
IBD + covariates + confounders (not including cereals)0.0236 *
IBD + covariates + confounders (including cereals)N.S.
IBD 0.0147 *
Publisher’s Note: MDPI stays neutral with regard to jurisdictional claims in published maps and institutional affiliations.

