Abstract
Since COVID-19, global reports indicate changes in dietary habits and food security status of the population. As a follow-up to an earlier study conducted in 2020, the purpose of this online cross-sectional study was to examine food security and food attitudes and their subsequent impact on dietary habits since March 2020 and potential associations with demographics, health characteristics and lifestyle habits on dietary habits. Participants (n = 2036) responded to a 71-item online survey conducted between February–March 2022. Frequency counts and percentages were tabulated, and multivariate linear regressions were conducted to examine associations. Results showed that most participants indicated no change in dietary habits (45.9–88.8%) for the listed food and beverage items. A significant positive association for food attitudes scores (1.11, 95% CI 0.93 to 1.29; p < 0.001) and food security scores (0.53, 95% CI 0.35 to 0.71; p < 0.001) on total dietary habits was found. Further, significant positive associations were seen with various health characteristics such as medical conditions (p = 0.01) and lifestyle habits such as preparing meals at home (p < 0.001). A negative association was observed with females on total dietary habits (p < 0.001). It is necessary to encourage adults in the US to maintain the positive dietary and lifestyle habits they acquired since March 2020 in their daily living. Future studies should investigate the impact these habits have on their health long-term and sustained positive dietary and lifestyle habits.
1. Introduction
Coronavirus, also known as COVID-19, has contributed to over 1 million deaths and over 96 million infected in the United States (US), with the highest mortality rates associated with those who had respiratory issues (48.6%), hypertension (18.3%,) or diabetes (15.0%) [1]. This virus has led to hardships, as in early March 2020, business sales dropped, and food prices increased, causing a projected rise in food insecurity [2]. For instance, for a week during 15 March 2020, it was recorded that 3.3 million people lost their jobs, with an estimated 26 million jobs lost in the first five weeks of the confinement period [3]. The effects of confinement on the labor market were severe and impacted many adults in the US in the past two years since March 2020; nonetheless, the unemployment rate has decreased from 5.8% in 2021 to 3.6% in 2022 [4].
Along with the financial issues caused by COVID-19, issues pertaining to the population’s access to food also developed. During the rise of the pandemic, many consumers took part in panic shopping, thus over-purchased foods that led to supply chain issues and possibly the elevation in food prices [5]. The types of foods commonly purchased during panic shopping tended to be packaged, processed, and overall, less expensive, thus providing more fats, sugars, and sodium [6,7]. For example, one cross-sectional observational study demonstrated that 43.8% of participants (n = 3313) reported an increase in consumption of sweets such as candy, cake, cookies, and pie [8]. This is similar to other studies that showed that consuming foods considered high in saturated fats, added sugars, and sodium increased during this time [9,10,11,12,13,14]. On the other hand, due to safety concerns, consumers may have been cooking and eating more at home and/or participating in meal kit delivery services [15]. These safety concerns may have been the primary reason for an increase in online grocery shopping since COVID-19, as was reported in a meta-analysis that included a total sample of 20,538 participants [16].
Beyond challenges associated with accessing and obtaining food, mental health issues increased due to adults’ isolation and loneliness throughout COVID-19. A cross-sectional observational study (n = 20,215) discovered that a majority (77.7%) of the participants stayed at home 50% to 95% of the time since March 2020 [17]. The authors reported that staying at home for long periods of time, which may limit social interactions, can play a major part in growing mental health issues. Individuals that were most prone to mental health challenges due to COVID-19 included elders, academics, healthcare workers, children and teenagers, and people with a family psychiatric history [18]. Furthermore, lifestyle habits like sleeping, exercise, and eating may have been altered during COVID-19 [19]. Based on observational studies, most respondents decreased dining in restaurants and grocery shopping in the store; and increased levels of ordering takeout or delivery meals from restaurants and using electronic devices [8,20,21,22,23]. The authors had conducted a prior study in early 2020; thus, as a follow-up study, the current aim was to examine food security and food attitudes and their subsequent impact on dietary habits and potential associations with demographics, health characteristics and lifestyle habits on dietary habits since March 2020.
2. Materials and Methods
2.1. Study Design and Participants
This cross-sectional study was conducted online through QualtricsXM, an online survey platform from February–May 2022. Recruitment occurred through ResearchMatch [24] and was voluntary and anonymous. Adults were eligible to participate if they were above the age of 18, could read in the English language, and had lived in the US since March 2020. Adults who did not meet these inclusion criteria were excluded from this study. All participants provided their informed consent prior to completing the survey. A total of 2053 adults initially participated, and 2036 completed the entirety of the survey (see Figure 1). All study protocols were granted ethical approval by the University of Florida Institutional Review Board # 202001147.
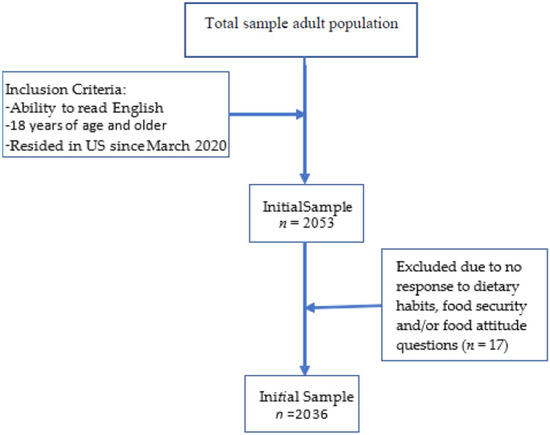
Figure 1.
Sample collection chart.
2.2. Survey
Participants responded to a 71-item survey that was used in a previous COVID-19 study (Supplementary Material Table S1) [8]. Briefly, this survey included questions about demographics (8 items), health information (10 items), lifestyle habits (11 items), dietary habits (30 items), food attitudes (6 items), and food security status (6). The researchers (A.B.Z. and J.M.A.) developed this questionnaire using adapted validated instruments [25,26,27]. The total length of time to complete the survey was 10 min.
For the survey, demographic items included age, sex, race/ethnicity, education level, employment status, geographic location of residence, and current time spent at home. Health information items were self-reported by the participants. They included weight changes, health conditions, supplement use, and if participants had followed a diet since March 2020, current height reported in feet and inches and weight reported in pounds for the researchers to calculate Body Mass Index (BMI) (body mass (kg)/height (m2)) and interpreted based on criteria of the Centers for Disease Control and Prevention [28].
2.2.1. Lifestyle Habits
Participants indicated if certain lifestyle habits such as physical and social activities increased, decreased, did not change, or never participated prior to or during March 2020. Compared to the survey conducted during confinement in 2020 by the researchers, additional questions were added to this part of the survey, including using meal-kit services, ordering take-out or delivery services, preparing meals inside the home, and grocery shopping in stores compared to online due to input from a pilot study of adults (n = 25). The reliability of this revised instrument was Cronbach α = 0.65 compared to the previous instrument at Cronbach α = 0.52, which is considered acceptable [29]. Furthermore, the Pearson correlation coefficient value for each item was >0.25, which indicates acceptable validity [29]. The scoring of this instrument was the same as the prior study [8], in which a response of no change or never participated received a score of 0. For the added item of ordering take-out or delivery services plus the items from the previous study that were considered unfavorable to health, a score of 1 was provided [11,30]. If participants indicated a decrease in those activities from that additional item and the prior ones or an increase in the previous activities plus the additional items of using meal-kit services, preparing meals more in the home and grocery shopping in stores, it resulted in a score of 2, as these activities were considered favorable to health. Total scores ranged from 0–24, with higher scores resulting in favorable lifestyle habits.
2.2.2. Dietary Habits
Participants responded to a total of 30 items about if their dietary habits increased, decreased, did not change, or never consumed since March 2020, which was based on the Dana-Farber’s Cancer Institute Eating Habits Questionnaire [25]. As the original instrument contained 61 items and had different responses (e.g., daily, 1–3 times weekly), the modification was made to minimize potential survey exhaustion from participants [31,32]. The reliability of this revised instrument was Cronbach α = 0.89, which is considered acceptable [29]. Furthermore, the Pearson correlation coefficient value for each item was >0.25, which indicates acceptable validity [29]. As was completed in a previous study [8], participants who indicated they did not change or never consumed that food/beverage received a score of 0, and participants who responded an increased consumption of food/beverage items that were considered nutrient-dense obtained a score of 2 for each item or a 1 if they decreased or increased consumption of foods/beverages considered energy-dense [33,34]. The total scores ranged from 0–60 points, with higher scores indicating more nutrient-dense foods/beverages consumed.
2.2.3. Food Attitudes
Participants also responded to 8 statements regarding food attitudes since March 2020 from increase, decrease, or no change (never had these thoughts) based on the modified Yale Food Addiction Scale [26]. The reliability of this revised instrument was Cronbach α = 0.88, which is considered acceptable [29]. Furthermore, the Pearson correlation coefficient value for each item was >0.25, which indicates acceptable validity [29]. Total scores ranged from 0–16, in which participants who had no change or never had these thoughts obtained a score of 0, an increased response received a score of 2, and a decreased response received a score of 1.
2.2.4. Food Security
Household food security was measured using the validated 6-item shortened USDA Food Security Module [27,35]. This instrument was modified to include ‘since March 2020′ prior to each item with reliability of Cronbach α = 0.78, which is considered acceptable [29]. Pearson correlations of >0.25 for each item indicated acceptable validity [29]. The instrument was scored on a scale from 0 to 6, with lower scores indicating high or marginal food security and higher scores representing food insecurity [27].
2.3. Statistical Analysis
Frequency counts and percentages were tabulated for demographic variables and dietary habits. Multivariate linear regression was conducted to examine associations between food insecurity and attitudes (confounders) with dietary habits (interest variable) (Table 1). An additional regression was conducted that focused on the confounding variables–demographics, health characteristics, and lifestyle habits on dietary habits. Statistical significance was determined at p < 0.05. All statistical analyses were conducted using JMP SAS v16 (JMP®, Version 16. SAS Institute Inc., Cary, NC, USA, 1989–2021) [36].

Table 1.
Model for regression analysis.
3. Results
3.1. Study Population
The sample consisted of 2036 respondents, although not all participants were required to respond to all demographic or health characteristics questions. Out of those who responded to these statements, the majority were white (83.3%), female (77.1%), held a bachelor’s degree (34.4%) and were employed full-time (45.5%). Most respondents were between the ages of 30 to 49 years old (33.5%) and married (48.2%). A slight majority of the participants lived in the South Atlantic region (21.4%) and lived with one other person (39.7%). An almost equal number of participants reported that they have stayed in their homes 50% to 75% of the time (38.8%) and 75% to 95% of the time (38.9%) since March 2020 (Table 2).
Table 2.
Participants’ demographics.
Health Characteristics and Anthropometrics
For participants who responded to these questions, health characteristics and anthropometrics revealed that based on the calculated body mass index (BMI) kg/m2, many participants were considered overweight/obese (57.6%). Most participants indicated that their weight increased since March 2020 (44.6%), did not try a diet (62.9%), nor take any supplements (68.8%). Of those reporting that they took supplements, the majority were taking four or more (42.7%). Respondents also reported having two (29.2%) or three or more medical conditions (25.1%) (Table 3).
Table 3.
Participants’ general health characteristics and anthropometrics.
3.2. Dietary Habits
The average score for total dietary habits was 15.74 ± 10.88, with a range of scores from 0 to 51. No change in dietary habits for the food and beverage items included in the survey was reported by most participants (45.9–88.8%). Although, for certain foods and beverages, participants reported increased consumption of water (42.0%); sweets, including cakes, cookies, and pies (38.5%); coffee or tea (35.3%); nuts or seeds (33.9%); non-starchy vegetables (33.2%); fruit (31.8%); potato chips or salty snacks (31.5%); peanut butter or other nut butter (25.1%); white rice or pasta (24.6%); and fish and shellfish (20.8%). For other food and beverage items in the survey, participants reported a decreased consumption of beef, pork, or lamb (27.6%); processed meats such as bacon, hot dogs, luncheon meats, sausage (24.7%); French fried potatoes (19.9%); and white bread including pita bread (15.8%) (Table 4).
Table 4.
Frequency and counts of foods/beverages consumed since March 2020 (n = 2036).
3.3. Association between Food Security Status and Food Attitudes on Dietary Habits
On average, the total food attitudes score was 2.47 ± 2.81, ranging from scores of 0 to 12. The average score for food security was 1.17 ± 2.62, with a minimum score of 0 and a maximum score of 10. Multivariate linear regression was used to determine the significant positive association between food attitudes score with total dietary habits score (1.11, 95% CI 0.93 to 1.29; p < 0.001) along with a positive association between food security score and total dietary habits score (0.53, 95% CI 0.35 to 0.71; p < 0.001). Furthermore, significant positive association with medical conditions (0.13, 95% CI 0.03 to 0.22; p = 0.01), tried a diet (1.53, 9% CI 0.56 to 2.49; p < 0.001), and nutritional supplement intake (2.55, 95% CI 1.57 to 3.54; p < 0.001) with total dietary habits. A significant negative association was discovered between the female sex and total dietary habits score (−1.97, 95% CI −2.98 to −0.95; p < 0.001) (Table 5).
Table 5.
Multiple linear regression of food attitudes, food security, demographics, and total dietary habit scores (n = 2036).
Additional multivariable associations were studied with total dietary habits scores. A positive association was found between physical activity (1.24, 95% CI 0.61 to 1.87; p < 0.001), preparing/cooking meals in the home (0.99, 95% CI 0.41 to 1.57; p < 0.001), meal kit services (1.18, 95% CI 0.48 to 1.88; p < 0.001), take-out/delivery of meals from restaurants (1.06, 95% CI 0.33 to 1.78; p < 0.001), grocery shopping in the store (1.14, 95% CI 0.52 to 1.76; p < 0.001), reading/studying (0.81, 95% CI 0.31 to 1.30; p < 0.001), sleeping hours and quality (1.09, 95% CI 0.50 to 1.67; p < 0.001), smoking (2.13, 95% CI 1.07 to 3.20; p < 0.001), and using electronic devices (2.04, 95% CI 1.01 to 3.08; p < 0.001) with total dietary habits score (Table 6).
Table 6.
Multiple linear regression of impact of other attributes on total dietary habits (n = 2036).
4. Discussion
This study sought to examine food security and food attitudes and their subsequent impact on dietary habits since March 2020 and potential associations of demographics, health characteristics, and lifestyle habits with dietary habits. Results from this study showed that the association between dietary habits with food attitudes and food security continued to impact US adults in various ways. Even though a majority of participants indicated their dietary habits did not change, for those who did indicate a change, they increased their consumption of water, coffee or tea, salty and sweet foods/snacks, and decreased their consumption of white bread, red and processed meats. Furthermore, multiple lifestyle changes such as physical activity, grocery shopping in the store, meal kit services, and preparing/cooking meals at home positively impacted dietary habit scores. Factors such as medical conditions, tried a diet, and nutritional supplements intake had a significant positive relationship with dietary habit scores. In contrast, females negatively affected dietary habit scores.
Regarding dietary habits, females may have differed more than males, possibly due to preferences, and social and environmental factors [37,38,39]. As demonstrated in COVID-19 specific studies related to dietary habits, Hassen and colleagues demonstrated that females (n = 511) and males (n = 484) had different consumption patterns dependent on the country of residence. For example, in Morocco, females consumed more food due to fear, stress, and anxiety over COVID-19 compared to males, but in Egypt, males consumed more comfort food than females [40]. Another study that focused on 3 European countries–Denmark, Germany, and Slovenia, of a total of 2680 adults, showed that there were differences in consumption habits of males and females of foods/beverages that increased or decreased. For example, in Denmark, females increased their consumption of fresh fruits and vegetables, cakes and biscuits, and sweets and chocolate, whereas males decreased their consumption of fresh meats, fresh fish, cakes and biscuits, and increased consumption of canned foods [41]. However, the results of this study must proceed with caution as females were overrepresented as slightly more than 77% participated. Moreover, this study found that most adults who reported a change in dietary habits decreased their consumption of red and processed meats such as bacon and hotdogs, white bread, and French-fried potatoes. Along with a decrease in these items, there was a reported increase in consumption of alcohol, low-carbonated beverages, eggs, chicken or turkey, potatoes, starchy vegetables, and salty snacks. In addition, a greater daily intake of water, coffee or tea, immune-enhancing beverages, nuts, fruits, non-starchy vegetables, oils, and sweets such as cake, cookies, and pie were observed. In contrast to the survey conducted during the confinement in 2020 within the US population, there was an increase in the consumption of immune-enhancing beverages while a decrease in white bread and French-fried potatoes [8]. Immune-enhancing beverages may have increased due to participants’ perceptions of reducing the risk for illness. The greater intake of sweets remained significant during and post-March 2020, and alcohol consumption remained high in both surveys, possibly due to anxiety from the pandemic or returning to work [42,43]. Findings from this study were consistent with other studies, Kyprianidou et al. [44] and Caso et al. [45], regarding the increased consumption of alcohol, nuts, and oils. Moreover, Kyprianidou et al. [44] explored changes in dietary and lifestyle habits through two observational studies during (n = 1460) and after (n = 1043) the COVID-19 confinement. According to their findings, post-confinement consumption of fruit/vegetables was 11% less than during confinement. This contradicts findings from this study that participants have continued increasing fruits and vegetables consumption (31.8% and 33.2%), respectively, since March 2020. Compared to the results of this study, Alvarez-Gómez et al. [46] revealed that Spanish consumers (n = 510) increased their intake of red meat post-COVID19 confinement due to the increased access to local markets within the country, which conflicts with the findings from this study. Overall, though, Alvarez-Gómez et al. [46] discovered that healthy dietary and lifestyle habits, including an increase in fruit and vegetable consumption by 27% and 21%, respectively, occurred compared to pre-pandemic consumption. The higher intake of fruit and vegetables could be explained by accessibility, availability in the market, and continuing dietary habits acquired during the confinement period. Even though findings from various studies demonstrated changes in dietary habits since March 2020, very few have been conducted compared to when the confinement period occurred.
Lifestyle factors contributed positively to participants’ dietary habits. For instance, although 42.3% of participants indicated that their physical activity decreased since March 2020, physical activity was found to have a significant positive relationship with dietary habits (p < 0.001). As many participants in this study were not at home as frequently since March 2020, it may have affected their physical activity habits due to less time available. Moreover, if someone was active since the confinement period, potentially their dietary habits may have largely remained unchanged in which they were already consuming nutritious foods. Kyprianidou et al. [44] reported that in the Cyprus population, physical activity had decreased after the COVID-19 confinement, which aligns with this current study. Additionally, results from this study revealed that medical conditions contributed positively to dietary habits; this could be related to the healthier dietary and lifestyle habits developed during the confinement due to the participant’s awareness towards nutritious habits may lower their risk for other health problems, complications, and death. Although, no data was collected on these markers to confirm health status since March 2020. Furthermore, positive dietary habits may have been caused by more cooking at home, which causes an increase in fruit and vegetable consumption and less socializing outside the home [47,48].
Indeed, preparing/cooking meals in the home were significantly increased, as shown in this study (p < 0.001). This could be due to participants decreasing socialization outside the home and enjoying cooking habits acquired since March 2020. Moreover, meal kit services were significantly associated with positive dietary habits (p < 0.001), which could explain the increase in cooking meals at home. Meal-kit services are usually based on a subscription service, where the individual may customize meals to fit dietary preferences and receive pre-packaged fresh ingredients throughout the week. Based on a study conducted in Australia that compared 5 meal-kit delivery services with a total of 60 recipes discovered that the recipes were adequate in providing both macro and micronutrients. However, some modifications can be made to these meal-kits such as reducing sodium required in the recipes, providing more fiber-based foods and reducing the fat content, specifically saturated fat [49]. As in this study, it is unknown the frequency or types of meals ordered from these meal-kit services, relating the increased intake of certain foods from the dietary habits to the increased ordering of these services, cannot be made. The findings from this study are consistent with those made by Alvarez-Gómez et al. [46], who indicated that most people did not order food at home after confinement, showing that cooking at home was a practice that increased in frequency since confinement in Spain. Furthermore, Filimonau et al. [50] revealed the same results in England households where most enjoyed cooking at home during and after national confinement and agreed to eat out less post- confinement.
This study showed low overall food security and food attitude scores, indicating that participants were food secure and had positive attitudes towards food. The average total food security score was 1.17, and the average total food attitude score was 2.50. According to the USDA’s economic research service, food consumption trends in 2021 likely reflect the improved household income resulting from the economic recovery [51]. All food prices at stores were higher in July 2022 than in July 2021 [51]. Even though prices went up the most for eggs (38%) and fats and oils (20%), and poultry (16%), this study revealed that adults were consuming more of these foods, which could be related to the fact that the study sample consisted primarily of full-time working, highly educated, single individuals who were less affected by food prices than other demographic categories. Lastly, food attitude and dietary habit scores were positively correlated, which may be attributed to the demographics of the study participants as opposed to the entire US population. Lower food attitude scores indicated positive dietary habits. In fact, the effects of COVID-19 and social and economic restrictions are complicated and involve many factors that can cause different groups of people to act in different ways [52,53].
Although life in the US is slowly reverting to pre-COVID, 71% of respondents indicated that the socialization they participated in outside the home had decreased. Most participants in this study did not shop for groceries online; thus, grocery shopping in the store was significant on total dietary habit scores (p < 0.001), which may be due to preference, the atmosphere, and experience of shopping in physical stores [54]. The ability to personally select food is the primary driver of the in-store benefit [54]. Additionally, when it comes to grocery shopping, food quality has emerged as the most crucial factor to consider [54]. These results were slightly different from a study conducted in mainland China, in which results revealed that despite an increase in online grocery shopping, purchasing food in person at local supermarkets or small shops remained the most common way to obtain food in the post-lockdown period [55].
Some drawbacks of the present study must be acknowledged. First, due to the survey being conducted online, those who did not have access to a computer or the internet could not participate; therefore, selection bias resulted from the sample size and was not representative of a broader population [31,56]. This may have skewed the results with lower socioeconomic groups potentially consuming different dietary habits and participating in other lifestyle habits than those in higher socioeconomic groups. Therefore, the results from this study could not be generalized to the entire US population. Second, as a result of participants not being required to answer every survey item and may have provided inaccurate self-reporting information such as height and weight, this may have led to inaccuracies in the calculation of BMIs. Furthermore, the self-reporting bias could be from participants not remembering accurate information, wanting to look like they were in better economic standings than they were, or attempting to appear healthier based on social desirability bias [31,56].
5. Conclusions
This was the first study in the U.S. to examine changes in dietary habits, food attitudes, and security status since March 2020. The results of the present study indicated an increase in the consumption of fruits, vegetables, nuts, and immune-enhancing beverages, as well as an increase in home-cooked meals, and a decrease in the consumption of red and processed meat, and a limit on dining out and socializing outside the home since March 2020. Furthermore, as of March 2020, a significant percentage of the population had healthier lifestyle habits, such as engaging in preparing meals at home. It is crucial to encourage adults in the US to maintain the positive dietary and lifestyle habits they acquired since March 2020 in their daily living, which could have long-term health benefits. Future studies should investigate the impact these habits acquired since March 2020 have on their health long-term and if these positive dietary and lifestyle habits are sustained.
Supplementary Materials
The following supporting information can be downloaded at: https://www.mdpi.com/article/10.3390/nu14214636/s1, Table S1: Survey on US Adults’ Dietary habits, Food Attitudes, and Food security status since March 2020.
Author Contributions
Conceptualization of this study was by A.B.Z. and J.M.A.; methodology, S.T.S., A.B.Z. and J.M.A.; validation, A.B.Z. and J.M.A.; formal analysis, S.T.S. and J.M.A.; investigation, S.T.S., A.B.Z. and J.M.A.; data curation, J.M.A.; writing—original draft preparation, S.T.S. and A.B.Z.; writing—review and editing, S.T.S., A.B.Z. and J.M.A.; supervision, J.M.A.; project administration, J.M.A. All authors have read and agreed to the published version of the manuscript.
Funding
This research received no external funding.
Institutional Review Board Statement
The study was conducted in accordance with the Declaration of Helsinki, and approved by the Institutional Review Board of University of Florida (202001147, 4 June 2020).
Informed Consent Statement
Informed consent was obtained from all subjects involved in the study.
Data Availability Statement
Data is contained within the article and can be available upon request.
Conflicts of Interest
The authors declare no conflict of interest.
References
- Centers for Disease Control. COVID-19 Mortality and Overview. Available online: https://www.cdc.gov/nchs/covid19/mortality-overview.htm (accessed on 8 October 2022).
- Ahn, S.; Norwood, F.B. Measuring Food Insecurity during the COVID-19 Pandemic of Spring 2020. Appl. Econ. Perspect. Policy 2021, 43, 162–168. [Google Scholar] [CrossRef]
- Şahin, A.; Tasci, M.; Yan, J. The Unemployment Cost of COVID-19: How High and How Long? Econ. Comment. 2020, 2020, 1–7. [Google Scholar] [CrossRef]
- US Bureau of Labor Statistics. The Employment Situation—September 2022. Available online: https://www.bls.gov/news.release/pdf/empsit.pdf (accessed on 26 September 2022).
- US Bureau of Labor Statistics. The Impact of the COVID-19 Pandemic on Food Price Indexes and Data Collection. Available online: https://www.bls.gov/opub/mlr/2020/article/the-impact-of-the-covid-19-pandemic-on-food-price-indexes-and-data-collection.htm (accessed on 9 July 2022).
- O’Connell, M.; de Paula, Á.; Smith, K. Preparing for a Pandemic: Spending Dynamics and Panic Buying during the COVID-19 First Wave. Fisc. Stud. 2021, 42, 249–264. [Google Scholar] [CrossRef]
- Lehberger, M.; Kleih, A.K.; Sparke, K. Panic Buying in Times of Coronavirus (COVID-19): Extending the Theory of Planned Behavior to Understand the Stockpiling of Nonperishable Food in Germany. Appetite 2021, 161, 105118. [Google Scholar] [CrossRef] [PubMed]
- Bin Zarah, A.; Enriquez-Marulanda, J.; Andrade, J.M. Relationship between Dietary Habits, Food Attitudes and Food Security Status among Adults Living within the United States Three Months Post-Mandated Quarantine: A Cross-Sectional Study. Nutrients 2020, 12, 3468. [Google Scholar] [CrossRef]
- Cheikh Ismail, L.; Hashim, M.; Mohamad, M.N.; Hassan, H.; Ajab, A.; Stojanovska, L.; Jarrar, A.H.; Hasan, H.; Abu Jamous, D.O.; Saleh, S.T.; et al. Dietary Habits and Lifestyle During Coronavirus Pandemic Lockdown: Experience From Lebanon. Front. Nutr. 2021, 8, 606. [Google Scholar] [CrossRef]
- Górnicka, M.; Drywień, M.E.; Zielinska, M.A.; Hamułka, J. Dietary and Lifestyle Changes during COVID-19 and the Subsequent Lockdowns among Polish Adults: A Cross-Sectional Online Survey PlifeCOVID-19 Study. Nutrients 2020, 12, 2324. [Google Scholar] [CrossRef]
- Sidor, A.; Rzymski, P. Dietary Choices and Habits during COVID-19 Lockdown: Experience from Poland. Nutrients 2020, 12, 1657. [Google Scholar] [CrossRef]
- Renzo, L.D.; Gualtieri, P.; Cinelli, G.; Bigioni, G.; Soldati, L.; Attinà, A.; Bianco, F.F.; Caparello, G.; Camodeca, V.; Carrano, E.; et al. Psychological Aspects and Eating Habits during COVID-19 Home Confinement: Results of Ehlc-COVID-19 Italian Online Survey. Nutrients 2020, 12, 2152. [Google Scholar] [CrossRef]
- Roy, D.; Tripathy, S.; Kumar, S.; Sharma, N. Study of Knowledge, Attitude, Anxiety & Perceived Mental Healthcare Need in Indian Population during COVID-19 Pandemic. Asian J. Psychiatr. 2020, 51, 102083. [Google Scholar] [CrossRef]
- Scarmozzino, F.; Visioli, F. COVID-19 and the Subsequent Lockdown Modified Dietary Habits of Almost Half the Population in an Italian Sample. Foods 2020, 9, 675. [Google Scholar] [CrossRef] [PubMed]
- Lamarche, B.; Brassard, D.; Lapointe, A.; Laramée, C.; Kearney, M.; Côté, M.; Bélanger-Gravel, A.; Desroches, S.; Lemieux, S.; Plante, C. Changes in Diet Quality and Food Security among Adults during the COVID-19-Related Early Lockdown: Results from NutriQuébec. Am. J. Clin. Nutr. 2021, 113, 984–992. [Google Scholar] [CrossRef] [PubMed]
- Tyrväinen, O.; Karjaluoto, H. Online Grocery Shopping before and during the COVID-19 Pandemic: A Meta-Analytical Review. Telemat. Inform. 2022, 71, 101839. [Google Scholar] [CrossRef] [PubMed]
- Bhattacharjee, B.; Acharya, T. The COVID-19 Pandemic and Its Effect on Mental Health in USA—A Review with Some Coping Strategies. Psychiatr. Q. 2020, 91, 1135–1145. [Google Scholar] [CrossRef]
- Nielsen, M.; Levkovich, N. COVID-19 and Mental Health in America: Crisis and Opportunity? Fam. Syst. Health 2020, 38, 482–485. [Google Scholar] [CrossRef]
- Jahrami, H.; BaHammam, A.S.; Bragazzi, N.L.; Saif, Z.; Faris, M.; Vitiello, M.V. Sleep Problems during the COVID-19 Pandemic by Population: A Systematic Review and Meta-Analysis. J. Clin. Sleep Med. 2021, 17, 299–313. [Google Scholar] [CrossRef]
- Marchesi, K.; Mclaughlin, P.W. COVID-19 Working Paper: The Impact of COVID-19 Pandemic on Food-Away-From-Home Spending; Economic Research Service, Report; USDA: Washington, DC, USA, 2011. [Google Scholar]
- Jensen, K.L.; Yenerall, J.; Chen, X.; Yu, T.E. US Consumers’ Online Shopping Behaviors and Intentions during and after the COVID-19 Pandemic. J. Agric. Appl. Econ. 2021, 53, 416–434. [Google Scholar] [CrossRef]
- Yang, Y.; Liu, H.; Chen, X. COVID-19 and Restaurant Demand: Early Effects of the Pandemic and Stay-at-Home Orders. Int. J. Contemp. Hosp. Manag. 2020, 13, 3809–3834. [Google Scholar] [CrossRef]
- Chenarides, L.; Grebitus, C.; Lusk, J.L.; Printezis, I. Food Consumption Behavior during the COVID-19 Pandemic. Agribusiness 2021, 37, 44–81. [Google Scholar] [CrossRef]
- Researchmatch.org. 2020 ReseachMatch and Vanderbilt University Medical Center. Available online: https://www.researchmatch.org/ (accessed on 9 September 2020).
- Dana-Farber Cancer Institute Eating Habits Questionnaire. Available online: http://rtips.cancer.gov/rtips/viewProduct.do?viewMode=product&productId=173387 (accessed on 26 September 2020).
- Gearhardt, A.N.; Corbin, W.R.; Brownell, K.D. Preliminary Validation of the Yale Food Addiction Scale. Appetite 2009, 52, 430–436. [Google Scholar] [CrossRef]
- Bickel, G.; Nord, M.; Price, C.; Hamilton, W.; Cook, J. Guide to Measuring Household Food Security. Available online: https://alliancetoendhunger.org/wp-content/uploads/2018/03/USDA-guide-to-measuring-food-security.pdf (accessed on 23 June 2020).
- Centers for Disease Control. Defining Overweight and Obesity. Available online: https://www.cdc.gov/obesity/adult/defining.html (accessed on 21 October 2020).
- Nunnally, J.; Bernstein, I. Psychometric Theory, 3rd ed.; McGraw-Hill: New York, NY, USA, 1994. [Google Scholar]
- Alomari, M.A.; Khabour, O.F.; Alzoubi, K.H. Changes in Physical Activity and Sedentary Behavior amid Confinement: The Bksq-COVID-19 Project. Risk Manag. Healthc. Policy 2020, 13, 1757–1764. [Google Scholar] [CrossRef] [PubMed]
- Lavrakas, P.J. Encyclopedia of Survey Research Methods; Sage Publications Ltd.: Thousand Oaks, CA, USA, 2008. [Google Scholar]
- O’Reilly-Shah, V.N. Factors Influencing Healthcare Provider Respondent Fatigue Answering a Globally Administered In-App Survey. PeerJ 2017, 2017, e3785. [Google Scholar] [CrossRef] [PubMed]
- Hingle, M.D.; Kandiah, J.; Maggi, A. Practice Paper of the Academy of Nutrition and Dietetics: Selecting Nutrient-Dense Foods for Good Health. J. Acad. Nutr. Diet. 2016, 116, 1473–1479. [Google Scholar] [CrossRef] [PubMed]
- United States Department of Agriculture Health and Human Services. Dietary Guidelines for Americans 2020–2025, 9th ed.; United States Department of Agriculture Health and Human Services: Washington, DC, USA, 2020.
- Smith, S.; Malinak, D.; Chang, J.; Perez, M.; Perez, S.; Settlecowski, E.; Rodriggs, T.; Hsu, M.; Abrew, A.; Aedo, S. Implementation of a Food Insecurity Screening and Referral Program in Student-Run Free Clinics in San Diego, California. Prev. Med. Rep. 2017, 5, 134–139. [Google Scholar] [CrossRef]
- JMP®, Version 16; SAS Institute Inc.: Cary, NC, USA, 2021.
- Cavazza, N.; Guidetti, M.; Butera, F. Ingredients of Gender-Based Stereotypes about Food. Indirect Influence of Food Type, Portion Size and Presentation on Gendered Intentions to Eat. Appetite 2015, 91, 266–272. [Google Scholar] [CrossRef]
- Cavazza, N.; Guidetti, M.; Butera, F. Portion Size Tells Who I Am, Food Type Tells Who You Are: Specific Functions of Amount and Type of Food in Same- and Opposite-Sex Dyadic Eating Contexts. Appetite 2017, 112, 96–101. [Google Scholar] [CrossRef]
- Li, K.K.; Concepcion, R.Y.; Lee, H.; Cardinal, B.J.; Ebbeck, V.; Woekel, E.; Readdy, R.T. An Examination of Sex Differences in Relation to the Eating Habits and Nutrient Intakes of University Students. J. Nutr. Educ. Behav. 2012, 44, 246–250. [Google Scholar] [CrossRef]
- Ben Hassen, T.; El Bilali, H.; Allahyari, M.S.; Kamel, I.M.; Ben Ismail, H.; Debbabi, H.; Sassi, K. Gendered Impacts of the COVID-19 Pandemic on Food Behaviors in North Africa: Cases of Egypt, Morocco, and Tunisia. Int. J. Environ. Res. Public Health 2022, 19, 2192. [Google Scholar] [CrossRef]
- Janssen, M.; Chang, B.P.I.; Hristov, H.; Pravst, I.; Profeta, A.; Millard, J. Changes in Food Consumption During the COVID-19 Pandemic: Analysis of Consumer Survey Data From the First Lockdown Period in Denmark, Germany, and Slovenia. Front. Nutr. 2021, 8, 635859. [Google Scholar] [CrossRef]
- Callinan, S.; Mojica-Perez, Y.; Wright, C.J.C.; Livingston, M.; Kuntsche, S.; Laslett, A.M.; Room, R.; Kuntsche, E. Purchasing, Consumption, Demographic and Socioeconomic Variables Associated with Shifts in Alcohol Consumption during the COVID-19 Pandemic. Drug Alcohol Rev. 2021, 40, 183–191. [Google Scholar] [CrossRef]
- Szajnoga, D.; Klimek-Tulwin, M.; Piekut, A. COVID-19 Lockdown Leads to Changes in Alcohol Consumption Patterns. Results from the Polish National Survey. J. Addict. Disord. 2021, 39, 215–225. [Google Scholar] [CrossRef] [PubMed]
- Kyprianidou, M.; Chrysostomou, S.; Christophi, C.A.; Giannakou, K. Change of Dietary and Lifestyle Habits during and after the COVID-19 Lockdown in Cyprus: An Analysis of Two Observational Studies. Foods 2022, 11, 1994. [Google Scholar] [CrossRef] [PubMed]
- Caso, D.; Guidetti, M.; Capasso, M.; Cavazza, N. Finally, the Chance to Eat Healthily: Longitudinal Study about Food Consumption during and after the First COVID-19 Lockdown in Italy. Food Qual. Prefer. 2022, 95, 104275. [Google Scholar] [CrossRef]
- Álvarez-Gómez, C.; De La Higuera, M.; Rivas-García, L.; Diaz-Castro, J.; Moreno-Fernandez, J.; Lopez-Frias, M. Has COVID-19 Changed the Lifestyle and Dietary Habits in the Spanish Population after Confinement? Foods 2021, 10, 2443. [Google Scholar] [CrossRef] [PubMed]
- Murphy, B.; Benson, T.; McCloat, A.; Mooney, E.; Elliott, C.; Dean, M.; Lavelle, F. Changes in Consumers’ Food Practices during the COVID-19 Lockdown, Implications for Diet Quality and the Food System: A Cross-Continental Comparison. Nutrients 2021, 13, 20. [Google Scholar] [CrossRef]
- Pfeifer, D.; Rešetar, J.; Gajdoš Kljusurić, J.; Panjkota Krbavčić, I.; Vranešić Bender, D.; Rodríguez-Pérez, C.; Ruíz-López, M.D.; Šatalić, Z. Cooking at Home and Adherence to the Mediterranean Diet During the COVID-19 Confinement: The Experience From the Croatian COVIDiet Study. Front. Nutr. 2021, 8, 617721. [Google Scholar] [CrossRef] [PubMed]
- Gibson, A.A.; Partridge, S.R. Nutritional Qualities of Commercial Meal Kit Subscription Services in Australia. Nutrients 2019, 11, 2679. [Google Scholar] [CrossRef]
- Filimonau, V.; Vi, L.H.; Beer, S.; Ermolaev, V.A. The COVID-19 Pandemic and Food Consumption at Home and Away: An Exploratory Study of English Households. Socioecon. Plann. Sci. 2022, 82, 101125. [Google Scholar] [CrossRef]
- Martin, A. Food Prices and Spending. Available online: https://www.ers.usda.gov/data-products/ag-and-food-statistics-charting-the-essentials/food-prices-and-spending/ (accessed on 9 January 2022).
- Vindegaard, N.; Benros, M.E. COVID-19 Pandemic and Mental Health Consequences: Systematic Review of the Current Evidence. Brain. Behav. Immun. 2020, 89, 531–542. [Google Scholar] [CrossRef]
- Poelman, M.P.; Gillebaart, M.; Schlinkert, C.; Dijkstra, S.C.; Derksen, E.; Mensink, F.; Hermans, R.C.J.; Aardening, P.; de Ridder, D.; de Vet, E. Eating Behavior and Food Purchases during the COVID-19 Lockdown: A Cross-Sectional Study among Adults in the Netherlands. Appetite 2021, 157, 105002. [Google Scholar] [CrossRef]
- Bender, K.E.; Badiger, A.; Roe, B.E.; Shu, Y.; Qi, D. Consumer Behavior during the COVID-19 Pandemic: An Analysis of Food Purchasing and Management Behaviors in U.S. Households through the Lens of Food System Resilience. Socioecon. Plann. Sci. 2022, 82, 101107. [Google Scholar] [CrossRef] [PubMed]
- Li, Z.; Zhao, A.; Li, J.; Ke, Y.; Huo, S.; Ma, Y. Food and Nutrition Related Concerns Post Lockdown during COVID-19 Pandemic and Their Association with Dietary Behaviors. Foods 2021, 10, 2858. [Google Scholar] [CrossRef] [PubMed]
- Althubaiti, A. Information Bias in Health Research: Definition, Pitfalls, and Adjustment Methods. J. Multidiscip. Health 2016, 9, 211–217. [Google Scholar] [CrossRef] [PubMed]

Publisher’s Note: MDPI stays neutral with regard to jurisdictional claims in published maps and institutional affiliations. |
© 2022 by the authors. Licensee MDPI, Basel, Switzerland. This article is an open access article distributed under the terms and conditions of the Creative Commons Attribution (CC BY) license (https://creativecommons.org/licenses/by/4.0/).