Abstract
Poor birth outcomes such as low birth weight, low birth length and short gestational age, are public health concern issues in South Africa (SA). This study utilized structural equation modeling (SEM) to explore how nutritional and social factors contribute to favorable fetal growth conditions (FFGC) in pregnant women living with and without human immunodeficiency virus (HIV), in the Free State Province of SA. Sociodemographic characteristics, stress, health and nutrition-related information, and birth outcomes data were collected and analyzed from a subsample of 305 women enrolled in a cohort study from 2018–2020. Descriptive statistics were analyzed in R version 4.1.2 and SEM was conducted in Lavaan version 0.6–5. Higher gestational body mass index (GBMI) and income levels were associated with higher FFGC (p < 0.05). Household incomes were positively associated with dietary micronutrient quality (p = 0.002), GBMI (p = 0.012) and food security (p = 0.001). Low incomes (p = 0.004) and food insecurity (p < 0.001) were associated with higher stress, while social support was positively associated with food security status (p = 0.008). These findings highlight the complex interconnections between the social and nutritional factors that are associated with fetal growth conditions. Multisectoral community-based programs may be a useful strategy to address these challenges.
1. Introduction
Annually, about 15 million infants are born preterm (<37 weeks of gestation), mostly in Sub-Saharan Africa and South Asia [1]. Preterm births contribute to over one third of neonatal deaths and are associated with 16% of the deaths occurring in children under five [2]. Additionally, over 20.5 million infants globally have a low birth weight (below or equal to 2500 g) [3]. Low birth weight is a sign of fetal growth restriction and is associated with 80% of neonatal deaths [4]. Apart from the increased risk of mortality, poor birth outcomes have also been associated with increased risk for non-communicable diseases in later life as supported by The Developmental Origins of Health and Disease (DOHaD) hypothesis. The DOHaD was developed by David Barker, based on the results of observational studies that suggested that adverse nutritional and environmental exposures in the womb can have a negative impact on the adult life of the exposed fetus [5,6,7]. Examples include an increased risk of metabolic syndrome, diabetes, hypertension, and cardiovascular disease prevalence in adulthood [8,9,10,11,12,13].
The World Health Organization (WHO) has identified poor birth outcomes as a key indicator of a “multifaceted public-health problem” [14]. One of the key global strategies to address this is the 1000 Days Approach [15]. According to the 1000 Days Approach, the time from conception to when a child is two years of age, the first 1000 days of life, is considered “a critical window of opportunity for laying down the foundations for optimum health and development” [15]. During pregnancy, various challenges affecting the pregnant woman can directly or indirectly affect fetal growth conditions. These include micronutrient deficiencies, inadequate dietary intake, alcohol and drug abuse, poverty, underweight or obesity during pregnancy, trauma, and high stress levels [16,17]. Measuring fetal growth conditions is challenging since this is a relatively latent construct that cannot be measured directly. Past studies have largely relied on low birth weight as a proxy indicator for the fetal environment [18]. However, Bollen, and colleagues, developed a latent variable called Favorable Fetal Growth Conditions (FFGC), based on the manifest variables of birth length, birth weight and gestational age. This FFGC latent variable provides a more comprehensive estimate of the fetal environment, compared to relying on only birth weight [19].
In South Africa (SA), as many as 14.2% infants had a low birth weight in 2016 [20], and relatively high prevalence of preterm births at 15–17% in 2019 [21]. This is despite a comprehensive health care sector, offering a wide range of preventive and curative services to the population [22,23,24,25]. There has been relatively little progress made in reducing the prevalence of low birth weight and preterm births [26] and this may be due to the multifactorial contributors to FFGC. There is a need to design evidence-based solutions and strategies that address the relatively high prevalence of poor birth outcomes in SA, but currently the social and nutritional factors potentially contributing to FFCG through complex interconnected pathways are poorly understood [27]. There are currently no known studies that have used a holistic approach to explore these within the SA context. Thus, the present study utilized structural equation modeling to address this gap by investigating the social and nutritional determinants of FFGC in pregnant women living in the Free State Province, SA.
2. Materials and Methods
This research was conducted in the Free State province of SA, through a collaboration between researchers in the United States of America (USA) and SA. Due to the relatively high prevalence of human immunodeficiency virus (HIV) in SA (19%) [28], a multigroup analysis was conducted to assess model fit in women living with and without HIV.
2.1. Study Design and Participants
A cohort study design was utilized, and women were recruited from a regional public hospital in Bloemfontein. All pregnant women (approximately 700 per month) attending the antenatal clinic at this hospital from May 2018–April 2019 were eligible to participate in the study if they met the inclusion criteria that included 18 years or older, at 12 weeks gestation or more, able to speak English, Afrikaans, or Sesotho and had provided written informed consent to participate in the study after receiving an explanation and documentation related to the study and its procedures. A total of 682 women enrolled in the study. We confined our analysis to information to a subsample of 305 women who completed the study and provided full information related to birth outcomes and HIV status. Figure 1 summarizes the participants and attrition throughout the study.
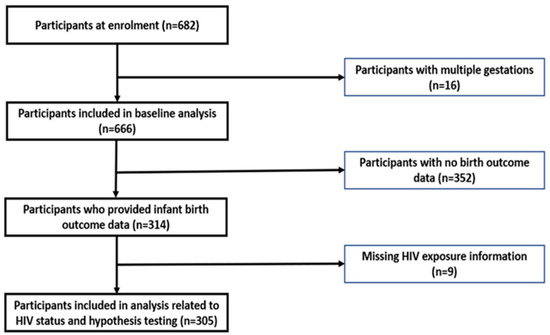
Figure 1.
Flowchart of participants throughout the study.
2.2. Data Collection
Data were collected from May 2018 to April 2019 at a regional hospital’s antenatal clinic using structured interviews administered by trained fieldworkers in the participant’s language of choice (English, Sesotho, or Afrikaans).
Sociodemographic data was obtained using the Socio-demographic and Household Questionnaire that collected information related to age, marital status, education, employment, and income status, household size, facilities, and assets. Information related to stress and social support was determined from the Health, Lifestyle and Pregnancy History questionnaire [29] that collected information related to exposure to crime, violence, debt, breakups, grief, caring for someone seriously ill, alcohol use and social support.
Anthropometric measurements (heights and weights) were collected using the standardized techniques specified by the International Society for the Advancement of Kinanthropometry (ISAK) [30]. Additional information related to pregnancy stage (weeks), and pre-pregnancy weight was also collected to allow for the computation of gestational body mass index (GBMI) [31]. The GBMI was then classified as underweight (≥10 to <19.8 kg/m²), normal weight (≥19.8 to <26.1 kg/m²), overweight (≥26.1 to <29 kg/m²), or obese (≥29 kg/m²) [32].
A quantified food frequency questionnaire [33] was used to estimate dietary intake. Food models, household measures and photographs were used to aid in the estimation of portion sizes. Foods were converted to total grams consumed in the past 28 days using the South African Medical Research Council (SAMRC) Food Quantities Manual [34] and the Condensed Food Composition Tables for South Africa [35], and daily nutrient intakes were determined. The daily nutrient intake data was used to calculate nutrient adequacy ratio (NAR) and mean adequacy ratio (MAR) for each participant [36,37].
Household food security was assessed through the Household Food Insecurity Access Scale (HFIAS) [38] that measured food security based on a recall period of 28 days. Households were categorized as food secure, mildly food insecure, moderately food insecure, and severely food insecure based on the scoring of certain questions [39]. HFIAS responses were also converted into a continuous indicator that ranged from 0 to 27, indicating the degree of insecure food access. The higher the score, the more food insecure the participant [38].
Women were contacted via text message after their expected delivery date to remind them to provide follow-up information related to their birth outcome. Neonate information relating to gestational age at delivery, anthropometric measurements, congenital disabilities, and HIV exposure was obtained from the Road to Health Booklet. The Road to Health book is provided for all new births by health facilities [39] and is completed by trained healthcare staff at each hospital or clinic visit.
2.3. Development of Latent Variables
There were three latent variables included in the model, namely two independent variables, stress, and dietary micronutrient quality (DMQ) and the outcome variable, FFGC. Stress was determined from the Health, Lifestyle and Pregnancy History questionnaire that collected information regarding exposure to crime and violence, debt, divorce and breakups, grief or caring with a seriously ill loved one [29]. DMQ was based on nine nutrients Vitamin A, B6, B12, C and D, folate, iodine, iron, and zinc. The importance of these nutrients during pregnancy has been described by the WHO and recent studies [40,41,42]. To create the indicators for stress and DMQ, a technique called parceling was used (where two or more indicators are averaged to create a new variable which is then used as the manifest indicator of the latent construct under study) [43]. At times a manifest variable may only tell a part of the story, thus combining several variables into a parcel creates a more reliable indicator. Parceling is a technique that improves the quality of the indicator, and averaging, as opposed to summing the items allows the parcels to have similar metrics [43]. Based on the balancing approach, items with the strongest item–scale correlations were paired with those with the weakest, and this process was repeated until all items were parceled. Favorable Fetal Growth Conditions is an abstract variable developed by a group of statisticians [19], which seeks to explain the combined effects of environmental, genetic and health related factors on the development of the fetus in-utero. It is these in-utero exposures that are said to influence the future adult health outcomes of the fetus, according to Barker’s DOHaD hypothesis [44].
2.4. Data Analysis
Descriptive statistics were calculated in R statistical package version 3.6.1, while Lavaan version 0.6–5 in R version 3.6.1 was used to create a structural equation model (SEM). Structural equation modeling was used to model the relationships between stress, social support, food security status, household income, GBMI, dietary micronutrient quality, and FFGC in pregnant women living with (n = 104) and without (n = 201) HIV in the sample. Due to the relatively high prevalence of HIV in SA (19%) [28], a multigroup analysis was conducted to compare outcomes in women living with and without HIV. In terms of adequacy of the sample size, based on a series of Monte Carlo simulations, a sample size of 100 participants for single group models and 75 per group for multigroup models has been estimated as large enough to be adequately powered for SEM [43]. Based on this assertion, it was adequately powered for the multigroup model analysis conducted. The data from women who provided HIV-related information (n = 305) was utilized to estimate the model using the full information maximum likelihood (FIML), to estimate missing data. A p-value less than 0.05 (p < 0.05) was considered statistically significant.
2.5. Hypothesized Diagram
The path diagram (Figure 2) summarizes the hypotheses. The single headed arrows pointing towards the FFGC represent the regression associations being hypothesized, while the double headed arrows connecting stress, social support, household income, GBMI, household food security and DMQ, represent the covariance associations that were hypothesized. The measurement models for the latent constructs are reflective (with arrows pointing away from circles which represent the latent construct).
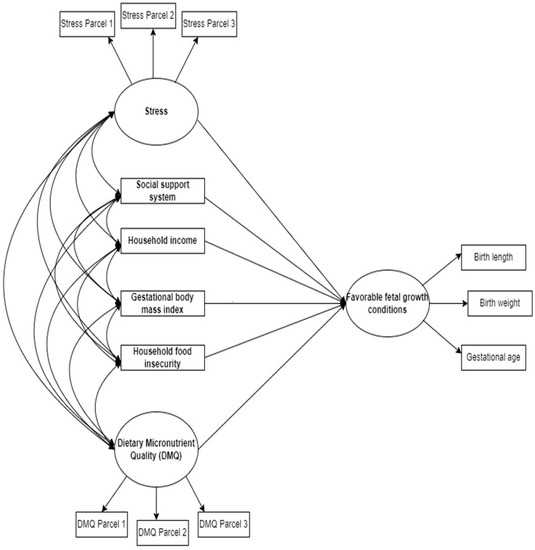
Figure 2.
Hypothesized SEM of the social and nutritional factors associated with favorable fetal growth conditions in South African women.
3. Results
3.1. Sociodemographic Characteristics
Women living with HIV were slightly older at enrollment than those without HIV (p = 0.014), but there was no significant difference in gestational age at enrollment, as summarized in Table 1.

Table 1.
Comparison of age and pregnancy stage at enrollment based on HIV status.
The majority of women were married or in a relationship, but significantly more women without HIV were married (p = 0.0094) or in a relationship (p = 0.021), when compared to women living with HIV. The majority of women in both groups completed secondary level education, however, a significantly higher proportion of women without HIV had completed tertiary level education (p = 0.024) compared to women living with HIV, and a similar trend was observed for their partners’ education. Both groups had high levels of social support, with over 80% of all participants reporting that they had several people to turn to for social support. There were no differences between the stressors experienced by the two groups, except significantly more women with HIV had a close family member who was seriously ill (p = 0.014), compared to women without HIV.
3.2. Confirmatory Factor Analysis
In this stage the relationship between the latent variable and its indicators was assessed. Parceled indicators were used for stress and DMQ. The factor loadings, standard errors and statistical significance of each factor loading are summarized in Table 2. Based on these results, the indicators were deemed appropriate, and the analysis process proceeded to the next stage.
Table 2.
Relationships between the latent variables and their indicators.
3.3. Measurement Invariance
Invariance testing was conducted to assess whether the same latent construct (stress, DMQ, and FFGC) was being measured across specified groups, in this case, women with HIV and those without HIV. A comparative fit index (CFI) of less than 0.01 indicated that a model had passed the respective test for invariance. Table 3 summarizes the findings from the invariance testing. This model passed all the tests for invariance, with both weak and strong invariance achieving a change in CFI of less than 0.01.
Table 3.
Invariance Testing.
3.4. Multigroup Analysis
Phantom variables were added to the model, and constraints added to test if there were any differences based on HIV status. There was no statistically significant difference between the latent regression model, where the independent variables were allowed to freely estimate between groups, and the regression constrained model (Table 4). This suggests that the ability of the independent variables to predict FFGC was not moderated by HIV status. As such, the strength of correlations among the variables, and their predictive capabilities was the same in both groups, women with and without HIV.
Table 4.
Multigroup analysis.
3.5. Structural Equation Model Findings
In Table 5, a 1 kg/m² increase in GBMI was associated with a 0.223 unit increase in FFGC (p < 0.001) and a 1 unit increase in income level was associated with a 0.141 unit increase in FFGC in women without HIV (p = 0.041). Higher household incomes were associated with higher dietary micronutrient quality (p = 0.002), GBMIs (p = 0.012) and food security (p = 0.001). Higher levels of stress were associated with lower household incomes (p = 0.004) and higher levels food insecurity (p < 0.001). Social support was also associated with better household food security (p = 0.008). There was a marginally significant inverse association between DMQ and food insecurity, with higher DMQ associated with better food security status. The findings of SEM are summarized in Table 5.
Table 5.
Associations within the structural equation model/Hypothesis Tests.
3.6. Final SEM Diagram
In the final SEM, Figure 3, the non-significant pathways have been represented by a dotted line. This diagram summarizes the information contained in Table 5.
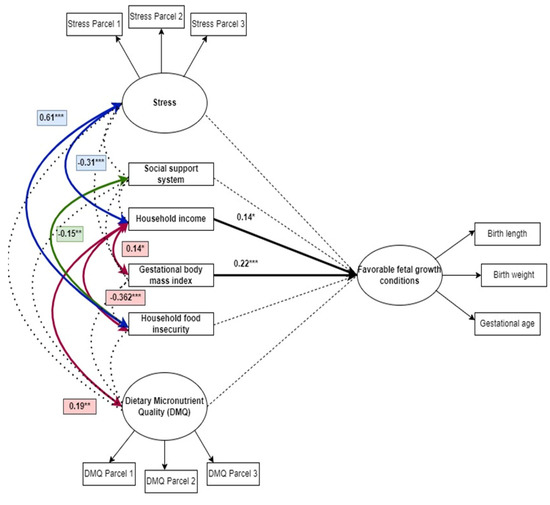
Figure 3.
Final model of the nutritional and social determinants of favorable fetal growth conditions. * p < 0.05, ** p < 0.01, *** p < 0.001.
3.7. Modification Indices and Goodness-of-Fit Summary
Table 6 summarizes the model’s goodness of fit indices. The chi-square statistic for the model was 171.14 with 145 degrees of freedom. In terms of goodness of fit indices, root mean square error of approximation (RMSEA) was 0.034 (90% CI: 0.000–0.052) which suggested a good model fit and standardized root mean square residual (SRMR) was 0.060, suggesting an acceptable fit. Comparative fit index (CFI) was 0.968 and Tucker-Lewis index (TLI) was 0.959. Since both were above 0.9, this suggests a good model fit. Overall, when considering all modification indices, the model performed well.
Table 6.
Goodness of fit summary and interpretation.
4. Discussion
This study used a more holistic approach to understand the complex interrelationships between social and nutritional prenatal exposures such as income, food security, stress, micronutrient quality and weight status in this cohort of women. Based on previous work, when looked at separately, all these factors have been associated with reduced length, age, or weight at birth [8,9,10,11,12,13] and using this latent variable, FFGC allowed for a more comprehensive estimation of fetal growth conditions. A 1 unit increase in GBMI was associated with a 0.223 unit increase in FFGC (p < 0.001). These findings are in line with several other studies that have shown an association between higher GBMI and birth weights, such as in a relatively recent study in Vietnam [45], in Nepal [46], and in China [47]. The positive associations between GBMI, gestational age at birth and birth weight have also been documented in systematic reviews [48,49]. However, high GBMIs, while protective against low birth weight, do pose other risks such as increased blood pressure and gestational diabetes in the mother, and fetal hypoglycemia (low blood glucose), poor birth outcomes and spontaneous abortion of the fetus [49,50,51] and increased risk of a large for gestational age infant [31,52,53,54,55].
In SA, inequality is still a challenge that exposes certain population groups to several factors that can hinder the achievement of FFGC, such as the higher rates of poverty and unemployment [56]. Income levels influence everything from health seeking behaviors to dietary practices [57], therefore it was not surprising that a 1 unit increase in income level was associated with a 0.141 unit increase in FFGC in pregnant women (p = 0.041). This is in line with a recent USA study that found an association between income and birth outcomes, where a $10,000 increase in a county’s median income was associated with 0.34 fewer low birth weight cases per 100 live births [58]. Similar positive associations have been observed between income and birth outcomes in Ethiopia, Angola, and China [59,60,61].
We examined the associations between dietary micronutrient quality on FFCG and did not find any associations. This was contrary to studies that have found associations between diet quality and FFCG. Analysis of data from over 170,000 women sampled in India’s National Family Health Survey observed that low birth weight was associated with diet quality and iron intake [62]. A possible reason for this is the fact that very few of the women in the current study met the requirements for good diet quality.
Higher household incomes were associated with higher food security (p = 0.001) and higher dietary micronutrient quality (p = 0.002). This is to be expected since higher incomes are often associated with food security and better diet quality [63,64]. While we did not see an association between stress and FFCG, higher stress was associated with lower household incomes (p = 0.004) and higher levels of food insecurity (p < 0.001). This supports the findings from other studies that have observed higher levels of stress and even depression in households with lower food security, which also happened to have lower incomes [65,66,67]. There was also a marginally significant inverse association between DMQ and food insecurity (p = 0.06), with higher DMQ associated with better food security status, which is in line with the existing literature that shows associations between food security and diet quality [68,69,70].
4.1. Strengths of the Study
One of the major strengths of this study is that it used a latent variable approach to measure FFGC, distinguishing it from most studies that rely on birthweight as the only proxy indicator of the fetal environment. Another strength of the study is that it is the first study that we are aware of, that explores both nutritional and social factors, and considers not only how these affect FFGC, but also how social and nutritional factors are associated with each other. By doing this, we were able to not only acknowledge, but also model, some of the complexity of real-life settings. Our results therefore provide a useful perspective that can add value to the work of practitioners and policymakers alike, by highlighting key issues to prioritize and allowing them to focus resources and effort on the issues most likely to result in the most significant improvements in FFGC. The study included a multigroup analysis, requiring formal tests to determine if the model was valid regardless of HIV status. This is an important perspective, due to the relatively high HIV prevalence in the country. Several measures were put in place to ensure the accuracy and reliability of measurements in the study, such as recruiting skilled fieldworkers and training them to standardize data collection methods.
4.2. Limitations of the Study
The major limitation of this study was the poor completion rate (incomplete birth outcome data) in this study, partly to be expected due to the longitudinal nature of the study, but further exacerbated by the COVID-19 pandemic. Women lost to follow-up did not provide the birth outcome information and HIV status-related information and were therefore excluded from the SEM analysis, which may have impacted the power necessary to detect associations between stress and FFGC, as well as DMQ and FFGC in our sample. Another limitation of this study was the use of self-reported data for the collection of dietary intake information due to recall bias. Since this was a cohort study, purposive sampling was used, which might not provide results that are generalizable to the whole population. Another issue was the fact that the recruitment site was a referral hospital where high risk pregnancies were referred which increases the chances of identifying poor birth outcomes. Lastly, women were recruited at various stages of gestation with no subsequent follow-up until the infant was born.
5. Conclusions
Contrary to expectations, DMQ was not associated with FFGC, but GBMI and household income were the only two factors directly related to FFGC. This study provides a more comprehensive estimation of the fetal environment using the latent variable, FFGC. The use of structural equation modeling allows for a more holistic investigation of components that are otherwise difficult to measure or quantify due to their latent nature. The results of this study show that attention must be given to addressing poverty and maternal GBMIs, to optimize the in-utero environment. If time and effort is invested into improving income levels and GBMI of pregnant women, the prevalence of poor birth outcomes in SA might start to decrease. We were able to identify two key issues, and our results may guide not only future research, but also, decision making regarding programs and policies in SA. Prenatal programs that optimize BMI before pregnancy may also be beneficial to the community. We also gained insight into the potential role of social support in buffering against food insecurity, as well as the positive association between income and both food security and dietary quality. Stress was associated with low income and food insecurity, and to reduce the amount of stress experienced during pregnancy, strategies to improve incomes and food security, must be implemented. Overall, a multisectoral approach may be useful in targeting the different nutritional and social issues that contribute to fetal growth conditions.
Author Contributions
Conceptualization, G.M., C.W. and W.O.-T.; methodology, G.M., W.O.-T. and C.W.; software, G.M. and Z.S.; validation, G.M., Z.S., W.O.-T., J.N., M.J., L.R. and C.W.; formal analysis, G.M., Z.S., T.L. and J.D.; investigation, G.M., S.T.-J., W.O.-T., J.N., M.J., L.R. and C.W.; resources, W.O.-T. and C.W.; data curation, G.M., W.O.-T., J.N., M.J., L.R. and C.W.; writing—original draft preparation, G.M.; writing—review and editing, G.M., S.T.-J. and W.O.-T.; visualization, G.M.; supervision, W.O.-T.; project administration, J.N., L.R., M.J. and C.W.; funding C.W. All authors have read and agreed to the published version of the manuscript.
Funding
This research received no external funding.
Institutional Review Board Statement
The study was conducted in accordance with the Declaration of Helsinki, and approved by the Institutional Review Board (or Ethics Committee) of the University of the Free State (UFS-HSD2017/0969) and Texas Tech University (IRB2020-143, 21 May 2021).
Informed Consent Statement
Written informed consent was obtained from all subjects involved in the study.
Data Availability Statement
The datasets used and/or analyzed during the current study are available from the corresponding authors on reasonable request.
Acknowledgments
The authors thank the participants for taking part in this study and the fieldworkers for data collection.
Conflicts of Interest
The authors declare no conflict of interest.
References
- Chawanpaiboon, S.; Vogel, J.P.; Moller, A.-B.; Lumbiganon, P.; Petzold, M.; Hogan, D.; Landoulsi, S.; Jampathong, N.; Kongwattanakul, K.; Laopaiboon, P.M.; et al. Global, regional, and national estimates of levels of preterm birth in 2014: A systematic review and modelling analysis. Lancet Glob. Health 2019, 7, e37–e46. [Google Scholar] [CrossRef]
- UN IGME. Levels and Trends in Child Mortality Report 2018. 2018. Available online: https://www.unicef.org/media/47626/file/UN-IGME-Child-Mortality-Report-2018.pdf (accessed on 27 April 2022).
- UNICEF. Low Birthweight. UNICEF Data: Monitoring the Situation of Children and Women. 2019, pp. 1–4. Available online: https://data.unicef.org/topic/nutrition/low-birthweight/ (accessed on 4 January 2022).
- Blencowe, H.; Krasevec, J.; de Onis, M.; E Black, R.; An, X.; A Stevens, G.; Borghi, E.; Hayashi, C.; Estevez, D.; Cegolon, L.; et al. National, regional, and worldwide estimates of low birthweight in 2015, with trends from 2000: A systematic analysis. Lancet Glob. Health 2019, 7, e849–e860. Available online: https://pubmed.ncbi.nlm.nih.gov/31103470 (accessed on 7 July 2021). [CrossRef]
- Barker, D.J. Fetal origins of coronary heart disease. BMJ 1995, 311, 171–174. Available online: https://pubmed.ncbi.nlm.nih.gov/7613432 (accessed on 7 July 2021). [CrossRef] [PubMed]
- Barker, D.J.P.; Osmond, C. Infant mortality, childhood nutrition and ischemic heart disease in England and Wales. Lancet 1986, 327, 1077–1108. [Google Scholar] [CrossRef]
- Barker, D.J.P.; Osmond, C.; Winter, P.D.; Margetts, B.; Simmonds, S.J. Weight in infancy and death from ischemic heart diseases. Lancet 1989, 334, 577–580. [Google Scholar] [CrossRef]
- Li, Y.; Jaddoe, V.W.; Qi, L.; He, Y.; Wang, D.; Lai, J.; Zhang, J.; Fu, P.; Yang, X.; Hu, F.B. Exposure to the chinese famine in early life and the risk of metabolic syndrome in adulthood. Diabetes Care 2011, 34, 1014–1018. Available online: https://pubmed.ncbi.nlm.nih.gov/21310886 (accessed on 7 July 2021). [CrossRef]
- Wang, N.; Cheng, J.; Han, B.; Li, Q.; Chen, Y.; Xia, F.; Jiang, B.; Jensen, M.D.; Lu, Y. Exposure to severe famine in the prenatal or postnatal period and the development of diabetes in adulthood: An observational study. Diabetologia 2017, 60, 262–269. [Google Scholar] [CrossRef]
- Lumey, L.H.; Stein, A.D.; Susser, E. Prenatal famine and adult health. Annu. Rev. Public Health 2011, 32, 237–262. Available online: https://pubmed.ncbi.nlm.nih.gov/21219171 (accessed on 27 April 2022). [CrossRef]
- Shi, Z.; Ji, L.; Ma, R.C.W.; Zimmet, P. Early life exposure to 1959–1961 Chinese famine exacerbates association between diabetes and cardiovascular disease. J. Diabetes 2020, 12, 134–141. [Google Scholar] [CrossRef]
- Sun, Y.; Zhang, L.; Duan, W.; Meng, X.; Jia, C. Association between famine exposure in early life and type 2 diabetes mellitus and hyperglycemia in adulthood: Results from the China Health and Retirement Longitudinal Study (CHARLS). J. Diabetes 2018, 10, 724–733. [Google Scholar] [CrossRef]
- Arima, Y.; Fukuoka, H. Developmental origins of health and disease theory in cardiology. J. Cardiol. 2020, 76, 14–17. [Google Scholar] [CrossRef] [PubMed]
- World Health Organization. Low-Birth-Weight Newborns (%). The Global Health Observatory: Indicator Metadata Registry List. 2021. Available online: https://www.who.int/data/gho/indicator-metadata-registry/imr-details/76 (accessed on 7 July 2021).
- INNOCENTI. The First 1000 Days of Life: The Brain’s Window of Opportunity; Unicef-Irc: Florence, Italy, 2018; Available online: https://www.unicef-irc.org/article/958-the-first-1000-days-of-life-the-brains-window-of-opportunity.html (accessed on 9 May 2020).
- Shisana, O.; Labadarios, D.; Rehle, T.; Simbayi, L.; Zuma, K.; Dhansay, A.R.P.; Parker, W.; Hoosain, E.; Naidoo, P.; Hongoro, C.; et al. South African National Health and Nutrition Examination Survey (SANHANES-1); HSRC Press: Cape Town, South Africa, 2013; Available online: http://www.hsrc.ac.za/uploads/pageNews/72/SANHANES-launch-edition-(online-version).pdf (accessed on 7 July 2021).
- Batra, K.; Pharr, J.; Olawepo, J.O.; Cruz, P. Understanding the multidimensional trajectory of psychosocial maternal risk factors causing preterm birth: A systematic review. Asian. J. Psychiatr. 2020, 54, 102436. Available online: https://www.sciencedirect.com/science/article/pii/S1876201820305499 (accessed on 27 April 2022). [CrossRef]
- Hoffman, D.J.; Powell, T.L.; Barrett, E.S.; Hardy, D.B. Developmental origins of metabolic diseases. Physiol. Rev. 2021, 101, 739–795. [Google Scholar] [CrossRef]
- Bollen, K.A.; Noble, M.D.; Adair, L.S. Are gestational age, birth weight, and birth length indicators of favorable fetal growth conditions? A structural equation analysis of Filipino infants. Stat. Med. 2013, 32, 2950–2961. [Google Scholar] [CrossRef] [PubMed]
- Statistics South Africa. South Africa Demographic and Health Survey 2016: Key Indicator Report; Statistics South Africa: Pretoria, South Africa, 2017. Available online: https://www.statssa.gov.za/publications/Report-03-00-09/Report-03-00-092016.pdf (accessed on 13 September 2019).
- Zar, H.J.; Pellowski, J.A.; Cohen, S.; Barnett, W.; Vanker, A.; Koen, N.; Stein, D. Maternal health and birth outcomes in a South African birth cohort study. PLoS ONE 2019, 14, e0222399. Available online: https://pubmed.ncbi.nlm.nih.gov/31751344 (accessed on 13 September 2019). [CrossRef] [PubMed]
- Department of Health (South Africa). Foodstuffs, Cosmetics and Disinfectants Act, 1972 (Act 54 of 1972): Regulations Related to the Labelling and Advertising of Foodstuffs. 2010. Available online: https://www.gov.za/sites/default/files/gcis_document/201409/32975146.pdf (accessed on 1 November 2022).
- National Department of Health. Cervical Cancer Prevention and Control Policy. National Policy Document. 2017. Available online: http://scielo.sld.cu/pdf/ccm/v21n1/ccm15117.pdf (accessed on 27 April 2022).
- Department of Health. South African Infant and Young Child Feeding Policy; Department of Health (DoH): Pretoria, South Africa, 2007. Available online: https://www.gov.za/sites/default/files/gcis_document/201409/infantfeed.pdf (accessed on 1 November 2022).
- Department of Health (DoH). Strategic Plan for the Prevention and Control of Non-Communicable Diseases 2020–2025; Department of Health (DoH): Pretoria, South Africa, 2019. Available online: https://www.samedical.org/file/1202 (accessed on 1 November 2022).
- Symington, E.; Norris, S.; Smuts, M. Food and nutrition security of the unborn child: The role of maternal nutrition. S. Afr. Child Gauge 2020, 72–84. Available online: http://www.ci.uct.ac.za/sites/default/files/image_tool/images/367/Child_Gauge/South_African_Child_Gauge_2020/ChildGauge_2020_screen_final.pdf (accessed on 27 April 2022).
- De Costa, A.; Moller, A.-B.; Blencowe, H.; Johansson, E.W.; Hussain-Alkhateeb, L.; Ohuma, E.O.; Okwaraji, Y.B.; Cresswell, J.; Requejo, J.H.; Bahl, R.; et al. Study protocol for WHO and UNICEF estimates of global, regional, and national preterm birth rates for 2010 to 2019. PLoS ONE 2021, 16, e0258751. [Google Scholar] [CrossRef] [PubMed]
- UNAIDS. South Africa HIV and AIDS Estimates; UNAIDS: Geneva, Switzerland, 2020; p. 1. Available online: https://www.unaids.org/en/regionscountries/countries/southafrica%0Ahttp://www.unaids.org/en/regionscountries/countries/southafrica (accessed on 9 July 2021).
- University of Witwatersrand. Birth to Twenty. 2017. Available online: https://www.wits.ac.za/health/research-entities/birth-to-20/birth-to-twenty/ (accessed on 28 January 2018).
- Stewart, A.; Marfell-Jones, M.; Olds, T.; De Ridder, H. International Standards for Anthropometric Assessment; International Society for the Advancement of Kinanthropmetry: Lower Hutt, New Zealand, 2011. [Google Scholar]
- Davies, H.; Visser, J.; Tomlinson, M.; Rotheram-Borus, M.; Gissane, C.; Harwood, J.; Leroux, I. An investigation into utilising gestational body mass index as a screening tool for adverse birth outcomes and maternal morbidities in a group of pregnant women in Khayelitsha. S. Afr. J. Clin. Nutr. 2013, 26, 116–122. Available online: https://www.ncbi.nlm.nih.gov/pubmed/25324710 (accessed on 7 July 2021). [CrossRef][Green Version]
- Cruz, M.L.S.; Harris, D.R.; Read, J.S.; Mussi-Pinhata, M.M.; Succi, R.C.M.; Group NISDI (NISDI). Association of Body Mass Index of HIV-1-Infected Pregnant Women and Infant Weight, Body Mass Index, Length, and Head Circumference: The NISDI Perinatal Study. Nutr. Res. 2007, 27, 685–691. Available online: https://pubmed.ncbi.nlm.nih.gov/19081829 (accessed on 7 March 2019). [CrossRef][Green Version]
- Symington, E.A.; Baumgartner, J.; Malan, L.; Zandberg, L.; Ricci, C.; Smuts, C.M. Nutrition during pregnancy and early development (NuPED) in urban South Africa: A study protocol for a prospective cohort. BMC Pregnancy Childbirth 2018, 18, 308. Available online: https://www.ncbi.nlm.nih.gov/pubmed/30041623 (accessed on 7 July 2021). [CrossRef]
- South African Food Data System (SAFOODS). SAMRC Food Quantities Manual for South Africa, 3rd ed.; South African Medical Research Council: Tygerberg, South Africa, 2018; Available online: http://safoods.mrc.ac.za/ (accessed on 18 July 2021).
- Wolmarans, P.; Danster, N.; Council SAMR. Condensed Food Composition Tables for South Africa; South African Medical Research Council: Tygerberg, South Africa, 2010. [Google Scholar]
- Hatløy, A.; Torheim, L.E.; Oshaug, A. Food variety—A good indicator of nutritional adequacy of the diet? A case study from an urban area in Mali, West Africa. Eur. J. Clin. Nutr. 1998, 52, 891–898. [Google Scholar] [CrossRef]
- INDDEX Project. Data4Diets: Building Blocks for Diet-Related Food Security Analysis; Tufts University: Boston, MA, USA, 2018; pp. 6–8. Available online: https://inddex.nutrition.tufts.edu/data4diets (accessed on 2 February 2021).
- Coates, J.; Swindale, A.; Bilinsky, P. Householf Food Indicator Access Scale (HFIAS) for Measurement of Food Access Indicator Guide (v. 3). Food and Nutrition Technical Assistance Project, Academy for Educational Development. 2007. Available online: http://www.fao.org/fileadmin/user_upload/eufao-fsi4dm/doc-training/hfias.pdf (accessed on 9 May 2020).
- SADHS. Road To Health Book; South Africa Department of Health: Pretoria, South Africa, 2020. Available online: https://sidebyside.co.za/resources/road-to-health-book/ (accessed on 18 July 2021).
- Institute of Medicine (IoM). Dietary Reference Intakes: A Risk Assessment Model for Establishing Upper Intake Levels for Nutrients. In What are Dietary Reference Intakes? National Academies Press (US): Washington, DC, USA, 1998. Available online: https://www.ncbi.nlm.nih.gov/books/NBK45182/ (accessed on 15 May 2020).
- Jang, W.; Kim, H.; Lee, B.-E.; Chang, N. Maternal fruit and vegetable or vitamin C consumption during pregnancy is associated with fetal growth and infant growth up to 6 months: Results from the Korean Mothers and Children’s Environmental Health (MOCEH) cohort study. Nutr. J. 2018, 17, 105. [Google Scholar] [CrossRef] [PubMed]
- WHO. Serum and Red Blood Cell Folate Concentrations for Assessing Folate Status in Populations. Vitamin and Mineral Nutrition Information System. 2015, pp. 1–7. Available online: http://apps.who.int/iris/handle/10665/162114 (accessed on 21 April 2022).
- Little, T.D. Longitudinal Structural Equation Modeling, 1st ed.; Guilford Press: New York, NY, USA, 2013; pp. 106–118. [Google Scholar]
- Hoffman, D.J.; Reynolds, R.M.; Hardy, D.B. Developmental origins of health and disease: Current knowledge and potential mechanisms. Nutr. Rev. 2017, 75, 951–970. [Google Scholar] [CrossRef] [PubMed]
- Tran, N.T.; Nguyen, L.T.; Berde, Y.; Low, Y.L.; Tey, S.L.; Huynh, D.T.T. Maternal nutritional adequacy and gestational weight gain and their associations with birth outcomes among Vietnamese women. BMC Pregnancy Childbirth 2019, 19, 468. [Google Scholar] [CrossRef] [PubMed]
- Basel, P.L.; Singh, S. Low birth weight and its associated risk factors: Health facility-based case-control study. PLoS ONE 2020, 15, e0234907. Available online: https://pubmed.ncbi.nlm.nih.gov/32569281 (accessed on 27 April 2022).
- Chen, Y.-H.; Fu, L.; Hao, J.-H.; Wang, H.; Zhang, C.; Tao, F.-B.; Xu, D.-X. Influent factors of gestational vitamin D deficiency and its relation to an increased risk of preterm delivery in Chinese population. Sci. Rep. 2018, 8, 3608. [Google Scholar] [CrossRef] [PubMed]
- Stubert, J.; Reister, F.; Hartmann, S.; Janni, W. The Risks Associated with Obesity in Pregnancy. Dtsch. Arztebl. Int. 2018, 115, 276–283. Available online: https://pubmed.ncbi.nlm.nih.gov/29739495 (accessed on 9 December 2020). [CrossRef] [PubMed]
- Catalano, P.M.; Shankar, K. Obesity and pregnancy: Mechanisms of short term and long term adverse consequences for mother and child. BMJ 2017, 356, j1. Available online: https://pubmed.ncbi.nlm.nih.gov/28179267 (accessed on 7 July 2021). [CrossRef]
- Mariona, F.G. Perspectives in obesity and pregnancy. Women’s Health 2016, 12, 523–532. [Google Scholar] [CrossRef]
- Paredes, C.; Hsu, R.C.; Tong, A.; Johnson, J.R. Obesity and Pregnancy. Neoreviews 2021, 22, e78–e87. [Google Scholar] [CrossRef]
- Boudet-Berquier, J.; Salanave, B.; Desenclos, J.-C.; Castetbon, K. Sociodemographic factors and pregnancy outcomes associated with prepregnancy obesity: Effect modification of parity in the nationwide Epifane birth-cohort. BMC Pregnancy Childbirth 2017, 17, 273. Available online: https://pubmed.ncbi.nlm.nih.gov/28841845 (accessed on 9 May 2020). [CrossRef]
- Averett, S.L.; Fletcher, E.K. Prepregnancy Obesity and Birth Outcomes. Matern. Child. Health J. 2016, 20, 655–664. [Google Scholar] [CrossRef]
- Patel, A.; Prakash, A.A.; Das, P.K.; Gupta, S.; Pusdekar, Y.V.; Hibberd, P.L. Maternal anemia and underweight as determinants of pregnancy outcomes: Cohort study in eastern rural Maharashtra, India. BMJ Open 2018, 8, e021623. Available online: http://bmjopen.bmj.com/content/8/8/e021623.abstract (accessed on 27 April 2022). [CrossRef] [PubMed]
- Gaillard, R.; Durmuş, B.; Hofman, A.; Mackenbach, J.P.; Steegers, E.A.P.; Jaddoe, V.W.V. Risk factors and outcomes of maternal obesity and excessive weight gain during pregnancy. Obesity 2013, 21, 1046–1055. [Google Scholar] [CrossRef] [PubMed]
- SAHRC. South Africa Poverty Rates by Race; South Africa Human Rights Commission: Johannesburg, South Africa, 2018. Available online: https://www.sahrc.org.za/index.php/sahrc-media/news/item/1442-kate-wilkinson-stats-about-poverty-stricken-sa-whites-are-not-true (accessed on 16 April 2018).
- Mishra, P.S.; Sinha, D.; Kumar, P.; Srivastava, S.; Bawankule, R. Newborn low birth weight: Do socio-economic inequality still persist in India? BMC Pediatr. 2021, 21, 518. Available online: https://pubmed.ncbi.nlm.nih.gov/34798861 (accessed on 3 January 2022). [CrossRef] [PubMed]
- Curtis, D.S.; Fuller-Rowell, T.E.; Carlson, D.L.; Wen, M.; Kramer, M.R. Does a Rising Median Income Lift All Birth Weights? County Median Income Changes and Low Birth Weight Rates among Births to Black and White Mothers. Milbank Q. 2022, 100, 38–77. [Google Scholar] [CrossRef] [PubMed]
- Rosário, E.V.N.; Gomes, M.C.; Brito, M.; Costa, D. Determinants of maternal health care and birth outcome in the Dande Health and Demographic Surveillance System area, Angola. PLoS ONE 2019, 14, e0221280. [Google Scholar] [CrossRef] [PubMed]
- Yang, M.; Wang, Y.; Chen, Y.; Zhou, Y.; Jiang, Q. Impact of maternal HIV infection on pregnancy outcomes in southwestern China—A hospital registrybased study. Epidemiol. Infect. 2019, 147, e124. Available online: https://pubmed.ncbi.nlm.nih.gov/30868995 (accessed on 27 April 2022). [CrossRef] [PubMed]
- Gedefaw, G.; Alemnew, B.; Demis, A. Adverse fetal outcomes and its associated factors in Ethiopia: A systematic review and meta-analysis. BMC Pediatr. 2020, 20, 269. [Google Scholar] [CrossRef]
- Zaveri, A.; Paul, P.; Saha, J.; Barman, B.; Chouhan, P. Maternal determinants of low birth weight among Indian children: Evidence from the National Family Health Survey-4, 2015–2016. PLoS ONE 2021, 15, e0244562. [Google Scholar] [CrossRef]
- Perez-Escamilla, R.; Bermudez, O.; Buccini, G.S.; Kumanyika, S.; Lutter, C.; Monsivais, P.; Victora, C. Nutrition disparities and the global burden of malnutrition. BMJ 2018, 361, k2252. Available online: http://www.bmj.com/content/361/bmj.k2252.abstract (accessed on 7 July 2021). [CrossRef]
- Arredondo, A.; Torres, C.; Orozco, E.; Pacheco, S.; Huang, F.; Zambrano, E.; Bolaños-Jiménez, F. Socio-economic indicators, dietary patterns, and physical activity as determinants of maternal obesity in middle-income countries: Evidences from a cohort study in Mexico. Int. J. Health Plann. Manag. 2019, 34, e713–e725. [Google Scholar] [CrossRef] [PubMed]
- Jebena, M.G.; Taha, M.; Nakajima, M.; Lemieux, A.; Lemessa, F.; Hoffman, R.; Tesfaye, M.; Belachew, T.; Workineh, N.; Kebede, E.; et al. Household food insecurity and mental distress among pregnant women in Southwestern Ethiopia: A cross sectional study design. BMC Pregnancy Childbirth 2015, 15, 250. Available online: https://pubmed.ncbi.nlm.nih.gov/26449375 (accessed on 27 April 2022). [CrossRef] [PubMed]
- Matare, C.; Tome, J.; Makasi, R.; Dickin, K.; Pelto, G.; Constas, M.; Chasekwa, B.; Mbuya, M.; Ntozini, R.; Prendergast, A.; et al. Maternal Decision-Making Autonomy, Mental Health, Gender Norm Attitudes, and Social Support During Pregnancy Predict Child Care-Giving and Stunting in Rural Zimbabwe. Curr. Dev. Nutr. 2020, 4 (Suppl. S2), 866. [Google Scholar] [CrossRef]
- Peng, W.; Dernini, S.; Berry, E.M. Coping With Food Insecurity Using the Sociotype Ecological Framework. Front. Nutr. 2018, 5, 107. Available online: https://www.frontiersin.org/article/10.3389/fnut.2018.00107 (accessed on 7 July 2021). [CrossRef] [PubMed]
- Larson, N.; Laska, M.N.; Neumark-Sztainer, D. Food Insecurity, Diet Quality, Home Food Availability, and Health Risk Behaviors among Emerging Adults: Findings From the EAT 2010–2018 Study. Am. J. Public Health 2020, 110, 1422–1428. Available online: https://pubmed.ncbi.nlm.nih.gov/32673120 (accessed on 2 October 2021). [CrossRef]
- Leung, C.W.; Tester, J.M. The Association between Food Insecurity and Diet Quality Varies by Race/Ethnicity: An Analysis of National Health and Nutrition Examination Survey 2011–2014 Results. J. Acad. Nutr. Diet. 2019, 119, 1676–1686. [Google Scholar] [CrossRef]
- Gonzalez-Nahm, S.; Østbye, T.; Hoyo, C.; Kravitz, R.M.; Benjamin-Neelon, S.E. Associations among Food Security, Diet Quality, and Dietary Intake During Pregnancy in a Predominantly African American Group of Women from North Carolina. J. Acad. Nutr. Diet. 2022, 122, 565–572. [Google Scholar] [CrossRef]


Publisher’s Note: MDPI stays neutral with regard to jurisdictional claims in published maps and institutional affiliations. |
© 2022 by the authors. Licensee MDPI, Basel, Switzerland. This article is an open access article distributed under the terms and conditions of the Creative Commons Attribution (CC BY) license (https://creativecommons.org/licenses/by/4.0/).