1. Introduction
Cardiovascular diseases (CVD) represent one of the greatest public health concerns because they are related to high premature morbidity and mortality and an overload of health systems, generating great socioeconomic costs worldwide [
1,
2,
3]. According to the World Health Organization (WHO), CVD is the leading cause of death and accounted for 16% of total deaths from all causes in the world in 2019 [
4]. In Brazil, CVDs were responsible for 30% of deaths [
5]. A study shows a trend towards an increase in deaths from CVD and stroke in Brazil, which are the main causes of death in the country [
6].
Dietary habits influence cardiovascular risk through an effect, for example, on blood pressure (BP), blood lipids, obesity, inflammation and endothelial function [
7]. The likelihood of developing CVD is associated with eating patterns that are considered unhealthy (i.e., excessive intake of sodium and processed foods; added sugars; unhealthy fats; low intake of fruits and vegetables, whole grains, fiber, legumes, fish and nuts), along with a lack of exercise, overweightness and obesity, stress, alcohol consumption or smoking [
8]. A healthy diet is the cornerstone of cardiovascular disease (CVD) prevention.
Individuals with a history of previous cardiovascular events are more likely to develop new events and have an increased risk of mortality, with secondary prevention being decisive to increase survival. Thus, it is extremely important to implement lifestyle changes on this population, such as adhering to a diet composed of foods that are rich in fiber and antioxidant nutrients, is associated with a reduction in the consumption of saturated fats and ultra-processed foods and the adoption of healthy lifestyle habits, considering personal preferences, in addition to cultural and economic aspects [
1,
2,
3,
9,
10,
11,
12,
13,
14,
15].
However, nutritional epidemiology studies that analyze the relationship between diet and disease based on the consumption of isolated foods or nutrients are limited, since, in practice, individuals consume combinations of various foods and nutrients that can interact with each other, which makes the human diet a complex and dynamic exposure factor [
15,
16,
17,
18,
19,
20]. In this sense, the WHO recommends the analysis of dietary patterns, which assess a set or group of foods consumed by a given population [
16,
19,
20].
Thus, the aim of the present study was to compare dietary patterns between the control group and the experimental group before and after the intervention of the BALANCE program.
3. Results
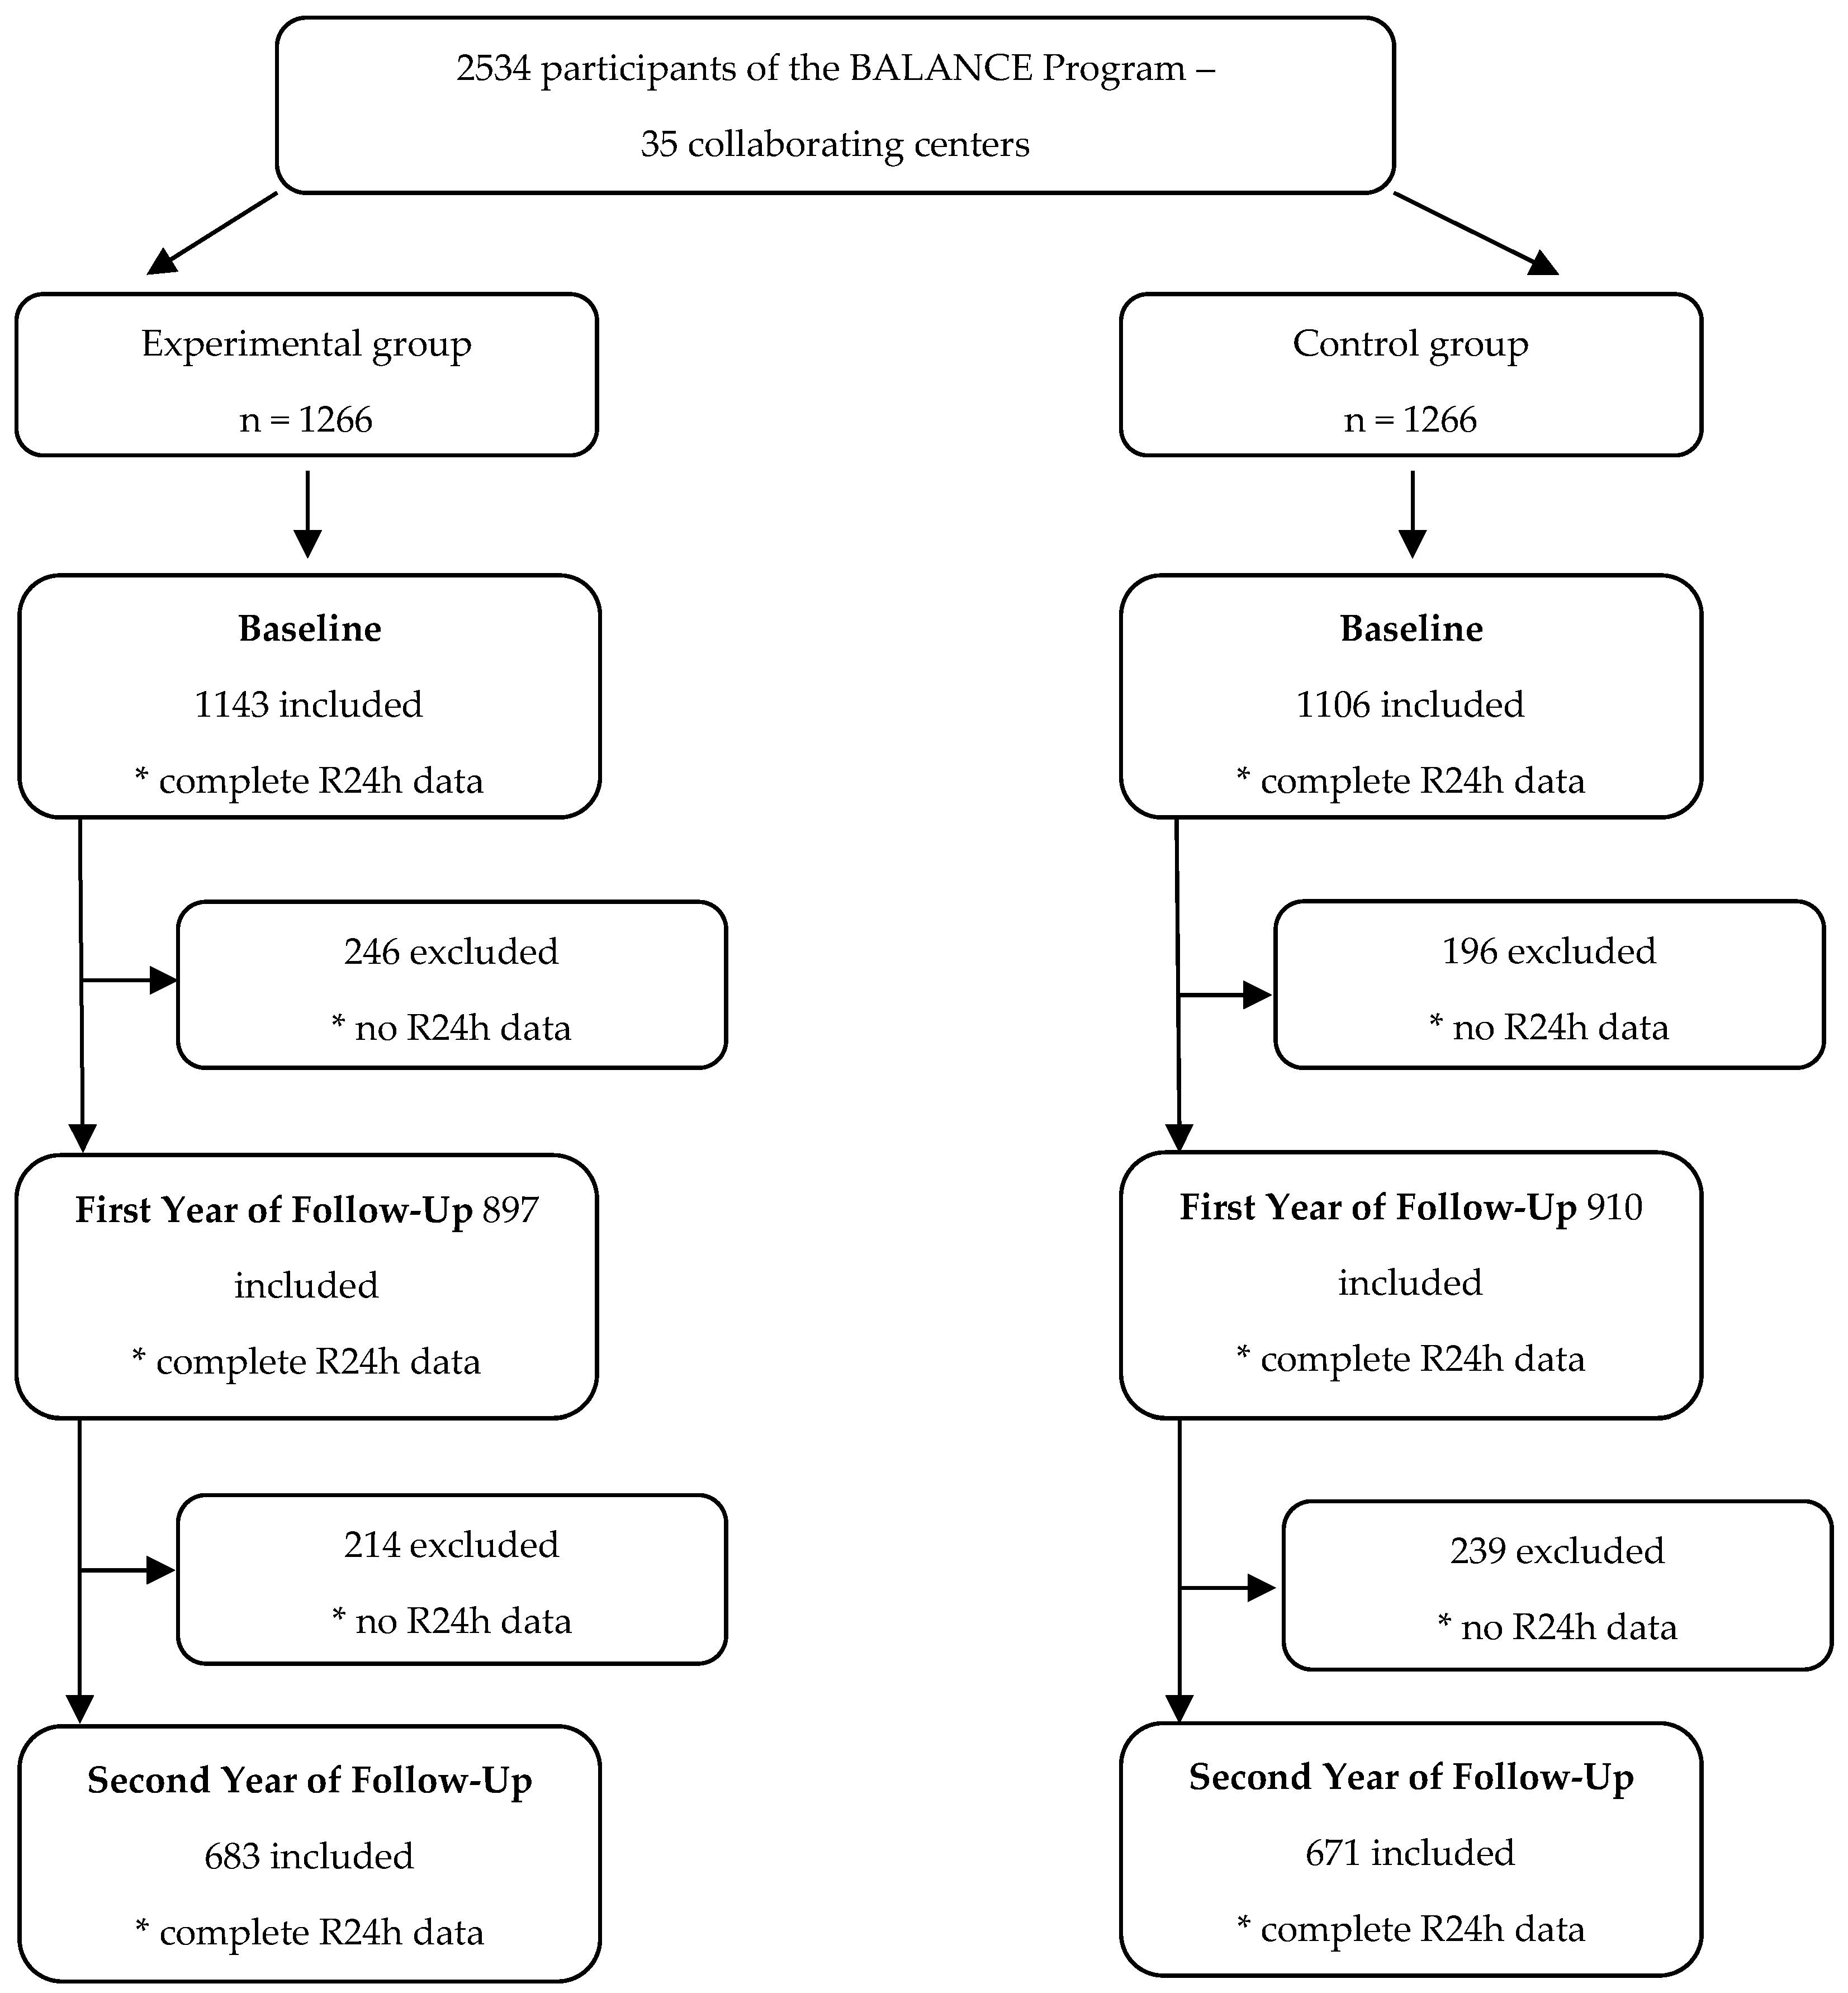
At the initial time, called the baseline year, 2357 individuals participated. A total of 175 participants (6.9% of the total sample recruited) were not included due to incomplete data on food consumption. In the first year of follow-up, data from 1807 individuals from both groups remained, and in the second year of follow-up, data from 1354 individuals from both groups remained (
Figure 1).
Regarding the cardiovascular pathologies presented by individuals undergoing secondary prevention included in the study, 93% of individuals in the experimental group and 92% of individuals in the control group had coronary artery disease; 12% in each of the two groups had a previous acute myocardial infarction; and 12% in each of the two groups had previous peripheral vascular disease [
22].
In the baseline year, before the intervention, 52% of the individuals answered a second R24h. In the first year of follow-up, 90.6% of the individuals answered two R24hs, and in the second year of follow-up, 63% of the individuals answered two R24hs. The group of participants with complete recalls was compared with the other participants who failed to perform a recall to see if there was any bias in these information losses.
Table 1 shows the comparison of the sociodemographic and health characteristics of the individuals according to the study’s participation groups in the baseline year and second year of follow-up, revealing that the groups were similar in the first evaluation and remained so as the study progressed. The comparison of each group at different times of the study was also carried out and showed that there were no significant differences, revealing that the follow-up losses were random (data not presented).
Of the total number of participants, 58.4% were men and 57.7% were aged between 45 and 65 years. In relation to the economic class, 71.1% belonged to classes A or B; as for comorbidities, 90.1% of the participants had SAH and 44.3% had DM. Regarding nutritional status, 73.1% were overweight and 95.2% had waist circumference as a risk for CVD (
Table 1).
The groups formed after classifying the foods and beverages consumed, according to their consumption characteristics and nutritional composition, are shown in
Table 2. Fifteen large groups were formed, as described in the table.
The factor loads for each food pattern identified in each group and the proportion of the variation explained by these patterns at each time are presented in
Table 3 (experimental group) and
Table 4 (control group).
Table 3 shows that four main dietary patterns were identified at the baseline year for the
experimental group before they received the nutritional counseling and prescription program. The first food pattern was called “
Traditional”, which had high factor loads for rice, beans, meats and eggs, in addition to a negative load for pasta. The second pattern was characterized by positive loads for pasta, processed meats, sugary drinks and sugary juices, snacks and sweets and desserts, in addition to high negative loads for fruits and natural juices without sugar. This pattern was called “
Western”. The third pattern, called “
Snack”, was composed of positive loads for breads, cereals and crackers, dairy products, butter and margarine. The fourth pattern was called “
Cardioprotective”. It was characterized by positive loads for vegetables, fruits and natural juices without the addition of sugar, olive oil and cheeses. The four patterns explained 38% of the population’s consumption variance.
In the first year of follow-up, the same four dietary patterns were identified in the
experimental group; however, there were changes in the factorial loads of the foods and the proportion of participants in each consumption quartile, characterizing changes in the eating habits of the individuals. The “
Cardioprotective” food pattern, with positive loads for vegetables, fruits and natural juices without the addition of sugar and olive oil, became the second pattern, and the pattern “
Western”, which is considered unhealthy, became the third pattern (
Table 3).
In the second year of follow-up, there were new changes in the factorial loads of the foods and in the proportion of participants in the
experimental group in each consumption quartile. The “
Cardioprotective” food pattern, with positive loads for vegetables, fruits and natural juices without the addition of sugar and olive oil, became the third pattern, while the “
Western” pattern became the fourth pattern (
Table 3), demonstrating that the nutritional intervention over the two years promoted a continuous reduction in the consumption of ultra-processed foods and sugary drinks, with an increased intake of vegetables, fruits and olive oil, representing a variance of 10.63%, 9.27% and, finally, 8.14% at the end of the follow-up.
With respect to the control group, similar dietary patterns to those identified in the experimental group were seen in the baseline year. The first food pattern identified in the control group was the “Traditional” one, which had high factor loads for rice, beans, meats and eggs. The second pattern was characterized by positive loads for breads, cereals and crackers, dairy products and butter and margarine and by negative loads for coffee and tea, and it was called “Snack”.
The third pattern was called “
Cardioprotective”. It is characterized by positive loads for vegetables, fruits and natural juices without the addition of sugar, olive oil and cheeses. The fourth pattern was called “
Western”, consisting of pasta, processed meats, butters and margarines, sugary drinks and juices with sugar, snacks and sweets and desserts. It also had a high negative load for fruits and natural juices without sugar. The four patterns explained 35% of the population’s consumption variance (
Table 4).
In the first year of follow-up, the same four dietary patterns were identified. However, changes were observed in the factorial loads of the foods and in the proportion of participants in each consumption quartile, characterizing changes in the eating habits of participants in this group. The “
Cardioprotective“ dietary pattern became the second pattern, while the “
Western” pattern became the third (
Table 4).
In the second year of follow-up, the dietary patterns “
Traditional” and “
Cardioprotective” remained as the first and second patterns, respectively, but there were changes in the factor loads of the other two food patterns. These changes revealed that the nutritional intervention in the control group also promoted important positive changes in the eating habits of the participants over the two years (
Table 4).
Regarding the association of dietary patterns with the characteristics evaluated in the follow-up, a greater adherence to the “
Cardioprotective” pattern was observed in the elderly male subjects of the experimental group during the baseline year and second year of follow-up when compared to women and adults (
Table 5). In the second year of follow-up, there was a greater adherence to the “
Cardioprotective” pattern among eutrophic individuals (according to the BMI analysis).
No statistical differences were observed in the adherence to the “cardioprotective” pattern among the participants of the experimental group regarding economic class, nutritional status, waist/height ratio, level of physical activity and smoking (
Table 5).
Adult men participating in the control group showed greater adherence, during the baseline year, to the “
Cardioprotective” pattern (
Table 6). In the second year of follow-up, no statistical differences were observed in the adherence of the participants to the “
Cardioprotective” pattern (
Table 6). There were also no statistical differences in the adherence to this pattern with respect to economic class and nutritional status at baseline and after two years of follow-up (
Table 6).
Since the cardioprotective pattern is recommended for the secondary prevention of cardiovascular disease and the western pattern is the least suitable for healthy eating, those characteristics that had the greatest relationship with these patterns at the beginning and at the end of the follow-up were observed in both groups (
Table 5 and
Table 6).
Initially, some characteristics were more related to the eating pattern, but after two years the impact of the intervention was independent, with no distinction between the characteristics under analysis. With respect to sex, this characteristic did not change over time, even though men adhered more to these two eating patterns (
Table 5).
In the control group, the western pattern was initially more related to the characteristics of male sex, adulthood, physical activity and smoking. This pattern continued to be more adherent to these characteristics, except for physical activity. Initially, men had a greater adherence to the cardioprotective pattern, but after two years, they were no longer associated with any of the characteristics analyzed (
Table 6).
4. Discussion
During the baseline year, the eating pattern that explained the eating habits of individuals in both groups the most was the pattern “
Traditional”. This result corroborates the data found in the Family Budget Survey (
Pesquisa de Orçamentos Familiares, POF 2017–2018), which evaluated the food consumption of a representative sample of the Brazilian population between 2017 and 2018 and revealed that the consumption frequencies of rice and beans (76.1% and 60.0%, respectively) were the highest among the foods reported by the participants of the survey and were the most frequently named items [
36]. In addition, the phone survey of the Risk and Protection Factor Surveillance System for Chronic Diseases (
Vigilância de Fatores de Risco e Proteção para Doenças Crônicas por Inquérito Telefônico, VIGITEL), which analyzed the food consumption of a representative sample of the Brazilian population by telephone, observed that 59.7% of the population reported consuming beans at least five times a week [
37]. This is a cultural characteristic of the Brazilian population’s food intake.
The longitudinal analysis of the present study enabled the identification of the maintenance of this dietary pattern’s variance over the two years of follow-up. This is a positive result, since this pattern includes foods with an important amount of dietary fiber, a nutrient that is directly related to cardiovascular prevention [
12,
38,
39,
40].
The observed variation in the experimental group of the dietary pattern called “
Western” revealed that there were benefits for the secondary prevention of CVD after the intervention of the Brazilian Cardioprotective Food Program, since the increased consumption of the foods identified in this pattern is associated with an increased risk of CVD [
41,
42,
43,
44,
45].
Zhang et al. (2020) analyzed data from a representative sample of the population of the United States of America in order to evaluate the association between the intake of ultra-processed foods and cardiovascular health based on metrics of the American Heart Association, which has defined scores according to lifestyle information, BMI and biochemical tests. They observed an inverse association between ultra-processed food intake and cardiovascular health, with an adjusted OR of 2.57 for the highest consumption quartile [
46].
In recent years, a high consumption of unhealthy foods has been observed in Brazil. The POF 2017–2018 observed that the consumption of ultra-processed foods (rich in saturated fats, trans fats and sugars and poor in fiber) accounted for 19.5% of the total calories consumed by adults and 15.1% of the calories among the elderly [
36].
The VIGITEL study observed a frequency of 15% in terms of soda consumption on five or more days of the week [
37]. This unfavorable scenario for the adoption of healthy eating practices makes food education policies and programs for the general population and the control of the advertising of unhealthy foods even more important, and all these measures become even more relevant when it comes to vulnerable groups, such as people in the secondary prevention of cardiovascular diseases.
The increase in the consumption of ultra-processed foods, which has been observed in the Brazilian population in recent years and is described in these population-based surveys, may explain the increase in the variance of the snack pattern, even in the experimental group, although this variance had an important reduction in the first year of the study’s follow-up.
Several studies have shown that dietary patterns that focus on foods that are considered healthy, such as cereals and whole grains, fruits, vegetables, oilseeds, fish and poultry, olive oil and vegetable oils and skimmed dairy products, and that restrict foods that are considered unhealthy, such as refined grains, added sugars, sugary drinks, red and processed meats and salt and trans fats, are associated with the primary and also secondary prevention of CVD and its comorbidities, and they could prevent up to three-quarters of the deaths caused by these diseases [
47,
48,
49,
50,
51,
52].
The pattern identified in this study called “Cardioprotective” was composed of such foods, and that is the reason for its name. At the initial moment, the variance observed for this pattern in the experimental group was 8.05%, with an increase of almost two percentage points after the first year. In the second year, there was a slight reduction of less than 0.5 percentage points, revealing that the program not only increased the consumption of vegetables, fruits and olive oils after the intervention but also maintained this behavior over time.
The control group had a variance of 9.04% for the same “Cardioprotective” standard at the initial moment, with an increase of a little over one percentage point in one year and a small reduction after two years of follow-up, showing that traditional nutritional orientation over time also proved important for maintaining healthy habits.
This study revealed, through a longitudinal analysis, that there was an improvement in the eating habits of the participants after the intervention, with an increase in the consumption variances of healthy foods.
The WHO recommends an intake of 400 g per day of fruits and vegetables in order to prevent various chronic diseases [
9]. Data from the POF 2017–2018 showed that the intake of these foods by the Brazilian population fell short of the recommendation, in addition to reporting a reduction in their consumption in the last 10 years [
39]. Only 22.9% of Brazilians meet WHO recommendations for fruit and vegetable intake, and 34.3% of the population regularly consumes (five or more days a week) these foods, according to data from the VIGITEL survey [
37].
Understanding the changes in dietary patterns is important to base interventions with the aim of improving diet quality and good health outcomes, since this type of tracking can evaluate the stability or modification of these patterns over time [
53,
54].
Longitudinal tracking assesses the stability or maintenance of a variable over time and helps us understand longitudinal changes in the food consumption of individuals [
53,
54]. Studies aimed at tracking eating patterns are more common in children and adolescents [
55,
56], during the transition to adult life [
57] and in obese individuals [
54]. Little is known about changes in dietary patterns over time in individuals in the secondary prevention of CVD. This study is the first to investigate changes in dietary patterns over time among individuals in the secondary prevention of CVD.
The results of this study prove the importance of nutritional intervention with specialized professionals in promoting changes in eating and lifestyle habits, since the experimental group showed a higher increase in the variance of the “Cardioprotector” pattern than the control group after two years. Because this is a follow-up study, the maintenance of a healthy eating pattern could be observed, which can bring benefits for the prevention of new cardiovascular events, in addition to improving quality of life.
As a limitation, we highlight that it was not possible to identify the tracking coefficients of the dietary patterns because the changes in the total variances of the patterns identified in the period made it impossible to analyze these coefficients.
However, we highlight that this study analyzed data from a population in a very specific situation of secondary prevention of CVD, composed of adults and elderly people from five regions in Brazil who received nutritional intervention. Such characteristics are still scarce in the literature.


 ,
, 
