
New BMI Cut-Off Points for Obesity in Middle-Aged and Older Adults in Clinical Nutrition Settings in Italy: A Cross-Sectional Study

 ,
, 
 ,
,  and
and
Abstract
:1. Introduction
2. Materials and Methods
2.1. Participants and Design of the Study
2.2. Body Weight and Height
2.3. Body Composition
- 40–59 years: BF% ≥ 40% for females and BF% ≥ 28% for males.
- 60–79 years: BF% ≥ 42% for females and BF% ≥ 30% for males.
2.4. Statistical Analysis
3. Results
4. Discussion
4.1. Findings and Concordance with Previous Studies
4.2. Potential Clinical Implications and New Directions
4.3. Study Strengths and Limitations
5. Conclusions
Supplementary Materials
Author Contributions
Funding
Institutional Review Board Statement
Informed Consent Statement
Data Availability Statement
Conflicts of Interest
References
- Holloszy, J.O. The biology of aging. Mayo Clin. Proc. 2000, 75, 8–9. [Google Scholar] [CrossRef]
- Volpi, E.; Nazemi, R.; Fujita, S. Muscle tissue changes with aging. Curr. Opin. Clin. Nutr. Metab. Care 2004, 7, 405–410. [Google Scholar] [CrossRef] [PubMed] [Green Version]
- Bemben, M.G.; Massey, B.H.; Bemben, D.A.; Boileau, R.A.; Misner, J.E. Age-related patterns in body composition for men aged 20–79 yr. Med. Sci. Sports Exerc. 1995, 27, 264–269. [Google Scholar] [CrossRef] [PubMed]
- Macek, P.; Terek-Derszniak, M.; Biskup, M.; Krol, H.; Smok-Kalwat, J.; Gozdz, S.; Zak, M. Assessment of Age-Induced Changes in Body Fat Percentage and BMI Aided by Bayesian Modelling: A Cross-Sectional Cohort Study in Middle-Aged and Older Adults. Clin. Interv. Aging. 2020, 15, 2301–2311. [Google Scholar] [CrossRef] [PubMed]
- Mott, J.W.; Wang, J.; Thornton, J.C.; Allison, D.B.; Heymsfield, S.B.; Pierson, R.N. Relation between body fat and age in 4 ethnic groups. Am. J. Clin. Nutr. 1999, 69, 1007–1013. [Google Scholar] [CrossRef] [Green Version]
- St-Onge, M. Relationship between body composition changes and changes in physical function and metabolic risk factors in aging. Curr. Opin. Clin. Nutr. Metab. Care 2005, 8, 523–528. [Google Scholar] [CrossRef] [Green Version]
- Pi-Sunyer, X. The medical risks of obesity. Postgrad. Med. 2009, 121, 21–33. [Google Scholar] [CrossRef]
- Batsis, J.A.; Zbehlik, A.J.; Barre, L.K.; Bynum, J.P.; Pidgeon, D.; Bartels, S.J. Impact of obesity on disability, function, and physical activity: Data from the Osteoarthritis Initiative. Scand. J. Rheumatol. 2015, 44, 495–502. [Google Scholar] [CrossRef]
- Sarwer, D.B.; Polonsky, H.M. The Psychosocial Burden of Obesity. Endocrinol. Metab. Clin. N. Am. 2016, 45, 677–688. [Google Scholar] [CrossRef]
- Luppino, F.S.; de Wit, L.M.; Bouvy, P.F.; Stijnen, T.; Cuijpers, P.; Penninx, B.W.J.H.; Zitman, F.G. Overweight, obesity, and depression: A systematic review and meta-analysis of longitudinal studies. Arch. Gen. Psychiatry 2010, 67, 220–229. [Google Scholar] [CrossRef]
- Kasen, S.; Cohen, P.; Chen, H.; Must, A. Obesity and psychopathology in women: A three decade prospective study. Int. J. Obes. 2008, 32, 558–566. [Google Scholar] [CrossRef] [Green Version]
- Roberts, R.E.; Deleger, S.; Strawbridge, W.J.; Kaplan, G.A. Prospective association between obesity and depression: Evidence from the Alameda County Study. Int. J. Obes. Relat. Metab. Disord. 2003, 27, 514–521. [Google Scholar] [CrossRef] [Green Version]
- Abdelaal, M.; le Roux, C.W.; Docherty, N.G. Morbidity and mortality associated with obesity. Ann. Transl. Med. 2017, 5, 161. [Google Scholar] [CrossRef] [Green Version]
- Schneider, H.J.; Glaesmer, H.; Klotsche, J.; Böhler, S.; Lehnert, H.; Zeiher, A.M.; März, W.; Pittrow, D.; Stalla, G.K.; Wittchen, H.U. Accuracy of anthropometric indicators of obesity to predict cardiovascular risk. J. Clin. Endocrinol. Metab. 2007, 92, 589–594. [Google Scholar] [CrossRef] [Green Version]
- World Health Organization. Obesity: Preventing and Managing the Global Epidemic; World Health Organization: Geneva, Switzerland, 1998.
- Weir, C.B.; Jan, A. BMI Classification Percentile and Cut Off Points. In StatPearls; Statpearls Publishing: Tampa, FL, USA, 2020. [Google Scholar]
- Pasco, J.A.; Holloway, K.L.; Dobbins, A.G.; Kotowicz, M.A.; Williams, L.J.; Brennan, S.L. Body mass index and measures of body fat for defining obesity and underweight: A cross-sectional, population-based study. BMC Obes. 2014, 1, 9. [Google Scholar] [CrossRef] [Green Version]
- Garn, S.M.; Leonard, W.R.; Hawthorne, V.M. Three limitations of the body mass index. Am. J. Clin. Nutr. 1986, 44, 996–997. [Google Scholar] [CrossRef]
- Deurenberg, P. Universal cut-off BMI points for obesity are not appropriate. Br. J. Nutr. 2001, 85, 135–136. [Google Scholar] [CrossRef] [Green Version]
- Misra, A. Revisions of cutoffs of body mass index to define overweight and obesity are needed for the Asian-ethnic groups. Int. J. Obes. Relat. Metab. Disord. 2003, 27, 1294–1296. [Google Scholar] [CrossRef] [Green Version]
- Itani, L.; Kreidieh, D.; El Masri, D.; Tannir, H.; Chehade, L.; El Ghoch, M. Revising BMI Cut-Off Points for Obesity in a Weight Management Setting in Lebanon. Int. J. Environ. Res. Public Health 2020, 17, 3832. [Google Scholar] [CrossRef]
- Jahanlou, A.S.; Kouzekanani, K. The Accuracy of Body Mass Index and Gallagher’s Classification in Detecting Obesity among Iranians. Iran. J. Med. Sci. 2016, 41, 288–295. [Google Scholar]
- Kali, A.; Gusmanov, A.; Aripov, M.; Chan, M.Y. Proposing new body mass index and waist circumference cut-offs based on cardiometabolic risks for a Central Asia population: A feasibility study. Front. Endocrinol. 2022, 13, 963352. [Google Scholar] [CrossRef] [PubMed]
- Wollner, M.; Paulo Roberto, B.B.; Alysson Roncally, S.C.; Jurandir, N.; Edil, L.S. Accuracy of the WHO’s body mass index cut-off points to measure gender- and age-specific obesity in middle-aged adults living in the city of Rio de Janeiro, Brazil. J. Public Health Res. 2017, 6, 904. [Google Scholar] [CrossRef] [PubMed] [Green Version]
- De Lorenzo, A.; Bianchi, A.; Maroni, P.; Iannarelli, A.; Di Daniele, N.; Iacopino, L.; Di Renzo, L. Adiposity rather than BMI determines metabolic risk. Int. J. Cardiol. 2013, 166, 111–1117. [Google Scholar] [CrossRef] [PubMed]
- De Lorenzo, A.; Nardi, A.; Iacopino, L.; Domino, E.; Murdolo, G.; Gavrila, C.; Minella, D.; Scapagnini, G.; Di Renzo, L. A new predictive equation for evaluating women body fat percentage and obesity-related cardiovascular disease risk. J. Endocrinol. Invest. 2014, 37, 511–524. [Google Scholar] [CrossRef] [PubMed]
- Vandenbroucke, J.P.; von Elm, E.; Altman, D.G.; Gøtzsche, P.C.; Mulrow, C.D.; Pocock, S.J.; Poole, C.; Schlesselman, J.J.; Egger, M.; STROBE initiative. Strengthening the Reporting of Observational Studies in Epidemiology (STROBE): Explanation and elaboration. Ann. Intern. Med. 2007, 147, W163–W194. [Google Scholar] [CrossRef] [Green Version]
- Bilić-Zulle, L. Comparison of methods: Passing and Bablok regression. Biochem. Med. 2011, 21, 49–52. [Google Scholar] [CrossRef]
- Mandrekar, J.N. Receiver operating characteristic curve in diagnostic test assessment. J. Thorac. Oncol. 2010, 5, 1315–1316. [Google Scholar] [CrossRef] [Green Version]
- Silveira, E.A.; Pagotto, V.; Barbosa, L.S.; de Oliveira, C.; das Graças Pena, G.; Velasquez-Melendez, G. Accuracy of BMI and waist circumference cut-off points to predict obesity in older adults. Cien. Saude Colet. 2020, 25, 1073–1082. [Google Scholar] [CrossRef]
- Batsis, J.A.; Mackenzie, T.A.; Bartels, S.J.; Sahakyan, K.R.; Somers, V.K.; Lopez-Jimenez, F. Diagnostic accuracy of body mass index to identify obesity in older adults: NHANES 1999–2004. Int. J. Obes. 2016, 40, 761–767. [Google Scholar] [CrossRef] [Green Version]
- Evans, E.M.; Rowe, D.A.; Racette, S.B.; Ross, K.M.; McAuley, E. Is the current BMI obesity classification appropriate for black and white postmenopausal women? Int. J. Obes. 2006, 30, 837–843. [Google Scholar] [CrossRef] [Green Version]
- Fernández-Real, J.M.; Vayreda, M.; Casamitjana, R.; Saez, M.; Ricart, W. Body mass index (BMI) and percent fat mass. A BMI > 27.5 kg/m2 could be indicative of obesity in the Spanish population. Med. Clin. 2001, 117, 681–684. [Google Scholar]
- Lee, G.; Park, J.; Oh, S.W.; Joh, H.K.; Hwang, S.S.; Kim, J.; Park, D. Association between body mass index and quality of life in elderly people over 60 years of age. Korean J. Fam. Med. 2017, 38, 181–191. [Google Scholar] [CrossRef]
- Sun, W.; Huang, Y.; Xian, Y.; Zhu, S.; Jia, Z.; Liu, R.; Li, F.; Wei, J.W.; Wang, J.G.; Liu, M.; et al. Association of body mass index with mortality and functional outcome after acute ischemic stroke. Sci. Rep. 2017, 7, 2507. [Google Scholar] [CrossRef]
- Roh, L.; Braun, J.; Chiolero, A.; Bopp, M.; Rohrmann, S.; Faeh, D.; Egger, M.; Spoerri, A.; Zwahlen, M.; Puhan, M.; et al. Mortality risk associated with underweight: A census-linked cohort of 31,578 individuals with up to 32 years of follow-up. BMC Public Health 2014, 14, 371. [Google Scholar] [CrossRef] [Green Version]
- Bahat, G.; Tufan, F.; Saka, B.; Akin, S.; Ozkaya, H.; Yucel, N.; Erten, N.; Karan, M.A. Which body mass index (BMI) is better in the elderly for functional status? Arch. Gerontol. Geriatr. 2012, 54, 78–81. [Google Scholar] [CrossRef]
- Shepherd, J.A.; Ng, B.K.; Sommer, M.J.; Heymsfield, S.B. Body composition by DXA. Bone 2017, 104, 101–105. [Google Scholar] [CrossRef]
- Bleeker, S.E.; Moll, H.A.; Steyerberg, E.W.; Donders, A.R.T.; Derksen-Lubsen, G.; Grobbee, D.E.; Moons, K.G.M. External validation is necessary in prediction research: A clinical example. J. Clin. Epidemiol. 2003, 56, 826–832. [Google Scholar] [CrossRef]
- Pellegrini, M.; Ponzo, V.; Rosato, R.; Scumaci, E.; Goitre, I.; Benso, A.; Belcastro, S.; Crespi, C.; De Michieli, F.; Ghigo, E.; et al. Changes in Weight and Nutritional Habits in Adults with Obesity during the “Lockdown” Period Caused by the COVID-19 Virus Emergency. Nutrients 2020, 12, 2016. [Google Scholar] [CrossRef]
- El Ghoch, M.; Fakhoury, R. Challenges and New Directions in Obesity management: Lifestyle Modification Programmes, Pharmacotherapy and Bariatric Surgery. J. Popul. Ther. Clin. Pharmacol. 2019, 26, 1–4. [Google Scholar] [CrossRef]


| Variable | Female | Males | ||||
|---|---|---|---|---|---|---|
| Total N = 2950 | 40–59 N = 2208 | 60–79 N = 742 | Total N = 1850 | 40–59 N = 1285 | 60–79 N = 565 | |
| Age (years) | 54.0 (9.1) | 49.8 (5.5) | 66.6 (5.2) | 54.8 (9.7) | 49.5 (5.7) | 66.8 (5.1) |
| Weight (kg) | 73.3 (13.2) | 73.7 (13.3) | 72.0 (12.8) | 87.9 (15.0) | 89.5 (15.2) | 84.3 (13.9) |
| Height (cm) | 159.5 (6.5) | 160.6 (6.2) | 156.5 (6.5) | 173.2 (7.0) | 174.7 (6.5) | 169.8 (6.9) |
| BMI (kg/m2) | 28.8 (4.9) | 28.6 (4.9) | 29.4 (4.9) | 29.3 (4.4) | 29.3 (4.5) | 29.2 (4.2) |
| WHO classification £ | ||||||
| Normal weight | 747 (25.3) | 612 (27.7) | 135 (18.2) | 340 (18.4) | 243 (18.9) | 97 (17.2) |
| Overweight | 1070 (36.3) | 767 (34.7) | 303 (40.8) | 756 (40.9) | 520 (40.5) | 236 (41.8) |
| Obesity | 1133 (38.4) | 829 (37.5) | 304 (41.0) | 754 (40.8) | 522 (40.6) | 232 (41.1) |
| BF (kg) | 31.7 (9.5) | 31.7 (9.6) | 31.9 (9.3) | 28.7 (9.6) | 28.9 (10.0) | 28.3 (8.7) |
| BF (%) | 42.5 (6.7) | 42.2 (6.7) | 43.6 (6.4) | 32.0 (6.7) | 31.5 (6.9) | 33.0 (6.2) |
| BF Classification ¥ | ||||||
| Normal weight | 362 (12.3) | 269 (12.2) | 93 (12.5) | 185 (10.0) | 125 (9.7) | 60 (10.6) |
| Overweight | 712 (24.1) | 525 (23.8) | 187 (25.2) | 347 (18.8) | 239 (18.6) | 108 (19.1) |
| Obese | 1876 (63.6) | 1414 (64.0) | 462 (62.3) | 1318 (71.2) | 921 (71.7) | 397 (70.3) |
| Lean tissue mass (kg) | 39.2 (5.5) | 39.6 (5.6) | 38.0 (5.2) | 56.2 (7.6) | 57.5 (7.5) | 53.1 (7.0) |
| Lean Tissue mass (%) | 54.2 (6.4) | 54.5 (6.4) | 53.4 (6.2) | 64.5 (6.4) | 65.0 (6.5) | 63.5 (5.9) |
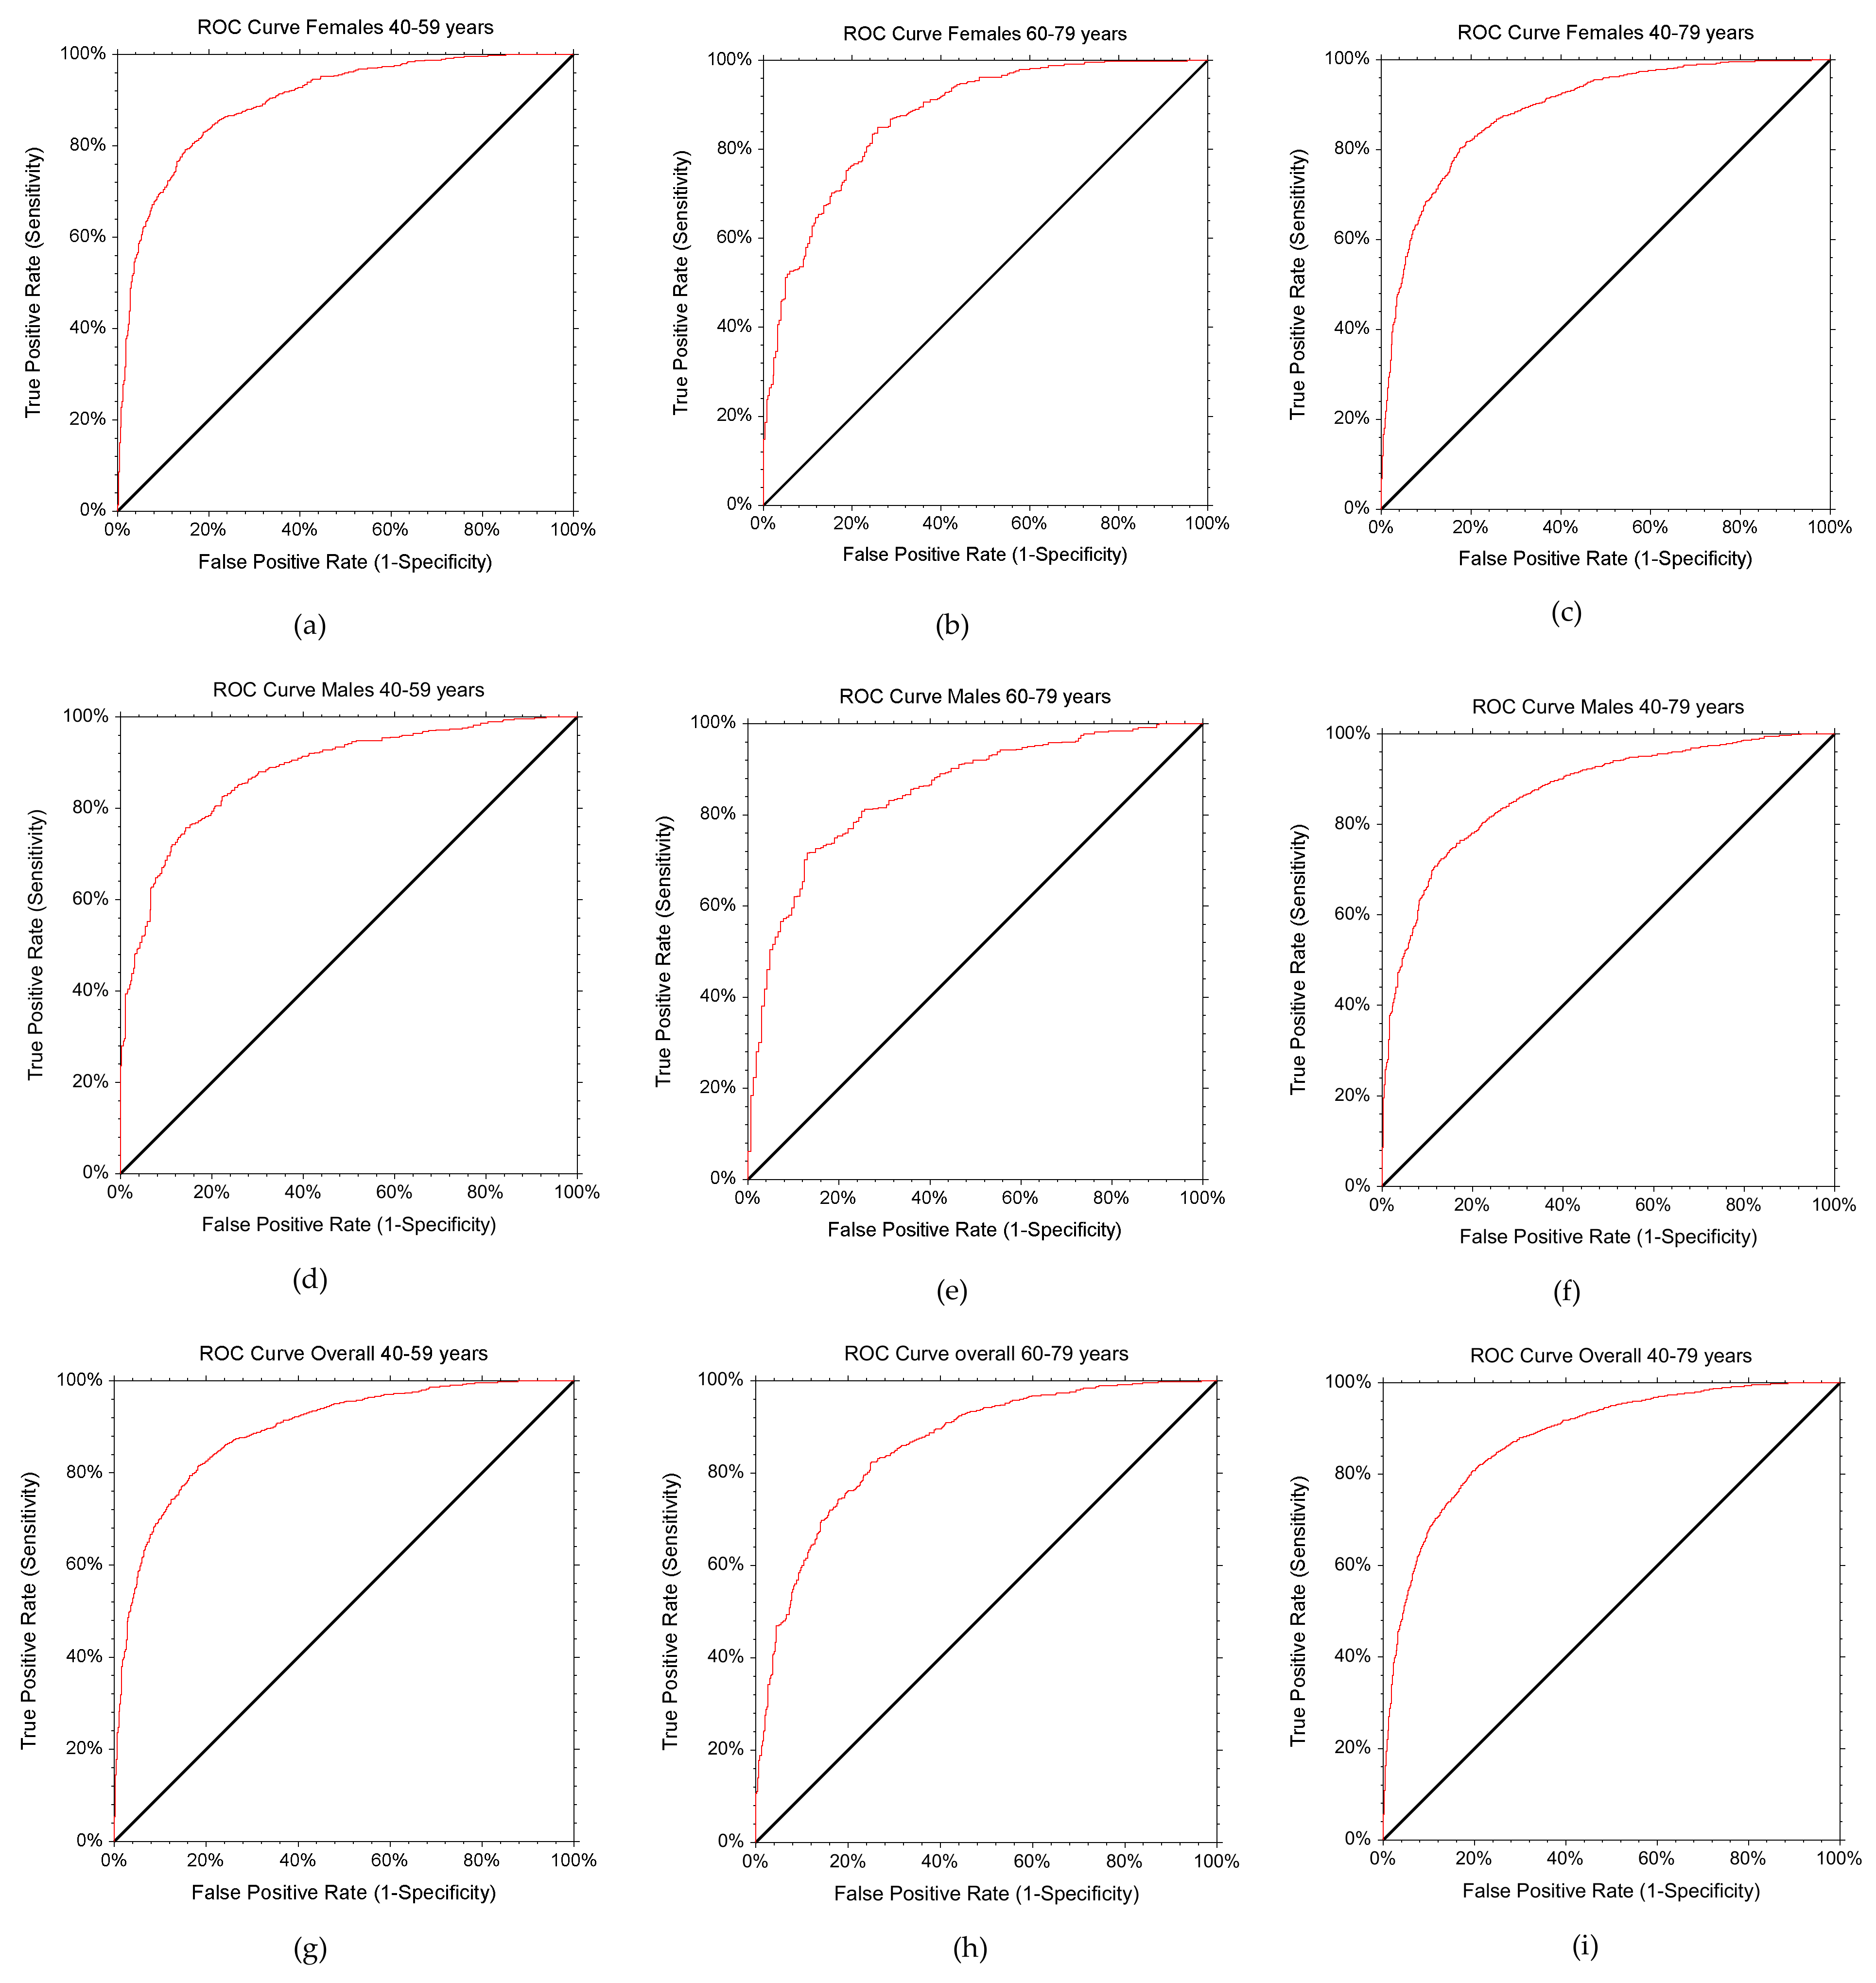
| Total | Obese Subjects | BMI Cut-Off Point for Obesity | AUC (95% CI) | p-Value | Sensitivity | Specificity | |
|---|---|---|---|---|---|---|---|
| Total group (40–79 years) | 4800 | 3194 | 27.27 | 0.88 (0.87–0.89) | <0.0001 | 0.8040 | 0.8076 |
| Females | 2950 | 1876 | 27.08 | 0.89 (0.88–0.90) | <0.0001 | 0.8166 | 0.8119 |
| Males | 1850 | 1318 | 27.36 | 0.88 (0.86–0.90) | <0.0001 | 0.8000 | 0.7940 |
| Age group 1 (40–59 years) | 3439 | 2335 | 27.08 | 0.89 (0.88–0.91) | <0.0001 | 0.8141 | 0.8178 |
| Females | 2208 | 1414 | 27.03 | 0.90 (0.88–0.91) | <0.0001 | 0.8069 | 0.8363 |
| Males | 1285 | 921 | 27.36 | 0.88 (0.86–0.90) | <0.0001 | 0.8000 | 0.7940 |
| Age group 2 (60–79 years) | 1307 | 859 | 27.26 | 0.86 (0.84–0.88) | <0.0001 | 0.8219 | 0.7522 |
| Females | 462 | 742 | 27.11 | 0.87 (0.84–0.90) | <0.0001 | 0.8506 | 0.7429 |
| Males | 565 | 397 | 27.25 | 0.85 (0.82–0.89) | <0.0001 | 0.8111 | 0.7440 |
| Age and Gender Distribution | Proportion Correctly Diagnosed | BMI ≥ 30 kg/m2 | ||
|---|---|---|---|---|
| WHO Cut-Off Point | New Cut-Off Point | Sensitivity | Specificity | |
| Total group (40–79 years) | 56.0 | 80.4 | 56.04 | 93.96 |
| Females | 57.0 | 81.7 | 57.09 | 94.36 |
| Males | 54.7 | 80.0 | 54.70 | 93.80 |
| Age group 1 (40–59 years) | 55.5 | 81.4 | 55.55 | 95.16 |
| Females | 56.2 | 80.7 | 56.29 | 95.59 |
| Males | 54.4 | 80.0 | 54.40 | 94.23 |
| Age group 2 (60–79 years) | 57.6 | 82.2 | 57.63 | 90.85 |
| Females | 59.5 | 84.8 | 59.74 | 89.64 |
| Males | 55.4 | 81.1 | 55.42 | 92.86 |
Publisher’s Note: MDPI stays neutral with regard to jurisdictional claims in published maps and institutional affiliations. |
© 2022 by the authors. Licensee MDPI, Basel, Switzerland. This article is an open access article distributed under the terms and conditions of the Creative Commons Attribution (CC BY) license (https://creativecommons.org/licenses/by/4.0/).
Share and Cite
Di Renzo, L.; Itani, L.; Gualtieri, P.; Pellegrini, M.; El Ghoch, M.; De Lorenzo, A. New BMI Cut-Off Points for Obesity in Middle-Aged and Older Adults in Clinical Nutrition Settings in Italy: A Cross-Sectional Study. Nutrients 2022, 14, 4848. https://doi.org/10.3390/nu14224848
Di Renzo L, Itani L, Gualtieri P, Pellegrini M, El Ghoch M, De Lorenzo A. New BMI Cut-Off Points for Obesity in Middle-Aged and Older Adults in Clinical Nutrition Settings in Italy: A Cross-Sectional Study. Nutrients. 2022; 14(22):4848. https://doi.org/10.3390/nu14224848
Chicago/Turabian StyleDi Renzo, Laura, Leila Itani, Paola Gualtieri, Massimo Pellegrini, Marwan El Ghoch, and Antonino De Lorenzo. 2022. "New BMI Cut-Off Points for Obesity in Middle-Aged and Older Adults in Clinical Nutrition Settings in Italy: A Cross-Sectional Study" Nutrients 14, no. 22: 4848. https://doi.org/10.3390/nu14224848
APA StyleDi Renzo, L., Itani, L., Gualtieri, P., Pellegrini, M., El Ghoch, M., & De Lorenzo, A. (2022). New BMI Cut-Off Points for Obesity in Middle-Aged and Older Adults in Clinical Nutrition Settings in Italy: A Cross-Sectional Study. Nutrients, 14(22), 4848. https://doi.org/10.3390/nu14224848