Abstract
This study examined the relationship between maternal food source and preparation during pregnancy and the duration of breastfeeding among 751 mother–child dyads in the United States. The data collected from the Environmental influences on Child Health Outcomes (ECHO) Program included twelve cohorts of mothers (age ≥ 18) who delivered infant(s). Three categories of maternal food source and preparation including, High, Moderate, or Low Food Source Quality were derived from the mother report. The mean duration of breastfeeding differed strongly across the three categories. The High Food Source Quality group breastfed an average of 41 weeks, while shorter durations were observed for the Moderate (26 weeks) and Low (16 weeks) Food Source Quality groups. Cox proportional hazards models were used to estimate the relative hazard of time to breastfeeding cessation for each participant characteristic. The full model adjusted for clustering/cohort effect for all participant characteristics, while the final model adjusted for the subset of characteristics identified from variable reduction modeling. The hazard of breastfeeding cessation for those in the High Food Source Quality group was 24% less than the Moderate group (RH = 0.76; 95% CI, 0.63–0.92). Pregnant women in the High Food Source Quality group breastfed longer than the Moderate and Low groups. We encourage more detailed studies in the future to examine this relationship longitudinally.
1. Introduction
Breastfeeding is associated with a range of positive physical and mental health outcomes for mothers and infants, with evidence suggesting that a longer breastfeeding duration is associated with the greatest benefits to the child and the mother [1,2,3]. However, several difficulties may impede breastfeeding initiation [4] or lead to earlier breastfeeding cessation [5,6]. Recent research has established a link between maternal eating post-pregnancy and child eating behaviors [7,8,9]. Accordingly, diet and eating patterns during pregnancy are also likely important elements for the health of the mother–infant dyad and may play a role in breastfeeding behaviors after birth. However, little is known about how prenatal maternal dietary factors may be associated with breastfeeding. This present study aimed to examine the relationship between maternal food source and preparation during pregnancy and breastfeeding outcomes among mother–infant dyads.
Both the World Health Organization and UNICEF recommend that mothers initiate breastfeeding within the first hour of birth and exclusively breastfeed for the first 6 months of life [10]. Although an emerging body of literature has focused on the influence of the maternal diet during the lactation on milk composition and breastfeeding outcomes [11,12], comparatively little work has focused on the relationship between the maternal diet quality during pregnancy and breastfeeding outcomes.
A diet during pregnancy that is comprised of high-quality food, supplying essential macro and micro-nutrients, is crucial to the health status of the mother and the child [13]. However, maternal food sources and food preparation (e.g., organic foods, pre-made foods) are likely heavily determined by socio-economic status and maternal age [14]. Given that economic factors and food insecurity influence the breastfeeding initiation and duration, [15], we may expect those with a diet of lower quality food source and preparation to experience greater barriers to breastfeeding, resulting in shorter breastfeeding duration. Pregnancy and lactation place additional demands on a mother’s body. Optimal quality and preparation of foods consumed to meet those demands may not be available to all. To date, this has not been empirically examined with a large, diverse sample.
One of the few studies in this area investigated the role of maternal diet, personal characteristics, and willingness to breastfeed on breastfeeding duration for 161 hospitalized neonates in Greece. This study found that the adjusted odds ratios for breastfeeding at 6 months were significantly higher (2.15) for women who consumed ≥3.5 servings of fruits/day, as compared to those who consumed fewer fruits and vegetables [16]. These initial findings provide preliminary support for a relationship between diet quality and breastfeeding duration; however, more research is needed in other populations with a larger sample size to clarify the relationship between maternal diet quality during pregnancy and breastfeeding outcomes.
This study examines the relationship between self-reported food source and preparation during pregnancy and breastfeeding duration among mother child–dyads in the United States. These data for this study are derived from the Environmental influences on Child Health Outcomes (ECHO) study, an NIH funded large nationwide collection of maternal–child cohorts [17,18,19]. We hypothesize that poor maternal food source and preparation (e.g., eating a lot of processed foods or takeout) would be associated with a shorter breastfeeding duration, even when accounting for low maternal socioeconomic status and younger age, which are documented predictors of a shorter breastfeeding duration [20].
2. Materials and Methods
2.1. Study Design
This study utilized data from a large multi-cohort study with self-report and objective measures collected from the parents. This study was conducted in accordance with the Declaration of Helsinki. All participants consented to participate in their local ECHO cohort and for their information to be shared with the ECHO consortium. Both a central and a cohort-specific institutional review board monitored human subject activities at each cohort site and at the centralized ECHO Data Analysis Center. All participants provided informed consent.
2.2. Sample
The current study analyzed both extant data, which were collected prior to the formation of ECHO in 2016, and newly collected ECHO cohort data from mothers 18 years of age or older, who delivered either preterm or full-term prior to 31 August 2021. Survey data from children and their mothers were used from twelve of these ECHO cohorts (Supplementary Table S1).
Additional inclusion criteria included self-report data from mothers between 18 and <47 years of age with information regarding maternal food source and the preparation and breastfeeding duration (n = 764). One preterm cohort was excluded, as it only enrolled infants from the Neonatal Intensive Care Unit. After exclusions, a total of 751 mother–child dyads across twelve cohorts, enrolled from five U.S. states, met the criteria, and were included in the current analysis (Figure 1).
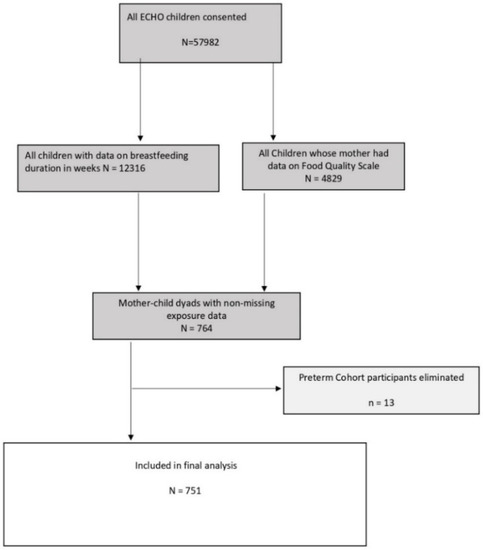
Figure 1.
Inclusion in the analysis.
2.3. Measures
2.3.1. Breastfeeding Duration
Duration of breastfeeding, or time to breastfeeding cessation in months, was the outcome variable of interest. For this study, breastfeeding duration data were collected from the ECHO-wide Infant Feeding Practices (IFP) Questionnaire, a self-report tool used to evaluate feeding beliefs and behaviors among mothers of infants [21]. The IFP comprises 39 items on maternal beliefs, 24 items on behaviors, and 20 behavioral items that pertain to solid feeding for infants over 6 months. The current analysis utilized one IFP question to determine the breastfeeding duration: “How old was the child when the child’s biological mother completely stopped breastfeeding and pumping milk?” This variable was utilized after the ECHO-wide data harmonization process for the length of breastfeeding that was completed as of 31 August 2021.The harmonization process uses both new data collected by the standardized protocol and cohort-specific extant data to maximize the sample size and power for analysis. The time to breastfeeding cessation was examined as a continuous variable, and no cutoffs were considered.
2.3.2. Maternal Food Source Quality
Maternal, prenatal Food Source Quality was classified as High, Moderate, or Low based on the mean responses to seven food source-based questions from the ECHO Maternal Food Source and Preparation Questionnaire. This questionnaire was administered to mothers during the prenatal life stage. The Food Source Quality score for each question was recorded and summarized (i.e., arithmetic mean) across the seven questions that captured the self-reported frequency of canned food consumption; fast food or restaurant takeout consumption; cooking at home; and organic vegetables, organic fruits, organic meat and/or poultry, and organic dairy product consumption in the past 30 days (Table 1).

Table 1.
Categorization and coding for maternal, pre-natal food source, and food preparation behaviors, Quality Score, based on the questions on the ECHO Maternal Food Source and Preparation (MFSP) questionnaire.
The Food Source Quality mean score, a continuous variable, ranged from 1 to 4. A mean score of 1 indicates ‘Excellent’ food source responses across all seven questions. Inversely, a mean score equal to 4 indicates a response of ‘Poor’ on all questions. For example, a mother who never or rarely ate fast food or packaged food was coded as having an ‘Excellent’ Food Source Quality score (i.e., equal to 1) for that question and, conversely, a mother who ate fast food or packaged food at least once a day was coded as having a ‘Poor’ Food Source Score (i.e., equal to 4). For the same question, responses of 1 to 3 times a week were coded as ‘Average’, and 4 to 6 times a week were coded as ‘Poor.’ This Food Source classification allowed us to capture the maternal responses across a variety of questions. For instance, a mother might report never eating takeout, which would be coded as ‘Excellent’, and report always eating canned food, which would be coded as ‘Poor.’ Thus, our Food Source Quality mean score allowed us to account for mothers who scored ‘Excellent’ on some questions and ‘Poor’ on others within our analyses.
Table 2 shows the categorization of the Food Source Quality mean score into three groups, and Table 3 presents the frequencies and percentages of the covariates across the three Food Source Quality categories. This categorization enabled us to model the effect of Food Source Quality on breastfeeding duration from a survival analysis perspective.
Table 2.
Categorization of Food Source Quality mean scores.
Table 3.
Frequencies and percentages, means, and standard deviations of the covariates across the Food Source Quality categories.
2.3.3. Participant Characteristics
Demographic and socio-economic characteristics of participants considered in the analysis were maternal race/ethnicity, maternal education, household income, marital status, maternal depression diagnosis during pregnancy, parity, maternal age at birth, maternal pre-pregnancy body mass index (BMI), child gestational age at birth, and birth weight (grams). We gathered each participant’s information from the forms they filled out during pre-pregnancy through the first six months of their child’s follow-up. The specific categories measured can be found in Table 4 as well as the number of participants, percent of participants with data, and the estimated hazard ratios (HRs).
Table 4.
Univariate descriptive statistics of breastfeeding duration by food source quality, participant demographic and socio-economic characteristics among 751 mother–child dyads with information available for both breastfeeding duration and mother’s food source quality scale, the bivariate estimates of association with breastfeeding duration.
Two sources of data within the ECHO program were utilized to obtain information on a depression diagnosis during pregnancy: clinical diagnosis of depression (either self-reported or medical record), and ECHO Patient-Reported Outcomes Measurement Information System (PROMIS) instruments [22]. PROMIS yields a standardized T-Score for self-reported depressive symptoms, with a mean of 50 (SD = 10). A T-score greater than 50 is indicative of more depressive symptoms than average during pregnancy, and a score below 50 indicates fewer depressive symptoms than average. These measures were restricted to pre-pregnancy and infancy life stages. Parity was calculated from harmonized ECHO data and was defined as the number of pregnancies that lasted greater than 20 weeks prior to the ECHO pregnancy of interest.
2.4. Statistical Methods
Descriptive statistics are presented as frequencies and relative frequencies (percent) for variables measured on a categorical scale, and as a means and standard deviations for variables measured on a continuous scale. The bivariate independent relationships between breastfeeding duration and all variables were examined. Cox’s proportional hazards models [23] were used to estimate the relative hazard of the time to breastfeeding cessation for each participant characteristic independently, as a composite multivariable adjusted model. Results from the Cox model are presented as relative HRs with the associated 95% confidence interval (CI). The variable reduction modeling approach evaluated the role, if any, of each participant characteristic as an effect measure modifier of the Food Source Quality Scale and breastfeeding duration association, followed by an evaluation of each characteristic acting as a possible confounder of the Food Source Quality Scale and breastfeeding duration association. Variable reduction for the final model was conducted by a backward elimination of the characteristics from the full model that were least significant. Further, we treated the variation due to cohorts as a random factor to account for the clustering effect by including a random effect for each cohort in the model. The plot of the survival functions was generated with baseline hazard function [24] estimated at the midpoint of the three Food Source Quality Scale categories, (i.e., 1.5, 2.5, and 3.5), and for the identified referent category for each of the covariates identified in the final model. No imputation or elimination of the missing categories was conducted. The variables that remained in our final model had no more than 25% of missingness. Imputation would not improve our results, as the relative HRs for the Food Source Quality Scale categories remained stable throughout the analysis.
3. Results
Of the 12,316 ECHO children with complete data available for duration of breastfeeding, 751 (6.10%) had mothers with sufficient information on maternal food questions during pregnancy to be included in analysis.
Table 3 presents the frequencies and percentages of the covariates across the Food Source Quality categories as well as their breastfeeding durations. Mothers categorized as having High Food Source Quality tended to have a higher level of education (32.6% had a master’s or doctorate degree), a higher household income (47% reported earning >$100,000 per year) and tended to be older (43.7% were over the age of 33) compared with the other groups. More specifically, mothers in the Low Food Source Quality group had the lowest education level (52.8% reported a high school degree or some college), the lowest household income (40.7% reported earning <$30,000) and tended to be younger (70.7% were between the ages of 18–30 years old).
Table 4 presents the frequencies and percentages, means and standard deviations of breastfeeding duration, and the unadjusted relative hazard estimate and 95% CI for each category of participant characteristics considered. Thirty-six percent of the study population were observed to have High Food Source Quality, 45% had Moderate Food Source Quality, and 19% had Poor Food Source Quality. A majority of mothers identified as non-Hispanic white (43%) or Hispanic (37%). Almost half had at least a college degree and, separately, an income below $100,000. Almost half of the mothers were older than 33 years of age. Fewer than 10% gave birth at less than 37 weeks (gestational age), and 5% of births had weights less than 2500 g.
The mean duration of breastfeeding differed across the three Food Source Quality categories. Specifically, the participants with High Food Source Quality breastfed an average of 41 weeks, while the Moderate and Low-quality food groups were shorter at 27 weeks and 16 weeks, respectively.
The median duration of breastfeeding was 30 weeks for the participants with High Food Source Quality, 22 weeks for the participants with Moderate quality, and 13 weeks for those with Low Food Source Quality. As expected, maternal race/ethnicity, education, and age were associated with breastfeeding duration as well as household income, marital status, child’s gestational age at birth, and birth weight in the bivariate analysis. The mothers’ pre-pregnancy BMI and PROMIS depression score were not found to be associated with breastfeeding duration in the bivariate analysis.
Parity and maternal variables for depression and stress had large proportions of missing data. These variables were associated with breastfeeding duration but only for the category of the participants with missing values for those variables; therefore, they were eliminated in subsequent analyses.
Table 5 presents the adjusted HRs for each participant characteristic in the full model, adjusted for all characteristics (Maternal Race/Ethnicity, Maternal Education, Household Income, Marital Status, Pregnancy Depression Diagnosis, Pregnancy Depression PROMIS T-score, Parity, Maternal Age at birth, Maternal Pre-Pregnancy BMI, Gestational Age, Birth Weight) as potential confounders, and in the final model, adjusted for the characteristics found to remain relevant in the reduced model of breastfeeding duration after the variable reduction procedures. The HRs for Food Source Quality categories did not differ much between the full model and the final model where the final adjusted HRs were 0.76 for the High Food Source Quality category and 1.52 for the Low Food Source Quality category compared to the Moderate Food Source Quality category. That is, participants in the High Food Source Quality group had a 24% lower hazard of breastfeeding cessation before 6 months postpartum (95% HR CI, 0.63–0.92), and those in the Low Food Source Quality group had a 52% greater hazard of breastfeeding cessation before 6 months postpartum (95% HR CI, 1.22–1.89) compared with the Moderate group. Increased maternal education and age were significantly associated with longer breastfeeding duration. Mothers with pre-pregnancy BMI of <25 (Normal) breastfed for 37 weeks, which was 7 weeks longer than those with pre-pregnancy BMI of 25–30 (Overweight) who breastfed for 31 weeks. The HRs for the overweight group were slightly lower than for the normal group throughout the analysis. However, the difference in HRs was not statistically significant. The mothers with pre-pregnancy BMI > 30 (obese) breastfed the least, at an average of 24 weeks. Of note, fifty percent of the pre-pregnancy BMI of <25 (Normal) group were in the High Food Source Quality group.
Table 5.
Adjusted relative hazards of breastfeeding duration by food source quality categories from Cox’s proportional hazard model of time until breastfeeding cessation adjusting for participant demographic and socio-economic characteristics.
Figure 2 depicts the survival curves for the midpoint of each of the three Food Source Quality categories adjusted for the referent group for each of the exposure variables remaining in the final model. The median time to breastfeeding cessation was 13.0 weeks for those mothers in the Low Food Source Quality category, 21.7 weeks for the Moderate Food Source Quality category, and 30.3 weeks for those with High Food Source Quality.
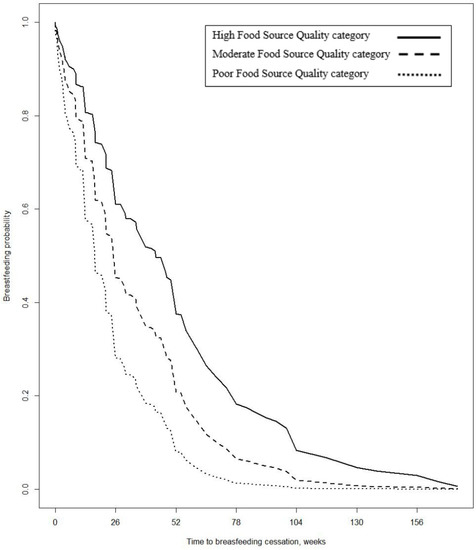
Figure 2.
Plot of survival function (time to breastfeeding cessation) by midpoints of the three quality scale categories, adjusted for baseline hazard estimate characteristics identified in the final model.
4. Discussion
The goal of this study was to examine the relationship between self-reported food source during pregnancy and breastfeeding duration, using a diverse, multi-cohort population sample. Our findings are in line with our hypothesis that mothers who reported eating more processed and fast foods and less food prepared at home breastfed for a shorter duration. More specifically, pregnant women with High Food Source Quality breastfed an average of 14 weeks longer than the Moderate Food Source Quality group and 25 weeks longer than the Low Food Source Quality group. Further, the hazard of breastfeeding cessation before 6 months postpartum for those in the High Food Source Quality group was 24% lower than the Moderate Food Source Quality group, and the Low Food Source Quality was 52% higher. This is the first time that maternal food source during pregnancy has been examined and linked to breastfeeding duration in such a large and diverse cohort.
The High Food Source Quality group consisted of women with higher education levels who were older and earning more money per year compared with the Moderate and Low Food Source Quality groups. These findings are consistent with prior research linking maternal food sources and preparation to SES and maternal age [14]. Furthermore, studies have found the SES status of consumers predicts the perceived value of organic food [25]. Indicators of low SES, such as lower education, limited income, and unemployment are associated with food insecurity in both resource-rich and resource-limited settings [26,27]. Increased maternal stress, which can be elevated in low SES communities, can be linked to poorer diets, and decreased breastfeeding duration [15]. These factors need to be prospectively examined in more detail among mother–child dyads. Taken together, these relationships are complex but highlight some of the apparent health and social inequities, the importance of education surrounding optimal nutrition during pregnancy, and the need to provide relevant resources to those in at-risk communities.
Interestingly, the data also demonstrate that mothers with the highest pre-pregnancy BMI (>30 categorized as obese) breastfed for the shortest duration. This finding is consistent with prior studies linking increased weight with poor body image, which has been linked to shorter breastfeeding duration [28]. In fact, a systematic review identified that body image concerns during pregnancy were associated with lower rates of breastfeeding intention, initiation, and shorted duration [29]. While this study only measured maternal pre-pregnancy BMI, future studies examining the effect of maternal food source, and preparation on the breastfeeding duration should also include maternal body image factors.
The work by Gross and colleagues emphasized the importance and utility of incorporating strategies to address misconceptions about maternal diet and breast milk adequacy, managing stress, building social support networks, and connecting to supplemental nutrition assistance programs [15]. Efforts to support access to healthy fresh food and in-home cooking practices can also bolster breastfeeding duration [30]. These strategies could be implemented in obstetric clinics in at-risk communities. Maternal feeding practices greatly influence child feeding practices, and early education, resources, and interventions aimed at improving breastfeeding duration may be most useful if they start early in pregnancy when breastfeeding intention is decided [31,32]. Challenges to certain desirable eating patterns (e.g., cooking at home) during pregnancy may also be challenges to breastfeeding later.
Early maternal feeding practices are associated with children’s eating behaviors [7,8,9] and growth [9,33]. Early in infancy, data indicate that maternal weight, body image and eating concerns, concern regarding their children’s weight, and breastfeeding self-efficacy may constitute as critical barriers to exclusive breastfeeding up to 6 months [34,35]. Interestingly, prior work has demonstrated that rats fed a “junk food diet” during pregnancy and lactation predisposed offspring to obesity [36]. Taken together, maternal diet and feeding practices greatly influence early feeding patterns in the infant and child and these practices may place the child at increased risk for adverse health outcomes. It is also important to consider the context in which food is consumed. Many meal practices are deeply rooted in family traditions, which may impact factors such as food waste and mealtime practices (e.g., family meals). Future studies should examine maternal attitudes toward respect for food and eating to elucidate some of these important questions.
The scale that we used had participants’ report on their food source and preparation. We categorized the excessive usage of canned food as “poor” food source classification because fresh foods are recommended as the primary nutrient-dense dietary options and that many Americans use these products for their cost and/or convenience, and not for their nutritional properties [37]. We categorized the excessive usage of organic food as “excellent” food source classification, given that organic plants do not rely on chemical pesticide sprays to protect themselves and in turn, produce more of their own protective compounds, such as antioxidants [38]. Further, studies have also reported an increase in micronutrients such as Vitamin C, Zinc, and Iron in organic foods [38,39,40]. In the current analysis, we did not collect data on which type of canned or organic foods were consumed but rather just on the frequency. This level of detail needs to be looked at in future studies.
Our study includes several limitations. There was a high level of missingness for some covariates, making it harder to draw inference. This was a retrospective study that utilized some extant data collected before the ECHO nationwide program was officially initiated. Questionnaires collected for the ECHO nationwide program were not primarily designed to address this specific research question and as a result, the current analysis did not include important postpartum factors, such as whether mothers worked and when they returned to work, sleep, childcare support, and maternal stress. Moreover, our analysis involved the inclusion of mother–child dyads from several cohort studies that differ by measurement, visit structure, and time period. We attempted to account for this clustering effect by treating cohorts as a random effect in the modeling, but some residual confounding may remain. The maternal food source and preparation variable was designed for this study, and while it allowed us to adapt to this specific population, this may also have constituted a limitation. Using the three categories (Low, Moderate, and High) of Food Source Quality allowed clearer insights into the association between Food Source Quality and breastfeeding duration than utilizing the continuous measure alone. Our findings suggest an association between maternal food source and preparation and breastfeeding duration even when adjusting for covariates, and the support future nuanced the research examining food source and preparation.
Future work should seek to explore the relationships with other dietary factors such as maternal and infant food allergies, access to breastfeeding support, and access to parental leave from work, as these data were not available among the ECHO cohorts. Another important future direction is to explore the connections among maternal pregnancy complications, nutritional intake, and breastfeeding duration, given the emerging data linking vitamin B12 deficiency to preeclampsia [41]. Longitudinal examinations of these relationships and the way they evolve over the course of the postpartum period is also warranted.
5. Conclusions
Women reporting High Food Source Quality during pregnancy breastfed an average of 14 weeks longer than the Moderate Food Source Quality group and 25 weeks longer than the Low Food Source Quality group. The adjusted relative hazard ratio of time to breastfeeding cessation indicated a protective effect for the High Food Source Quality group and a detrimental effect for the Low Food Source Quality group compared with the Moderate Food Source Quality group. To our knowledge, this is the first large diverse cohort study examining the link between maternal food source and preparation during pregnancy and breastfeeding duration. We encourage future studies to examine this relationship longitudinally, with more consideration for specific details about maternal diet, food source, and preparation during pregnancy in the context of sociodemographic determinants, such as SES, that are associated with less-than-optimal food consumption.
Supplementary Materials
The following supporting information can be downloaded at: https://www.mdpi.com/article/10.3390/nu14224922/s1, Table S1: Number of participants in individual cohorts.
Author Contributions
Conceptualization, E.Z., K.K.G., R.F.R., D.J.W., M.W., J.F.C., A.A., J.D.M., G.H.-M., Z.R.P., M.H., C.M.V.-V., C.A.C.J., Y.Z., S.S.N., S.S.C., C.H. and P.M.T.; Data curation, K.K.G. and P.M.T.; Formal analysis, K.K.G. and P.M.T.; Funding acquisition, E.Z., K.K.G., R.F.R., D.J.W., M.W., J.F.C., A.A., J.D.M., G.H.-M., Z.R.P., M.H., C.M.V.-V., C.A.C.J., Y.Z., S.S.N., S.S.C., C.H. and P.M.T.; Methodology, E.Z.; Resources, E.Z., K.K.G., R.F.R., D.J.W., M.W., J.F.C., A.A., J.D.M., G.H.-M., Z.R.P., M.H., C.M.V.-V., C.A.C.J., Y.Z., S.S.N., S.S.C., C.H. and P.M.T.; Writing—original draft, E.Z., K.K.G. and P.M.T.; Writing—review and editing, E.Z., K.K.G., R.F.R., D.J.W., M.W., J.F.C., A.A., J.D.M., G.H.-M., Z.R.P., M.H., C.M.V.-V., C.A.C.J., Y.Z., S.S.N., S.S.C., C.H. and P.M.T. All authors have read and agreed to the published version of the manuscript.
Funding
The content is solely the responsibility of the authors and does not necessarily represent the official views of the National Institutes of Health. The Research reported in this publication was supported by the Environmental influences on Child Health Outcomes (ECHO) program, Office of The Director, National Institutes of Health, under award numbers U2COD023375 (Coordinating Center), U24OD023382 (Data Analysis Center), U24OD023319 (PRO Core), UH3OD023251 (Alshawabkeh), UH3OD023253 (Camargo), UH3OD023344 (MacKenzie), UH3OD023289 (Ferrara), UH3OD023285 (Kerver), UH3OD023279 (Elliott), UH3OD023313 (Deoni), UH3OD023328 (Duarte), UH3OD023282 (Gern), UH3OD023244 (Hipwell), UH3OD023275 (Karagas), UH3OD023268 (Weiss), UH3OD023272 (Schantz), UH3OD023337 (Wright).
Institutional Review Board Statement
Properly constituted Institutional Review Boards—either the ECHO single IRB or the ECHO cohort’s local IRB—are accountable for compliance with regulatory requirements for the ECHO-wide Cohort Data Collection Protocol at participating cohort sites. Governing IRBs review ECHO protocols and all informed consent/assent forms, HIPAA authorization forms, recruitment materials, and other relevant information prior to the initiation of any ECHO-wide Cohort Data Collection Protocol-related procedures or activities. ECHO Cohort Investigators (or their designated study personnel) obtain written informed consent or parent’s/guardian’s permission along with child assent as appropriate, for ECHO-wide Cohort Data Collection Protocol participation and for participation in their specific cohorts. The work of the ECHO Data Analysis Center is approved through the Johns Hopkins Bloomberg School of Public Health Institutional Review Board.
Informed Consent Statement
Written informed consent was obtained from participants during pregnancy and at the child’s first assessment.
Data Availability Statement
The datasets for this manuscript are not publicly available because, per the NIH-approved ECHO Data Sharing Policy, ECHO-wide data have not yet been made available to the public for review/analysis. Requests to access the datasets should be directed to the ECHO Data Analysis Center, ECHO-DAC@rti.org.
Acknowledgments
The authors wish to thank Melissa Melough; our ECHO colleagues; the medical, nursing, and program staff; and the children and families participating in the ECHO cohorts. We also acknowledge the contribution of the following ECHO program collaborators: ECHO Components—Coordinating Center: Duke Clinical Research Institute, Durham, North Carolina: Smith PB, Newby KL; Data Analysis Center: Johns Hopkins University Bloomberg School of Public Health, Baltimore, Maryland: Jacobson LP; Research Triangle Institute, Durham, North Carolina: Catellier DJ; Person-Reported Outcomes Core: Northwestern University, Evanston, Illinois: Gershon R, Cella D. ECHO Awardees and Cohorts—Memorial Hospital of Rhode Island, Providence RI: Deoni S; New York State Psychiatric Institute, New York, NY: Duarte C; University of Puerto Rico, San Jaun, PR: Canino G; Avera Health Rapid City, Rapid City, SD: Elliott A; Kaiser Permanente Northern California Division of Research, Oakland, CA: Ferrara A; Kaiser Permanente Northern California Division of Research, Oakland, CA: Croen L; University of Wisconsin, Madison WI: Gern J; Marshfield Clinic Research Institute, Marshfield, WI: Seroogy C: Bendixsen C; Henry Ford Health System:, Detroit, MI: Zoratti E; Washington University in St Louis, St Louis, MO: Rivera-Spoljaric K; University of Wisconsin, Madison, WI: Singh A; Vanderbilt University, Nashville, TN: Hartert T; University of Pittsburgh, Pittsburgh, PA: Hipwell A; Geisel School of Medicine at Dartmouth, Lebanon, NH: Karagas M; Brigham and Women’s Hospital, Boston, MA: Weiss S; Boston University Medical Center, Boston, MA: O’Connor G; Kaiser Permanente, Southern California, San Diego, CA: Zeiger R; Washington University of St. Louis, St Louis, MO: Bacharier L; University of Illinois, Beckman Institute, Urbana, IL: Schantz S; University of California, San Francisco:, San Francisco, CA: Woodruff T; Icahn School of Medicine at Mount Sinai, New York, NY: Wright R; Boston Children’s Hospital, Boston MA: Bosquet-Enlow M.
Conflicts of Interest
The authors declare no conflict of interest.
Disclaimer
The content and views expressed here are the sole responsibility of the authors and do not necessarily represent the official views of the EPA, NIEHS, NIH, or National Institute on Minority Health and Health Disparities, or Duke University.
References
- Binns, C.; Lee, M.; Low, W.Y. The long-term public health benefits of breastfeeding. Asia Pac. J. Public Health 2016, 28, 7–14. [Google Scholar] [CrossRef]
- Bartick, M.C.; Jegier, B.J.; Green, B.D.; Schwarz, E.B.; Reinhold, A.G.; Stuebe, A.M. Disparities in breastfeeding: Impact on maternal and child health outcomes and costs. J. Pediatr. 2017, 181, 49–55.e46. [Google Scholar] [CrossRef]
- González, J.; Fernández, M. Exclusive breastfeeding reduces asthma in a group of children from the Caguas municipality of Puerto Rico. Bol. Asoc. Med. Puerto Rico 2010, 102, 10–12. [Google Scholar]
- Anderson, A.K.; Damio, G.; Himmelgreen, D.A.; Peng, Y.-K.; Segura-Pérez, S.; Pérez-Escamilla, R. Social capital, acculturation, and breastfeeding initiation among Puerto Rican women in the United States. J. Hum. Lact. 2004, 20, 39–45. [Google Scholar] [CrossRef] [PubMed]
- García-Fragoso, L.; Medina, M.; Ortiz, N. Factors associated to continuing breastfeeding after returning to work in a group of mothers in Puerto Rico. Bol. De La Asoc. Med. De Puerto Rico 2012, 104, 12–15. [Google Scholar]
- Rivera-Alvarado, I.; Vázquez-García, V.; Dávila-Torres, R.R.; Parrilla-Rodríguez, A.M. Exploratory study: Breastfeeding knowledge, attitudes towards sexuality and breastfeeding, and disposition towards supporting breastfeeding in future Puerto Rican male parents. P. R. Health Sci. J. 2006, 25, 337–341. [Google Scholar]
- Gregory, J.E.; Paxton, S.J.; Brozovic, A.M. Maternal feeding practices, child eating behaviour and body mass index in preschool-aged children: A prospective analysis. Int. J. Behav. Nutr. Phys. Act. 2010, 7, 55. [Google Scholar] [CrossRef]
- Rodgers, R.F.; Paxton, S.J.; Massey, R.; Campbell, K.J.; Wertheim, E.H.; Skouteris, H.; Gibbons, K. Maternal feeding practices predict weight gain and obesogenic eating behaviors in young children: A prospective study. Int. J. Behav. Nutr. Phys. Act. 2013, 10, 24. [Google Scholar] [CrossRef]
- Ventura, A.K.; Burch, L.L. Does parenting affect children’s eating and weight status? Int. J. Behav. Nutr. Phys. Act. 2008, 5, 15. [Google Scholar] [CrossRef]
- WHO. Ten Steps to Successful Breastfeeding; World Health Organization: Geneva, Switzerland, 2018. [Google Scholar]
- Beckerman, J.P.; Slade, E.; Ventura, A.K. Maternal diet during lactation and breast-feeding practices have synergistic association with child diet at 6 years. Public Health Nutr. 2020, 23, 286–294. [Google Scholar] [CrossRef]
- Keikha, M.; Bahreynian, M.; Saleki, M.; Kelishadi, R. Macro-and micronutrients of human milk composition: Are they related to maternal diet? A comprehensive systematic review. Breastfeed. Med. 2017, 12, 517–527. [Google Scholar] [CrossRef] [PubMed]
- Danielewicz, H.; Myszczyszyn, G.; Debinska, A.; Myszkal, A.; Boznanski, A.; Hirnle, L. Diet in pregnancy-more than food. Eur. J. Pediatr. 2017, 176, 1573–1579. [Google Scholar] [CrossRef] [PubMed]
- Gorman, K.S.; McCurdy, K.; Kisler, T.; Metallinos-Katsaras, E. Maternal Strategies to Access Food Differ by Food Security Status. J. Acad. Nutr. Diet. 2017, 117, 48–57. [Google Scholar] [CrossRef] [PubMed]
- Gross, R.S.; Mendelsohn, A.L.; Arana, M.M.; Messito, M.J. Food insecurity during pregnancy and breastfeeding by low-income Hispanic mothers. Pediatrics 2019, 143, 6. [Google Scholar] [CrossRef]
- Dritsakou, K.; Massara, P.; Skourlis, N.; Liosis, G.; Skouroliakou, M. Maternal diet and breastfeeding duration of infants after NICU hospitalization in Greece: A cohort study. J. Matern.-Fetal Neonatal Med. 2017, 30, 2398–2403. [Google Scholar] [CrossRef] [PubMed]
- Gillman, M.W.; Blaisdell, C.J. Environmental influences on Child Health Outcomes, a Research Program of the National Institutes of Health. Curr. Opin. Pediatr. 2018, 30, 260–262. [Google Scholar] [CrossRef]
- Blaisdell, C.J.; Park, C.; Hanspal, M.; Roary, M.; Arteaga, S.S.; Laessig, S.; Luetkemeier, E.; Gillman, M.W. The NIH ECHO Program: Investigating how early environmental influences affect child health. Pediatr. Res. 2021, 1–2. [Google Scholar] [CrossRef] [PubMed]
- Forrest, C.B.; Blackwell, C.K.; Camargo, C.A., Jr. Advancing the Science of Children’s Positive Health in the National Institutes of Health Environmental Influences on Child Health Outcomes (ECHO) Research Program. J. Pediatr. 2018, 196, 298–300. [Google Scholar] [CrossRef]
- Dennis, C.-L.; McQueen, K. The relationship between infant-feeding outcomes and postpartum depression: A qualitative systematic review. Pediatrics 2009, 123, e736–e751. [Google Scholar] [CrossRef]
- Thompson, A.L.; Mendez, M.A.; Borja, J.B.; Adair, L.S.; Zimmer, C.R.; Bentley, M.E. Development and validation of the Infant Feeding Style Questionnaire. Appetite 2009, 53, 210–221. [Google Scholar] [CrossRef]
- Blackwell, C.K.; Tang, X.; Elliott, A.J.; Thomes, T.; Louwagie, H.; Gershon, R.; Schalet, B.D.; Cella, D. Developing a common metric for depression across adulthood: Linking PROMIS depression with the Edinburgh Postnatal Depression Scale. Psychol. Assess. 2021, 33, 610–618. [Google Scholar] [CrossRef] [PubMed]
- Cox, D. Regression models and life tables. J. Roy. Stat. Soc. Ser. B (Stat. Method) 1972, 34, 187–220. [Google Scholar] [CrossRef]
- Breslow, N.E. Discussion of the paper by D.R. Cox. J. Roy. Stat. Soc. Ser. B (Stat. Method) 1972, 34, 216–217. [Google Scholar]
- Ghali-Zinoubi, Z. On linking socioeconomic status to consumer willingness to buy and pay for organic food. J. Food Sci. Technol. 2021, 58, 1042–1050. [Google Scholar] [CrossRef]
- Foley, W.; Ward, P.; Carter, P.; Coveney, J.; Tsourtos, G.; Taylor, A. An ecological analysis of factors associated with food insecurity in South Australia, 2002–2007. Public Health Nutr. 2010, 13, 215–221. [Google Scholar] [CrossRef]
- Knueppel, D.; Demment, M.; Kaiser, L. Validation of the Household Food Insecurity Access Scale in rural Tanzania. Public Health Nutr. 2010, 13, 360–367. [Google Scholar] [CrossRef]
- Swanson, V.; Keely, A.; Denison, F.C. Does body image influence the relationship between body weight and breastfeeding maintenance in new mothers? Br. J. Health Psychol. 2017, 22, 557–576. [Google Scholar] [CrossRef]
- Morley-Hewitt, A.G.; Owen, A.L. A systematic review examining the association between female body image and the intention, initiation and duration of post-partum infant feeding methods (breastfeeding vs bottle-feeding). J. Health Psychol. 2020, 25, 207–226. [Google Scholar] [CrossRef]
- Butcher, L.M.; O’Sullivan, T.A.; Ryan, M.M.; Lo, J.; Nyanjom, J.; Wilkins, H.C.; Devine, A. To dine in or not to dine in: A comparison of food selection and preparation behaviours in those with and without food security. Health Promot. J. Aust. 2021, 32 Suppl. 2, 267–282. [Google Scholar] [CrossRef]
- Amir, L.H.; Donath, S. A systematic review of maternal obesity and breastfeeding intention, initiation and duration. BMC Pregnancy Childbirth 2007, 7, 9. [Google Scholar] [CrossRef]
- Donath, S.M.; Amir, L.H.; ALSPAC Study Team. Relationship between prenatal infant feeding intention and initiation and duration of breastfeeding: A cohort study. Acta Paediatr. 2007, 92, 352–356. [Google Scholar] [CrossRef]
- Clark, H.R.; Goyder, E.; Bissell, P.; Blank, L.; Peters, J. How do parents’ child-feeding behaviours influence child weight? Implications for childhood obesity policy. J. Public Health (Oxf.) 2007, 29, 132–141. [Google Scholar] [CrossRef] [PubMed]
- Rodgers, R.F.; O’Flynn, J.L.; Bourdeau, A.; Zimmerman, E. A biopsychosocial model of body image, disordered eating, and breastfeeding among postpartum women. Appetite 2018, 126, 163–168. [Google Scholar] [CrossRef] [PubMed]
- Zimmerman, E.; Rodgers, R.F.; O’Flynn, J.; Bourdeau, A. Weight-Related Concerns as Barriers to Exclusive Breastfeeding at 6 Months. J. Hum. Lact. 2019, 35, 284–291. [Google Scholar] [CrossRef]
- Bayol, S.A.; Farrington, S.J.; Stickland, N.C. A maternal ‘junk food’ diet in pregnancy and lactation promotes an exacerbated taste for ‘junk food’ and a greater propensity for obesity in rat offspring. Br. J. Nutr. 2007, 98, 843–851. [Google Scholar] [CrossRef] [PubMed]
- Canned Food Alliance. Telephone Survey (Landline and Mobile Numbers) of 1007 American Adults by Caravan(r) Survey, April 4–7 2013; Margin of Error +/− 3.1%; Canned Food Alliance: Pittsburgh, PA, USA, 2013. [Google Scholar]
- Barański, M.; Srednicka-Tober, D.; Volakakis, N.; Seal, C.; Sanderson, R.; Stewart, G.B.; Benbrook, C.; Biavati, B.; Markellou, E.; Giotis, C.; et al. Higher antioxidant and lower cadmium concentrations and lower incidence of pesticide residues in organically grown crops: A systematiliterature review and me-ta-analyses. Br. J. Nutr. 2014, 112, 794–811. [Google Scholar] [CrossRef]
- Brandt, K.; Leifert, C.; Sanderson, R.; Seal, C.J. Agroecosystem Management and Nutritional Quality of Plant Foods: The Case of Organic Fruits and Vegetables. Crit. Rev. Plant Sci. 2011, 30, 177–197. [Google Scholar] [CrossRef]
- Asami, D.K.; Hong, Y.J.; Barrett, D.M.; Mitchell, A.E. Comparison of the total phenolic and ascorbic acid content of freeze-dried and air-dried marionberry, strawberry, and corn grown using conventional, organic, and sustainable agricultural practices. J. Agric. Food Chem. 2003, 51, 1237–1241. [Google Scholar] [CrossRef]
- Mardali, F.; Fatahi, S.; Alinaghizadeh, M.; Kord Varkaneh, H.; Sohouli, M.H.; Shidfar, F.; Găman, M.A. Association between abnormal maternal serum levels of vitamin B12 and preeclampsia: A systematic review and meta-analysis. Nutr. Rev. 2021, 79, 518–528. [Google Scholar] [CrossRef]


Publisher’s Note: MDPI stays neutral with regard to jurisdictional claims in published maps and institutional affiliations. |
© 2022 by the authors. Licensee MDPI, Basel, Switzerland. This article is an open access article distributed under the terms and conditions of the Creative Commons Attribution (CC BY) license (https://creativecommons.org/licenses/by/4.0/).